
Reform of University Research System in Japan: Where Do They Stand?
Ryuji Shimoda
Tokyo Institute of Technology
1.
UNIVERSITY RESEARCH IN JAPAN AND ITS GOVERNMENT SUPPORT
Essential information about Japanese university research in Japan can be found in the Report on the Survey of Research and Development, Statistics Bureau, Ministry of Internal Affairs and Communications, which includes data on the natural sciences and engineering.1,2
1.1
Researchers in Universities
At the end of March 2005, Japanese universities had 291,000 researchers in all fields, including 190,000 in the natural sciences and engineering. Universities in Japan are classified into three categories: national universities founded by the central government, public universities founded by local governments, and private universities founded by private initiatives. (See Table 1.)
|
1 |
Natural sciences and engineering (Shizen-kagaku) in Japan include physical sciences, agricultural sciences, engineering and technology, mathematics and medical sciences. |
|
2 |
International comparison of research systems and university research may be found in National Science Board (2008), Chapter 4. Accessed at <http://www.nsf.gov/statistics/seind08/>. |
TABLE 1 University Researchers in Japan (as of the end of March 2005)
|
|
Total Number (Thousands of Persons) |
Natural Sciences and Engineering (Thousands of Persons) |
Social Sciences and Humanities (Thousands of Persons) |
|
National Universities |
134 |
104 |
30 |
|
Public Universities |
22 |
17 |
5 |
|
Private Universities |
135 |
70 |
65 |
|
Total |
291 |
190 |
101 |
|
SOURCE: Statistics Bureau, Ministry of Internal Affairs and Communications, Report on the Survey of Research and Development 2004, 2005. |
|||
1.2
Research Expenditure in Universities
The three types of universities differ significantly in the source of their research funding and in the emphasis of their research. (See Table 2.)
Looking at the breakdown of research expenditures, the ratio of labor costs (Jinkenhi) to the total is shown in Table 2. In the field of social sciences and humanities, the labor cost ratio was high throughout all three categories of universities. In natural sciences and engineering, the ratios in private and public universities were comparatively high, while the ratio in national universities was low. It can thus be said that national universities have the strongest presence in Japan’s university research in terms of research expenditure especially in natural sciences and engineering.
TABLE 2 Use of Research Expenditure in Universities in Japan
|
|
Total (Billions of Yen) |
Natural Sciences and Engineering (Billions of Yen) |
Social Sciences and Humanities (Billions of Yen) |
||||
|
Intramural Expenditure |
Intramural Expenditure |
Labor Cost Ratio (%) |
Self-funding Ratio (%) |
Intramural Expenditure |
Labor Cost Ratio (%) |
Self-funding Ratio (%) |
|
|
National Universities |
1,368 |
1,114 |
54.5 |
75.1 |
254 |
77.2 |
90.4 |
|
Public Universities |
188 |
137 |
70.1 |
88.8 |
51 |
85.2 |
97.7 |
|
Private Universities |
1,718 |
796 |
64.7 |
86.1 |
921 |
76. |
92.8 |
|
Total |
3,274 |
2,048 |
59.5 |
80.3 |
1,226 |
76.7 |
92.5 |
|
SOURCE: Statistics Bureau, Ministry of Internal Affairs and Communications, Report on the Survey of Research and Development 2004, 2005. |
|||||||
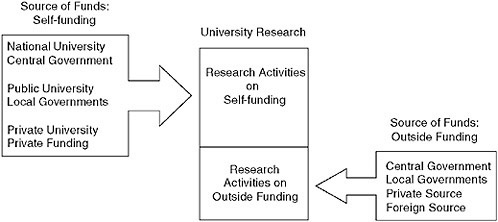
FIGURE 1 University research and its sources of funds.
1.3
Source of Funding for University Research
Figure 1 explains the general structure of research funding in Japanese universities. In the Report on the Survey of Research and Development, sources of research funding are classified into three main categories: central and local governments, the private sector, and foreign countries.3 In addition, from the point of view of performers of research, funding sources may be classified into self-funding and external funding. In these statistics, the support that national universities receive from the national government and that public universities receive local governments is classified as self-funding. For all three classes of universities, self-funding accounts for a high proportion of total funding. Research funding from the central government other than institutional funding is distributed to universities directly from the central government or via government related organizations such as funding agencies.
1.4
Government Support for University Research
How much support for research at national, public, and private universities is provided by the central and local governments? Table 3 shows the relevant figures for natural sciences and engineering. Looking at the total amount provided by the governments, it can be seen that the total has been steady since FY1998 and above the levels before FY1998. The total amount of government support for private universities has increased. The share of central and local government funding for universities in total research expenditures has been gradually declining
TABLE 3 Government Support for University Research in Natural Sciences and Engineering
|
Categories of Universities |
Fiscal Year |
Billions of Yen by Fiscal Year |
||||||||||
|
1994 |
1995 |
1996 |
1997 |
1998 |
1999 |
2000 |
2001 |
2002 |
2003 |
2004 |
||
|
National |
Central and Local Governments Support (A) |
880 |
1,015 |
990 |
992 |
1,075 |
1,065 |
1,056 |
1,053 |
1,093 |
1,070 |
1,037 |
|
Ratio of (A) to All Research Expenditure (%) |
95.1 |
95.3 |
95.2 |
94.9 |
95.6 |
95.3 |
94.9 |
94.0 |
93.6 |
93.3 |
93.1 |
|
|
Public |
Government Support |
106 |
125 |
115 |
126 |
126 |
125 |
129 |
125 |
123 |
123 |
130 |
|
Ratio (%) |
97.4 |
97.7 |
97.2 |
97.6 |
97.6 |
97.4 |
97.4 |
96.3 |
95.6 |
95.0 |
95.0 |
|
|
Private |
Government Support |
55 |
64 |
65 |
69 |
80 |
79 |
80 |
80 |
82 |
85 |
85 |
|
Ratio (%) |
804 |
9.4 |
8.9 |
9.5 |
10.6 |
10.6 |
10.7 |
10.5 |
10.6 |
10.9 |
10.7 |
|
|
Total |
Government Support |
1,041 |
1,202 |
1,170 |
1,187 |
1,281 |
1,269 |
1,265 |
1,258 |
1,298 |
1,278 |
1,253 |
|
Ratio (%) |
61.8 |
64.1 |
62.1 |
62.3 |
63.7 |
63.8 |
63.6 |
62.4 |
62.7 |
62.2 |
61.2 |
|
|
SOURCE: Statistics Bureau, Ministry of Internal Affairs and Communications, Report on the Survey of Research and Development, (various years). |
||||||||||||
for national universities and public universities. This decline is associated with a gradual increase in private funding.
1.5
Increasing Role of Outside Funding
In terms of both funding and personnel, national universities play a prominent role in university research in natural sciences and engineering, and thus in Japan’s innovation system.
Table 4 shows how funding from the central government is distributed among national universities in natural sciences and engineering. The total sum has fluctuated year by year, primarily as a result of supplementary budgets. However, when the past 10 years’ figures are observed, the amount of government support since FY1998 remained high. As to the amount of self-funding, it is hard to find a trend, though it is clear that the ratio of self-funding has been declining. This
TABLE 4 Central Government Support for National University Research in Natural Sciences and Engineering in Japan
|
Fiscal Year |
Billions of Yen by Fiscal Year |
||||||||||
|
1994 |
1995 |
1996 |
1997 |
1998 |
1999 |
2000 |
2001 |
2002 |
2003 |
2004 |
|
|
Central Government Support |
879 |
1,014 |
989 |
990 |
1,074 |
1,064 |
1,055 |
1,052 |
1,092 |
1,069 |
1,035 |
|
Of which Self-funding |
826 |
942 |
910 |
898 |
973 |
948 |
927 |
930 |
943 |
895 |
837 |
|
Ratio of Self-funding (%) |
93.9 |
92.9 |
92.0 |
90.7 |
90.6 |
89.2 |
87.9 |
88.4 |
86.4 |
83.8 |
80.8 |
|
SOURCE: Author’s calculation based on the data of Statistics Bureau, Ministry of Internal Affairs and Communications, Report on the Survey of Research and Development, (various years). |
|||||||||||
means increasing role for funding other than institutional and self-funding of central government support. It should be noted that, the effects of corporatization of national universities in FY2004 appear only in FY2004 data.
2.
POLICY BACKGROUND
The policy background to the changes in government support for university research described in Section 1 may be summarized as (i) increase of university research expenditure and government budget based on the Science and Technology (S&T) Basic plans and (ii) increasing role of competitive research funding in government-supported university research.
2.1
Science and Technology Basic Law and Science and Technology Basic Plan
The Basic Law for Science and Technology of 1995 (S&T Basic Law) is crucial in explaining the change in science and technology policy in the past decade in Japan. According to the 2004 Science and Technology White Paper, the first consideration was a relatively small size of government research funding. The ratio of government research funding to gross domestic product (GDP) in Japan in 1994 was 0.59 percent, relatively low compared with 0.88 percent in the United States. Because the burden of research funding was mainly borne by the private sector, there was concern that basic research, expected to produce seeds for the middle to long term, could be insufficient. It was also recognized that there was little research money allocated to each researcher. In addition, the deterioration of the basic research infrastructure also attracted much public attention. The ratio
of research facilitates older than 20 years to the total facilities was 50 percent in national universities and 35 percent in national laboratories. A lack of research support personnel was also perceived.
Against this background, the proposed Basic Law for S&T was submitted to the Japanese Diet (Parliament) by cross-party coalition of Diet members and, with the unanimous approval of all parties, the law was passed in November 1995. The Law states the basic principles for S&T promotion, such as harmonious development of basic research, applied research, and development. In addition, the responsibilities of the central and local governments in promoting science and technology are clearly stated. Furthermore, the Law prescribes that the central government should formulate an S&T Basic Plan that defines government measures for promoting S&T in a comprehensive and planned manner. Before formulating the S&T Basic Plan, the Government should ask formerly the Council for Science and Technology (Kagaku-gijutu-kaigi), later the Council for Science and Technology Policy (Sougou-kagaku-gijutu-kaigi), to develop its content.
2.2
Reorganization of the S&T Administration of the Central Government
In explaining the changes of science and technology policy in Japan, the reorganization of ministries and agencies of the central government is also relevant, especially the January 2001 reorganization when S&T administration underwent a dramatic change.
2.2.1
Council for Science and Technology Policy
First of all, the establishment of the Council for Science and Technology Policy (CSTP) within the Cabinet Office was an important development. The CSTP is designed to develop basic and comprehensive policy for science and technology, resource allocation and to evaluate big research projects of national importance. The CSTP consists of the prime minister as the chairperson, cabinet ministers related to science and technology policy, and prominent figures in S&T. Before the reorganization, the Council for Science and Technology (CST) within the prime minister’s office existed as an advisory body on science and technology policy to the prime minister. Except for the increased number of the council members from private and academic sectors, the basic composition of the CSTP is almost the same as that of the CST.
Compared with the CST, however, the CSTP seems to have much more influence on S&T policy formulation. For instance, the CST held plenary meetings where the prime minister was present only once or twice a year, whereas the newly established CSTP holds almost monthly plenary sessions attended by the prime minister where substantial discussion between the prime minister and the members is possible. Closeness to the prime minister means political power for the CSTP. However, because CTSP is closer to the prime minister, it is also more influenced
by the prime minister and political insiders. Science and technology policy promoted up to now by the CSTP seems to put emphasis on reform of S&T systems and on prioritization of resource allocation in line with the current prime minister's emphasis on structural reform.
2.2.2
Creation of Ministry of Education, Culture, Sports, Science and Technology (MEXT)
In January 2001, the Science and Technology Agency (STA) of the Prime Minister’s Office and Ministry of Education, Science, Sports and Culture (Monbusho) were merged to form the new Ministry of Education, Culture, Sports, Science and Technology (MEXT). Formerly, Monbusho had about a half and the STA had one quarter of the total government S&T-related budget, and both were active in S&T policy formulation and implementation; clearly, the MEXT continues these important roles in S&T administration.
Before the 2001 reorganization, universities were under the jurisdiction of Monbusho, and direct support by the STA to university research was difficult. Although research contracts were possible between national universities and affiliated research institutes and organizations under the STA, not all were implemented smoothly, and there was no systematic and institutional way of providing funding to universities from the STA. The merger of Monbusho and the STA made it possible for the programs formerly administrated by the STA to provide support to universities smoothly. From the point of government research support to universities, therefore, government reform seems to have had a positive impact.
2.3
S&T Basic Plans and S&T-related Budget
2.3.1
S&T Basic Plans
The first S&T Basic Plan covered five years from FY1996 to FY2000. The single most important point of the first plan was its commitment to increase the allocation of government resources; it aimed to allocate a total of 17 trillion yen of S&T-related budgets (Kagaku-gijutsu-kankei-keihi). This objective was achieved. A second objective was institutional reform to establish new R&D systems. The second plan covered FY2001-2005 and set an objective for government R&D investment (Seihu-kenkyuu-kaihatu-toushi) of 24 trillion yen. Other important points included a clear definition of a desirable state of nation’s future, strategic prioritization of S&T research, and S&T system reform.
The third S&T Basic Plan covers FY2006-2010. The third plan places a greater emphasis on personnel. Other items stressed in the third are continuations of the second plan, namely strategic prioritization of S&T research and S&T system reform. The target of government R&D investment (Seihu-kenkyuu-kaihatu-toushi) in the third plan is set at 25 trillion yen.
TABLE 5 Government R&D Investment (Seihu-kenkyuu-kaihatu-toushi)
Various policy measures have been taken to promote science and technology, throughout the periods of the first and second basic plans. Among those measures, particular emphasis has been placed on creating a more competitive research environment and competitive research funding (see section 2.3.4).
2.3.2
S&T-related Budget
The trends in total annual S&T-related budgets for the periods of the first and second S&T basic plans are shown in Table 5. According to this table, S&T-related budgets of central government generally have increased. In particular, S&T-related budgets from the central government have remained high since FY1998 after they enjoyed a notable increase. In terms of the budget from local governments, the data are only available for the period of the second basic plan.
During this period, the budgets from local governments declined reflecting their severe financial situations.
2.3.3
Change of University-related Budgets
Budgets from the central government for university research in the S&T-related budget is given in Table 6, based on the report of the National Institute of Science and Technology Policy (NISTEP) and Mitsubishi Research Institute (MRI) in 2005. In that report, the items in the S&T-related budget are categorized into three parts:
-
Budget items handled by the Ministry bureaus themselves.
-
Budgets for national research institutes (Kokuritu-siken-kenkyuu-kikan), special corporations (Tokushu-houjin), and independent administrative agencies (Dokuritu-gyousei-houjin).
-
Institutional support for universities including subsidies to public and private universities. (Budget items for competitive funding are not included in the third category.)
As observed in Table 6, the total university budget fluctuates year by year partly because of supplementary budgets. Nonetheless, observing data over the past ten years, its total sum has gradually increased, and its ratio to the total S&T budget has been decreasing gradually.4 Some of budget items in the first and second categories may be provided as competitive research funding as discussed in the next section.
2.3.4
Competitive Research Funding
A major policy trend in recent years has been the increasing role of competitive research funding in government support for university research. In the first basic plan, a more competitive research environment was regarded as one of the important objectives. In the second plan, this objective was quantified by establishing a target to double the budget of competitive research funding.
Actual results are shown in Table 7. In Japan, competitive research funds are defined as the research funds distributed by the following processes:
-
The organizations responsible for the distribution of funding first solicit R&D proposals;
-
A group experts then selects the best proposals of the basis of scientific and technological merit; and then,
-
Research funds are allocated to the researchers who have submitted the selected proposals.
TABLE 6 S&T-related University Budget
|
Fiscal Year |
1992 |
1993 |
1994 |
1995 |
1996 |
1997 |
1998 |
1999 |
2000 |
2001 |
2002 |
2003 |
2004 |
|
Total Amount (Billions of Yen) |
966 |
1,241 |
994 |
1,329 |
1,152 |
1,123 |
1,432 |
1,350 |
1,304 |
1,589 |
1,370 |
1,239 |
1,210 |
|
Share (%) of all S&T budget |
43.2 |
44.1 |
42.0 |
41.7 |
38.8 |
37.4 |
34.4 |
35.9 |
34.7 |
39.0 |
35.4 |
34.4 |
33.4 |
|
SOURCE: National Institute of Science and Technology Policy and Mitsubishi Research Institute, Government S&T Budget Analysis during the First and Second S&T Basic Plans. (Dai-ikki oyobi dai-niki Kagaku-Gijutu-Kihonkeikaku kikanchuu no kenkyuu-kaihatu-soushi no naiyou-bunseki). NISTEP Report No. 84, March 2005. |
|||||||||||||
TABLE 7 Budget for Competitive Research Funding
|
Fiscal Year |
1991 |
— |
1995 |
1996 |
— |
2000 |
2001 |
2002 |
2003 |
2004 |
2005 |
|
Basic Plan Period |
n.a. |
|
n.a. |
1st |
|
1st |
2nd |
2nd |
2nd |
2nd |
2nd |
|
Amount of Budget (Billions of Yen) |
78.5 |
— |
124.8 |
170.1 |
— |
296.8 |
326.3 |
345.7 |
349.0 |
360.6 |
467.2 |
|
SOURCE: National Institute of Science and Technology Policy and Mitsubishi Research Institute, Government S&T Budget Analysis during the First and Second S&T Basic Plans, (Dai-ikki oyobi dai-niki Kagaku-Gijutu-Kihonkeikaku kikanchuu no kenkyuu-kaihatu-soushi no naiyou-bunseki), NISTEP Report No. 84, March 2005. |
|||||||||||
The growth of competitive funding has resulted in increased outside funding of university research expenditures as is clearly observed in national universities.
2.3.5
Prioritization of S&T Research
In the second S&T Basic Plan, a strategic prioritization of S&T was an important task. Table 8 shows the eight main fields of S&T included in the Plan, of which four fields (life science, information and communication, environment, and nanotechnology/materials) received special priority with extra R&D resource. In contrast, in the remaining four fields (energy, production technology, social infrastructure, and frontier), the Plan states that R&D in these fields should focus on the subfields where involvement of the government is essential.
The report mentioned above (NISTEP Report No. 84 2005) gives the proportion of the total R&D budget for the priority four fields as 29.1 percent during the
TABLE 8 The Fields of S&T in the Second S&T Basic Plan
|
|
Fields |
|
Four priority fields |
Life science Information and communication Environment Nanotechnology / materials |
|
Four other fields |
Energy Production technology Social infrastructure Frontier |
period of FY1991-FY1995, 38.6 percent during the period of FY1996-FY2000 (the first plan period), and 42.1 percent during the period of FY2001-FY2004 (the second period). It is clear therefore that resource allocation has been prioritized in accordance with the Plan. Determining the exact influence of the strategic prioritization of S&T on university research is difficult because there is much room for different classification of budget items into particular research fields and because it is not clear how much of R&D budget has been allocated to universities. However, it is safe to say that university research is likely to have been influenced by the prioritization through the mechanism of competitive research funding.
2.4
Industry-University Cooperation
Another point emphasized in S&T policy in the past decade has been the promotion of cooperation between industry and universities. Because this topic is discussed in other chapters of this book, I will keep my discussion short. Various actions have been taken to facilitate industry’s utilization of intellectual property rights (IPRs) generated from university research and to help industry utilize the research capability of universities. In this context, creation, management, and utilization of university IPRs is stressed. Increasing industry funding of university research becomes government policy objective, and it has actually increased. Government also encouraged the creation of startup companies using university research.
2.5
Corporatization of National Universities
In 2004 national universities, were converted into “National University Corporations” with much greater management control. Freed from the accounting, personnel, and property rules of the central government, the national universities are better able to reform themselves to improve research effectiveness. It should be noted here that the original intention of corporatization of national universi-
ties was to help reduce the total number of national civil servants by the end of FY2003. The law incorporating the national universities was passed July 2003 and implemented only nine months later. The universities had so little time to prepare that many of the anticipated management reforms have yet to be achieved.
Speaking of the management structure of a national university corporation, the president (Gakuchou) is the head, and several directors (Riji) of the board are appointed by the president. The MEXT appoints the president of a national university corporation based on the proposal of a national university corporation which sets up president nomination committee to select a candidate. The term of office of the president is from two to six years and decided by the corporation based on the deliberation by the president nomination committee. Apart from the government controls of universities, most managerial matters used to be decided on a consensus basis by professors. However, now top-down management has become possible because the government control is no longer directly applicable and the board system has been introduced. The introduction of private enterprise management methods is also possible.
For administration, a Management Council (Keiei-Kyougikai) is generally established to deliberate important matters of management. It consists of both, university members and non-university members. In addition, an Education and Research Council (Kyouiku-Kenkyuu-Hyougikai) is established to deliberate important matters on education and research. The faculty members and staffs of a national university corporation are also no longer public employees, and strict government rules limiting taking outside part-time jobs have been lifted. It is expected that through these reforms and industry-university cooperation, talent and research results originated from universities will increasingly be fed into the industry and society.
A Mid-term Objective (Chuuki-Mokuhyou) generally guides the activities of a corporation. Presented to a corporation by the MEXT, it covers six-year term. It sets objectives concerning important matters such as the improvement of quality of education and research, improvement of administration, improvement of efficiency and financial matters, conduct of self-evaluations and promotion of information dissemination. Before finalizing the Mid-term Objective, the MEXT has to invite opinions from the corporation and to give due consideration to these opinions. A national university corporation makes a Mid-term Plan in line with the Mid-term Objective and has to receive authorization from the MEXT. Based on this Mid-term Plan, a yearly budget appropriation of administration grant (Un’eihi-Kouhu-kin) is given to the corporation by the MEXT.
In order to enhance administrative efficiency of university corporations, certain portions of budget appropriation from the MEXT are to be reduced by one percent year by year. A management effort is inevitably required by this reduction. Further, pressures are building up on national university corporations to secure funding sources other than an administration grant, for instance, competitive research funding of the government and research funding from companies.
3.
EVALUATION OF PAST DECADE AND CURRENT ISSUES
3.1
General Evaluation of the Past Decade
Looking at government support for university research over the past decade in Japan, it is evident that research expenditure provided by the government to universities has increased thanks to the S&T Basic Plans. The increase in budget helped universities improve research environment which had been deteriorated during the 1980s and early 1990s. In addition, the corporatization of national universities has given an unprecedented degree of freedom to university administration. On these grounds, government support for university research over the past decade can generally be evaluated highly.
Several important issues, however, emerge as a result of current policy directions as discussed below.
3.2
Current Issues
3.2.1
Diversity of University Research
The first issue is how to maintain the diversity in university research while the increase of competitive research funding and the strategic prioritization of S&T research are policy priorities. The increasing role of competitive funding together with the cut in institutional funding in university research could make it difficult to maintain research diversity, because the limited amount of competitive funding makes it extremely difficult for various researchers to work continuously to secure competitive funding to continue their research. In addition, except for Grand-in-Aid-for-Scientific-Research (Kagaku-kenkyuhi-hojokin or Kakenhi), all competitive funding programs invite proposals in the areas of importance for each ministry or agency based on their own policy priorities. Policy priorities are not necessarily amenable to research diversity.
A recent report5 of the Science Committee of the MEXT’s Council for Science and Technology6 (Kagakugijutu-gakujutu-singikai) points out that prioritized investment under the Basic Plans has had a great influence on science research in general. It points out, on one hand, several favorable points such as improving research results, creating a more competitive environment and promotion of industry-university cooperation. On the other hand, it also points out that there has been misunderstanding that research in the four priority fields of the Second Basic Plan has received increased funding at the expense of basic research based on the free ideas of researchers. With that in mind, it points out two policy directions:
-
To promote diversity in research; and
-
To nurture an environment where individual researchers are able to develop their full potential to the maximum extent.
The report stresses that in Japan the government provided secure fundamental or institutional appropriations to universities so that they could secure their own existence, employ the necessary personnel and create the appropriate research environment in order to raise diversified “seeds.” The report points out that with only the support of competitive funding of limited duration it is difficult to raise "seeds" of important research, and that research diversity should be protected by fundamental or institutional appropriations. How to maintain research diversity in universities is thus an important policy question posed to the central government as well as to university presidents who need to manage to guarantee research diversity in a competitive funding environment.
3.2.2
Management of Competitive Funding by Funding Agencies
The second issue concerns how effectively organizations responsible for the distribution of competitive funds are able to manage their funding processes. In order for competitive funding to be effective, it is necessary for the evaluation of proposals and distribution of funds to be properly managed. In the current Japanese competitive funding systems, the evaluation and selection of proposals has been mainly led by outside experts, while the importance of managing from the proposal stage through final evaluation of results has also been recognized.
For this purpose, program officers (POs: persons with research careers in charge of management of programs or of selection of proposals, evaluation thereof and follow-ups) and program directors (PDs: persons in senior position with research careers in charge of the management of funding systems and their operation) are appointed for each funding program inside the competitive funding agencies. Such agencies have been established as independent of (or at least not a part of) the government ministries. This is also recognized as an important policy issue, especially in the Third Basic Plan. The distribution function of competitive research funds is likely to shift further from the government to independent funding agencies. This will make it important to secure qualified POs and PDs, especially for large programs where fulltime POs and PDs are required. Such competent experts are the main foundation on which competitive research funding systems function effectively. Thus, policy needs to be implemented towards this direction.
3.2.3
Management of Competitive Funding by National University Corporations
The third issue arises from the increasing role of competitive funding and its impact on the management of universities. Competitive funding for university
research is a clear policy trend which will continue at least in the near future. Therefore, universities, especially national university corporations, have to be prepared to follow this trend.
There are various types of competitive research funds:
-
Grants-in-aid for Scientific Research (Kakenhi) are the largest in terms of its total annual budget and supports basic research via the subsidy (Hojo-kin) to researchers and/or universities.
-
Many competitive research funds are based on contract where a university performs research activities under the specific terms and conditions specified in a contract. Such terms and conditions are governed by strict government rules and regulations or similar ones of funding agencies. These regulations include that money provided under the contract should be spent solely for the fulfillment of contractual obligations, that equipment purchased under the contract should not be used for purposes other than performing contractual obligations, and that researchers have to receive approval of funding agencies in using their research results.
Concerning management, this is relatively easy for universities when a researcher receives only one source of competitive funding. However, when multiple sources are involved at the same time, proper management is essential in terms of accounting, personal management, the management of research results, and the use of equipment. This poses challenges for the management system of national university corporations, because the systems were established at the time of national universities when they were part of the government, and have been maintained to a large extent in national university corporations. This means that they are most accustomed to managing a system where most of the fund comes as institutional funding from the government with little contractual obligations.
In addition, the personnel management system is built upon the premise that most researchers are employed at institutional funding as tenured staffs, not at competitive funding as fixed-term staffs. Furthermore, researchers employed at competitive research funding from outside are treated differently in social welfare schemes within universities. There is insufficient institutional connectivity of pension and other welfare schemes between employment at competitive funding and employment at institutional funding. When research is performed concurrently by the same researcher using multiple competitive research funds, university management faces several new challenges in personnel management issues to fulfill contractual obligations, and needs to improve its function compared to the time when competitive funding was limited.
3.2.4
University Openness and Emphasis on Industry-University Cooperation and Intellectual Property Rights
The fourth issue arises from the tension between the traditional openness of university research and education, and the recent policy emphasis on industry-university cooperation and on IPRs. Recent trends include specific support from the government to universities to promote cooperation with industry and to secure IPRs from research results, and a general encouragement for universities to secure IPRs from their research and to license them to industry. It is now widely accepted that university-industry cooperation, such as licensing IPRs together with cooperative research and technology advice to industry, plays important roles in effective use by industry of IPRs originated from universities.
The result is that many cooperative relationships are being established between universities and industry. Cooperative research partly funded by industry is often performed within universities and, in some cases, commercially sensitive information from private firms may be introduced into universities. In such research, tight information management is required to secure IPRs and commercially sensitive information. The Ministry of Economy, Trade, and Industry (METI) published “a guideline for making policy for trade secret management in universities.” Industry requires that universities should properly manage important information. This is because companies are exposed to severe competition in the market, and in order to secure competitive advantage, they are eager to secure IPRs including know-how and trade secrets. On the other hand, the basic mission of universities is education and research, where an open atmosphere is generally considered essential. In addition, publication of research articles is extremely important, especially so for doctoral programs.
We therefore need to recognize that an appropriate management of IPR-related information on research not yet published and the information brought from private firms may conflict with the fundamental values of universities. According to these values, free publication of research results and openness in education and research are critical to the role of universities as a source of knowledge readily accessible by society. Universities need to properly manage these potentially conflicting interests and ensure an appropriate balance.
REFERENCES
Council for Science and Technology Policy. 2005. Report on S&T Basic Policy. (Kagaku-gijutu-kihon-seisaku-ni-tsuite ni-taisuru tousin). Council for Science and Technology Policy. December 27.
Council for Science and Technology Policy. 2003. Reform of Competitive Funding System. (Kyousouteki Sikinseido no kaikaku). Council for Science and Technology Policy. April 15.
MEXT. 2004. Annual Report on Science and Technology Promotion Measures 2004: White Paper on Science and Technology. (Heisei 16 nendo Kagaku-Gijutu Sinkou-ni-kansuru Nenji-houkoku). MEXT.
National Institute of Science and Technology Policy and Mitsubishi Research Institute. 2005. Government S&T Budget Analysis during the First and Second S&T Basic Plans. (Dai-ikki oyobi dai-niki Kagaku-Gijutu-Kihonkeikaku kikanchuu no kenkyuu-kaihatu-soushi no naiyou-bunseki). NISTEP Report No. 84. March.
National Science Board. 2008. Science and Engineering Indicators 2008. Arlington, VA: National Science Foundation.
Science Committee of the Council for Science and Technology of the Ministry of Education, Culture, Sports, Science and Technology. 2005. Sciences Policy to Support Diversity in Research. (Kenkyuu-no-tayousei wo-sasaeru Gakujutu-seisaku). October 13.
Statistics Bureau, Ministry of Internal Affairs and Communications. 2005. Report on the Survey of Research and Development 2004. Ministry of Internal Affairs and Communications.


