
6
Comparing Project Outcomes
Up to this point, the focus of this report has been on identifying the firms affected by the SBA ruling, and assigning their share of the NIH SBIR program.
The next step is to compare outcomes of SBIR awards to firms that are venture-funded and those that are not venture-funded. While the limitations of data, outlined below, preclude a precise impact assessment, a reasonable estimate of the impact of the SBA ruling on the program can be made. Nonetheless, the limitations of this impact analysis need to be kept in mind.
6.1
CAVEATS
For the following reasons, a precise analysis of outcomes from SBIR awards is not feasible.1
-
Skew in the distribution of outcomes. SBIR awards result in sales numbers that are highly skewed, with a small number of awards accounting for a very large share of the overall sales generated by the program. This is to be expected in funding early-stage technological innovation. It is also broadly consistent with the general experience of other sources of financing for early technology, (for example, by angel investors.) To avoid survey fatigue, both the NRC and NIH surveys limited the number of responses from larger firms with multiple awards. This approach, however, risks not capturing the major successes.
|
1 |
An extended discussion of many of these factors can be found in the Committee’s SBIR Methodology Report. See National Research Council, An Assessment of the Small Business Innovation Research Program—Project Methodology, Washington, DC: The National Academies Press, 2004. Access at <http://www.nap.edu/catalog.php?record_id=11097>. |
-
Selection effects. It is likely that venture-funded firms will concentrate their efforts on projects that have a high potential for commercialization rather than projects with limited markets.
-
Multiple program objectives. This statistical analysis is primarily focused on commercialization, with a strong focus on sales. However, commercialization is only one of four primary objectives for the program. Other core objectives—including the dissemination of new knowledge, support for the NIH mission, and support in particular for women and minorities, are not easily amenable to this kind of statistical analysis. NIH chooses to support projects that vary widely in terms of their commercial potential, depending on weight placed on one or another of these objectives.2
-
Limited data. Our observations and conclusions are based on limited data. For instance, we have a relatively small sample of VC-funded SBIR firms. It is also difficult for us to determine whether we have random samples of VC-funded and non-VC-funded SBIR firms. While accurate and, the Committee believes, sufficient to justify the conclusions reached, they cannot provide definitive conclusions. By definition, these data limitations also limit the reach of our conclusions.
-
Varied time lags. The limited number of data points available do not make it possible to correct for different lags in the receipt of funding and of SBIR awards, though both undoubtedly affect the commercial outcomes that result. We have made one major adjustment, limiting the study period to 1992-2002, in part specifically in order to ensure that outcomes for more recent projects surveyed closely approximate those for older ones. However, differential lag effects still exist and necessarily bias commercialization outcomes against firms with a preponderance of more recent awards.
Bearing the limitations imposed by the points reviewed above in mind, we have accumulated data primarily from the 2002 NIH Phase II Recipient Survey (and updates through 2007) and the 2005 NRC Phase II Survey.3 Together, these generated 1,105 responses from 861 firms, allowing us to draw initial conclusions from an assessment of the different outcomes from projects implemented by venture-funded and non-venture-funded firms.
6.2
RESPONDENT POOLS AND RESPONSE RATES
For assessment purposes, we divided the survey respondents into four pools:
TABLE 6-1 Responses to NIH and NRC Surveys (combined), by Venture Capital and Multiple-award Status
|
|
|
Top 200 Phase II Winners |
Others |
Total |
|
VC-funded |
Number of awards |
171 |
182 |
353 |
|
Number of responses |
42 |
73 |
115 |
|
|
Not VC-funded |
Number of awards |
980 |
1,575 |
2,555 |
|
Number of responses |
234 |
756 |
990 |
|
|
Total |
Number of awards |
1,151 |
1,757 |
2,908 |
|
Number of responses |
276 |
829 |
1,105 |
|
|
SOURCE: Awards—U.S. Small Business Administration Tech-Net Database; Responses—NRC Phase II Survey and NIH Phase II Survey and updates. |
||||
-
Firms among the top 200 NIH Phase II award winners 1992-2002, who also received sufficient venture funding to meet the de minimis conditions. (42 responses.)
-
Firms among the top 200 NIH Phase II award winners that did not receive sufficient venture funding to meet the de minimis conditions. (234 responses.)
-
Firms not among the top 200 NIH Phase II award winners 1992-2002, who also received sufficient venture funding to meet the de minimis conditions. (73 responses.)
-
Firms not among the top 200 NIH Phase II award winners that did not receive sufficient venture funding to the de minimis conditions. (756 responses.)
Recall that the de minimis conditions refer to more than one round of venture funding OR more than $5 million in venture funding. These conditions, and the number of relevant responses, are captured in Table 6-1.
Just under 10 percent of responses overall came from firms which were venture-funded. The chart summarizes the combined responses to questions about sales from SBIR-funded projects,4 from the NRC and NIH Phase II surveys.5 The data indicate that venture-funded firms responded slightly less frequently to these surveys, generating a combined response rate of 32.6 percent, as against a rate of 38.7 percent for firms without venture funding. Overall, 23 percent of responses came from firms in the top 200 award winners.
6.3
OUTCOMES FROM SURVEYS
In this section, we review outcomes in terms of two key variables—sales and additional investments—associated with projects funded by SBIR. These are metrics established in the course of the NRC SBIR assessment of NIH and other SBIR programs.6 While SBIR projects do generate other kinds of commercial return—for example licensing revenues and the ability to partner with other companies—these are not easily aggregated for statistical analysis. It is also important to recall the earlier observation that the SBIR program has other congressionally mandated objectives, which are not part of this analysis but nonetheless are important when assessing program outcomes.7
Sales
Figure 6-1 provides the most basic of all SBIR metrics: What percentage of projects has reached the market—that is, generated at least some sales. This is, as we shall see below, by no means the only metric, but it is the first clear point of differentiation so far as commercial outcomes are concerned.
Figure 6-1 shows that projects that did not receive venture funding were considerably more likely to reach the market.8 And the difference is not trivial: 38 percent of venture-funded projects reached the market, compared with 55 percent of projects at firms that were not venture-funded.
Overall, this is positive news, suggesting robust commercialization rates for both venture and non-venture-funded SBIR awardees. However, it also poses a question that should be addressed: Why do venture-funded firms commercialize at a lower rate?
Two preliminary hypotheses can be advanced to explain this outcome. First, the high level of initial commercialization for non-venture capital backed firms does not take into account the nature of the technology. Some types of research and development (for example, drug development) that offer the prospect of significant gains require large amounts of capital (often drawn from venture funding), and may also take much longer to reach the market. This would be reflected in lower commercialization rates at any given point in time (e.g., when a survey was answered).
Second, firms with venture funding may utilize SBIR for research not focused on immediate commercialization. Several executives at venture-funded firms interviewed for the NRC study of the SBIR program at NIH pointed out that the role of SBIR changed with the addition of investment funding from venture
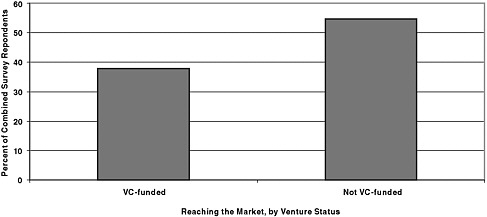
FIGURE 6-1 SBIR projects generating some sales revenue by VC investment status: VC-funded: 38 percent; Not VC-funded: 55 percent.
NOTE: N = 115 (venture-funded) and 990 (not venture-funded).
SOURCE: NRC Phase II Survey, NIH PODS database.
capitalists.9 These firms now used SBIR to fund alternative or supplementary research, or longer term and more basic research that might not otherwise be funded with the company’s core venture capital backed budget. Such projects are naturally much less likely to reach the marketplace immediately but can result in promising research that does provide alternative paths for the firm. They can also represent a leveraging of venture-funded facilities to carry out SBIR-funded research that may not have been possible in the absence of the venture funding.10
Larger Returns
The NRC’s methodology in this area goes beyond identifying projects that just reach the market: The scale of market success is also important. By including an assessment of product returns once sales have been achieved and ignoring projects that did not generate sales greater than zero, the data show that venture-funded firms tended to return larger sales than firms not funded by venture capitalists, once they reach the market.
The overall distribution is quite similar for projects from both venture-funded and not venture-funded firms, where the particular characteristics of each were
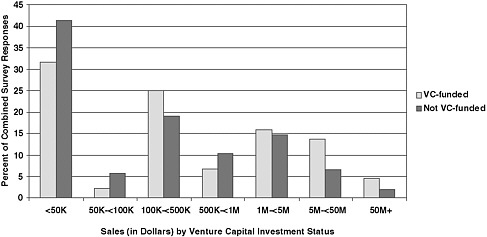
FIGURE 6-2 Distribution of sales, by venture funding.
SOURCE: NRC Phase II Survey, NIH PODS database.
NOTE: N=115 (venture-funded) and 990 (not venture-funded). This figure shows cumulative revenue for the referenced SBIR award only. It is important to bear in mind that firms usually also have other projects and other sources of revenue. For a summary of the differences between venture-funded firms and those without venture funding, see Box 1-5.
highlighted in Chapter 1. Figure 6-2 shows that few projects generate very substantial successes; most barely reach the market.
However, there is a significant difference at the upper end of the distribution. Projects from venture-funded firms are more likely to generate high returns—above $5 million in sales—while more projects from firms not funded by venture capitalists are clustered below $50,000 in total sales. More than 17 percent of projects that reported any sales at venture-funded firms generated at least $5 million in overall sales, compared with less than 10 percent at firms without venture backing. However, though interesting, the numbers are in both cases based on a sample that is too small to be used as the basis for firm conclusions. At this point, we can simply state that venture-funded firms appear to generate large winners at a higher rate.
Additional Investment
Aside from sales, a second commercialization metric used by the NRC assessment is the extent to which SBIR-funded projects have been able to leverage additional investment. Survey data on additional investment is summarized in the Table 6-2.
TABLE 6-2 Additional Investment Related to Surveyed SBIR Project
|
|
Number of Responses |
Percentages |
||
|
Venture-funded |
Not Venture-funded |
Venture-funded |
Not Venture-funded |
|
|
No |
48 |
560 |
42.9 |
49.2 |
|
Yes |
64 |
578 |
57.1 |
50.8 |
|
Total |
112 |
1,138 |
|
|
|
SOURCE: NIH PODS database, NRC Phase II Survey. |
||||
TABLE 6-3 Size of Additional Investment
|
|
Number of Responses |
Average Additional Funding ($) |
|
Venture-funded |
43 |
3,538,984 |
|
Not Venture-funded |
415 |
852,251 |
|
SOURCE: NRC Phase II Survey. |
||
It would be very surprising if venture-funded firms—which have by definition received some third-party funding—did not report more instances of such funding than firms that had not received venture funding.
The data, however, show that non-venture-funded firms were also quite successful in securing further investment for their projects, possibly through self funding, leveraging supplier contracts, and/or angel investors. Overall, just over 50 percent of non-venture-funded firms reported additional funding for the SBIR projects, compared with 57 percent of venture-funded firms reported.
Unfortunately, the NIH survey did not ask respondents to estimate the amount of additional investment generated. Results from the NRC survey only are summarized in Table 6-3.
The data show that venture-funded firms have benefited from much larger additional investments than have non-venture-funded firms. The former generated $3.55 million in additional funding per responding project reporting more than zero additional funding; the latter $0.85 million.
Other data support the view that the amounts of additional investment made by venture capital investors can be considerable. VentureSource data indicate that venture investments in firms that were also funded through the NIH SBIR program during 1992-2002 totaled more than $5.9 billion. The median total investment in each firm was approximately $25 million.11
TABLE 6-4 Amount of Venture Funding Investment in Firms Receiving Phase II SBIR Awards from NIH 1992-2002
|
|
Total |
Total Dollars |
Average Dollars (Thousands) |
|
Venture Financing Rounds |
946 |
5,937,651 |
6,277 |
|
Companies Participating in One or More Venture Rounds |
234 |
5,937,651 |
25,375 |
|
SOURCE: Thomson VentureSource. |
|||
Given the “due diligence” and strong internal reviews of venture investors, this suggests a strong outside validation of the perceived market potential of these companies, and the technologies and products they have developed.12
Knowledge Effects
While commercial results have been at the core of the argument about access to SBIR for venture funded companies, it is important to underscore that this is only one of four congressional objectives for the SBIR program. A second such objective is support for the nation’s knowledge base, and one way to measure an impact in this area is the receipt of patents. Respondents to both the NRC and NIH surveys were asked about whether they had received patents related to their work funded by SBIR.
For both surveys, responses indicate that venture-funded firms received more patents per project than did the non-venture-funded companies.13 Of course, in most cases, venture-funded firms have more resources and can, hence, afford to file more patents.
Table 6-5 presents data indicating that 45 percent of VC-funded SBIR firms generated at least one patent related to the surveyed SBIR award; the corresponding figure for non-VC-funded SBIR firms is 36.4 percent. This difference in the
TABLE 6-5 Respondents Reporting Receipt of Patents Related to SBIR-funded Projects
|
Venture Capital-funded |
Not Venture Capital-funded |
||||
|
Response |
Number |
Percent |
Response |
Number |
Percent |
|
No |
60 |
55.0 |
No |
675 |
63.6 |
|
Yes |
49 |
45.0 |
Yes |
386 |
36.4 |
|
Total |
109 |
|
Total |
1,061 |
|
propensity to patent between VC-funded and non-VC-funded firms is statistically significant at the 10 percent level (although not at the 5 percent level).14
The result that between 35 and 45 percent of all companies with SBIR awards (whether venture-funded or not) developed sufficient technical knowledge to be worth the time and expense of a patent application (and award) is impressive. The relative advantage of venture-funded firms is, however, not surprising. Venture-funded firms often have additional resources to expend on protecting their intellectual property through patenting. In some cases, venture capital companies can also provide enhanced access to important sources of expertise in patenting.
At the same time, SBIR firms that are less focused on commercial outcomes are also less likely to patent their inventions. These firms are also less likely to be supported by venture capital. Such firms tend to pull down the overall average amount of patenting by firms that are not venture-funded.
However, the overall message from the surveys is a positive one: Firms patent results from SBIR projects at a substantial rate.
6.4
FIRM-LEVEL OUTCOMES FROM HOOVER’S SMALL BUSINESS DATABASE
Partly as a cross-check on the conclusions drawn from the NRC and NIH surveys, we sought to develop an entirely different data set, based on the Hoover’s Small Business Database. Hoover’s maintains current revenue and employment data on more than 2 million U.S. firms, and has historical data on many firms that have gone out of business in recent years.
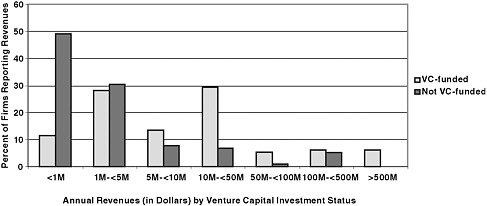
FIGURE 6-3 Distribution of annual revenues among firms, by venture status.
SOURCE: Hoover’s Small Business Database.
Given that Hoover’s database must be queried manually for each firm, we determined that this additional data set could best be constructed by examining all records for firms with venture funding, and for an equivalent sample of firms that did not received funding.
Of the 183 venture-funded firms, Hoover’s had recent revenue data on 95. We selected an additional pool of 183 firms not venture-funded as a comparison. The distribution of revenue data is captured in Figure 6-3.
Of the 183 venture-funded firms, 95 (52 percent) reported revenues through the Hoover’s database, in comparison to 118 firms (64 percent of the sample) that were not venture-funded. Given the high cost and long timeframes of research and development in biotechnology, reaching the market, at whatever scale, reflects very positively on the SBIR program and on the NIH selection process.
Revenues are a key indicator, indeed the major indicator of commercial success, and the distribution of revenues reported by Hoover’s is quite different for the two groups of firms. We can see from Figure 6-3 that firms that have not received venture investment are clustered at the lower end of the revenue distribution. Eighty percent of these firms generated less than $5 million in annual revenues, with almost 50 percent reporting less than $1 million in revenues. Although their sales still count as commercialization, firms with less than one million dollars in revenue cannot be viewed as achieving significant commercial success.
In contrast, venture-funded firms whose revenues were reported were distributed far more evenly, with a concentration among firms with $10 million to $50 million in annual revenues. Only 40 percent of firms reported less than $5 million, and 18 percent reported revenues of at least $50 million.
These data are significant. They suggest that successful venture funding is associated with considerably larger annual revenues among the firms that survive.15 SBIR firms that are venture-funded are somewhat less likely to commercialize but are much more likely to generate substantial revenues when they do commercialize than are firms that receive SBIR funds but are not venture-funded.16 This sharply different performance between venture-funded firms and those that are not venture-funded is reflected in the median revenues generated by these two groups: $9.3 million for venture-funded firms, $1.0 million for those not venture-funded—a ratio of nine to one. This strongly suggests that firms selected by venture capitalists and benefiting from those investments are substantially more successful commercially when they are successful.
6.5
CONCLUSIONS: OUTCOMES FROM SBIR FUNDING
This analysis allows us to draw a number of important conclusions.
First, venture and non-venture-funded SBIR projects both reach the market in significant proportions, but the latter reach the market in considerably greater numbers. It seems reasonable to hypothesize that venture-funded firms typically follow riskier research and thus fail more often.
Second, venture-funded firms tended to generate larger revenues when their projects did reach the market, and recorded a substantially larger percentage of “big winner” projects among those surveyed by NIH and the NRC.
Third, venture-funded firms were somewhat more likely to receive additional third-party funding related to their SBIR award. More significantly, this funding was in itself likely to be much greater than for non-venture-funded firms—almost four times as much per project.17
|
15 |
The revenues reflect current performance while the awards are from 1992-2002. |
|
16 |
The high-risk nature of investing in early-stage technology means that the SBIR program must be held to an appropriate standard when it is evaluated. While venture capitalists are a referent group, they are not directly comparable insofar as the bulk of venture capital investments occur in the later stages of firm development. SBIR awards often occur earlier in the technology development cycle than where venture funds normally invest. Nonetheless, returns on venture funding tend to show the same high skew that characterizes commercial returns on the SBIR awards. See John H. Cochrane, “The Risk and Return of Venture Capital,” op. cit. Drawing on the VentureOne database, Cochrane plots a histogram of net venture capital returns on investments that “shows an extraordinary skewness of returns. Most returns are modest, but there is a long right tail of extraordinary good returns. 15 percent of the firms that go public or are acquired give a return greater than 1,000 percent! It is also interesting how many modest returns there are. About 15 percent of returns are less than 0, and 35 percent are less than 100 percent. An IPO or acquisition is not a guarantee of a huge return. In fact, the modal or ‘most probable’ outcome is about a 25 percent return.” See also Paul A. Gompers and Josh Lerner, “Risk and Reward in Private Equity Investments: The Challenge of Performance Assessment,” Journal of Private Equity, 1(Winter):5-12, 1977. Steven D. Carden and Olive Darragh, “A Halo for Angel Investors,” The McKinsey Quarterly, 1, 2004, also show a similar skew in the distribution of returns for venture capital portfolios. |
|
17 |
See Table 6-3. |
Fourth, venture-funded firms were somewhat more likely to file for patent protection for the intellectual property developed with support from the NIH SBIR program.
Fifth, a comparison of firm-level outcomes using Hoover’s Small Business Database indicated that firm revenues for venture-funded firms were considerably higher—an average of $9.3 million annually as against $1 million for non-venture-funded firms. Venture-funded firms had a much higher concentration of firms generating at least $10 million in annual revenues.
In short, while SBIR projects at venture-funded firms do not reach the market as often as those without venture investment, other indicators suggest that, over time, venture-funded firms do commercialize more effectively than non-venture-funded firms. It appears likely that firms with SBIR projects that receive venture funding typically pursue riskier technologies and therefore these projects fail more often. When they do reach the market, they tend to generate higher value.


