
5
Ideal Attributes of a Disruptive Technology Forecasting System
One key objective of this study is to develop a forecasting approach that helps identify potential disruptions caused by technology that would have massive impact. Current methodologies for technology forecasting, such as those described in Chapter 2, are generally incapable of predicting extreme scenarios, especially those in which the most beneficial or catastrophic events occur. The committee believes that forecasters must look to the tail of the distribution curve of a technology’s probability of emergence (at the time of prediction), since it is the locus of technological developments that are usually ignored and therefore hold the potential for surprise, as can be seen in Figure 5-1.
Many disruptions emerge when seemingly unrelated resources, people, events, and technologies converge. The ubiquity of the Internet, improvements in cost-efficiency of data storage, increasing processing power, and the globalization of trade and knowledge have converged to provide the opportunity for new tools, forums, and methods that will help identify emerging disruptions. These tools may allow scenarios to be tested in new ways.
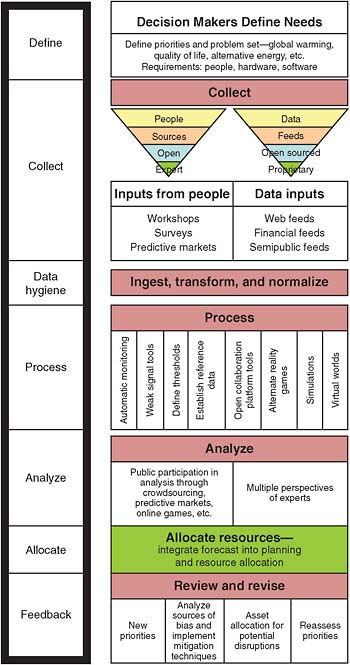
This chapter aims to give a comprehensive description of the high-level goals and system characteristics for an ideal persistent forecasting system (the process flow is illustrated in Figure 5-2). An overview of the key tenets of a forecasting system is followed by a discussion of the relevant characteristics and examples of information sources feeding the forecasting system. Given the increasing size, scale, diversity, and complexity of data sets, information processing is of paramount importance. Data must be structured in such a way that automated systems can aid human analysts in recognizing new correlations and relationships. Given multidimensional forecasting output, selecting appropriate visualization schemes can also help human analysts to process complex output more quickly and creatively. Finally, as for any complex system, using and maintaining a persistent forecasting system yields a number of postprocessing and system management considerations, described in the final section of the chapter.
TENETS OF AN IDEAL PERSISTENT FORECASTING SYSTEM
Given the breadth, complexity, and dynamism of this project, it is useful to establish desired attributes to guide the development of a persistent forecasting system. Specifically, the system should have the following attributes:
-
Persistence,
-
Openness and breadth,
-
Proactive and ongoing bias mitigation,
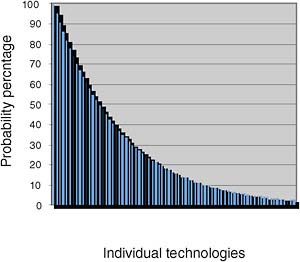
FIGURE 5-1 Probability of technology emergence.
-
Robust and dynamic structure,
-
Frames of reference for historical comparisons, and
-
Ease of use.
Persistence
Persistence is one of the most important criteria to consider when designing a system for forecasting disruptive technology. Because most existing forecasts are developed over a short and finite time, they fail to incorporate signals that emerge after their creation and are therefore usable for only a short time. A key goal of a persistent system is to continuously improve the forecast based on new data, signals, and participant input. A persistent forecast can be built to serve many different customers, providing a continuously active and up-to-date forecast.
Openness and Breadth
No single group has the human, capital, or intellectual resources to imagine every possible disruptive scenario, capture every signal, or have access to all critical data. The persistent forecasting system must therefore be open to the widest possible participation. The more broad-based the system, the more likely it will be to generate many alternative futures and more extreme versions of the future, which often predict the most disruptive outcomes.
The committee believes that the entities running a persistent forecasting system need to be transparent and partner-friendly. This will build trust and yield compelling content and incentives that encourage broad and ongoing participation from a diverse (on every vector) group of participants.
The information derived from an open, persistent, crowd-sourced forecasting system can serve as a useful starting point for other classical approaches of forecasting, which in turn produce data and information to be fed back into the open system. Some forecasting methodologies can be employed to further investigate specific areas of interest and provide a deeper understanding of scenarios used to engage a targeted group for expert opinion. This approach uses both an iterative process, in which new ideas and forecasts are generated by crowds, and concept refinement, performed by experts. This feedback approach also exploits the strengths of other methodologies.
Engage Both Crowds and Experts
Experts are typically better than novices at judging the importance of new signals in an existing forecasting system (Enis, 1995). With the currently available platforms (X2, Techcast, and Deltascan), experts generally provide high-signal and low-noise forecasts. However, academic research (Önkal et al., 2003) suggests that experts are not necessarily better at making forecasts than a crowd. Experts may not catch the full range of alternative solutions from adjacent fields outside their areas of expertise or from the reapplication of technologies developed to solve a different problem. Paradoxically, the narrowness of the knowledge specificity required to achieve expert status can invalidate forecasts generated by experts alone (Johnston, 2003). Thus, it is the committee’s belief that blending input from experts and crowds will lead to better forecasts of disruptive technologies.
The goal of public participation, or crowd sourcing, in a forecasting system is to cast a wide net that gathers a multitude of forecasts, signals, and opinions. This is especially important as technology innovation becomes more diverse and geographically diffuse in its approaches and as regional variations of technology applications flourish. Collaboration technologies, especially those that leverage the power of the Internet, can be used to discover expertise in unexpected places.1 Prediction markets, alternate reality games (ARGs), and relevant online communities are disseminating crowd-sourced methods.
Managing Noise in an Open System
Increasing the diversity of participants will increase the richness of a forecast. Nevertheless, open and public forecasting systems also present challenges to their operators. One of the challenges is the noise and distractions generated by such systems.
There are many different strategies for reducing the noise in crowd-based systems. Some systems limit participation to prescreened invitees. Screening is especially useful if a forecast seeks the opinions of a specific audience based on topic, region, or demographics (i.e., young European postdoctoral fellows studying quantum computing). Another approach is a completely open and public site, with fillers to select those with appropriate reputation, expertise, and credentials. Crowd-sourcing sites can use moderators who are themselves experts to monitor, moderate, and augment the forecasts and discussion. These moderators can be either internal staff members or volunteers from the community of users discovered through the Web.
Incentives for Contribution
It is important that a persistent forecasting system be not only open but also effective and relevant. For a system to generate enough signals and forecasts to be of value and to have adequate global representation, the operators must have a large number of diverse and active participants to cover the range of topics. This suggests that it should have adequate incentives (both financial and nonfinancial) to secure the ongoing participation of a diverse user base, to access technologically and socioeconomically impoverished contributors, and to persuade owners of proprietary data to donate (or sell) their data.
Spann and Skierra, as well as Servan-Schrieber and colleagues, suggested that the most effective incentives might be monetary or nonmonetary, depending on circumstances (Spann and Skiera, 2003; Servan-Schreiber et al., 2004). Incentives could utilize elements of gaming (competition), reputation, and financial rewards. Attention must be paid to the cultural appropriateness of the incentives used to secure reliable and valid data. Much of the world’s population resides in collectivistic and hierarchical societies, where information is much more likely to be shared with one’s own group2 than with strangers (Triandis, 1995). An in-group is made up of people sharing similar interests and attitudes, producing feelings of solidarity, community, and exclusivity.3 An out-group is made
|
1 |
Available at http://itstrategyblog.com/whats-better-crowd-sourcing-or-expert-sourcing/. Last accessed May 6, 2009. |
|
2 |
In sociology, an “in-group” is a social group for which an individual feels loyalty and respect, usually because he or she is a member , while an “out-group” is defined as a social group for which an individual feels contempt, opposition, or competition. Available at http://en.wikipedia.org/wiki/Ingroup and http://en.wikipedia.org/wiki/Outgroup_(sociology). Accessed on April 14, 2009. |
|
3 |
Available at http://dictionary.reference.com/browse/ingroup. Last accessed May 6, 2009. |
up of people outside one’s own group, who are considered to be alien.4 In collectivistic cultures, deception has been found to be more common among out-group members than in Western cultures (Triandis et al., 2001). In such cultures, financial incentives to share information might be less useful than symbolic incentives developed through contacts, with mutual commitment and obligations assured through connections within local networks.
Proactive and Ongoing Bias Mitigation
Bias in a forecast can create blind spots resulting in surprise. One way to reduce it is to continually ensure that ample data from a balanced and wide range of sources are used to create the forecast. Types of bias and techniques for bias mitigation are discussed in detail in Chapter 4.
Robust and Dynamic Structure
The world is a rapidly evolving, highly complex place with many interdependencies. This makes it difficult for decision makers to clearly define the parameters of forecasting disruption. Determining the cause and effect, as well as the precise timing, of interactions between technology and society is fraught with uncertainty as these interactions are nearly impossible to define in advance. Further, simplistic correlations are typically not useful, and the course of human events is frequently altered by unforeseen, random, and high-impact events. Therefore, the persistent forecasting system must be dynamic, flexible, and robust enough to embrace and incorporate great uncertainty, complexity, multiple perspectives, and sometimes unclear strategic imperatives.
Provisions for Historical Comparisons
Disruptions occur when trends are interrupted or when historical correlations or linkages among assets, people, or topics diverge. Looking for these disruptions requires that a system have adequate data to track historical and existing trends, as well as linkages to help users spot disruptions and discontinuities.
One useful frame of reference is to consider how disruptive technologies have developed and emerged historically. It would be useful to review the life cycle of a specific disruptive technology from concept, development, introduction, and adoption through maturity and obsolescence. Identifying key signposts, measurements of interest, and tipping points in the past would help us to recognize evolutionary patterns of development and some of the key inhibitors or enablers of disruptive technologies.
Another useful frame of reference would be to look back at the grand challenges in history and analyze how innovation and technologies were applied to overcome them. Understanding how initiatives and technologies failed to produce the kinds of disruptions originally hoped for by their creators can be just as important as understanding those that succeeded.
The system should include sufficient historical data to help researchers and forecasters to identify indicators of a disruption. Comparing such indicators against a baseline measurement of environmental and economic conditions may increase efforts to find and develop a new disruptive replacement for existing technologies. For example, understanding the threshold cost of gasoline and the necessary price performance ratio of alternative fuels and batteries would be useful for tracking a disruptive shift in propulsion systems for automobiles.
Ease of Use
To attract and maintain the broad participation of third parties, the system must have a robust set of processing and communication tools that are easy to use and accessible for partners, analysts, and participants alike. Function and ease of use for as diverse a population as possible must be designed into the system from the beginning. This should include a means for attracting users in languages other than English and a user-friendly graphical user interface.
|
4 |
Available at http://dictionary.reference.com/browse/outgroup. Last accessed May 6, 2009. |
INFORMATION COLLECTION
Understanding which data to collect or gain access to is an important step in building and maintaining a useful system. Gathering data for its own sake is neither useful nor productive and can result in information overload.
Considerations for Data Collection
Traditionally, there was a desire to collect all the necessary data over a fixed period and then to create a forecast once those data have been captured and ingested. However, this method can create epistemological bias (Faber et al., 1992) because it assumes ex ante that only a limited set of data connections and conclusions is possible. As for complex adaptive systems (CASs), it is not possible at any single point in time to identify all linkages and causalities or to model the consistent rational behavior of all the players and forces. Therefore, it is important to design a data repository that can be initialized with the relevant historical and current data sets and then populated with ongoing, real-time data collections (Jonas, 2006). This repository is used to create ongoing and on-demand forecasts.
The new forecasting system requires decision makers to have a different mental model of such a technology forecast. Instead of using a technology forecast to predict a single most likely scenario, the decision maker uses the system to understand the signals, signposts, and emerging picture of multiple alternative futures over time. Table 5-1 illustrates how the new system would compare to traditional forecasting models using a puzzle analogy.
TABLE 5-1 Puzzle Analogy
|
Type |
Traditional Forecasting |
New Forecasting |
|
Visual |
|
|
|
Analogy |
A single puzzle, pieces are known |
Multiple puzzles, pieces distributed at random, media is inconsistent, tools required are unknown, assembler is blindfolded |
|
Metaphor |
One-time disruptive forecasting |
Persistent disruptive forecasting |
|
Context |
A single best guess of a most likely future |
Multiple alternative futures |
|
Collection |
It is possible to gather all the pieces |
We don’t need all the pieces—just enough to see emerging patterns or pictures |
|
Time |
There will be time to run a dedicated processing step |
Processing must be ongoing, as we cannot anticipate disruption |


TABLE 5-2 Availability of Key Data for the Persistent Forecasting System
|
|
Readily Available |
Partially Available |
Not Available |
|
Digital |
Ingest |
Negotiate, collaborate, or create proxies |
Create proxies |
|
Nondigital |
Negotiate digital rights (when necessary); digitize or manually input into machine-readable form |
Negotiate, collaborate, or create proxies |
Create proxies |
Handling Data Overload
The cost of information collection, storage, processing, and dissemination has dropped consistently over the history of mankind. From stone engraving to cuneiform, scribes, the printing press, and now to the Internet, large data warehouses, and server farms, a society’s ability to store, process, and disseminate information has increased dramatically (Blainey, 2002). Amazon’s Elastic Compute Cloud (EC2) and Simple Storage Service (S3) and Google’s App Engine exemplify the lowered cost of information storage and processing power. According to the 2003 Berkeley SIMS study How Much Information?, approximately 5 exabytes (5 million terabytes) of new information was created in 2002.5 This is equivalent to approximately 800 megabytes per person, or 500,000 libraries the size of the U.S. Library of Congress print collection. One article estimated that Google stored just 0.02 percent of the world’s information in 2006.6
Despite continued dramatic improvements in computational power, storage, and network connection speeds, there is still too much data stored in too many locations and too many data formats with various levels of accessibility (privacy, cost, language) and fidelity to allow simply blindly loading data into a persistent forecasting system. The more complex the data correlation, the more time and computational power needed to identify relationships. A data set of size n looking for two-factor correlations could theoretically take approximately n2 computations, while a three-factor correlation would take approximately n3 computations. For example, a dataset with 1 million elements could theoretically take 1 trillion computations to analyze all of the two-factor correlations, while a process of trying to find three-factor correlations could take up to one quintillion (1018) calculations. Therefore, it is important that the data prioritization and structuring processes are done before the data are gathered.
Persistent and systematic data gathering is an essential step in assembling a persistent disruptive technology forecasting system. The good news is that the information available on the Internet grows with every passing moment. However, this suggests that the forecasting system will also need to consider data source prioritization and filters to eliminate duplicative or less relevant sources. Further, it is important to complement online data extraction with classical methods of information collection to supplement and validate online data in an efficient and judicious manner.
Collection Limitations
Some pieces of information critical to the persistent forecasting system may be in a format not easily extractable or translatable, may be proprietary, or may not be available electronically or at all, as shown in Table 5-2. The operators of the persistent forecasting system should, accordingly, be creative in improving the accessibility of viscous data or in creating proxies (substituted information sources) where data are not otherwise available.
Depending exclusively on digital data collections is not sufficient. Indeed, a significant portion of the world’s population remains offline, for reasons including poverty, lack of electronic accessibility, legacy systems, or a desire to remain anonymous. As a result, classic data-gathering techniques such as workshops, article reviews, document collection, and first-hand interviews or reporting are still critical. These efforts should be pursued on a cost-effective basis to serve areas where there is a known lack of information, a need for bias mitigation, or when scope broadening is required.
|
5 |
A 3-year study started in 2008 to determine how much information there is in the world is being undertaken at the Global Information Industry Center at the University of California, San Diego. Available at http://hmi.ucsd.edu/howmuchinfo.php. Last accessed May 6, 2009. |
|
6 |
Available at http://www.knowledgebid.com/media/blog/google-225b-and-02-percent/. Last accessed October 23, 2008. |
There are any number of reasons why data might be only partially available, including rights to use, fees, language, format, digital or analog, and matters of privacy and ownership. The operators of a persistent forecasting system should consider a number of ways to access partially available data. When relevant data are in a foreign language, operators might consider employing context and translation tools or use crowd-sourcing techniques to translate. Translation tools, while not perfect, continue to improve, making data in foreign languages more available. The quality of existing commercial and open source extract, transform, and load (ETL) tools continues to improve, making it increasingly possible to extract information from different (particularly unstructured data) formats. In other cases, it might be possible to negotiate better terms for commercial databases or to create or join open collaboration communities. Finally, it may be necessary to digitize and manually enter data if it is not already available in electronic form.
It is anticipated that there will be a number of subject areas where information is not readily accessible, probably owing to gaps in coverage. Statistical analysis might show which certain regions of the globe systematically report less information than expected. It is anticipated that there will be similar underreporting for technologies that show promise but for which there remains insufficient publicly available information. In other cases, it may be impossible to find or access the data for reasons of confidentiality or other factors. In these situations, the persistent forecasting system operators should consider utilizing proxies. For instance, the pricing of certain key raw materials may not be publicly available. In this situation, it may be necessary to negotiate with the supplier(s) of that raw material for access to information. Failing that, operators of the persistent forecasting system might consider creating a proxy consisting of key production inputs of the raw material, collaboration communities, or predictive networks.
Key Characteristics of Information Sources
In selecting information sources to use in a persistent forecasting system, the operator must first ask whether the data have the following characteristics (sources that score above average in several characteristics may be more useful than those that score very high in only one or two characteristics):
-
Can be evaluated anywhere,
-
Updated regularly,
-
Relevant,
-
Quantifiable,
-
Sources are accurate and attributed, and
-
Source has a good reputation.
Jonas points out that data warehouse operators must keep track of data source characteristics, but should be careful to not exclude data because of poor quality characteristics.7 Changes in the quality of information and the emergence of new data sources may in and of themselves be a sign of pending disruption.
Globally Evaluable
An inherent requirement for the persistent disruptive forecasting system contemplated by this report is the ability to evaluate information on a global basis, making it important that the information gathered be globally sourced. A quantitative measurement of this characteristic would be a chi-squared distribution ranking the amount of information created by a country in comparison to a number of factors including but not limited to that country’s overall population, its university population, gross domestic product (GDP), number of patent applications, published scientific papers, and R&D investment.
|
7 |
Personal communication with Jeff Jonas, Chief Scientist of the IBM Entity Analytics group and an IBM Distinguished Engineer. See information available at http://www.research.ibm.com/theworldin2050/bios-Jonas.shtml. Last accessed May 6, 2009. |
Regularly Updated
To forecast persistently, continuous sources of new information are necessary. In general, data may be persistently or periodically available or available once only. A data set collected once is less useful than a data set that will continue to be generated over time. Such persistence will allow for the data to be tracked, evaluated, and trended over time. The persistence of an information source would be measured as the standard deviation of quantity or the value of data sets created year by year.
Comparative Relevance
Relevance is difficult to determine, particularly when attempting to forecast future events that are disruptive in nature. It must be thought of as a relative measure for allocating scarce analytical capabilities. It is a challenging issue because some of the best signals are those not likely to be viewed as acceptable or mainstream. Nevertheless, one potential measure of relevance is how it affects a potentially disruptive technology, directly or indirectly.
Comparative Quantifiablilty
Given the massive amount of data that exists and the ever-growing number of tools and methods for analyzing the world around us, there are few realms that are not quantifiable. This characteristic, similar to relevance, must be used relatively. For example, use of the words “semipermeable membranes are important” by a single writer is not quantifiable. However, an increase in the number of writers using those words, from 1,750 in 2009 to 2,000 writers in 2010 in a community of 20,000 experts, could be a very useful quantitative measure.
Accurate and Attributed Sources
When gauging the accuracy of a source, it is important to ascertain where the data in the source came from. Anonymous information may be correct, useful, and valid, but care must be taken to ensure that it is not deliberately misleading. There are also cases where a large number of sources agree but are incorrect (e.g., observations of the Loch Ness monster). The accuracy of the data from a source can be measured by understanding the basic attributes of the source and tracking its output over time to determine if the earliest data were correct.
Source Reputation
One measure of a source’s trustworthiness is its reputation. Reputation can be assessed by examining the number of times information from a source is cited in other credible works. Google’s PageRank is based on the principle of citation analysis,8 which is not, however, perfect. If it is not applied appropriately, citation analysis can be biased, perpetuating current thinking and conventional wisdom. Openness, peer review, and certification by a trusted third party are also important to minimize bias and engender trust in a forecasting system. An information source should be considered more trustworthy if it allows outsiders to challenge and review its methodology for collection, data hygiene, and management.
Potential Sources of Information
There are many sources of potentially useful data available to the public. They include the Beige Book,9 government reports from around the world, and other reports issued by nongovernmental organizations (NGOs),
|
8 |
More information available at http://en.wikipedia.org/wiki/Bibliometrics. Last accessed May 6, 2009. |
|
9 |
The Summary of Commentary on Current Economic Conditions, commonly known as the Beige Book, is published eight times per year. Each of the 12 Federal Reserve Banks gathers anecdotal information on current economic conditions in its district from the reports of Bank and Branch directors and interviews with key business contacts, economists, market experts, and other sources. The Beige Book summarizes this information by district and sector. Available at http://www.federalreserve.gov/fomc/beigebook/2009/. Last accessed August 10, 2009. |
TABLE 5-3 Questions Posed to Data Sources at Different Phases of Inspection
|
Phase 1 Questions |
Phase 2 Questions |
|
Is this field currently experiencing disruption? |
Who stands to gain and who is the most at risk should a disruption occur? |
|
Who is gaining in the field and who is being displaced? |
|
|
Could technology play a role in disrupting this field? |
|
|
Which factors are driving this disruption? |
|
|
Are technology investments being made that target this field? If so, |
|
|
Which disruptive technology (if any) is enabling this disruption? Which can be used to mitigate or amplify the disruption? |
|
|
|
|
Which new phrases, terms, or other indicators are associated with this disruptive technology and disruptive field? |
research organizations, corporations, trade organizations, universities, open source consortiums, online S&T repositories, and S&T Web sites. Given the broad range of technologies that are the focus of this report and the need to anticipate disruptive technologies and events, including those that might be considered to have a low probability of occurrence but high potential impact, it is essential that collectors maximize their collection resources effectively, utilizing traditional as well as more novel sources of data.
Furthermore, information must be gathered with an eye to answering two similar yet distinct questions: (1) How do you identify fields that are being disrupted as well as fields that could be prone to disruption (Phase 1 question)? (2) How do you monitor how far those fields have progressed toward disruption (Phase 2 question)? Some of the questions that might be posed to these data sources are listed in Table 5-3.
The information sources described in the remainder of this section may be of interest and could be useful to a disruptive technology forecasting system.
Trade Associations and Magazines
According to Wikipedia, there are over 7,600 trade associations in the United States.10 Las Vegas, Nevada, is estimated to have hosted at least 624 trade shows in 2008, with over 2,000,000 total attendees.11 If each trade association generated just one piece of searchable literature outlining market and technological trends, together they would constitute a robust source of information. Further, as trade associations are an outcome of broad, industry-wide initiatives, they tend to present information in a manner that is particularly well suited to the goals of a persistent forecast.
Universities and Cooperative Research Centers
The 1,150 accredited colleges and universities in the United States collectively educate almost 5,000,000 students per year.12 The National Science Foundation has sponsored 71 industry and university Cooperative
|
10 |
Available at http://en.wikipedia.org/wiki/Industry_trade_group#cite_note-0. Last accessed October 23, 2008. |
|
11 |
Count of calendar events as of August 1, 2008, from the Las Vegas Tourism Bureau Web site. Available at http://www.lasvegastourism.com/index.html. Last accessed October 23, 2008. |
|
12 |
Available at http://www.aacu.org/about/index.cfm. Last accessed October 24, 2008. |
Research Centers, 47 of which remain active.13 These centers foster collaboration between universities and industry. To monitor and understand the inner workings of these research centers would require a significant, but not extraordinary, amount of work and configuration during the initial construction stages of a persistent forecasting system. It is imperative to gather information about universities and centers of excellence because they are hubs for many global technology clusters.
A simple understanding of college and university graduation rates would provide insight into areas of growing importance. Another approach is to track the number of times a program or facility is referred to on the Internet.14 Most universities and colleges throughout the world post information about their institutions on the World Wide Web. Braintrack.com, an online directory of the world’s universities and colleges, lists and provides links to more than 10,000 universities in 194 countries. Similar support should be made available for institutions carrying out research in disruptive technologies.
Academic Papers
Nearly 3 million scientific papers were published in the United States across all fields between 1996 and 2006.15 Worldwide, this number was nearly 8 million over the same time period, resulting in 800,000 papers per year that could be analyzed and incorporated in a persistent system. Using Zipf’s law or other power-law distributions of paper citations, it should be possible to observe how the importance of a paper changes as references to it increase over time (Gupta et al., 2005).
Financial Data
There is no shortage of financial information. Financial data are so pervasive that many novel methods of finance are back-tested and applied to historical financial information, such as cotton prices in the 1800s, rather than tested using current information (Mandelbrot, 1963). The total value of all globally traded public securities is estimated to be $51 trillion.16 The United States alone has over 17,000 public companies.17 Each of these public companies produces detailed quarterly financial reports and public disclosure statements, as well as significant amounts of data on pricing and volume of trades.
Public equities are not the exclusive source of potentially valuable information; unlisted securities may hold more information if it is available. The National Venture Capital Association says that $7.4 billion was invested in early stage companies through 977 transactions during the second quarter of 2008 alone.18 Similar information is available on European and Australasian venture capital from the European Private Equity and Private Venture Capital Association and the Australian Private Equity and Venture Capital Association. However, as is the case with public securities, financial information on private/venture capital is more easily gathered on domestic than on overseas markets.19
Commercial Databases
There are many commercially available databases. One example is ProQuest, which has archived and made searchable over 125 billion digital pages of information and works with over 700 universities to distribute over 60,000 dissertations and theses a year on their online database. Questia allows access to over 2 million books, articles, and journals, while competitor HighBeam Research has over 60 million peer-reviewed papers represent-
|
13 |
Available at http://www.nsf.gov/eng/iip/iucrc/directory/index.jsp. Last accessed October 24, 2008. |
|
14 |
International Colleges and Universities is a Web site that lists 8,750 accredited colleges and universities around the world and ranks the top 200 based on Internet references. Available at http://www.4icu.org/. Last accessed May 6, 2009. |
|
15 |
Available at www.thomson.com. Last accessed November 11, 2008. |
|
16 |
As of August 18, 2008. Available at http://en.wikipedia.org/wiki/Stock_market. Last accessed October 24, 2008. |
|
17 |
Available at http://answers.google.com/answers/threadview?id=543247. Last accessed October 24, 2008. |
|
18 |
Available at www.nvca.org. Last accessed October 23, 2008. |
|
19 |
Available at http://www.evca.eu/ and http://www.avcal.com.au/. Last accessed October 24, 2008. |
ing over 3,500 publications, 1,500 of which are academic. There is no shortage of associations and organizations that make their own materials publicly available: the Journal of the American Medical Association (JAMA), the British Medical Journal (BMJ), and the U.S. Patent and Trademark Office all have searchable online databases, as do countless others. While the ability to immediately tap into large databases is a great asset, it does have one glaring deficiency—the bulk of online publications are in English. Although non-English databases exist, most notably at China.Eastview.com, foreign language listings are smaller and scarcer than holdings in English. Although English is currently the primary language of scientific publication, the committee believes focusing exclusively on data holdings in English would introduce additional bias and lead to missed opportunities.
Blogs
Blogs are the social postings of individuals. As blogs have grown in sophistication, the difference between the page of a news organization and the page of a regular and sophisticated blogger has become less clear. While counting the members of the blogosphere was long an important measure of the Web’s vibrancy, such counting efforts appear to have decreased over the past year as the medium’s growth soared, making the task much more difficult. The most commonly referenced measure is provided by Technorati; its most recent assessment, posted in 2007, indicated it was tracking 112 million blogs.20 A large and diverse data set could be created from the content of these blogs.
Blogs are as important as other written records like books, magazines, or even graffiti because they allow researchers to access the impressions of others. There are problems with blogs, such as false reporting, but these are biases that can be accounted for. Further, the fact that they are published online allows them to be electronically gathered, searched, and analyzed.
Crowd-Sourced Content
Much online crowd-sourced information could be useful to analyze. The best known example is Wikipedia, which is estimated to have taken 100 million hours of thought to achieve its current state (Shirkyon, 2008). Wikipedia has over 75,000 contributors, who together have created over 10,000,000 articles in over 250 languages. Nearly one quarter of these articles are in English.21
Social Networks
Social networks allow us to observe the relationships between members and to observe how members self-classify. Currently, Facebook has 200 million active users and is the fourth most visited site on the Web.22 It is also the largest photo sharing application. There are 55,000 communities within Facebook, representing different schools, regions, workplaces, and other groups.23 Other social networks include MySpace, which attracts 115 million international users,24 and LinkedIn, a career-oriented site with over 16 million users.25 Xiaonei has 34 million Chinese users26 and 51.com has 26 million Chinese users.
|
20 |
Available at http://technorati.com/. Last accessed August 1, 2008. |
|
21 |
Available at http://en.wikipedia.org/wiki/Wikipedia:About. Last accessed October 24, 2008. |
|
22 |
Available at http://www.facebook.com/press/info.php?statistics. Last accessed May 6, 2009. |
|
23 |
Available at http://www.facebook.com/press/info.php?statistics. Last accessed October 24, 2008. |
|
24 |
Available at http://www.techcrunch.com/2008/06/12/facebook-no-longer-the-second-largest-social-network/. Last accessed May 6, 2009. |
|
25 |
Available at http://venturebeat.com/2007/12/09/linkedin-launches-platform-redesign-a-better-business-social-network/. Last accessed May 6, 2009. |
|
26 |
Available at http://www.socialnetworkingwatch.com/international-social-netw.html. Last accessed May 6, 2009. |
Patents
Patents are a potentially interesting source of information. Since 1836, the U.S. government has issued more than 6,500,000 patents. Roughly 300,000 patents are filed in this country each year. Moreover, patents are a global phenomenon, with Japan regularly topping the United States in the number of global applications and the United Kingdom, Germany, and other European Union countries often applying for more than 200,000 patents annually.27
Despite the potential promise, the committee recognizes that patent filings and patent awards have weak correlations. Today, many companies rush to patent innovations that may not result in success, and it is estimated that companies use less than 2 percent of the patents that they file. Also, given the slow speed of patent issuances relative to the speed with which disruptive venture-backed technologies are adopted, many companies become wildly successful before patents are actually issued, if they are issued at all. Nevertheless, analysis of patent applications can reveal trends, patterns, clusters, and novel applications of technologies.
Cross-Cultural Data Collection
Collecting data from different cultures is by no means straightforward, and the potential for injecting bias into the data and the resulting forecast is significant. Some techniques for successfully gathering information as well as some concerns about cross-cultural data collection are discussed below.
Surveys
Surveys are frequently used to collect data on potentially disruptive technologies in different cultures. Yet challenges to cross-cultural surveys abound, including the difficulty of motivating people to engage in such surveys, making survey instructions understandable, and measuring the validity and reliability of responses.
For example, while surveys are popular for assessing attitudes in this country (Kuechler, 1998), asking individuals to fill out questionnaires is not as familiar or appropriate elsewhere. Several characteristics of U.S. culture coincide with the requirements of the individual survey methodology, including the emphasis on individualism, freedom of speech as a basic right of all citizens, high literacy rates, the willingness of individuals to participate, comfort with expressing opinions, and familiarity with the testing format.
Clearly, not all cultures have these characteristics (Kuechler, 1998; Greenfield, 1997). It may be necessary for the researcher to adapt the survey instrument for each culture so that it is appropriate and comprehensible for members of that society. Pilot testing and discussion with local collaborators are critical to ensuring that a particular method is appropriate for other cultures.
Interviews and Focus Groups
Interviews and focus groups enable researchers to gain depth of knowledge on a particular topic. However, difficulties may arise in standardizing interviews across cultures. The characteristics of an effective interviewer might vary across cultures—for example, women interviewing men could be viewed as inappropriate, and ignorance of this taboo could invalidate interview results. Pareek and Rao (1980) argue that the background of an interviewer be considered to elicit genuine and unbiased answers from respondents. The background of an interviewer can influence rapport and cause the interviewee to self-disclose more or less, depending upon his or her comfort with the interviewer. In Günther’s research with international families in Saudi Arabia (1998), months of relationship-building with local collaborators and government officials were necessary to gain access to families in the community. This example points to the importance of cultural sensitivity and good relationships when working in other cultures.
|
27 |
Available at http://data.un.org/Default.aspx. Last accessed August 1, 2008. |
Cultural Documents
Cultural documents, including newspapers, speeches, and proverbs, provide useful and unobtrusive cross-cultural data for analysis. For example, Weber and colleagues (1998) analyzed historical proverbs to understand the psychology of risk in other cultures. When analyzing the content of such documents, researchers should ask local collaborators to assist with taxonomy and to identify the documents most relevant to the research topic. This would ensure the comparability of documents across cultures and aid in the development of coding schemes that produce reliable and valid results for a culturally diverse data set.
Observations of Behavior
Simple observations of behavior provide another unobtrusive method for collecting cross-cultural data. Researchers should confer with local collaborators to ensure that the observation is interpreted properly.
Databases
Existing cross-cultural databases may also contain useful data, but they need to be examined with care. Such databases may label, structure, categorize, or assess constructs differently than databases gathered at home in the United States, and their measurements may be biased. In such cases, there may be no existing data dictionary with which to associate related content. Taxonomies will need to be created to assist extraction, transformation, and loading (ETL) tools to produce useful data ready for processing.
Data Preprocessing
One of the biggest challenges for the operators of the persistent forecasting system will be translating data from multiple sources into a single format that permits analytical and visualization tools to mash up data sets and adjust parameters seamlessly. Data feeds will need to be ingested, transformed, and then normalized before further processing and decision making can occur.
Data Organization
There are two principal methods for organizing large data sets: relational databases (RDBs) and the resource description frameworks (RDFs). Both have their place in any large data-processing project; however, implementation of RDF could prove particularly valuable to a persistent forecasting project because the data sources and formats tend to be more heterogeneous and dynamic:
-
RDB. These fit the static model that has most often been followed in past forecasting efforts. Data are defined in set fields, assembled in tables, and relationships described using a relational model termed a schema. Business analytic tools are then used for identifying correlations between objects and their descriptive fields. RDBs have been in use since the early 1970s. Their principal advantages are that they are well known, well understood, commonly accepted, well supported by analytical tools, and have large populations of professionals experienced in their construction and operation. Unfortunately, they may be slow in their analysis and require a significant amount of description, structuring, and coaching to fully realize their benefits. Once structured, RDBs are a fast, efficient, and effective way to manage large structured databases.
-
RDF. This is a novel approach to database management that evolved from the meta content framework (MCF) originally pioneered at Apple Computer in the mid-1990s.28 Joshua Tauberer (2008) describes RDF as
|
28 |
Available at http://en.wikipedia.org/wiki/Meta_Content_Framework. Last accessed October 23, 2008. |
-
the standard for encoding metadata and other knowledge on the Semantic Web. In the Semantic Web, computer applications make use of structured information spread in a distributed and decentralized way throughout the current web.
The Semantic Web is a decentralized framework for distributed information. RDF is the World Wide Web Consortium’s standard for encoding this information.29 The main architecture behind RDF is the concept of the “triple,” the relationship between the subject, predicate (verb), and object of a clause. Because the RDF protocol is more straightforward and requires less structuring than that of the RDB, it can be learned and processed more quickly by automated systems.30 Although newer than RDB, RDF is a proven technology. The University of Maryland’s T-REX (The RDF EXtractor) has already processed 32.3 million articles and processes up to 150,000 additional articles per day (Subrahmanian, 2008).
Processing Unstructured Data
It has been estimated that 80 to 90 percent of all potentially usable business information originates in unstructured form.31 Similarly, the World Wide Web is primarily made up of unstructured data. Unstructured data are data that do not conform to a data model and are therefore not easily manipulated by computers. Wikis, Web pages, and blogs are generally unstructured.
There are several techniques that can be used to analyze and index unstructured data, including text data mining, text analytics, and link analysis. Many of these approaches use statistical methods such as latent semantic indexing (LSI) and Bayesian modeling, and some require training sets and taxonomies to increase their accuracy. Domain-specific ontologies32 can be created to reduce semantic inconsistency. Database managers are developing schemata to electronically extract, transform, and load unstructured and narrative data into their datamarts.33 Many companies now use a range of technologies to process unstructured data.
Companies like Google, IBM (Webfountain34), and Microsoft (Bing) have built automated systems to ingest billions of Web pages (including wikis and financial data) of unstructured data several times a day. These systems process information included in key content tags and attribute lists. Companies like Technorati use tags that bloggers and other content authors place on their Web sites and, with the help of categorization technologies, index millions of blog posts in real time and can recall them in seconds using headlines and tag clouds.35
Factiva, a division of Dow Jones & Company, produces tools and resources for search, semantic analysis, and controlled vocabularies that access more than 25,000 authoritative sources36 (such as newspapers, journals, magazines, news and radio program transcripts) from 152 countries in 22 languages, including more than 120 continuously updated newswires.37
Text analytic companies such as ClearForest provide text analysis and data mining technologies designed to convert unstructured data into structured data. ClearForest tags key concepts hidden in unstructured text. Once tagged, this information can be entered into structured databases and used to identify trends, patterns, and complex interdocument relationships within large text collections and create links with other structured data.
Attensity has developed a suite of commercial applications that combine natural language processing and semantic technologies to transform natural language into structured data. They combine statistical methods and
|
29 |
Available at www.xml.com/pub/a/2001/01/24/rdf.html. Last accessed May 6, 2009. |
|
30 |
Available at http://en.wikipedia.org/wiki/Resource_Description_Framework. Last accessed October 23, 2008. |
|
31 |
Clarabridge, 2008, unstructured data and the 80 Percent rule, Bridgepoints (23). |
|
32 |
An ontology is a formal representation of a set of shared concepts within a domain and the relationships between those concepts. Available at http://en.wikipedia.org/wiki/Ontology_(information_science). Last accessed July 19, 2009. |
|
33 |
Available at http://www.dbazine.com/datawarehouse/dw-articles/lewis4. Last accessed July 16, 2009. |
|
34 |
Available at http://en.wikipedia.org/wiki/IBM_WebFountain. Last accessed July 16, 2009. |
|
35 |
Tag clouds are visual presentations of tags, in which the size, weight, or color of the tag can be used to represent features (e.g., frequency, importance, sentiment) of the associated terms. Available at http://en.wikipedia.org/wiki/Tag_cloud#cite_note-0. Last accessed July 19, 2009. |
|
36 |
Available at http://factiva.com/about/index.asp?node=menuElem1098. Last accessed July 16, 2009. |
|
37 |
Available at http://en.wikipedia.org/wiki/Factiva. Last accessed July 16, 2009. |
technologies (including keywords, classification, clustering, categorization, machine-learning, case-based reasoning, name entity recognition, language identification, event and relationship extraction, and artificial intelligence) with linguistics methods and technologies (such as exhaustive extraction, advanced pattern recognition, and the Semantic Web) for the discovery, management, and analysis of unstructured data.38
Wolfram|Alpha, a new knowledge engine, uses a hybrid approach depending on computation to access and process trillions of pieces of curated information. It blends supercomputer computation, human curation, and directed modeling.
By using text analytic and semantic technologies, a forecasting system can electronically “crawl” and index millions of pages of unstructured text from targeted Web sites, blogs, wikis, scientific and technical papers, and published works. The committee believes that appropriate scientific and technology ontologies can be created to help reduce semantic inconsistency between bodies of unstructured text collections. These texts can then be analyzed to highlight the appearance of new scientific and technical concepts, the emergence of new applications, and changes in sentiment that can be used as disruptive technology forecasting signals.
The committee believes that employing crowd sourcing in a forecasting system requires a method for structuring vocabulary in order for the system to convey meaning and to facilitate conversations across a diverse group of users. This is also important to enable computers to more easily process, organize, and retrieve unstructured portions (e.g., blogs, wikis, tweets,39 and user comments) of the data. One approach is to use a “controlled vocabulary,” a common and generally agreed upon task-specific list of words, phrases, and acronyms to describe or tag text, images, and objects. Controlled vocabularies are used in subject indexing schemes, subject headings, taxonomies, thesauri, and ontologies.
Semantic Web technologies address the need for controlled vocabularies. The Semantic Web is an evolving development of the World Wide Web in which the semantics of information and services on the Web are defined, making it possible for requests of people and machines that use Web content to be easily understood and satisfied.40 A forecasting system that incorporates crowd casting and relies on unstructured Web-based input should incorporate Semantic Web technologies.
The Semantic Web standard RDF and RDF Schema provide the infrastructure for making vocabularies available as resources on the Web for anyone to reference and use. RDF is a language for representing information about resources on the World Wide Web. It is intended for use where information needs to be processed by applications rather than being displayed only to users.41 RDF employs an established system for global naming, the uniform resource identifier (URI), which is in current use on the Web.42
INFORMATION PROCESSING
When seeking the reason a person or group of persons failed to foresee a particular catastrophic event, such as the terrorist attacks of September 11 or the collapse in 2008 of the Lehman Brothers financial services firm, it often turns out that all of the necessary information was available but that larger patterns and conclusions were missed by the time a subset of that information had been processed and passed on to key decision makers. Appropriate and intelligent processing of multiple information streams (as described in the preceding section) is essential for accurate forecasting.
Operators of pervasive forecasting systems require a set of processes to ensure that only relevant and useful information is presented and that aggressive efforts are made to organize and present information in a way that improves human cognitive processing capabilities. The challenge is to determine which tools and methods can be used to identify disruptions.
|
38 |
Available at http://www.attensity.com/en/Technology/Semantic-Engines.html. Last accessed July 19, 2009. |
|
39 |
Tweets are 140-character text posts used by the Twitter microblogging service. |
|
40 |
Available at http://en.wikipedia.org/wiki/Semantic_Web. Last accessed July 17, 2009. |
|
41 |
Available at http://www.w3.org/TR/REC-rdf-syntax/. Last accessed July 17, 2009. |
|
42 |
Available at http://www.semanticuniverse.com/topquadrant-monthly-column/group-blog-entry-semantic-web-key-enabler-enterprise-vo-cabulary-management. Last accessed July 17, 2009. |
Trends to Track
An understanding of complex systems is critical for forecasting disrupting technologies. In general, complex system behavior is determined by the interaction of agents among themselves (either dampening or reinforcing connections) or by their response to an external stimulus. The agents in a forecasting system are humans from around the globe. Tracking emerging trends, abnormal behaviors, or catalytic events (such as September 11, 2001) that take place in a variety of scientific, natural, and social systems is a key requirement.
Systems theory is the interdisciplinary study of complex systems in science, nature, and society.43 While many factors ultimately contribute to disruptions, the committee believes that because at least one, if not all three, complex systems are present in most disruptive technologies, the ideal forecasting system should, at a minimum, incorporate robust scanning and monitoring methodologies to detect variations in the rate of change for the following:
-
Science and technology discovery,
-
Trends in nature, and
-
Societal trends (including economics, law, policy, and the arts).
Science and Technology Discoveries
It is critical that a persistent forecasting system track research and investment breakthroughs, progress in science and technology, and S&T applications. According to Peter Schwartz in The Art of the Long View (1991, p. 62), S&T discovery
is one of the single most important drivers of future events. It literally shapes the future. Politics can change, but a scientific innovation, once released into the world, cannot be taken back. Nor can its impact be legislated away or forbidden by the chairman of the board. Thus keeping track of new developments in physics, biotechnology, computer science, ecology, microbiology, engineering and other key areas is a special duty.
A significant portion of S&T research and development is in the public domain and is quickly becoming more accessible owing to the growth of the Internet. There are a number of relatively robust science-dedicated search engines, wikis, and publication sites that can be use to access, search, and index scientific papers. These papers can then be incorporated and analyzed using bibliometric techniques. 44
Some scientific and technical R&D and a significant amount of application development is not disclosed to the public and resides in the R&D labs and departments of large technology, life science, energy, and pharmaceutical corporations; start-up companies; and classified government laboratories. The forecasting system may allow developing proxies for undisclosed scientific research, development, and application. Some proxies that should be considered include patent filings; scientific funding from venture capital or research grants; and knowledge gleaned from industry conferences, trade associations, trade magazines, and sector-specific interviews or workshops.
A persistent forecasting system should monitor relevant Web sites, blogs, publications, and periodicals for new words and terms that appear in specific scientific domains. One approach is to track the introduction of new tags in controlled vocabularies. New scientific and technical words and terms could be important forecasting signals.
Trends in Nature
It is also important to consider key trends in nature and how they might enable or inhibit technological disruptions. Which raw materials are necessary for a healthy economy? How long will remaining natural resources last? What factors, such as a dramatic rise in ocean levels, could affect the accessibility of these resources or popula-
|
43 |
Available at http://en.wikipedia.org/wiki/Systems_theory. Last accessed October 23, 2008. |
|
44 |
Bibliometrics is a set of methods used to study or measure texts and information. Citation analysis and content analysis are common bibliometric methods. Available at http://en.wikipedia.org/wiki/Bibliometrics. Last accessed July 17, 2009. |
tions, cities, and the infrastructure? What are the likely impacts of potential disasters such as global warming or sudden deforestation?
The persistent forecasting system may deploy sensors and collaborate with organizations to monitor trends in nature, natural resource availability, and scientific discovery. Agencies and organizations such as the National Oceanic and Atmospheric Administration, the National Aeronautics and Space Agency, the National Centre for Medium Range Weather Forecasting (India), the National Weather Service, the National Seismological Agency, the World Wildlife Fund, and the Natural Resources Defense Council, among others, may offer important insight into early signals of change. However, because many of these organizations have polarizing viewpoints, a persistent forecasting system should consider inputs from individuals or groups in all areas of interest to mitigate bias.
Growth in the global demand for traditional energy sources, coupled with growing concerns about the environmental impact of fossil-based fuels, has caused virtually all developed nations to prioritize energy-related issues. Related pulls in emerging markets derive from other natural resource issues. Potable water is a critical example, as many nations have either contaminated supplies or not enough water to support growing demands. Aging populations and the growing cost of health care have combined to focus attention on technologies related to health care, and concerns related to the potential for the rapid global spread of infectious disease add a new dimension to the need for health care solutions.
Societal Trends
The committee believes that a persistent forecasting system should monitor trends in society. Such trends may signal the emergence of critical challenges and problems, changes in the public policies that regulate R&D, changes in major global R&D initiatives, shifts of human and financial resources for scientific research and technical applications, changes in national and global priorities, and shifts in public opinion and social acceptance (or rejection) of technologies and applications. Interactions between agents (humans) in a complex system either amplify or dampen changes in perceptions or behaviors that can accelerate potential disruptive events. For example, the speed and type of disruptions in human biological engineering will likely be dictated by societal acceptability and ethical considerations. Over the past decade, technologies have been developed that monitor public sentiment surrounding brands and topics on the Internet. Using automatic sentiment analysis of text (also known as “buzz” detection) the system can monitor social networks and other online forums to detect changes in societal perceptions of innovative technology.
Societal attitudes can have a profound impact on the shape of the future. Examples include attitudes on nuclear weapons after the advent of the atomic bomb, the use of birth control, the ability to clone, the rise of online social networks, and the discovery of global warming. Societal reaction and cultural acceptability can have on irrevocable impact on future outcomes.
It is important to monitor trends in multiple segments of society, including business (both economics and finance), politics, and the arts.
Business Monetary flow is an important leading indicator of future trends in technology. In particular, venture capital, corporate R&D, university research, and government-sponsored R&D are of prime interest. The funding of the ARPANET by the Advanced Research Projects Agency of the Department of Defense was an example of an important signal. More recently, the size and growth in funding for alternative energy and clean technologies is a leading indicator of future potential breakthroughs. Signals in business can be monitored from both the supply and demand perspectives (see the next section, “Enablers, Inhibitors, and Precursors to Disruption”).
Politics A nation’s ability to marshal its capital and talent to drive change must be considered when forecasting future disruptive technologies. For example, the announced goal by the U.S. president in 1963 to land a man on the moon by the end of that decade (see Figure 5-3) caused resources to be allocated to key technological breakthroughs at the expense of other programs. Shifts in government policies, as well as the policies of nonstate actors such as the Organization of the Petroleum Exporting Countries, can impact the probabilities of disruptive technology events occurring within particular domains.

FIGURE 5-3 President John F. Kennedy’s May 25, 1961, speech before a joint session of the Congress, in Washington, D.C.: “I believe that this nation should commit itself to achieving the goal, before this decade is out, of landing a man on the Moon and returning him safely to the Earth. No single space project in this period will be more impressive to mankind, or more important in the long-range exploration of space; and none will be so difficult or expensive to accomplish.”
Governmental policy can either impede or enhance a nation’s innate S&T advantages. S&T policies play a crucial role in national strategy as well as in establishing and maintaining global competitiveness. National policies should synchronize future capabilities with S&T resources and R&D activities. Understanding the policies and tracking changes in them and in R&D activities may signal important changes in a nation’s S&T priorities, attitudes, and concerns. These signals may be important signposts to track in a persistent long-term forecasting system.
Arts and Literature Because artists and writers are often on the leading edge of social change, it is important to keep up with the topics they are pursuing. Some places to look for an emerging norm might include the social causes found in musical lyrics, technologies described in science fiction, and warnings and dissent found in nonfiction. Societal resistance or polarity reflected in works of art may be indicative of technologies that have high disruptive potential. The persistent forecasting system can utilize contemporary tools to monitor a rich and diverse set of sources such as buzz logs for hot topics, changes in musical lyrics, new topics covered in the press, emerging concepts found in digitized books and periodicals, new postings on crowd-sourced sites like Wikipedia, tag clouds to identify new topics or relationships, and online social networks that uncover original social causes or important trends. Nevertheless, to mitigate bias, it will be important to reach beyond the Internet and digitized sources to include offline sources of information and information from underdeveloped and emerging countries as well as countries that have limited Internet connectivity.
Technology Sectors to Watch
For a technology to be considered disruptive there must be an application that can derive value from that technology. Potentially disruptive or not, technologies created in the absence of an application will have a difficult time being adopted. New applications of technologies could disrupt many sectors—health care, energy, materials,
communications, information technology, entertainment, defense, and transportation. Examples of potentially disruptive technologies and application sectors include these:
-
Picture Archiving Communications Systems (PACS) and IT Systems (health care),
-
Energy storage materials (energy/materials),
-
Ubiquitous broadband wireless (communications),
-
Cloud computing (information technology),
-
Virtual reality and virtual goods (entertainment),
-
Autonomous combat vehicles (defense), and
-
New biobased fuels and technologies (transportation).
In general, the technology sectors most likely to yield disruptive advances are those that attract broad interest throughout the R&D community in both the public and private sectors. However, it is important to also examine the potential for disruption from crossover advances, where breakthroughs in one sector could spawn a diverse spectrum of advances in one or more other sectors.
Application Paths to Consider
Roadmapping is a time-honored technique for forecasting technological advances. However, it is most useful for forecasting raw technical capabilities rather than the applications enabled by technologies (Anders, 2008). For the latter, the solution pull dimension is of vital importance.
In assessing application paths it is instructive to work the problem from both ends. Technology roadmaps that forecast raw capabilities are useful in projecting the anticipated maturation path(s) for a given technology based on a particular set of assumptions. Another use of roadmapping is to highlight the impediments that require a fundamental breakthrough to proceed further along a given path. Linking roadmaps to the solution domain is, however, quite complex. In light of market demand, technologies that might be integrated to satisfy the solution pull and factors that currently limit solutions must be identified.
Whether working from the technology push or the solution pull perspective, identification of application pathways is difficult. With technology push, it is impossible to envision all potential applications of a given technology across all conceivable market domains. Similarly, from a solution pull perspective, it is not feasible to identify all possible building blocks, some of which may be nonmaterial, that could address a given market demand. Thus, the potential for disruption or surprise always exists, although it can be mitigated by using scenarios and red teaming (adversarial perspective) techniques, which seek to identify both novel applications of an existing technology and novel solutions to a perceived market demand. Backcasting (Chapter 2) is particularly suited to the task of exploring solution pull. It is not necessary to have perfect vision in order to have a relatively comprehensive inventory of potential building blocks for an envisioned solution. As long as these building blocks are frequently updated, the potential for surprise can be reduced. With backcasting, once the specific solution is envisioned the surprise is more likely to be a result of timing rather than a failure to anticipate the use of a particular building block.
Enablers, Inhibitors, and Precursors of Disruption
The greater the lead time gained by identifying key signals and signposts, the greater the ability of decision makers to prepare for future technological disruptions. A persistent forecasting system should consist of an aggressive, systematic, and ongoing effort to identify the enablers, inhibitors, and other precursors of potential technological disruptions using forecasting techniques like backcasting. Some examples of early warning sensors are supply factors, demand factors, price/performance ratios, adoption rates, and changes in historical relationships, correlations, or linkages. System operators should also consider social network analysis software, genetic mapping software, and supply chain software as tools for discovering and mapping complex systems.
Supply Indicators of Potential Disruptions
Once a potentially disruptive technology has been identified, the key supply chain factors that might enable or inhibit its manifestation should be identified. Some of these key factors could include the following:
-
Requirement of raw materials and how much they cost,
-
Raw material availability and stability of the supply—for example, if they are located in a country or area subject to natural disaster or political unrest,
-
The cost of production, including costs for tooling and set-up for initial production,
-
Performance requirements,
-
Expertise and competence of the workforce,
-
Quality of the infrastructure,
-
Ancillary technologies required to produce enough to meet demand (scale),
-
Any laws of nature that might stand in the way of a technological disruption, and
-
Alternative approaches and techniques that would achieve the same outcome.
Once these factors are determined, the persistent forecasting system should be able to establish information-monitoring sensors as well as in-person information-gathering techniques to benchmark the progress toward disruption. Some factors, such as raw material or commodity prices, should be easy to monitor, while proxies or qualitative factors may be required in cases where information is not readily available.
Demand Factors in Potential Disruptions
Identifying demand factors (units, prices, etc.) that might cause a disruption is somewhat more challenging but not impossible. For instance, how much would an individual pay to live 50 years longer while maintaining the mental and physical characteristics of a young adult? What would a nation-state pay for a technology that could prevent or cure radiation sickness? Once a disruptive product or service can be imagined by one or another technique, the persistent forecasting system should consider key demand factors such as the following:
-
Price elasticity of demand,
-
Sources of demand,
-
Estimated rate of diffusion,
-
Cost of distribution, and
-
Environmental, political, and national security issues and social demands and constraints.
Demand factors affect not only market-driven technologies and applications but also defense technologies. The production of F-22 fighter aircraft was halted when it was realized that high price and export restrictions would constrain the diffusion rate. The ongoing F-35 aircraft program, on the other hand, exemplifies less constraint on diffusion because of expansive demand factors due to lower prices and greater demand because the plane was developed specifically for export.
Once these factors have been determined, the persistent forecasting system should once again establish information-monitoring sensors as well as in-person information-gathering techniques to further benchmark progress toward disruption. Like supply factors, some demand factors should be relatively available while others, where information is less readily available, are likely to require a surrogate variable.
Signal Detection Methods
Signals can be detected using automated, computer-assisted, and manual methods. Computers can mine targeted databases and data feeds for changes in the measurements of interest and identify those measurements that might exceed preset threshold values. These values are set by forecasters using Chapter 2 forecasting methodologies such as trend analysis, causal modeling, and road mapping; signposts and tipping point values can also

FIGURE 5-4 Signtific screen, available at http://www.signtific.org/. SOURCE: Courtesy of the Institute for the Future.
be extracted from previous forecasting exercises and processes. Operators of the forecasting system can predefine which databases and data feeds may be of interest. Once targeted, programs can be written to extract the signals of interest using data analysis software and tools.
Computer systems can be programmed to automatically monitor Web sites, posted papers, and blogs to extract potential signals. Word spotting, standing queries matching, topic clustering, resource description framework (RDF) topic mapping,45 sentiment analysis, and threshold monitoring are approaches that can be used by automated systems to extract signals from unstructured data sources.
Signals can also be detected manually through expert or crowd curation.46 Forecasting systems such as Signtific ask experts to identify and input signals of interest to be shared and analyzed by other experts (see Figure 5-4).
|
45 |
“Topic maps are designed to facilitate the organization and navigation of large information collections through the use of an open (non-controlled) vocabulary using topics, associations, and occurrences. A topic may represent any concept, including subject, person, place, organization, and event. Associations represent the relationships between those concepts; and occurrences represent relevant information resources. Although sometimes used when referring to an ontology, taxonomy, or thesaurus, a topic may, in fact, incorporate any combination of these. Available at http://www.quantum3.co.za/CI%20Glossary.htm. Accessed on July 16, 2009. |
|
46 |
Digital curation is the selection, preservation, maintenance, and collection and archiving of digital assets. Available at http://en.wikipedia.org/wiki/Digital_curation. Accessed on August 7, 2009. |
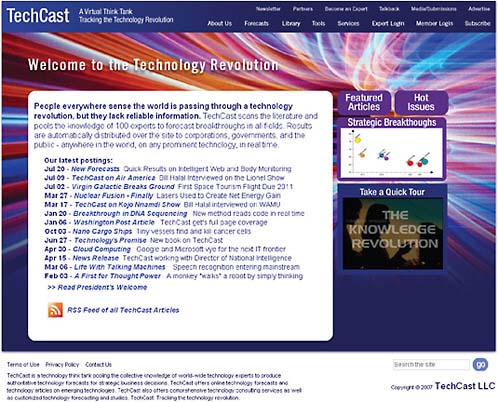
FIGURE 5-5 TechCast screen, available at http://www.techcast.org/. SOURCE: Courtesy of http://www.techcast.org.
TechCast uses an approach in which an administrator poses a question or proposes a forecast and solicits inputs from experts that can be used to generate signals (see Figure 5-5). Experts can also use prediction markets to generate signals. Similar signal curation approaches can be used with crowds.
Computer-assisted approaches combine the power of computers to mine and search rich sources of information (such as the Web, databases, and data feeds) and the power of humans to make judgments, identify patterns, and use intuition. Analysts and forecasters can use search engines, alerting systems, visualization tools, and computer models to generate signals. Humans can also play out various future scenarios using simulations and gaming technologies run on computers. Signals can be extracted from the results of these simulations and games.
Exception and Anomaly Processing Tools
While data analysis is an old and established field of study, many analytical tools are best applied in non-complex systems that have common similar data structures and content. Traditional statistical methods such as time-series analysis and exploratory data analysis can be applied to forecasting in noncomplex systems. Data
analytic techniques for finding complex patterns, weak signals in noisy environments, or nonbinary correlations are less established than techniques used in noncomplex systems. However, with the advent of the Internet and greater processing power, significant progress has been made, and there are several analytical techniques that show promise for identifying potential disruptions in complex environments. Which tools are best? As discussed earlier, Vanston (2003) argued that
the real challenge is not to determine which [approach] is the right one, or even which is best; the challenge is to use these different approaches in concert to develop sound, credible, comprehensive forecasts.
Chapter 2 of this report identified and discussed several traditional approaches for reducing available data into a form that can provide a meaningful input to the generation of a forecast. In general, with the exception of some of the gaming and simulation techniques, these methodologies rely on readily discernable patterns in historical data. The following subsections, by contrast, highlight several classes of tools that are well suited to identification of the more obscure patterns and signals believed to be critical to the success of the persistent forecasting system. Note that the list is not meant to be comprehensive, nor is it meant to be prescriptive for a specific technique.
Vision-Widening Tools for Complex Systems
With the advent of the Internet, we have seen rapid growth in social networks, online gaming, virtual worlds, and other proxies that closely approximate complex systems. The persistent forecasting system should, accordingly, consider using proxies of complex adaptive systems (CASs) to identify potential future outcomes, identify new signals of changes in societal trends, and monitor the rate and breadth of their diffusion. These CAS proxies include, but are not limited to, virtual worlds, alternate reality games (ARGs), massive multiplayer online role-playing games (MMORPGs), and online social networks. Further, the diversity (thousands of player types) and magnitude (millions of participants) of these environments suggests that insights can be gained on how different societies might respond under the stress of different force changes. Another novel approach that could be explored is the use of crowd sourcing for analysis by making data sets collected in virtual worlds public.
Finally, system operators should consider utilizing storage technology tools such as snapshotting. One of the challenges of CASs, including the online proxies mentioned here, is that they are irreversible; this makes testing alternate realities a challenge. It should, however, still be possible to gain experience in potential alternate outcomes by using other tools. For example, the persistent forecasting system might consider using state-of-the-art enterprise storage technology to take snapshots of the states of the online systems at various points in their simulation time line. The system operators could then consider injecting those snapshots into massive scenario generators, manipulating key force variables (natural disaster, economic hardship, etc.) to extreme conditions, and observing how the system changes under different conditions. It may also be useful to create alternate online worlds or games with similar starting points but different economic, legal, or environmental conditions. These novel approaches should be considered in conjunction with more established techniques of future gazing such as traditional scenario analysis.
Morphological analysis and agent-based models are other data organization techniques that should be considered.
Simulation
While it is difficult, if not impossible, to forecast the timing of external shocks, decision makers can still benefit from simulating their impacts and alternative future outcomes under different conditions. The insights gained from running these simulations can be used to modulate the impact of surprise through better allocation of resources.
The stakeholders of the persistent forecasting system can rank existing and new potential investments by testing how their resource allocation and portfolio choices hold up when extreme visions of the future are simulated. Consideration can be given to systematically moving key variables to extreme conditions and injecting random
high-impact events into various types of CAS models (such as in virtual worlds, ARGs, MMORPGs, online social networks, or approaches using techniques to generate mass scenarios).
For instance, it might be useful to create existing models of the physical world (or use existing ones) and systematically test various futures, injecting random high-impact events such as economic calamity, sudden resource scarcity, natural disasters, war and conflict, or a scientific breakthrough. From this exercise, the stakeholders should be able to identify key tipping points, system fragilities, unrecognized linkages, critical interdependencies, or resource scarcities that may signal areas of technological obsolescence or increased pressure for technological innovation. It is imperative that stakeholders analyze the potential scope of disruptions and put in place a portfolio of investments in advance of a potential event so that if the event does occur, stakeholders are able to increase the number of alternative reactions and outcomes. Using this approach, decision makers will likely be better prepared to mitigate the effects of surprise with proper planning and resource allocation.
Text Mining
With almost 80 percent of global information stored in unstructured text (see the discussion on processing unstructured data), mastery of text mining will be a critical enabler for a persistent forecasting method that reduces the probability of unlikely events.47 Without text mining, it would be extremely difficult and expensive to organize, structure, and load RDBs and RDFs. Text mining opens up the potential for harvesting information from the Web on a massive scale and structuring the data for analysis. The disciplined, continuous scanning required to enable a persistent forecasting effort is made feasible by text mining systems. Fortunately, such efforts are not novel, with the United Kingdom having gone so far as to establish the National Center for Text Mining (NaCTeM).48
Data Relevancy Testing
One method of preventing information overload is the application of relevancy tests. Presenting only data that could lead to impactful disruptive events would be an obvious way of managing information load. This suggests that when a potential disruptive future event is identified, system operators will need to utilize backcasting techniques to identify enablers, inhibitors, and force drivers. Once identified, data feeds could be monitored for each of these factors, with information presented to the user only when certain threshold levels are hit.
Storing Queries
Pioneered by Jeff Jonas (2006) as part of work first done to help understand cases of fraud in Las Vegas casinos, Non-Obvious Relationship Awareness (NORA) uses protocols similar to RDF analysis; however, it is dependent on a well-characterized initial question set, which is then used to count events or activities and then determine the likelihood that they are related. Specifically, this system allows queries to be stored as part of the data set and remain active for the life of the database. This creates an opportunity for the data and the query to coincide and signal the event to an end user. In effect, the query is acting like an agent receiving confirming or disconfirming feedback.
Pattern Recognition Tools
Pattern recognition tools are also critical to finding early weak signals in complex data sets. With appropriate visualization tools, human analysts are capable of picking up some patterns in large, complex sets of data. Augmenting human analysis with computer pattern recognition can greatly enhance pattern recognition performance, especially in large dynamic data sets. The field of pattern recognition is well established. Specialized pattern recognition tools and techniques will need to be developed over time, particularly as new disruptions occur. As part of the review and assessment phase, the persistent forecasters will need to develop pattern learning sets in their
|
47 |
Available at http://en.wikipedia.org/wiki/Intelligent_text_analysis. Last accessed October 23, 2008. |
|
48 |
Available at http://www.ariadne.ac.uk/issue42/ananiadou/. Last accessed October 24, 2008. |
priority areas of focus. The International Association for Pattern Recognition would be a good place to start for identifying cutting-edge and relevant techniques that might be applicable for disruptive technologies.49
Link Analysis Tools
Link analysis and monitoring are powerful tools for identifying signals of a potential pending disruption. Rapid variations in the rate of change of the strength, frequency, or number of linkages relative to the historical baseline or the status quo can serve as a tangible warning that the likelihood of a disruption is increasing. This requires that the persistent forecasting system establish baseline data for key areas of focus and the driving forces described earlier. Unforeseen or underappreciated (from a risk standpoint) linkages, interdependencies, and self-organizing factors manifest themselves when the dynamics of a key driver changes. This is the hallmark of a complex adaptive system (CAS).
The persistent forecasting system operators should consider including a baseline of historical reference data in priority areas and robust link analysis tools to identify changes in linkages, including the establishment of new links, the breakage of established links, and changes in the strength or number of links.
Using link and visualization tools like those used by the Visual Thesaurus, one can imagine the relationship between words and terms50 and other entities. These tools are also used to visualize social and information networks. Many link analysis tools are well established and available commercially.
OUTPUTS AND ANALYSIS
Identifying the appropriate tools and creating the right processes and engines by which information is analyzed are only the first steps to ensuring the success of a persistent forecasting system. The information must also be presented in a clear and consistent manner to facilitate analysis. The analysis is typically facilitated via a range of visualization tools that provide alternative dynamic representations of the processed data. Visualization tools help humans to be more efficient and effective in recognizing patterns in massive data sets. The operators of the persistent forecasting system should incorporate a robust set of visualization tools.
Signal Evaluation and Escalation
In a signal escalation process, the forecasting system uses methods that allow signals to be analyzed individually by both experts and the crowd. An expert looks at a signal and concludes the analysis by recommending that the signal be either ignored or escalated. Individual expert analyses and recommendations should then be collected and posted in public for all to see. Creating an ongoing conversation among experts and a crowd with multiple viewpoints should be one of the goals of a persistent forecasting system, with the aim of stimulating still further feedback and analysis.
A signal should be escalated even if only a single expert recommends it—that is, escalation should not depend on consensus. To deter consensus interpretation of signals, experts from different disciplines should be encouraged to review signals separately. The expert(s) recommending escalated analysis should also suggest the appropriate escalation type. For example, should another expert with expertise in another discipline review the data? Should the signal be placed into a virtual world, a role-playing game, or some other method of testing and learning? Does the signal spur more questions? In this last case, such questions should be input into the system as a persistent query.
Visualization
Forecasts provide important data on potential futures to decision makers and stakeholders but must be represented in a clear and informative way in order to be useful. Computers organize and represent data in a vastly different way than human beings: Representations suitable for a computer algorithm are often not suitable for
|
49 |
More information available at http://www.iapr.org/. Last accessed August 24, 2009. |
|
50 |
Available at www.visualthesaurus.com. Last accessed October 24, 2008. |
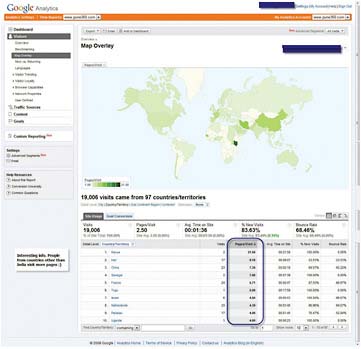
FIGURE 5-6 Example of a heat map. SOURCE: Google Analytics.
humans and vice versa. If a decision maker cannot understand a model or the solution produced by an algorithm, then the algorithm, model, and solutions are effectively useless.51
The human mind can quickly process complex information received visually. Computer-generated visual representations and interaction technologies provide the tools for users to see and interact with large volumes of information at once. Visual analytics build on this ability to facilitate the analytical reasoning process (Thomas and Cook, 2005).
With forecasting methodologies such as trend analysis, TRIZ, influence diagrams, and prediction markets, visualization tools can produce a graphical model of the progression (both past and potential future) of technology and the factors that might have a direct effect on the development, adoption, and applications of technology.
Existing Visualization Tools
There are well-known methods of charting, graphing, and presenting information that have been successful for decades. Pie charts, bar graphs, and scatter plots are the standard output of Microsoft Excel, Google spreadsheets, statistical analysis software (SAS), and Mathematica. However, with the dramatic increases in computing power over the past 50 years, there are many new ways to visualize information. Maps, long one of the richest methods for visualizing data, may now be combined with data sets in a number of novel and visually empowering manners. Heat maps, like those used by Google Analytics and SmartMoney, are popular examples of visualizing clusters of related data (see Figure 5-6). Other graphics tools such as geo mashups, link diagrams, transaction maps, and
time-line plots are widely used by analysts for investigatory analytics. Graphs of network nodes, subways, gene paths, page views, and other data-intense subject matter have pushed the boundaries of visualization and shown great potential for expansion into new areas.52
Ideal Visualization Dashboard
Dashboards are executive information systems that present data in summary formats. They leverage visual analytics and intuitive user interface designs to produce interactive and easy-to-read overviews of complex data holdings. It is believed that the ideal dashboard will have several key visualization and analytical attributes.
-
Handle large amounts of data. Visualization tools must allow the users to evaluate mass quantities of data or granular data quickly and with equal ease. For example, it might be useful to have a heat map that allows the user to look at the entire universe of data at a glance to identify outliers or concentrations of activity. This capability should be combined with interactive tools that allow the user to further investigate specific data points of interest. Some examples of such capabilities are HealthMap,53 which monitors disease alerts on a global map, and FINVIZ,54 a financial visualization site designed to support stock traders that monitors stock market activity overlaid on a heat map.
-
Vary timescales. The dashboard should have capabilities that allow users to manipulate or change views on a variety of different timescales. Changes that might be missed in the shortterm might become more obvious on a longer timescale.
-
Use global representations. The dashboard should visually represent to the users potential disruptive activities occurring throughout the world. Data sets and real-time data feeds can be combined55 with maps to provide geocontext for the data. This is especially important given the relationship of disruptive technologies to techno clusters.56 The dashboard should use geospatial visualizations like those developed by Google Earth and the Environment Remote Sensing Institute (ERSI).
-
Macro- and user-defined alerts. The dashboard should also have alerts that are both macro- and user-defined. For example, FINVIZ generates tables that show the performance of macromarket indicators as well as stocks that are performing at the extremes or that have hit certain threshold signals (see Figure 5-7). Macromarket indicators include total advancing/declining stocks, total new highs/new lows, and total stocks above/below the moving average. FINVIZ also has tables that show stocks that have tripped widely monitored threshold triggers such as unusual volume activity, most volatile, overbought, oversold, top gainers, top losers, stocks hitting new highs or new lows, stocks with large numbers of insider transactions, and stocks with upcoming earnings announcements. The FINVIZ site also includes several technical default thresholds such as stocks hitting trendline support or trendline resistance and stocks that are in an up channel or a down channel. These are all examples of indicators that are of interest to particular types of financial advisors. A similar system could be built for forecasters to track signals and signposts of potentially disruptive technologies.
-
Allow for search and real-time filtering. The dashboard should include tools for search, filtering, alerting, and analytics. Some examples might include (1) keyword search, (2) filtering based on user-defined variables, and (3) user-defined analytics to recognize changes in relationships between variables.
|
52 |
An excellent discussion of data visualization can be found at the Many Eyes site, which is part of IBM’s Collaborative User Experience Group. Available at http://services.alphaworks.ibm.com/manyeyes/home. Last accessed May 6, 2009. |
|
53 |
Available at http://healthmap.org/en. Accessed on August 7, 2009. |
|
54 |
Available at http://finviz.com/. Accessed on August 7, 2009. |
|
55 |
A mashup is a Web application that combines data or functionality from one or more sources into a single integrated application. More information available at http://en.wikipedia.org/wiki/Mashup_(web_application_hybrid). Last accessed May 6, 2009. |
|
56 |
A techno cluster is a high-technology-oriented geographic concentration of interconnected technology businesses, suppliers, universities, and associated institutions. More information available at http://en.wikipedia.org/wiki/Business_cluster. Last accessed May 6, 2009. |
FIGURE 5-7 Finviz.com dashboard. SOURCE: Courtesy of FINVIZ.com, Financial Visualizations.
-
Support user communities. The dashboard should have tools that allow for the formation of user communities and provide tools to capture and monitor signals of interest from these communities.
An ideal persistent disruptive technology forecasting system might include global maps showing patent filings, venture capital investments, natural disasters, raw materials supply chains, and political stability. These indicators might be color-coded to show improving/deteriorating conditions in each of the major indicators. Indicator-specific dials would allow the user to drill down into subjects of interest, especially outliers. For instance, if an earthquake occurs near the mine in Chile that supplies a significant portion of the globe’s lithium needs, natural disaster and key raw materials triggers might be jointly tripped that would flash as a hot spot on a global map (see Figure 5-8). The end user would then drill down at the hot spot, where the earthquake and raw material data would be in a state of deterioration. Drilling down another level would reveal companies, technologies, and products that could be adversely impacted by the event and also reveal alternative sources of supply. Chronological dials could be moved backward and forward in time to see how much lithium material is available in the supply chain and how it has changed over time in order to assess how long it will take for the shortage of lithium to impact end users.
The dashboard should also include tables showing thresholds that have been recently triggered. An example might include using a tag cloud (see Figure 5-9) or a link diagram to track the appearance of a new word from an established research domain in a scientific journal or paper, or a list of new links in an online social network, suggesting that relevant experts/analysts evaluate the meaning of the trigger.
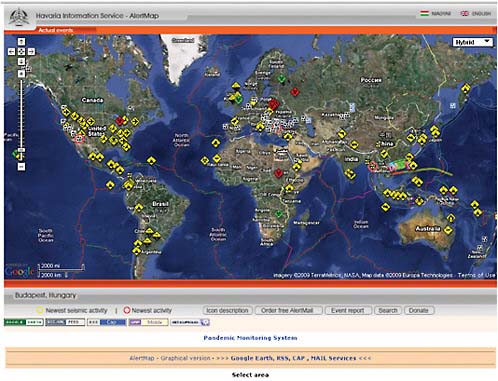
FIGURE 5-8 Screenshot of Havaria Information Services AlertMap. SOURCE: Courtesy of RSOE, http://visz.rsoe.hu/alertmap/index2.php.
FIGURE 5-9 Tag cloud generated for the scientific revolution using the Many Eyes Beta Site for Shared Visualization and Discovery by IBM. SOURCE: Courtesy of Many Eyes. More information available at http://manyeyes.alphaworks.ibm.com/manyeyes/page/Tag_Cloud.html.
POSTPROCESSING AND SYSTEM MANAGEMENT CONSIDERATIONS
Review and Reassess
Building the ideal persistent forecasting system will be an iterative process that may take years to mature. The committee believes the best way to improve the system over time is to systematically conduct internal and external reviews of processes, tools, and personnel. A persistent forecasting system comprises a combination of technology, processes, and people. While this report focuses on the technology, it is just as important to consider the other two components when creating a persistent forecast. These reviews should be conducted on a regular basis, at least annually.
Internal and external reviews should be done separately and by rotating personnel. The forecasting system should also have a robust set of tools for receiving feedback from the general public and from internal staff and experts. When a disruption does occur, whether predicted or not, the operators of the persistent forecasting system should consider backtesting to see if it could have been detected earlier with different techniques or personnel.
Expert Interpretation of Automatic Output
It is important to note that while computer modeling, systems, and heuristics have grown increasingly sophisticated they still lack the ability to assert insights. Computers are extremely efficient and effective at performing calculations, analyzing, and finding basic patterns. Search engines and databases are capable of analyzing hundreds of millions of pages of information per second. They are perfect for performing extremely high-speed repetitive operations, but for all of their speed they are still not able to mimic the performance of the human mind for understanding complex associations and patterns.
The human mind is remarkably skilled at finding solutions through intuition and sophisticated questioning. This ability of humans to understand patterns and problems without previous experience or empirical knowledge separates humans from computers.
Computer analytical and alerting systems are powerful tools that can be programmed using human rules to analyze large data sets. They can search the Internet for specific patterns, generating dashboards of information for human analysis. That information can be harnessed by the user through the Web to extract the wisdom of crowds (Surowiecki, 2004) through crowd sourcing and expert-sourcing. The idea behind creating an open, persistent forecasting system is to bring together the power of computer networks and the wisdom of human networks.
Backtesting
Looking back from 2009, it is easy to see what some of the most important technological themes over the past 30 years have been: ubiquitous communications (Internet, cell phones, wireless devices) and pervasive computing (PCs, cloud computing, server farms), digitization (iPods, DVDs, digital books), globalization of the supply chain (information technology, overnight transport), stealth (military applications), energy efficiency (automobiles, low-energy appliances, computing), clean energy (wind and solar) , bioengineering (genetic research, pharmaceuticals, regenerative medicine), and micro- and nanoscale manipulation (MEMs, nanomaterials). In 1979, would those same themes have been so easily anticipated? How would previous forecasts have identified these themes and their disruptive impact?
Venturing further back in history to 1905, one could witness the battle between two rival technologies to power the world’s automobiles. In 1906, a steam-powered vehicle set the land speed record, reaching 127 miles per hour (see Figure 5-10). Steam-driven vehicles were quieter, and their underlying technology was more widely known, allowing for easier service (Pool, 1997). However, steam was not to win. At that time, the gasoline engine was just an emerging technology, but the increasing facility in drilling for petrochemicals and the advent of mass production techniques would create one of the most disruptive technologies of the twentieth century. Why did forecasters at that time not see how important this battle was and the long-term technology impact of the gasoline engine?
Backtesting the forecast methods employed by the system over time is important, and comparing past forecasts to their actual outcomes will be a critical aspect of learning from these efforts and refining the system. Backtest-

FIGURE 5-10 Stanley Steamer Rocket setting the land speed record in 1906 of 127.659 mph. SOURCE: Available at http://patentpending.blogs.com/patent_pending_blog/images/stanley_steamer.jpg.
ing is a good way of evaluating the effectiveness and efficiency of forecasting tools and the quality of collection sources.
System Management
The persistent forecasting system operators and their infrastructure must also meet a minimum set of characteristics, detailed below.
Financial Support Strategies
The fact that the system is persistent suggests that long-term financial support and sustainability are critical requirement and that the system cannot be cost-prohibitive to either create or sustain. In general, the allowable cost should be proportional to the perceived economic benefit of a forecasting system that would lead to improved decision making.
A number of strategies can be used to finance persistent systems. One strategy is to have one or more sponsors commit to an ongoing sponsorship of the system. Typically, there are anchor sponsors that make a long-term financial commitment. These sponsors can be government agencies from one or more governments, corporations, foundations, academic institutions, or nonprofit organizations. Another approach is to incorporate the activity into an internal organization that provides funding. A third approach is to build an organization (either for profit or not for profit) for the exclusive purpose of operating the system as a stand-alone enterprise. The organization could be funded by revenues from selling forecasting services and publishing forecasts, direct donations, or by foundational or governmental support.
Secure System Infrastructure
The persistent forecasting system requires an infrastructure robust enough to protect data against outages, malicious attack, or intentional manipulation. This is especially true for a persistent forecasting system that has been designed for global collaboration. The data system should support the ability to be parsed and analyzed across multiple quantitative and qualitative vectors simultaneously, without compromising the underlying raw data. The technology infrastructure needs to be highly scalable to support a large user base with an adequate amount of bandwidth and processing power so as not to discourage active and ongoing participation. Additionally, a robust back-up and recovery architecture must be in place.
Because persistent forecasting systems will likely contain many complex data sets, the data structure must be dynamic and scalable. The underlying infrastructure (storage, processing, networking, and power) must be designed for speed, capacity, and redundancy. Commercial examples of such infrastructures include Google’s BigTable and Amazon’s SimpleDB.57
Information Integrity
The persistent forecasting system must be free from manipulation. Maintaining robust auditing and monitoring tools is an important feature of a trusted forecasting system. Furthermore, it should gather, process, and disseminate information in as close to real time as possible. Certain simulations and other procedures may require advanced data management tools such as snapshotting58 and cache coherency.
Data authenticity is itself an important topic. Data should not be discarded simply because it cannot be authenticated as genuine beyond repudiation. In fact, early signals of a potential pending disruption are often incongruous with the known order and therefore difficult to authenticate or corroborate. Therefore, the committee believes that although the ideal system should consider data authenticity, it should not require that data be authenticated.
Information integrity59 and credibility are among the most important attributes of any forecasting system. Together they improve the legitimacy of the forecast and increase the confidence of decision makers in allocating resources.
Information integrity can be threatened by bias. Sourcing and assessing data from multiple perspectives (countries, languages, cultures, and disciplines) can significantly reduce the adverse impact of bias, as discussed in Chapter 4. Concealed manipulation of data can undermine information integrity, so that an ideal system should consider using a variety of techniques and algorithms to identify when, how, and why data have been changed to reduce undetected alteration. An immutable audit log should be built into the forecasting system to track the source and flow of all of the data and the forecast. It would be a tamper-resistant record of how a system has been used and would invite everything from when data arrives, changes, and departs, to how users interact with the system. Each event is recorded indelibly, and no one, including the database administrator with the highest level of system privileges, could alter the record. Immutable audit logs enable users to track information flows and analyze the way each prediction was made.60 Because each prediction can be traced to its source, the creditability of a forecast can be established based the source of the data and how it was processed and interpreted.
To allow for an understanding of the timeliness, relevance, and legitimacy of data streams, information integrity processes should, at a minimum, do the following:
-
Keep track of data characteristics, including time, source, format, geography of origin, and language;
-
Measure accuracy of the data source;
-
Determine source reliability (has the data contributed by the source been accurate in the past?) or measure confidence in the data (in addition to asking participants to make a prediction, ask them how confident they are in the prediction);
-
Ascertain data availability (persistent, periodic, or one-time availability);
-
Perform regular audits of the system;
-
Determine if the data were altered; and
-
Provide strong controls for privacy and rights management.
By tracking the global information characteristics of the data surrounding a potentially disruptive technology, forecasters can assess the maturity of the technology space (how frequently is the technology of interest discussed?),
|
57 |
Available at http://labs.google.com/papers/bigtable.html and http://aws.amazon.com/simpledb/. Last accessed May 6, 2009. |
|
58 |
A snapshot is a copy of a set of files and directories as they were at a particular point in the past. Available at http://en.wikipedia.org/wiki/Snapshot_(computer_storage). Last accessed May 6, 2009. |
|
59 |
“Information integrity” is the trustworthiness and dependability of information. It is the accuracy, consistency, and reliability of the information content, processes, and systems. Available at http://www.infogix.com/information_integrity_defined. Last accessed July 17, 2009. |
|
60 |
Available at http://jeffjonas.typepad.com/jeff_jonas/2007/11/found-an-immuta.html. Last accessed, July 16, 2009. |
the rate of diffusion (spread of “new mentions”), and the potential impact (breadth and depth of mentions—how many cultures, disciplines, and languages?).
Resource Allocation and Reporting
Once a potential disruptive technology has been identified, key decision makers will want an assessment of the likelihood of the disruption, its probable impact, factors that could accelerate the disruption, and factors that could inhibit it. Further, they will also want to know key interdependencies or fragilities in the set of events that could lead to a disruption. This information should provide the decision makers with the information that they require to allocate resources that will shape the impact of the disruption when it does occur. Further, decision makers will need to be periodically updated on the status of potential disruptions. Therefore, operators of the persistent forecasting system should create a disruptive technology assessment report for each new potential disruption identified, in addition to regular updates.
REFERENCES
Published
Anders, George. 2008. Predictions of the past. The Wall Street Journal. January 28. Available at http://online.wsj.com/article/SB120119993114813999.html. Accessed April 8, 2009.
Blainey, Geoffrey. 2002. A Short History of the World. Chicago, Ill.: Ivan R. Dee, Publisher.
Enis, C.R. 2005. Expert-novice judgments and new cue sets: Process versus outcome. Journal of Economic Psychology 16(4): 641-662.
Faber, Malte, Reiner Manstetten, and John Proops. 1992. Toward an open future: Ignorance, novelty, and evolution. Pp. 72-96 in Ecosystem Health: New Goals for Environmental Management, Costanza, Robert, Bryan G. Norton, and Benjamin D. Haskell, eds. Washington, D.C.: Island Press.
Greenfield, P.M. 1997. Culture as process: Empirical methodology for cultural psychology. In Handbook of Cross-Cultural Psychology, J.W. Berry, Y.H. Poortinga, and J. Pandey, eds., Boston, Mass.: Allyn and Bacon.
Günther, Isolda de Araujo. 1998. Contacting subjects: The untold story. Culture and Psychology 4(1): 65-74.
Gupta, Hari M., Jose R. Campanha, and Rosana A.G. Pesce. 2005. Power-law distributions for the citation index of scientific publications and scientists. Brazilian Journal of Physics 35(4A): 981-986.
Johnston, Rob. 2003. Reducing analytic error: Integrating methodologists into teams of substantive experts. Studies in Intelligence 47(1): 57-65. Available at https://www.cia.gov/library/center-for-the-study-of-intelligence/csi-publications/csi-studies/studies/vol47no1/article06.html. Last accessed May 8, 2009.
Jonas, Jeff. 2006. Enterprise intelligence: Conference proceedings from TTI/Vanguard. Available at http://jeffjonas.typepad. com/jeff_jonas/2007/03/enterprise_inte.html. Last accessed October 23, 2008.
Kennedy, John F. 1961. Special message to the Congress on urgent national needs. John F. Kennedy Presidential Library and Museum. Available at http://www.jfklibrary.org/Historical+Resources/Archives/Reference+Desk/Speeches/JFK/003POF03NationalNeeds05251961.htm. Last accessed on August 10, 2009.
Kuechler, M. 1998. The survey method: An indispensable tool for social science research everywhere? American Behavioral Scientist 42(2): 178-200.
Mandelbrot, B. 1963. The variation of certain speculative prices. Journal of Business 36: 394-419.
Önkal, D., J.F. Yates, C. Simga-Mugan, and S. Öztin. 2003. Professional vs. amateur judgment accuracy: The case of foreign exchange rates. Organizational Behavior and Human Decision Processes 91: 169-185.
Pareek, U., and T.V. Rao. 1980. Cross-cultural surveys and interviewing. In Handbook of Cross-Cultural Psychology, vol 2, H.C. Triandis and J.W. Berry, eds. Boston, Mass.: Allyn & Bacon.
Pool, Robert. 1997. Beyond Engineering: How Society Shapes Technology. New York: Oxford University Press.
Schwartz, Peter. 1991. The Art of the Long View. New York: Currency Doubleday.
Servan-Schreiber, Emile, Justin Wolfers, David M. Pennock, and Brian Galebach. 2004. Prediction markets: Does money matter? Electronic Markets 14(3): 243-251.
Shirkyon, Clay. 2008. Gin, television, and social surplus. Available at http://www.herecomeseverybody.org/2008/04/looking-for-the-mouse.html. Last accessed October 24, 2008.
Spann, Martin, and Bernd Skiera. 2003. Internet-based virtual stock markets for business forecasting. Management Science 49(10): 1310-1326.
Surowiecki, J. 2004. The Wisdom of Crowds: Why the Many Are Smarter Than the Few and How Collective Wisdom Shapes Business, Economies, Societies, and Nations. New York: Random House, Inc.
Tauberer, Joshua. 2008. What is RDF and what is it good for? Available at http://www.rdfabout.com/intro/?section=contents. Last accessed October 23, 2008.
Thomas, J.J., and K.A. Cook. 2005. Illuminating the Path: The Research and Development Agenda for Visual Analytics. Richland, Wash.: National Visualization and Analytics Center. Available at http://nvac.pnl.gov/agenda.stm. Last accessed May 8, 2009.
Triandis, Harry C. 1995. Individualism and Collectivism. Boulder, Colo.: Westview Press.
Triandis, Harry C., Peter Carnevale, Michele Gelfand, Christopher Robert, S. Arzu Wasti, Tahira Probst, Emiko S. Kashima, Thalia Dragonas, Darius Chan, Xiao Ping Chen, Uichol Kim, Carsten de Dreu, Evert Van de Vliert, Sumiko Iwao, Ken-Ichi Ohbuchi, and Paul Schmitz. 2001. Culture and deception in business negotiations: A multi-level analysis. International Journal of Cross Cultural Management 1(1): 73-90.
Vanston, John H. 2003. Better forecasts, better plans, better results. Research Technology Management 46(1): 47-58.
Weber, E., C. Hsee, and J. Sokolowska. 1998. What folklore tells us about risk and risk taking: Cross-cultural comparisons of American, German, and Chinese proverbs. Organizational Behavior and Human Decision Processes 75(2): 170-186.
Unpublished
V.S. Subrahmanian, 2008. “Scalable text mining.” Presentation to the committee on May 29, 2008.


