
1
Energy Use in Context
This report of the Panel on Energy Efficiency Technologies reviews the technologies that could increase energy efficiency1 in U.S. buildings, transportation, and industry over the next few decades, especially during the period 2010–2020. It describes the technologies’ state of development; the potential for their use to achieve energy savings in buildings, transportation, and industry; and their performance, costs, and environmental impacts, most notably emission of greenhouse gases.2 The panel was convened as part of the National Academies’ America’s Energy Future (AEF) project (described in Appendix A). The panel’s charge is given in the preface in Box P.1.
Because continued technological advances make energy efficiency a dynamic resource, this report also reviews advanced technologies—some of which could become available and cost-effective in the 2020–2035 timeframe and beyond—and the research and development (R&D) needed to support their development.
To make a difference, energy efficiency technologies will have to be adopted widely, and so this report also addresses the sometimes formidable barriers to
|
1 |
The terms “energy efficiency” and “energy conservation” are often used interchangeably, but although both can save energy, they refer to different concepts (see Box 1.4 and Appendix D). Improving energy efficiency involves accomplishing an objective, such as heating a room to a certain temperature, while using less energy. Energy conservation involves behavior expressed in actions taken to reduce energy use and can involve lifestyle changes—e.g., lowering the thermostat in winter. This report focuses on energy efficiency. |
|
2 |
Although greenhouse gas emissions are the primary environmental impact considered in this report, the full evaluation of a specific application of a technology or measure should consider many other effects, including local effects, on the environment and natural resources. |
achieving high market penetration, and it outlines some of the experience gained with key policies and programs aimed at overcoming these barriers.
1.1
ENERGY USE IN THE UNITED STATES
The United States is the world’s largest consumer of energy. In 2008 it used 99.4 quadrillion Btu (99 quads) of primary energy (Figure 1.1), 20 percent of world consumption. The next largest user, China, accounted for 15 percent of world consumption, but its per capita use was less than one-fifth that of the United
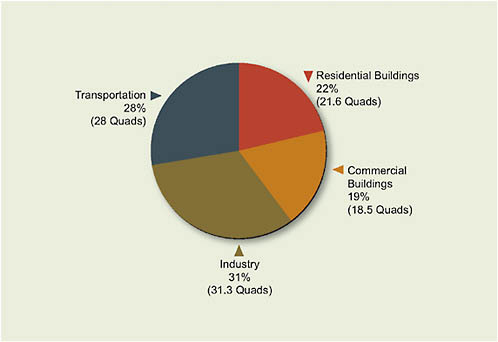
FIGURE 1.1 Total U.S. energy use by sector, 2008 (in quadrillion Btu, or quads). For each sector, “total energy use” is direct (primary) fuel use plus purchased electricity plus apportioned electricity-system losses. Economy-wide, total U.S. primary energy use in 2008 was 99.4 quads. Totals may not equal sum of components due to independent rounding.
Source: EIA 2009a, as updated by EIA, 2009b.
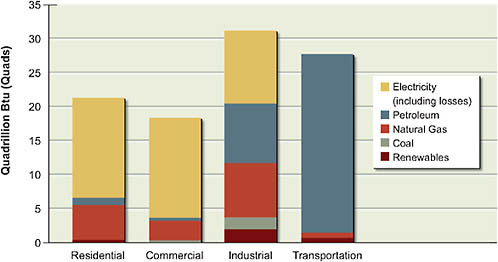
FIGURE 1.2 Total energy consumption in the United States in 2008, by sector and fuel. Shown are electricity consumption—with the losses in generation, transmission and distribution allocated to the end-use sectors—and the fuels used on-site in each sector. Electricity is generated off-site using fossil, renewable, and nuclear energy sources. Source: EIA 2009a, as updated by EIA, 2009c.
States.3 In 2008, about 40 percent of the energy consumed in the United States was used in the myriad activities and services associated with residential and commercial buildings; 28 percent was used in transportation; and 31 percent was used in industry. U.S. energy consumption in 2008 by sector and by fuel type is shown in Figure 1.2.
Additional details on the sources and sectoral uses of energy in the United States are shown in Figure 1.3, which indicates for 2008 the amount of primary energy used for electricity generation (40.0 quads) and how much generated electricity and other energy was used in residential and commercial buildings (20.1 quads), transportation (27.9 quads), and industry (23.9 quads). In 2008, 73 percent of the generated electricity was used in the residential and commercial buildings sector and almost all of the rest by industry, with only a small amount used for transportation. Figure 1.3 also shows on the far right how much of the
|
3 |
Energy Information Administration (EIA) data on the energy consumption of various countries are available from EIA at http://www.eia.doe.gov/emeu/aer/txt/ptb1103.html. |
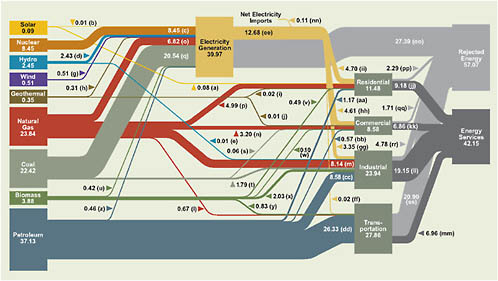
FIGURE 1.3 Energy flows in the United States in 2008, quadrillion Btu (quads). The figure illustrates the delivery of energy from primary fuel sources, shown in the boxes on the left, to the residential, commercial, industrial, and transportation sectors, which are shown in the boxes at the center-right. Energy is delivered to these sectors primarily in three forms: (1) electricity, which is produced principally from coal, natural gas, and nuclear sources, and to a much lesser extent from renewable sources (hydro, solar, wind, and biomass); (2) liquid fuels, principally petroleum, with a small contribution from biomass-derived fuels (such as corn ethanol); and (3) natural gas for heating and as an industrial feedstock. Small quantities of coal and biomass are also used as industrial feedstocks. The width of each bar indicates the relative contribution of that energy source; the absolute contribution (in quads) is indicated by the numerical labels next to each bar. The bar for electricity represents retail electricity sales only and does not include self-generated electricity. The boxes on the right side of the figure show that a total of about 99 quads of energy were consumed in the United States in 2008, but only 42 percent (42 quads) was used to provide energy services. The remaining 58 percent (57 quads) was rejected—i.e., not used to provide energy services—because of inefficiencies in energy production, distribution, and use.
Source: Lawrence Livermore National Laboratory and the U.S. Department of Energy, based on data in the Annual Energy Review 2008 (EIA, 2009a). Available at https://publicaffairs.llnl.gov/news/energy/energy.html.
primary energy input resulted in actual energy services and how much was lost because of inefficiencies in energy production, distribution, and use.
Energy use in the United States has grown steadily since 1949, although with a dip in the 1970s during the oil crisis; today energy consumption is double what it was in 1963 and 40 percent higher than it was in 1975 (the low point following the oil crisis). At the same time, U.S. energy intensity—the amount of energy used per dollar of gross domestic product (GDP)—has fallen steadily over many decades, with the exception of 1890 to 1920 and a few years after 1945 (Figure 1.4). Energy intensity decreased even as the United States became an industrial giant and built its railroads, highways, and other infrastructure. From 1973 to 2006, energy intensity fell by half, a rate of reduction of 2.1 percent per year.
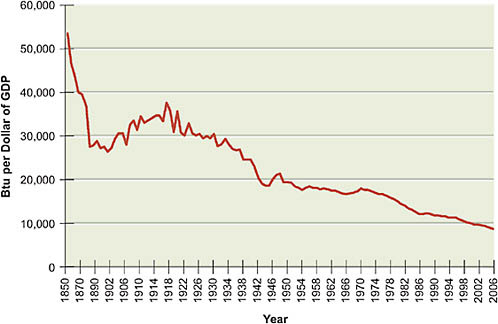
FIGURE 1.4 U.S. energy intensity (energy use per dollar of GDP), 1850–2006. Note the scale change on the x-axis between 1890 and 1902. Values for energy use before 1900 are inconclusive, because they depend on an estimate of the amount of wood used, which was the predominate energy source in 1850.
Source: Lave (2009), based on data in Schurr and Netschert (1960) and EIA (2008b).
About 70 percent of the decline in energy intensity since 1973 is estimated to have resulted from improvements in energy efficiency (IEA, 2004). If the trend toward lower energy intensity seen from 1973 to 2006 were to continue as a result of greater energy efficiency, by 2030 U.S. energy intensity would have dropped by 36 percent.
U.S. GDP is forecast to grow by 2.5 percent per year—slightly more than the 2.1 percent per year drop seen in U.S. energy intensity—and thus by 68 percent over the period from 2009 to 2030. With no change in U.S. energy intensity, U.S. energy use would grow by 68 percent. But if energy intensity continued to drop by 2.1 percent per year, by 2030 the energy intensity of the U.S. economy could be 30 percent lower than it is today, and total energy use in 2030 would increase by only 8.7 percent. And if the United States could accelerate the reduction in energy intensity to 2.5 percent per year, it could enjoy the projected 68 percent increase in GDP by 2030 without using any more energy than in 2009.
Can the United States achieve greater energy efficiency so that its energy intensity slows in relation to growth in U.S. GDP? What are the prospects for using energy more efficiently so as to reduce overall U.S. energy use as well?
1.2
THE POTENTIAL FOR IMPROVED ENERGY EFFICIENCY
Using energy more efficiently became a national concern during the first half of 2008 as energy prices hit record highs. It has also been gaining in importance as a result of growing concern about how to reduce emissions of greenhouse gases. Greater energy efficiency would reduce the need for fossil fuels, which provide 86 percent of the U.S. energy supply, and would thereby enhance not only environmental quality but also national security. Fortunately, the potential for greater U.S. energy efficiency is high.
It is the case that, despite the impressive gains made by the United States over the last 30 years, almost all other developed nations use less energy per capita and less energy per dollar of GDP (see Table 1.1 for examples). Denmark’s levels of usage, for example, are about half those of the United States by both measures. While there are structural variations that account for part of this gap, studies have consistently shown that some 50 percent of the observed differences in energy intensity result from differences in energy efficiency (Darmstadter et al., 1977; Schipper, 2004; Weber, 2008). Box 1.1 provides some information on comparisons of energy intensity across nine nations.
TABLE 1.1 Energy Use in 2006 in Selected Nations, Per Capita and Per Dollar of Gross Domestic Product, Using Purchasing Power Parities (2000 dollars)
|
|
Million Btu per Person |
Btu per Dollar of GDP |
|
United States |
335 |
8841 |
|
France |
181 |
6596 |
|
Japan |
179 |
6492 |
|
Germany |
178 |
6428 |
|
Denmark |
161 |
5267 |
|
Note: Purchasing power parity exchange rates take into account the relative cost of living in the countries being compared. A similar table in Lave (2009) for energy use 2005 used data that reflected market exchange rates and that were taken from the EIA’s interactive website (http://tonto.eia.doe.gov/cfapps/ipdbproject/IEDIndex3.cfm), in which data are continuously updated. Source: EIA, 2006. |
||
Moreover, energy-efficient and cost-effective technologies are available today to supply services (such as lighting, heating, cooling, refrigeration, transport, industrial motor drive, and computing) that are integral to modern life and that constitute the underlying drivers of the demand for energy. Hundreds of technologies, some already available commercially and others just beginning to enter the market, can provide these services more efficiently than is the case today, and they can collectively save large amounts of energy. Box 1.2 provides an example. Others are discussed in detail in Chapters 2 through 4.
Nevertheless, achieving greater energy efficiency in the United States will take considerable time and effort because, among other impediments, long-lived infrastructure, plants, and equipment—such as buildings, automobile assembly lines, and industrial and residential boilers—will have to be replaced or retrofitted. The range and number of other barriers to fuller use of energy efficiency technologies are suggested in Box 1.3 and discussed more fully in Chapters 2 through 4.
1.3
APPROACH TO AND SCOPE OF THIS STUDY
The panel’s assessment looks at energy use in U.S. buildings (both residential and commercial), transportation, and industry over three timeframes—the present to 2020, 2020–2035, and 2035–2050. The first period receives major attention because so many cost-effective technologies are ready for implementation today or will be ready within a few years. The panel examined the literature on energy
|
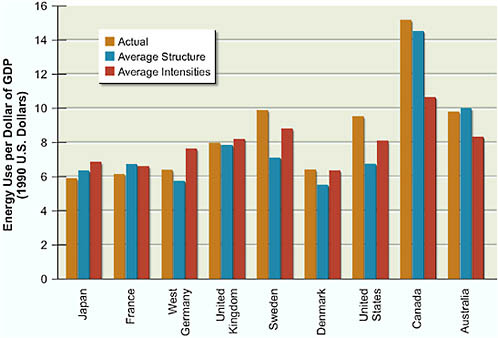
BOX 1.1 Comparing Energy Intensity Across Nations Early work by Darmstadter et al. (1977) and Schipper (2004) examined energy efficiency across nine developed nations. Adjusting for the mix of goods and services produced, heating- and cooling-degree days, and distance traveled, Schipper (2004) showed the results of the comparison (Figure 1.1.1). In comparison with Denmark, for example, the United States uses 53 percent more energy per dollar of GDP. If the two nations had the average structure of the other nations but their own level of energy efficiency (comparing the second bars), the United States would still use 19 percent more energy per dollar of GDP than Denmark. In other words, the U.S. GDP mix is inherently more energy intensive than that of the average nation. If both nations had their current structures but had the same level of energy efficiency as the average among the nine nations shown in Figure 1.1.1 (comparing the third bars), the United States would use 28 percent more energy per dollar of GDP than Denmark. Another way of interpreting these estimates is that the U.S. economy would use about 19 fewer quads each year (about 19 percent of its total energy use) if it had the average energy efficiency of the other nine nations shown in Figure 1.1.1. The work by Darmstadter et al. (1977) suggested that the United States would use 25 fewer quads, remarkably similar results for comparisons made two decades apart. Correcting for structural differences, the International Energy Agency has shown that between 1973 and 1998 the energy intensity of the United States and the eight major European economies fell 34 percent, and the energy intensity of Japan fell 30 percent (IEA, 2004). In Japan, strong declines in the energy intensity of manufacturing and the services sectors led the way, while the energy intensity of passenger transport and the residential sector actually increased. In Europe, manufacturing had the strongest decline in energy intensity, followed by declines in the service and household sectors. By 2030, Europe is likely to be less energy intensive than today, and so the United States is likely still to lag behind. Some technologies that are cost-effective today in Europe are not cost-effective in the United States because energy prices in Europe are much higher due to high taxes. Until U.S. energy prices are comparable to prices in Europe, or other factors have the same effect, Europe is likely to remain less energy intensive. |
efficiency, was briefed on the results of recent energy efficiency studies, and in some cases performed its own analyses to fill the gaps.
For buildings, the panel developed energy efficiency supply curves for electricity and natural gas in the residential and commercial sectors that show the amount of energy that could be saved over a range of costs below the current
price of energy. For transportation, the panel focused on the alternative technologies that could power the nation’s cars and light trucks. By estimating the cost and energy savings associated with each technology and how R&D might improve the technology over time, as well as the timeframes in which specific technologies might be expected to penetrate the market, the panel was able to
|
BOX 1.2 The Benefits of More Efficient Products: An Illustration Appendix E of this report provides information on how to calculate the net costs and benefits of energy savings. Figure 1.2.1 illustrates that the overall energy efficiency of providing light using incandescent lamps—starting from the burning of coal to produce electricity and continuing through to the production of visible light—is about 1.3 percent: about two-thirds of the energy in the coal is lost in generating electricity, about 9 percent is lost in transmitting and distributing the electricity, and an incandescent lightbulb’s efficiency in transforming electricity to visible light is only 4 percent (Tsao et al., 2009). In comparison, compact fluorescent lamps (CFLs) are about four times as efficient in transforming electricity to light as is an incandescent lamp (Azevedo et al., 2009; Tsao et al., 2009). Across the residential, commercial, and industrial sectors, a switch from incandescent lighting to CFLs today would save nearly 6 percent of the total amount of electricity generated in the United States today.1 With further R&D, solid-state lamps (light-emitting diodes, LEDs) are expected to become 10 times as efficient as an incandescent lamp (Azevedo et al., 2009; Tsao et al., 2009).2 Across the residential, commercial, and industrial sectors, a switch from incandescent lighting to CFLs today would save approximately 228 terawatt-hours (TWh) of electricity per year relative to today’s consumption, or nearly 6 percent of the total amount of electricity generated in the United States. 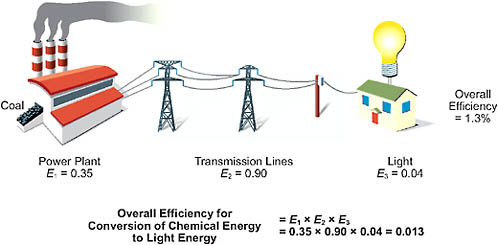 FIGURE 1.2.1 Example of how end-use efficiency influences overall fuel conversion efficiency. In this example, the efficiency of converting the chemical energy stored in coal to the electricity entering a building is about 32 percent (0.35 × 0.9). But after accounting for the low efficiency of the incandescent lightbulb, the efficiency of converting chemical energy to light energy is only 1.3 percent. (All values are approximate.) Source: Adapted and updated from Hinrichs and Kleinbach, 2006. |
|
TABLE 1.2.1 Annual Electricity Use for Lighting (TWh)
Assuming that the LEDs become twice as efficient (on average) as CFLs and other types of currently efficient lamps in 5 years, replacing all lamps with LEDs at that time would save an additional 230.5 TWh. Based on the current average carbon dioxide (CO2) emissions rate for the U.S. electricity sector, about 650,000 metric tons of CO2 per TWh consumed, the switch from incandescent lighting to CFLs would reduce U.S. CO2 emissions by about 148 million metric tons per year (about 2 percent). If all fluorescent and other lighting were subsequently converted to LEDs at twice the energy efficiency of fluorescent and other high-intensity discharge lamps and fixtures on average, an additional 56 million metric tons of CO2 emissions would be avoided annually.3 All of the above calculations use 2001 data from Navigant Consulting, Inc. (2002) (see also Table 1.2.1). The residential sector used 208 TWh of electricity in 2001, 10 percent of which went to fluorescent lights. Because of the growing adoption of CFLs, the panel’s analysis assumes that the fluorescent share in 2008 was 15 percent and the incandescent share 85 percent. Thus, the amount of electricity consumed by incandescent lamps was about 176.8 TWh. Shifting to fluorescent lighting would reduce electricity use by 75 percent to 44.2 TWh. Together with the 15 percent of lighting that is already fluorescent, the 2008 usage would have been 75.4 TWh if all lights were efficient. If CFLs and other fluorescent lamps are replaced with LEDs in, say, 5 years, half as much electricity, or 37.7 TWh, would be used. Table 1.2.1 has the other calculations. |
|
BOX 1.3 Why Aren’t Energy-Efficiency Opportunities More Attractive to Consumers and Businesses? Why don’t consumers and businesses take greater advantage of “cost-effective” energy efficiency opportunities? If so much energy can be saved, why doesn’t everyone do it, especially when the cost savings over time tend to well outweigh the initial costs? The answer is complex, as there is no one reason for this seeming “behavior gap.” Each of this report’s sector discussions, as well as the policy discussion at the end of the report, identify factors that impede the full use of energy efficiency technologies and measures. Such barriers fall into several categories; the following examples illustrate how some of them affect decisions:
|
develop illustrative scenarios of how total energy consumption in the light-duty vehicle (LDV) fleet could evolve.4 For industry, the panel focused on the four most
More details on how barriers such as these play out in the buildings, transportation, and industrial sectors are given in Chapters 2 through 4. Chapter 5 examines some of the policies and programs that have been aimed at overcoming these barriers. |
energy-intensive U.S. industries and also reviewed studies that assessed the potential for energy efficiency across all of manufacturing.
1.3.1
Baselines and Key Assumptions
The panel began by identifying a “baseline” or “business-as-usual” case. For buildings and industry, this was the reference case scenario of the Energy Informa-
tion Administration’s (EIA’s) Annual Energy Outlook 2007 (EIA, 2007)5 or 2008 (EIA, 2008a). For transportation, the panel developed its own baseline. For each of the three sectors, the panel estimated the level of energy-efficiency improvement beyond the baseline or reference case that could be attained with better technologies. Table 1.2 summarizes the key assumptions used in the panel’s analyses of the three sectors; more details can be found in Chapters 2, 3, and 4.
1.3.2
Key Energy-Related Terms and Measures Used
Box 1.4 provides definitions of some of the key energy-related terms and measures used throughout this report.
In addition, the panel notes the importance of distinguishing between “primary energy” and “delivered energy,” depending on the aspect of energy use being considered or analyzed.6 “Delivered energy” is the energy value of the fuel or electricity that enters the point of use (e.g., a building). Primary energy accounts for the total amount of fuel needed to provide this delivered energy. Note that “primary energy” and “delivered energy” are often referred to as “source energy” and “site energy,” respectively. The Department of Energy’s (DOE’s) EIA, in its statistical reports, uses the former terminology; this report does the same.
When discussing electricity or natural gas bills, or assessing the electricity demand that must be met by electricity production, delivered energy is the metric of interest. When determining the ultimate impact on total fuel consumption and energy resources of the energy demand by residences, commercial buildings, transportation, and industry, and related effects on the economy and the environment, primary energy is the appropriate metric. When quoting values for energy demand and production, it is important to specify which measure is being used.
The EIA defines primary energy as energy in the form that it is first accounted for in a statistical energy balance, before any transformation to secondary or tertiary forms of energy (see Box 1.4). The fuels counted by the EIA in U.S. primary energy consumption are given in Box 1.5. Distinguishing between primary and delivered energy is most useful for electricity, where the difference between
|
5 |
With an assessment of whether the results might have differed if the EIA’s Annual Energy Outlook 2008 had been used. |
|
6 |
This section draws on information in U.S. Department of Energy, Energy Information Administration: “Energy Efficiency Measurement Discussion: Source Versus Site Energy,” available at http://www.eia.doe.gov/emeu/efficiency/measure_discussion.htm#Site%20Energy%20Versus%20Primary%20Energy, and “Glossary,” available at http://www.eia.doe.gov/glossary/index.html. |
TABLE 1.2 Sources and Key Assumptions Used to Develop Energy Savings and Cost Estimates
|
|
Buildings (Chapter 2) |
Transportation (Chapter 3) |
|
|
Reference scenario |
AEO 2007 reference scenario (EIA, 2007), but with an assessment of whether using the AEO 2008 (EIA, 2008a) reference scenario would have changed the results |
Developed by the panel,b but similar to the AEO 2008 reference scenario (EIA, 2008a) |
AEO 2008 reference scenario (EIA, 2008a) |
|
Source of cost estimates |
Critical assessment of the literature |
Critical assessment of the literature |
Critical assessment of the literature |
|
Source of savings estimates |
Critical assessment of the literature |
Critical assessment of the literature on specific technologies |
Critical assessment of the literature on: |
|
|||
|
Panel-derived conservation supply curve analysis |
For light-duty vehicles (LDVs), the panel derived illustrative scenarios of overall savings in fleet fuel consumption |
||
|
Key cost-effectiveness criteria |
Levelized cost of energy savings is less than the national average electricity and natural gas prices |
Recovery of discounted costs of energy savings over the life of an LDVc |
Energy savings provide an internal rate of return on investment of at least 10 percent or exceed the company’s cost of capital by a risk premium |
|
Technology lifetimes |
Technology specific |
Average vehicle lifetime |
Technology specific |
|
Before-tax discount rate (%, annual) |
7 |
7 |
1 5 |
|
Other considerations |
Assessment accounts for stock turnover in buildings and equipment |
For LDVs, assessment considers how the distribution of specific vehicle types in the new-vehicle fleet affects the on-the-road fleet |
Assessment of savings in specific industries used to confirm industry-wide estimates |
|
aManufacturing only. bThis is a “no-change” baseline in which, beyond 2020 (when the original targets set by the Energy Independence and Security Act of 2007 are assumed to have been met), any fuel efficiency improvements are fully offset by increases in vehicle performance, size, and weight. cA cost-effectiveness criterion was not applied in the illustrative scenario analysis for transportation. Rather, the panel estimated, using the criteria in this table, whether an initial investment in the specific technologies assessed was likely to be recouped over the life of the vehicle. Source: Adapted from Table 3.A.2 in NAS-NAE-NRC, 2009. |
|||
|
BOX 1.4 Definitions Energy, in its forms as work, heat, and electric power, provides such services as powering a car or providing light. It can come from renewable sources, such as the sun or wind; from chemical reactions, such as combustion of fossil or renewable fuels; or from nuclear reactions. Energy is usually measured in British thermal units (Btu) or kilowatt-hours (kWh) (or joules; 1 watt-hour is equivalent to 3600 joules). Delivered energy is a measure at the point-of-use (site) of the amount of energy delivered to a consumer without adjusting for the energy lost in transforming a fuel or other form of energy to electricity, transmitting the energy to the point where it will be used, and then distributing it to individual users. Primary energy is the amount of delivered energy adjusted upward to account for the energy that is lost in the transformation and delivery of that energy to an end user, such as a residential housing unit. Energy intensity is a measure of the amount of energy used per unit of output for a company, industry, or the whole economy. For example, the energy intensity of steel production represents the amount of energy used to produce a ton of steel, or Btu per ton. Energy intensity can also represent the amount of energy used per dollar of output—or, for the whole economy, per dollar of gross domestic product (GDP). For example, the energy intensity of the U.S. economy is about 9000 Btu per dollar of GDP, equivalent to a bit less than one pound of coal or a bit more than one cup of gasoline per dollar. Energy efficiency is a measure describing how much useful work can be obtained from a system from a given amount of input energy. (A more formal definition derived from thermodynamics is given in Appendix E.) This report deals primarily with technologies for realigning improvements in energy efficiency, which the panel defines as accomplishing a specified objective using less energy. The objective might be to heat a room to a certain temperature, or provide a certain amount of light. For example, a compact fluorescent lamp is more efficient than an incandescent lamp, in that it provides the same number of lumens and quality of light as an incandescent lamp for only one-quarter to one-third of the energy input. Energy efficiency can be expressed directly as a dimensionless ratio—in this case, the ratio of the energy fed into a lightbulb to that which is radiated as light. Conservation is usually understood to mean action taken to reduce the amount of energy used by changing behavior, such as turning off personal computers when not in use or setting back the thermostat in winter. It can also involve using technologies, such as room occupancy sensors for lighting, which reduce energy use without someone having to remember to turn off the light. |
|
BOX 1.5 Forms of Primary Energy Consumption Included in EIA Statistics
Source: EIA, 2007, p. 34. |
the two can be large. (For example, about two-thirds of the fuel energy used in a thermal power plant is lost in generating electricity. About 9 percent of the generated electricity is lost during transmission and distribution of the electricity. So the amount of electricity entering a building or facility represents only 30 percent or less of the original fuel energy.) The EIA distinguishes primary energy from delivered energy only for electricity. For other fuels, delivered energy consumption is assumed to equal primary energy consumption. For these fuels, the energy used to transform fuels from one form to another, such as from crude oil to gasoline, is counted as energy consumed by the industry that performs the transformation—in this case, petroleum refining.
Analysts have debated the usefulness of measuring delivered (or site) energy. Many object to adding the energy value (as measured in British thermal units, or Btu) of delivered electricity to that of the fuels (such as natural gas) used directly at a site to arrive at a total value for “delivered energy” use at a site. This approach can lead to misleading conclusions—for example, that an all-electric building with resistance heating uses less energy than a comparable building with gas heated, because the delivered electricity, as measured in Btu, can be lower than the Btu value of the delivered natural gas. But the effects of electricity consumption on total energy use, and therefore the effects of consumer technology choices and upgrades, depend also on how the electricity is generated, which is not accounted for in delivered energy.
In this report, “delivered energy” refers to consumption of only a single fuel at a time for the buildings and industry sectors. In other words, energy delivered in different forms is not summed to produce a total value for delivered energy. For transportation, all petroleum-based fuels—gasoline, diesel oil, and others—are sometimes summed to obtain a total value for petroleum consumption.
This report identifies electricity consumption as primary (source) energy use whenever this is the metric being used. Otherwise, the value being quoted is in terms of delivered (site) energy.
1.3.3
Scope and Content
Chapters 2 through 4 provide the panel’s detailed assessment of the technologies that could improve energy efficiency in the buildings, transportation, and industrial sectors of the U.S. economy. Each chapter estimates the cost of technologies that offer improved energy efficiency, the amount of energy each could save, and the timeframe in which the technologies are likely to be available. The panel’s findings are presented at the end of each chapter. An important aspect of the panel’s analysis was the factors that impede putting energy-efficient technologies to use. Past studies have identified many technologies that, despite their potential to lower costs and save energy, were never implemented widely. Why seemingly attractive technologies are not deployed is explored for each sector in Chapters 2 through 4 (see Box 1.3 for examples). Chapter 5 reviews key policies and programs that have been aimed at overcoming barriers to improving energy efficiency, including some that led to large energy savings, and it recounts some of the positive experiences of two large states in achieving increased energy savings. In addition, the panel presents in Chapter 5 four composite or overarching findings based on discussion presented throughout the chapters.
1.4
REFERENCES
Azevedo, I., M. Morgan, and F. Morgan. 2009. The transition to solid-state lighting. Proceedings of the IEEE 97(3):481-510. March.
Darmstadter, J., J. Dunkerley, and J. Alterman. 1977. How Industrial Societies Use Energy: A Comparative Analysis. Johns Hopkins University Press, p. 189.
EIA (Energy Information Administration). 2006. Annual Energy Outlook 2006. DOE/ EIA-0383(2006). Washington, D.C.: Department of Energy, Energy Information Administration.
EIA. 2007. Annual Energy Outlook 2007. DOE/EIA-0383(2007). Washington, D.C.: Department of Energy, Energy Information Administration.
EIA. 2008a. Annual Energy Outlook 2008. DOE/EIA-0383(2008). Washington, D.C.: Department of Energy, Energy Information Administration.
EIA. 2008b. Annual Energy Review 2007. DOE/EIA-0384(2007); Washington, D.C.: Department of Energy, Energy Information Administration.
EIA. 2008c. Monthly Energy Review (April). Washington, D.C.: Department of Energy, Energy Information Administration.
EIA. 2009a. Annual Energy Review 2008. DOE/EIA-0384(2008); Washington, D.C.: Department of Energy, Energy Information Administration.
EIA. 2009b. Monthly Energy Review (June). Washington, D.C.: Department of Energy, Energy Information Administration.
EIA. 2009c. Monthly Energy Review (October). Washington, D.C.: Department of Energy, Energy Information Administration.
IEA (International Energy Agency). 2004. Oil Crises and Climate Challenges: 30 Years of Energy Use in IEA Countries. Paris, France: Organization for Economic Cooperation and Development.
Hinrichs, R.A., and M.H. Kleinbach. 2006. Energy: Its Use and the Environment, 4th Edition. Brooks/Cole Publishing Company.
Lave, L.B. 2009. The potential of energy efficiency: An overview. The Bridge 39(2):5-14.
NAS-NAE-NRC (National Academy of Sciences-National Academy of Engineering-National Research Council). 2009. America’s Energy Future: Technology and Transformation. Washington, D.C.: The National Academies Press.
Navigant Consulting, Inc. 2002. U.S. Lighting Market Characterization, Volume 1, National Lighting Inventory and Energy Consumption Estimates. Washington, D.C.: Department of Energy, Office of Energy Efficiency and Renewable Energy.
Schipper, L. 2004. International comparisons of energy end use: Benefits and risks. In Encyclopedia of Energy, Vol. 1. Elsevier.
Schurr, S., and B. Netschert. 1960. Energy in the American Economy, 1850-1975: An Economic Study of Its History and Prospects. Johns Hopkins University Press.
Tsao, J., M. Coltrin, and M. Crawford. 2009. Solid-state lighting: An integrated human factors, technology and economic perspective. Quantifying past and potential-future trajectories. Proceedings of the IEEE, forthcoming.
Weber, C. 2008. An Examination of Energy Intensity and Energy Efficiency. Green Design Institute, Carnegie Mellon University.


