
CHAPTER FOUR
Tsunami Detection and Forecasting
SUMMARY
An incoming tsunami may be anticipated in many ways, from direct human recognition of cues such as earthquake shaking or an initial recession of the sea, to technological warnings based on environmental sensors and data processing. This chapter reviews and evaluates the technological detection and forecasting capabilities of the U.S. tsunami warning centers (TWCs) paying specific attention to the infrastructure of the earth and ocean observation networks and to the data processing and tsunami modeling that occur at the TWCs. The next chapter discusses the centers’ operations, their human resources, and the infrastructure for their warning functions.
The initial decisions by the TWCs to issue an initial tsunami advisory, watch, or warning after an earthquake are based on analyses of data from a global seismic detection network, in conjunction with the historical record of tsunami production, if any, at the different seismic zones (see Weinstein, 2008; Whitmore et al., 2008 for greater detail on the steps taken). Although adequate for most medium-sized earthquakes, in the case of very large earthquakes or tsunami earthquakes1 the initial seismological assessment can underestimate the earthquake magnitude and lead to errors in assessing the tsunami potential (Appendix G). Far from the tsunami source, data from sea level networks provide the only rapid means to verify the existence of a tsunami and to calibrate numerical models that forecast the subsequent evolution of the tsunami. Near the source, a tsunami can come ashore before its existence is detected by the sparse sea level observation network.
Two separate U.S. TWCs monitor seismic activity and sea levels in order to detect tsunamis and warn of their presence. Based on their own data analysis, the TWCs independently decide whether to issue alerts to the emergency managers in their respective and complementary areas of responsibility (AORs). The TWCs must not only provide timely warnings of destructive tsunamis, but also must obviate needless evacuations that can cost money and even lives. An ideal warning would provide emergency managers with the necessary information to call for an evacuation in a timely fashion at any particular location in the projected tsunami path. The ideal product would also be clearly worded so that the general public easily understands the threat and who is affected by the threat. This information includes predictions of the time of arrival of the ocean waves, the duration of the occurrence of damaging waves, when the larg-
est wave is expected to arrive, the extent of the inundation and run-up, and the appropriate time to cancel the warning. Whether a call for evacuation is practicable, and how soon the “all clear” can be sounded, will depend on many factors, but especially on how soon the tsunami is expected to arrive and how long the damaging waves will continue to come ashore. Therefore, the warning system needs to be prepared to respond to a range of scenarios. They range from a near-field tsunami that arrives minutes after an earthquake to a far-field tsunami that arrives many hours after a triggering, distant earthquake yet lasts for many more hours due to the waves’ scattering and reverberation along their long path to the shore. In the case of the near-field tsunami, major challenges remain to provide warnings on such short timescales.
The committee concludes that the global networks that monitor seismic activity and sea level variations remain essential to the tsunami warning process. The current global seismic network is adequate and sufficiently reliable for the purposes of detecting likely tsunami-producing earthquakes. However, because the majority of the seismic stations are not operated by the TWCs, the availability of this critical data stream is vulnerable to changes outside of the National Oceanic and Atmospheric Administration’s (NOAA’s) control. The complex seismic processing algorithms used by the TWCs, given the available seismic data, quickly yield adequate estimates of earthquake location, depth, and magnitude for the purpose of tsunami warning, but the methodologies are inexact. Recommendations to address these two concerns fall under the following categories: (1) prioritization and advocacy for seismic stations; (2) investigation and testing of additional seismic processing algorithms; and (3) adoption of new technologies.
The tsunami detection and forecasting process requires near-real-time2 observations of tsunamis from both coastal sea level gauges and open-ocean sensors (such as provided by the Deep-ocean Assessment and Reporting of Tsunamis (DART) network). The committee finds that the upgrades enabled by the enactment of the Tsunami Warning and Education Act (P.L. 109-424) to both coastal sea level gauges and the DART network have significantly improved the capacity of the TWCs to issue timely and accurate tsunami advisories, watches, and warnings. Furthermore, these sensors provide researchers with the essential data to test and improve tsunami generation, propagation, and inundation models after the fact.
The new and upgraded DART and coastal sea level stations have closed significant gaps in the sea level observation network that had left many U.S. coastal communities subject to uncertain tsunami warnings. Although both sea level gauge networks have already proven their value for tsunami detection, forecasting, and model development, fundamental issues remain concerning gaps in coverage, the value of individual components of the network, and the risk to the warning capability due to coverage gaps, individual component failures, or failures of groups of components. Of special concern is the relatively poor survivability of the DART sta-
tions that currently average a little over one year before failure, compared to a four-year design lifetime. Additional open questions include dependence of U.S. tsunami warning activities on sea level data supplied by foreign agencies and on sea level data derived from U.S. and foreign gauges that do not meet NOAA’s standards for establishment, operation, and maintenance.
Looking to the future, the committee concludes that the numbers, locations, and prioritizations of the DART stations and coastal sea level gauges should not be considered static, in light of constantly changing fiscal realities, survivability experience, maintenance cost experience, model improvements, new technology developments, and increasing or decreasing international contributions. The committee finds of great value NOAA’s continual encouragement and facilitation of researchers, other federal and state agencies, and nongovernmental organizations (NGOs) who utilize their sea level observations for novel purposes. The committee believes that stations with a broad user base have enhanced sustainability.
The committee is optimistic that continued enhancements to the sea level monitoring component of the U.S. Tsunami Program can measurably mitigate the tsunami hazard and protect human lives and property for far-field events. The committee’s recommendations for the DART and coastal sea level gauge networks fall under the following categories: (1) assessment of network coverage; (2) station prioritization; (3) data stream risk assessment and data availability; (4) cost mitigation and cost prioritization; and (5) sea level network oversight.
Similar to open-ocean tsunami detection, tsunami forecast modeling has only recently become operational at the TWCs, as described below. The committee anticipates that further development and implementation of numerical forecast modeling methodologies at the TWCs will continue to help improve the tsunami warning enterprise.
As described below, the rapid detection of a tsunami striking within minutes to an hour, either for the purpose of providing an initial warning or for confirming any natural warnings that near-field communities have already received, will likely require consideration of alternative detection technologies, such as sensors deployed along undersea cabled observatories and coastal radars that can detect a tsunami’s surface currents tens of kilometers from the shore. Finally, examples of other new technologies and methodologies that have the potential to improve both estimation of earthquake parameters and tsunami detection are discussed at the end of this chapter.
DETECTION OF EARTHQUAKES
All initial tsunami warnings are based on rapid detection and characterization of seismic activity. Because of the fundamental differences in nature between the solid earth in which an earthquake takes place and the fluid ocean where tsunami gravity waves propagate, the vast majority of earthquakes occurring on a daily basis do not trigger appreciable or even measurable tsunamis. Nevertheless, some smaller earthquakes could trigger submarine landslides that can result in local tsunamis. It takes a large event (magnitude >7.0) to generate a damaging tsunami in the near-field and a great earthquake (magnitude >8.0) to generate a tsunami in the far-field. However, the generation of a tsunami is affected not only by the magnitude of an
earthquake, but also by material conditions at the source, such as source focal geometry, earthquake source depth, and water depth above the fault-rupture area.
Although estimating the size of a tsunami based on the magnitude of an earthquake has severe limitations (see Appendix G), the initial warning from a seismically generated tsunami is still based on the interpretation of the parent earthquake for several reasons:
-
most tsunamis are excited (or initiated) by earthquakes;
-
earthquake waves are easy to detect, and seismic instrumentation is available, plentiful, and accessible in near-real time (latencies of seconds to a few minutes);
-
most importantly, seismic waves travel faster than tsunamis by a factor of 10 to 50, thereby allowing an earthquake to provide an immediate natural warning for people who feel it while leaving time for instrumental seismology to trigger official warnings for coasts near and far from the tsunami source; and
-
earthquakes have been studied, and their sources are reasonably well understood.
Although most tsunamis result from earthquakes, some are triggered by landslides or volcanic eruptions. Technological warning of a tsunami that has been generated without a detectable earthquake will likely require detection of the tsunami waves themselves by water-level gauges.
Seismic Networks Used by the Tsunami Warning Centers
Both TWCs access the same extensive seismic networks that provide near-real-time information on earthquakes from around the world. Currently, about 350 independent channels of seismic data are monitored and recorded by the TWCs (National Oceanic and Atmospheric Administration, 2008a; Figure 4.1). Seismic networks that provide these data are operated and funded by many different agencies and organizations, including the U.S. Geological Survey (USGS), the National Science Foundation (NSF), the National Tsunami Hazard Mitigation Program (NTHMP), the UN Comprehensive Nuclear Test-Ban Treaty Organization (CTBTO), various universities in the United States, non-U.S. networks, and stations run by the Pacific Tsunami Warning Center (PTWC) and the West Coast/Alaska Tsunami Warning Center (WC/ATWC) themselves. Many of the networks used by the TWCs are part of the USGS/NSF Global Seismographic Network (GSN), which currently comprises more than 150 globally distributed, digital seismic stations and provides near-real-time, open access data through the Data Management System (DMS) of the Incorporated Research Institutions for Seismology (IRIS). The IRIS DMS also serves as the primary archive for global seismic data. GSN is a partnership between the NSF/IRIS and the USGS. The TWCs access seismic network data through dedicated circuits, private satellites, and the Internet.
The GSN is widely recognized as a high-quality network, having achieved global coverage adequate for most purposes, with near-real-time data access as well as data quality control and archiving (National Science Foundation, 2003; Park et al., 2005). GSN stations have proven
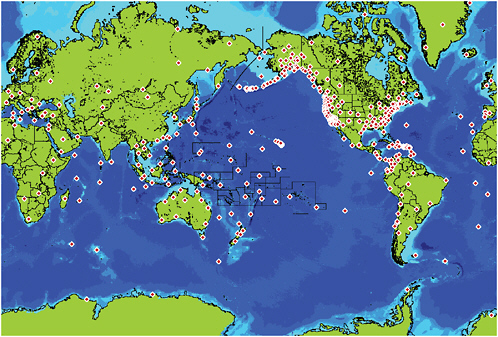
FIGURE 4.1 Data from approximately 350 seismic stations are accessed by the TWCs. SOURCE: West Coast/Alaska Tsunami Warning Center, NOAA.
to be reliable, with current (2009-2010) data return rates of 89 percent. The GSN is sufficiently robust to support warnings for events far from the recording devices and provides good global coverage (U.S. Indian Ocean Tsunami Warning System Program, 2007). The USGS was provided funding through the Emergency Supplemental Appropriations Act for Defense, the Global War on Terror, and Tsunami Relief, 2005 (P.L. 109-13) to expand and upgrade the GSN for tsunami warning. For redundancy, the TWCs also receive seismic data from many other vendors on multiple communication paths. Given the wide array of uses of the existing seismic networks, GSN can generally be viewed as a data network that is likely to be continued, well-maintained, and improved over the long-term. A future broad upgrade of seismometers in the GSN may be important for tsunami warning.
Nevertheless, the TWCs’ heavy reliance on data networks from partnering agencies exposes them to some degree of vulnerability to potential losses of data availability in the future. For example, much of the seismic data crucial to the operation of the TWCs comes from GSN stations whose deployment and maintenance have been and are currently funded primarily from NSF cooperative agreements with IRIS, renewable every five years. The Scripps Institution of Oceanography’s (SIO’s) International Deployment of Accelerometers (IDA) project with
NSF/IRIS funding operates 41 of the total 150 GSN stations through this mechanism. There can be no assurance that this funding will be sustained at current levels in the future. GSN stations have been operating since the mid-1980s (see Appendix G); much of their hardware is out of date and increasingly difficult to maintain. Operations and maintenance budgets regularly decrease and, except for events like the 2004 tsunami, modernization funds are generally not available to boost the data return rates including the necessary hardware. The more modern NSF EarthScope Transportable Array (with more than 400 telemetered broadband stations), for example, boasts data return rates in excess of 99 percent. Unfortunately, the TWCs could be among the most vulnerable of the IRIS clients in a constrained budget environment, because the TWCs are among the users needing some of the most remote seismic stations, which are difficult, hence expensive, to maintain.
To meet the requirements for detection of near-field tsunami events, the TWCs have supplemented existing seismic networks with their own local stations. The WC/ATWC maintains a network of 15 sites throughout Alaska, and most stations were upgraded to satellite communications and broadband seismometers after 2005 (National Oceanic and Atmospheric Administration, 2008a). The PTWC, in collaboration with other partners, is also working to enhance an existing seismic network in Hawaii to improve tsunami and other hazard detection capabilities through a Hawaii Integrated Seismic Network (Shiro et al., 2006).
NOAA’s Tsunami Program Strategic Plan (2009-2017; National Oceanic and Atmospheric Administration, 2008b) recommends that the TWCs “monitor critical observing networks, establish performance standards, and develop a reporting protocol with data providers” (e.g., the USGS and the NTHMP) and effect “complete upgrades of Alaska and Hawaii seismic … networks.” The committee agrees with these recommendations; however, to be strategic with limited resources, it is essential to determine and prioritize seismic stations that are critical to tsunami warning (e.g., oceanic stations in known tsunamigenic source regions or within 30º-50º from potential tsunami source areas to allow the more rapid determination of the tsunami potential).
Algorithms for Estimating an Earthquake’s Tsunami Potential
Once data from the seismic networks have been received, the data are analyzed by the TWCs to determine three key parameters for evaluating tsunamigenic potential: location, depth, and magnitude of an earthquake. Algorithms for determining the geographical location and depth of an earthquake source from seismic arrival times are based upon the concept of triangulation (U.S. Indian Ocean Tsunami Warning System Program, 2007). With the network of stations available to the TWCs, automatic horizontal locations are routinely obtained within a few minutes of origin time with accuracy on the order of 30 km. This is more than satisfactory to determine tsunami source locations, given the fact that earthquakes of such high magnitudes have much larger source areas. The three seismic parameters are used for issuing the initial bulletin. The focal mechanism characteristics are later obtained through moment tensor inversion of broadband seismic data if the data quality is adequate
(see below). In the present configuration of worldwide networks, the large number of available stations provides robust location determination, although losing a significant number of seismic stations could affect the accuracy of earthquake location and depth.
A great earthquake on a subduction thrust tends to nucleate beneath shallow water, or even beneath land in the case of the giant 1960 Chile and 1964 Alaska earthquakes. The source of such an earthquake, and of the ensuing tsunami, extends far beyond the earthquake’s point of nucleation (the hypocenter, on the fault plane; the epicenter, if projected to the earth’s surface). What matters for earthquake size, and for tsunami size as well, is the fault-rupture area, which extends seaward into deep water as well as coastwise. The hypocenter is much like the match that initiates a forest fire in which the damage depends on the total area burned. The tendency to instead equate an earthquake with its hypocenter contributed to confusion during the near-field tsunami from the February 27, 2010, Chilean earthquake of magnitude 8.8. Partly because this earthquake’s hypocenter was located near the coast, the Chilean government retracted a tsunami warning before the largest waves came ashore.
Depth determination is crucial to assessing an earthquake’s tsunamigenic potential because sources deeper than about 60 km generally pose no tsunami threat and are well resolved by location algorithms. Finer resolution of depth for shallower earthquakes remains a general seismological challenge, particularly in near-real time. This parameter can have some influence on the generation of tsunamis in the near-field; however, for far-field tsunamis generated by megathrust earthquakes, theoretical studies (Ward, 1980; Okal, 1988) have shown that the probability of tsunami excitation is moderate for depths less than 60 km. This somewhat paradoxical result reflects the fact that a shallower source may create a locally larger deformation of the ocean floor, but over a smaller area. This acts to compensate for the effect on the generation of the tsunami, which is controlled by the integral of the deformation over the whole ocean floor. Given the techniques and data available, the committee found that the location techniques used at the TWCs (Weinstein, 2008; Whitmore et al., 2008) were adequate in the context of tsunami warning.
Determining an earthquake’s magnitude is a more problematic aspect of the initial earthquake parameterization. The concept of magnitude is probably the most popular, yet most confusing, parameter in seismology. In simple terms, it seeks to describe the size of an earthquake with a single number. Reliable and well-accepted determinations of earthquake size (the “moment tensor solution”—or the product of fault area with the amount of slip) are possible, but these estimates are necessarily based on long-period surface waves arriving too late to be useful for tsunami warning, which strives for initial estimates within five minutes of the first measurements having been received. Most seismologists agree that it is not currently possible to predict how much of a fault will ultimately break based on the seismic waves propagating away from the point of nucleation (the epicenter), and that only when the slip ends can the true size or moment be inferred. For an event such as the Sumatra earthquake, the propagation of breakage along the fault surface alone takes nearly eight minutes (e.g., de Groot-Hedlin, 2005; Ishii et al., 2005; Lay et al., 2005; Tolstoy and Bohnenstiehl, 2005; Shearer and Bürgmann, 2010). Magnitudes determined at shorter times will necessarily underestimate the true size of the earthquake.
In this regard, the major challenge for tsunami warning is that tsunamis are controlled by the lowest frequency part of a seismic source, with periods of 500 to 2,000 seconds, whereas routinely recorded seismic waves have energy in the treble domain, with periods ranging from 0.1 to 200 seconds, exceptionally 500 seconds. In addition, seismic waves fall into several categories. Body waves travel through the interior of the earth at average velocities of 10 km/sec, take seconds to minutes to reach recording stations, and their high-frequency components are a good source of information. By contrast, surface waves travel around the surface at considerably slower speeds (3-4 km/sec) and take as much as 90 minutes to reach the most distant stations. The surface waves carry low-frequency signals; that is, the part of the spectrum most relevant to tsunami warning, although high-frequency body wave methods can also resolve event duration and rupture length (e.g., Ishii et al., 2005; Ni et al., 2005). For this latter case, the high-frequency body waves have not yet been exploited by the USGS’s National Earthquake Information Center (NEIC) or the TWCs. In short, the evaluation of earthquake size for tsunami warning faces a double challenge: extrapolating the trebles in the earthquake source to infer the bass, and doing this as quickly as possible to give the warning enough lead time to be useful.
Magnitudes can be obtained from various parts of the seismic spectrum, and expectedly such different scales have been “locked” to each other to quantify an earthquake with a single number. This is achieved through the use of “scaling laws,” which assert that the spectrum of a seismic source (the partitioning of its energy between bass and treble) is understood theoretically and can be estimated as a function of earthquake size. However, this universal character of scaling laws is far from proven, especially in its application to mega-earthquakes, which trigger the far-field tsunamis of major concern. In addition, scientists have identified a special class of generally smaller events, dubbed “tsunami earthquakes” by Kanamori (1972), whose source spectra systematically violate scaling laws (see Appendix G). Therefore, characterizing an earthquake source with a single number representing magnitude cannot describe all its properties, especially in the context of tsunami warning.
A detailed technical review of these topics is given in Appendix G, and the special case of tsunami earthquakes is reviewed in Appendix H. A summary of the conclusions of Appendix G are:
-
Classical magnitudes routinely determined by conventional seismological methods are inadequate for tsunami warning of great and mega-earthquakes.
-
The authoritative measurement of earthquake size, the moment tensor solution, is based on normal modes and long-period surface waves arriving too late to be used for tsunami warning.
-
The TWCs currently use an algorithm named Mwp which integrates the long-period components of the first arriving P-waves to infer the low-frequency behavior of the seismic source.
-
PTWC has recently implemented the use of the “W-phase” algorithm as well as the Mwp algorithm.
Although the use of Mwp is satisfactory for the majority of the (small, non-tsunamigenic, and medium) events processed, Mwp has very serious shortcomings in its application to great earthquakes (magnitude greater than 8.0), to mega-earthquakes (magnitude greater than 8.5; Appendix G), and to the anomalous tsunami earthquakes (Whitmore et al., 2002; Appendix H).
Thus, the committee is concerned that the TWCs have relied on a single technique applied without sufficient attention to its limitations discussed above. Other approaches are presently being studied including the “W-phase” algorithm, which could eventually be implemented after both the theoretical and operational bases of the approach are established and the limitations of current technologies are understood (Appendix G). Improvements are urgently needed for the determination of the tsunami potential of mega- and tsunami earthquakes.
Potential Use of Earthquake Alerts from the NEIC
While NOAA and the NTHMP lead the efforts relevant to tsunamis, the USGS and the National Earthquake Hazards Reduction Program (NEHRP) lead the efforts in research and reducing impacts from earthquakes. The USGS’ Earthquake Hazard Program provides and applies earthquake science information to mitigate potential losses from earthquakes. This separation in mission runs the risk of developing tsunami efforts that neglect the earthquake hazard within NOAA and vice versa within the USGS.
One service the USGS provides through its NEIC is to rapidly determine the location and size of earthquakes around the world. The NEIC in Golden, Colorado, derives initial solutions, not made public, within seconds after arrival of the seismic data. The NEIC monitors the GSN and other stations and produces accurate seismic analysis within minutes of an event, which it disseminates to a broad range of customers (national and international agencies, academia, and the public). In a development that may influence the methods and roles of the TWCs, U.S. seismology is on the verge of being able to warn of earthquakes while they are still under way. The drive toward such earthquake early warning includes the NEIC. USGS sources say that the NEIC, which began operating 24/7 in January 2006, plans to support this warning function by developing a back-up center at a site other than Golden. At present, the two TWCs do not use the epicentral, hypocentral, or magnitude estimate provided by the NEIC. Instead, each TWC uses its own mix of seismic processing algorithms and as described above develops its own seismic solutions. The TWCs may correct their initial estimates, which are often made public faster than the NEIC’s solutions, to be more consistent with the NEIC’s solutions and at times confer with NEIC staff during an event to ensure consistency. With the availability of the new tsunami forecasting methods and sea level observations (as described below), the TWCs rely more on sea level data and numerical models than on details of earthquake parameters after the issuance of the initial warning product. Therefore, the committee discussed whether it remains necessary for the TWCs to run their own independent seismic analysis. For the forecast models, the TWCs require little more than location, rough magnitude, and time of the event, which could come directly from the NEIC.
The TWCs in-house analysis offers the benefit of obtaining solutions much faster than the NEIC’s publicly available solution, which might take tens of minutes longer. In addition, the TWCs’ assessment of the tsunami potential of any given earthquake depends on knowing the depth of the earthquake and the earthquake’s geometry, neither of which are as high of a priority for the NEIC.
Regardless, there are many benefits to leveraging research and development at the TWCs and the NEIC and to more broadly find synergies in the tsunami and earthquake hazard reduction programs.
Conclusion: The current global seismic network is adequate and sufficiently reliable for the purposes of detecting likely tsunami-producing earthquakes. Because the majority of the seismic stations are not operated by the TWCs, availability of this critical data stream is vulnerable to changes outside of NOAA’s control. Furthermore, as discussed in Appendix G, many of the STS-1 seismographs in the GSN are now more than two decades old, and because the STS-1 is no longer manufactured, spares are not available.
Recommendation: NOAA and the USGS could jointly prioritize the seismic stations needed for tsunami warnings. These needs could be communicated with partner agencies and organizations to advocate for upgrading and maintenance of these critical stations over the long-term.
Conclusion: The complex seismic processing algorithms used by the TWCs, given the available seismic data, quickly produce adequate estimates of earthquake location, depth, and magnitude for the purpose of tsunami warning. The methodologies are inexact, partly because of the physically variable nature of tsunami-generating earthquakes (one model does not fit all), and partly because of the need for rapid determination of earthquake parameters that may not be certain until the entire rupture process is complete (potentially minutes). For example, the methodologies applied by the TWCs do not properly reflect the tsunami-generating potential of mega-earthquakes or tsunami earthquakes.
Conclusion: In parallel with their own analyses, staff at the TWCs and at the Tsunami Program could avail themselves of earthquake locations and magnitudes that are estimated within minutes of an event from the USGS’s NEIC. An interagency agreement could be established to make these initial estimates available on secure lines between the USGS and NOAA.
Recommendation: Among the methodologies employed by the NEIC is the W-phase algorithm for estimating earthquake magnitude. The committee recommends that the TWCs work jointly with the NEIC to test the potential utility of the W-phase algorithm in the tsunami warning process, using both a sufficient dataset of synthetic seismograms and a set of waveforms from past great earthquakes, paying particular attention to the algorithm’s performance during tsunami earthquakes and to the assessment of a lower-magnitude bound for its domain of applicability.
DETECTION OF TSUNAMIS WITH SEA LEVEL SENSORS
Because the seismic signal is the first observation available to the TWCs, seismic detection provides the basis for the initial evaluation of the potential for a tsunami. The decision about the content of the first message from the TWCs is based solely on seismic parameters and the historical record, if any, of tsunamis emanating from the neighborhood of the earthquake. However, as previously noted, this indirect seismic method is limited in the accuracy of its estimates of the strength of the tsunami, usually underestimating the tsunami potential of large earthquakes and tsunami earthquakes. In acknowledgment of this bias, and because forecasters must err on the side of caution when human lives may be at stake, the TWCs use conservative criteria to trigger advisories, watches, or warnings based on this initial seismic assessment (e.g., Weinstein, 2008), as seen in the PTWC’s far-field forecast of the tsunami from the Chilean earthquake of February 27, 2010 (Appendix J). However, these conservative assessments might cause unwarranted evacuations, which can cost millions of dollars and might threaten lives. A TWC must, therefore, not only provide timely warning of a destructive tsunami, but also must avoid causing unnecessary evacuations with their attendant negative impacts.
The detection and forecasting process requires real-time observations of tsunamis from both coastal sea level gauges and open-ocean sensors (such as provided by the DART stations). The combination of the open-ocean and coastal sea level stations, which provide direct observations of tsunami waves, are important for adjusting and canceling warnings as well as for post-tsunami validation of models of the tsunami propagation and inundation (U.S. Indian Ocean Tsunami Warning System Program, 2007). These sea level networks can also detect tsunamis from sources that fail to generate seismic waves or are generated by an earthquake on land that generates a sub-aerial and/or a seafloor landslide. Progress to expand the ocean observing network and advances in oceanographic observing technologies allow the TWCs to incorporate the direct oceanographic detection of tsunamis into their decision processes.
Conclusion: An array of coastal and open-ocean sea level sensors is necessary until such time, in some distant future, when the capability exists of observing the entire tsunami wave-front in real-time and with high horizontal resolution (e.g., perhaps with satellites) as it expands outward from its source and comes ashore.
The Tsunami Warning Decision Process Before and After Enactment of Public Law 109-424
A majority of the funds authorized by the Tsunami Warning and Education Act (P.L. 109-424) have been used to manufacture, deploy, and maintain an array of 39 DART stations (not counting the 9 purchased and deployed by foreign agencies; http://www.ndbc.noaa.gov/dart.shtml), establish 16 new coastal sea level gauges, and upgrade 33 existing water level stations (National Tsunami Hazard Mitigation Program, 2008; http://tidesandcurrents.noaa.gov/1mindata.shtml). All these new and upgraded sea level stations, especially the DART sites, have
closed large gaps in the sea level observation network that had left many U.S. coastal communities subject to uncertain tsunami warnings. Among TWC personnel and tsunami warning researchers, it is common to find sentiments echoing the following statement in Whitmore et al. (2008): “Since 2005, the amount and quality of both tide gage data and DART data [have] greatly improved. These data are critical to verify the existence of tsunamis and to calibrate models used to forecast amplitudes throughout the basin. Depending on the source location, it can take anywhere from 30 minutes to 3 hours to obtain sufficient sea level data to provide forecasts for wave heights outside the source zone, or to verify that no wave has occurred and cancel the alert. Within the AOR, upgraded sea level networks have dropped the verification time to 30 minutes in some regions.”
The implementation of the EarthVu tsunami forecast system and the Short-term Inundation Forecasting for Tsunamis (SIFT) system into the TWCs (e.g., Weinstein, 2008; see Section Forecasting of a Tsunami Under Way) places additional emphasis on the importance of the proper operation of the sea level stations, especially the open-ocean DART stations whose sea level observations of the tsunami waves are not distorted by bathymetric irregularities and local harbor resonances that affect the coastal sea level observations. With these models and data from the sea level networks, it has become possible to make reasonably accurate predictions of the amplitude of the first tsunami wave that arrives at a given shoreline, enabling the issuance of more timely and more spatially refined watches and warnings (e.g., Titov et al., 2005; Geist et al., 2007; Whitmore et al., 2008).
Furthermore, the array of DART stations, when properly functioning, enables unique and important capabilities for both tsunami detection and forecasting as described below. Whether the current DART and coastal sea level networks are sufficient for both rapid detection of tsunamis and accurate tsunami forecasting with respect to all U.S. coastal territories is addressed below.
Conclusion: The expansion and upgrades to the DART and coastal sea level network have closed large gaps in the sea level observation network that had left many U.S. coastal communities subject to uncertain tsunami warnings. These enhancements to the detection system have significantly improved the TWCs ability to detect and forecast tsunamis in a timely and more accurate fashion.
Conclusion: Based on the analysis described below, the coastal and DART sea level gauge networks have proven their value for the forecasting and warning of far-field tsunamis, especially when coupled with numerical propagation and inundation models.
Conclusion: Despite the improvements in detection and forecasting, some fundamental issues remain concerning gaps in coverage, the value of individual components of the network, and the risk to the warning capability due to the gaps and from individual component failures, or failures of groups of components.
The Economic Value of the DART Network
Although the foremost concern for emergency responders is the protection of human lives in the event of large tsunamis, another significant value of the DART stations is to provide assurance that a large wave has not been generated by a seismic event, permitting an initial watch or warning to be canceled expeditiously. Thus, the DART stations help to prevent unnecessary public concern and economic disruption.
Two estimates of economic benefits have been derived for Hawaii. In one, the cost of a needless evacuation in the state of Hawaii was put at $58.2 million in 1996 dollars (Hawaii Research and Economic Analysis Division, 1996, cited in Bernard, 2005). A second estimate is based on nearly identical earthquakes off the Aleutian Islands before and after the existence of the DART network. On May 7, 1986 (pre-DART), a magnitude 8.0 earthquake near the Aleutian Islands precipitated a full coastal evacuation in Hawaii at an estimated cost of $30-$40 million in lost productivity, emergency provider expenses, and other costs (Hawaii Research and Economic Analysis Division, 1996; National Science and Technology Council, 2005), yet tsunami amplitudes did not exceed 0.6 m. On November 17, 2003, a DART station offshore of the Aleutian Islands clearly showed that a sizable tsunami was not generated by a magnitude 7.8 earthquake in a similar location near the Aleutian Islands, and the watch was canceled (the subsequent maximum tsunami height reached only 0.33 m in Hawaii). Adjusting the 1986 figure for inflation, the cost to Hawaii’s government and businesses in 2003 could have been $70 million had an evacuation been ordered. These findings are consistent with cost estimates associated for unnecessary hurricane evacuations along the U.S. coastline between Maine and Texas (Centrec Consulting Group, LLC, 2007).
Clearly, unwarranted evacuations can cost millions of dollars; and, although the costs associated with the loss in public confidence are less easy to quantify, the effectiveness of a warning system is ultimately grounded in credibility. Therefore, a tsunami warning system should not only provide timely warning of a destructive tsunami, but also should avoid issuing “false alarms.”
Although the DART stations have their greatest value in discerning tsunami propagation characteristics in the open ocean, the inundation problem requires, ideally, sea level sensors along tsunami-prone coastlines because of the spatial variations in tsunami height that are produced by local bathymetry, coastal geometry, and the resultant system responses (e.g., coastal and harbor resonances).
Description of the Coastal Sea Level Gauge Network
Although coastal sea level stations were originally installed for monitoring tides for navigational purposes, most now serve a broad range of uses (including tsunami detection) that have contributed to their continued support and upgrades. Stations are commonly located deep within harbors or bays, where nonlinear hydrodynamic effects and local geographic complexity strongly alter the structure and amplitude of any impinging tsunami waveform. These non-
linear effects hamper the determination of open-ocean tsunami wave parameters (e.g., Titov et al., 2005) without eliminating the stations’ utility for the TWCs (e.g., Whitmore, 2003).
Tide stations were typically configured to measure sea level height in a stilling well, a vertical pipe that is secured to a piling, pier, wharf, or other shore-side structure. These pipes have a small orifice(s) to allow water to enter relatively slowly thus filtering out the short period (3-30 seconds) wind waves, and even tsunamis, so that the hourly recorded sea level values from within the pipe are not aliased by the short period variability. This technology works well for measuring tides and other long period phenomena, but even if the sampling rate is increased from hourly to minutes the true tsunami signal may not be well observed given these filtering effects. Furthermore, a large tsunami can overtop a well and render it useless in extreme events. Consequently, sea level observations intended for tsunami detection are now often accomplished inside a tsunami-hardened station equipped with a rapid-sampling pressure, acoustic, or microwave sensor with an orifice set apart from the structure (National Tsunami Hazard Mitigation Program, 2008).
The most important roles for coastal sea level data in the tsunami forecasting and warning process are currently the initial detection of a tsunami, scaling the tsunami forecast models in near-real time, and post-tsunami validation of tsunami models (see Weinstein, 2008; Whitemore et al., 2008). These roles require accurate, rapidly sampled sea level observations delivered in near-real time via an appropriate telemetry system. In practice, these requirements translate into a need for sea level averages at least as often as every minute that are made available in near-real time (U.S. Indian Ocean Tsunami Warning System Program, 2007), and a need for assiduous maintenance of the sea level gauges so that near-real-time data can be trusted and will be available most of the time. Furthermore, subsequent to collection, the data need to be carefully processed through a set of rigorous quality control procedures to maximize the value for model validation after the fact (U.S. Indian Ocean Tsunami Warning System Program, 2007). As an example of the importance of high temporal data resolution, Figure 4.2 shows how sea level data sampled every six minutes completely missed the largest component (the third crest and trough) of the Kuril Islands tsunami of November 15, 2006 (the modeled wave heights of which are shown in Figure 4.3).
Coastal sea level data used by the TWCs originate from a number of different networks (PTWC, WC/ATWC, National Ocean Service (NOS), and University of Hawaii Sea Level Center (UHSLC)), which are maintained by various national and international organizations (Figure 4.4).
Ideally, these stations are maintained to the standards listed in the Tsunami Warning Center Reference Guide (U.S. Indian Ocean Tsunami Warning System Program, 2007) for sea level stations that are intended to provide data for tsunami warning. For coastal tide gauge stations, the requirements are:
-
independent power and communications, for example, solar and satellite;
-
fault-tolerant redundant sensors (multiple sensors for tsunami, tides, and climate);
-
local logging and readout of data (local back-up of data);
-
warning center event trigger (ramping up of sampling rate and transmission upon detection of a tsunami);
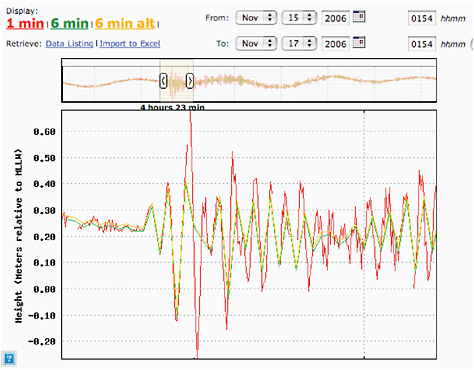
FIGURE 4.2 Sea level data from Midway Island for a short time period encompassing the arrival of the November 15, 2006, Kuril Island tsunami. One-minute samples are shown in red; two different gauges providing 6-minute samples are shown in green and orange. Note that the 6-minute samples completely miss the highest amplitude component (the third crest and trough) of the tsunami. SOURCE: http://co-ops.nos.noaa.gov/tsunami/; NOAA.
-
establishment of a system of surveying benchmarks;
-
locating gauges in protected areas that are responsive to tsunamis, such as wide-mouthed harbors (sustainability and filtering); and
-
standard sampling of 1-minute averages and a continuous 15-minute transmission cycle via the World Meteorological Organization’s (WMO) Global Telecommunications System (GTS) to the Japan Meteorological Agency (JMA), PTWC, and other appropriate warning centers/watch providers.
NOS Sea Level Stations for Tsunami Detection
In the several decades leading up to 2004, NOAA’s NOS Center for Operational Oceanographic Products and Services (CO-OPS; http://tidesandcurrents.noaa.gov/) operated long-
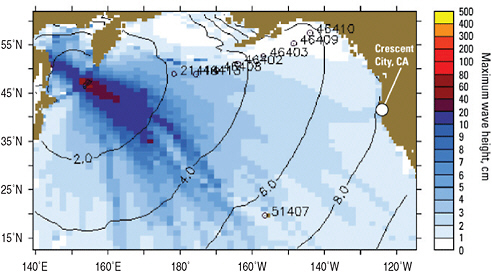
FIGURE 4.3 North Pacific Ocean, showing predicted maximum wave heights (indicated by color) and arrival times (contour lines labeled with numbers representing hours after the triggering earthquake) of tsunami waves generated by a magnitude 8.3 earthquake near the Kuril Islands on November 15, 2006. The predicted wave heights illustrate the phenomenon of “tsunami beaming”—the tendency of tsunami waves in the open ocean to be highest along azimuths approximately perpendicular to the subduction zone where the triggering earthquake occurred. Note the minor beam aimed at Crescent City, California, where the boat harbor was damaged, largely by secondary tsunami waves. SOURCE: Geist et al., 2007; with permission from Vasily Titov, NOAA/PMEL.
term tide stations, and the National Weather Service (NWS) utilized the data to support the national tsunami warning system. However, following the devastating 2004 Indian Ocean tsunami, and with the support authorized in P.L. 109-424, CO-OPS began a system-wide up-grade of its instrumentation. This upgrade increased the rate of data collection to 15-second and 1-minute sampling (National Tsunami Hazard Mitigation Program, 2008) and increased the rate of transmission (to every 6 minutes) at its coastal National Water Level Observation Network (NWLON; http://tidesandcurrents.noaa.gov/nwlon.html) stations. The increased data sampling and transmission rates advance the objectives of tsunami detection and warning, as well as to provide critical inundation model input. In addition to upgrading equipment at 33 existing long-term NWLON stations, CO-OPS collaborated with the TWCs and the Pacific Marine Environmental Laboratory (PMEL) to establish 16 new tide stations at high-priority locations in Alaska, the Pacific Islands, the U.S. West Coast, and the Caribbean, increasing the geographic coverage of water level observations in tsunami-vulnerable locations. This initiative was completed in 2007 (National Tsunami Hazard Mitigation Program, 2008; http://tidesandcurrents.noaa.gov/1mindata.shtml).
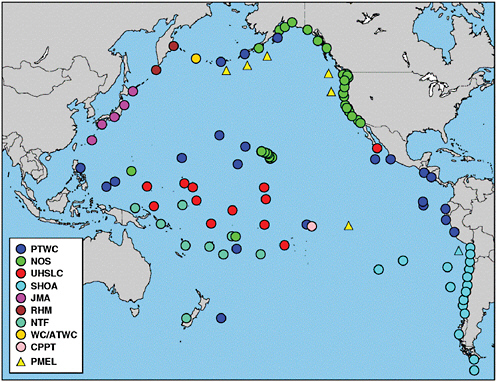
FIGURE 4.4 Map of the coastal sea level stations in the Pacific basin that provided sea level data at sufficient temporal resolution and quality for use in the PTWC’s tsunami detection activities in 2008. Color codes indicate the authorities responsible for gauge maintenance. U.S. authorities include PTWC, WC/ATWC, NOS, and UHSLC. Non-U.S. authorities include the following: Centre Polynésien de Prévention des Tsunamis (CPPT; France); Servicio Hidrográfico y Oceanográfico de la Armada de Chile (SHOA); Japan Meteorological Agency (JMA); ROSHYDROMET (RHM; Russia); and National Tidal Facility (NTF; Australia). The positions of the original six DART buoys (yellow triangles) existing in 2005 before the enactment of P.L. 109-424 are also displayed. SOURCE: Weinstein, 2008; Pacific Tsunami Warning Center, NOAA.
At the current time, CO-OPS operates tide stations on all U.S. coasts in support of tsunami warning. Upgraded tide stations are equipped with new hardware and software to enable the collection and dissemination of 1-minute water level sample data. The TWCs can receive this data in near-real time either via Geostationary Operational Environmental Sattelites (GOES) over the National Weather Service Telecommunication Gateway (NWSTG) or via the Tsunamis Stations’ website (http://tidesandcurrents.noaa.gov/tsunami/). Although near-real-time data are not subjected to the National Ocean Service’s quality control or quality assurance procedures and do not meet the criteria and standards of official National Ocean Service data, the stringent maintenance procedures for the NWLON stations maximize the
probability of a reliable data stream in near-real time. In addition to having access to raw water level data via satellite transmission, CO-OPS collaborated with the TWCs to develop a webpage (http://co-ops.nos.noaa.gov/1mindata.shtml) to disseminate 1-minute water level data. This webpage allows users to view both 6- and 1-minute data numerically or graphically for all tsunami-capable tide stations in increments of up to 4 days (Figure 4.2 is one example). Like the near-real-time data, all water level data displayed through the CO-OPS tsunami webpage are raw and unverified at this time. However, verified 6-minute sea level data are available through another website (http://tidesandcurrents.noaa.gov/station_retrieve.shtml?type=Historic+Tide+Data), usually within 2 months of collection, which enables the user to easily evaluate the quality of the 1-minute data, although well after the occurrence of the tsunami. The 15-second data, potentially more useful for model validation, are not telemetered on a regular basis, but are available to the TWCs via remote phone dial-in.
The NOAA/NOS has developed and rigorously follows a set of standards for the establishment, operation, and maintenance of its critical NWLON coastal sea level stations. As well, NOAA describes in its Tsunami Warning Center Reference Guide (U.S. Indian Ocean Tsunami Warning System Program, 2007) the performance and maintenance standards it recommends for sea level stations that are intended to aid tsunami detection, forecasting, and warning activities. Unfortunately, the high-quality NOS NWLON stations make up only a small portion of all the sea level observation stations needed for tsunami detection (Figure 4.4). Whether sea level gauges operated and maintained by other U.S. agencies satisfy, or can be upgraded to, the standards of the NWLON stations, or whether these other U.S. stations should be operated and maintained under the NWLON program, are questions that remain unanswered. In addition, the committee is not aware of any process by which the non-NOS sea level stations (U.S. or international) are evaluated or certified relative to these standards. How much of a risk occurs as a result of the TWC’s reliance on un-certified sea level gauges is not known.
The University of Hawaii Sea Level Center (UHSLC) Stations
The UHSLC (http://ilikai.soest.hawaii.edu/) maintains and/or operates a worldwide array of sea level observing stations, some of which are employed in the tsunami detection and warning process (for the Pacific Ocean, see Figure 4.4). The UHSLC is a research facility of the University of Hawaii/NOAA Joint Institute for Marine and Atmospheric Research (JIMAR) within the School of Ocean and Earth Science and Technology (SOEST). The mission of the UHSLC is to collect, process, distribute, and analyze in-situ sea level gauge data from around the world in support of climate research. Primary funding for the UHSLC comes from NOAA’s Office of Global Programs (OGP). In recent years, the UHSLC, recognizing the potential importance of its stations to tsunami hazard mitigation, has upgraded many of its stations to short period sampling and reporting (http://ilikai.soest.hawaii.edu/RSL1/index.html).
Because of the UHSLC’s climate research mission, which includes ascertaining the small (typically, 1-3 mm) annual sea level rise associated with global warming, the UHSLC strives for high operational standards and data quality. It is not known whether the UHSLC’s operational standards meet or exceed the NOS NWLON maintenance standards.
TWC Sea Level Stations
The TWCs operate a small subset of coastal tide stations (Figure 4.4). The WC/ATWC operates seven stations along southern Alaska and the Aleutian Islands with data being archived for public use at National Geophysical Data Center (NGDC) (http://wcatwc.arh.noaa.gov/WCATWCtide.php). The PTWC stations are distributed throughout the Pacific and Hawaii. In Hawaii, PTWC maintains 14 sea level gauges solely for local predictive and diagnostic value; the data from these gauges are archived under separate NOAA support (http://ilikai.soest.hawaii.edu/arshsl/techrept/arshsl.html). In general, the TWC stations are not maintained to the specifications of the NWLON but have historical precedence and fill gaps in the observing array or fill specific local needs. For example, the PTWC gauges on the Big Island of Hawaii will provide about 20 minutes of warning for Honolulu should a large amplitude tsunami be generated by an earthquake or landslide on the Big Island. The TWCs have indicated they do not have the resources to properly maintain these gauges or to process, distribute, and archive the data.
International Sea Level Stations
The Intergovernmental Oceanographic Commission (IOC) Global Sea Level Observing System (GLOSS) has about 290 stations worldwide, and many are configured for near-real-time reporting of rapidly sampled data relevant to tsunami applications. After the Indian Ocean tsunami of December 26, 2004, the IOC established a centralized Sea Level Station Monitoring Facility (http://www.vliz.be/gauges/), where most of the needed, rapidly sampled coastal sea level observations are now available and reported in near-real time over the World Meteorological Office’s (WMO’s) Global Telecommunications System (GTS). The website serves as a central clearinghouse of data from a range of international providers, including the data sources mentioned above. The objectives of this service are to provide information about the operational status of global and regional networks of near-real-time sea level stations and to provide a display service for quick inspection of the raw data stream from individual stations.
Since 2007, the Sea Level Station Monitoring Facility (SLSMF) also has the information necessary to determine data stream reliability. SLSMF is an appropriate place to obtain such reliability information because it lists only data that were initially made available in near-real time over the GTS, not what was eventually available after internal memory was finally accessed during a maintenance operation. The sea level data that the TWCs employ in their tsunami detection activities and which are acquired via the GTS are essentially the same data now disseminated and archived at SLSMF, excluding the TWCs’ own stations discussed above. As with the data received by the TWCs via the GTS after a tsunami-producing earthquake, the data flowing through SLSMF are not quality controlled, but the website provides additional metadata for most of the non-U.S. stations. To the committee’s knowledge, the level of adherence of international stations used by the TWCs to either NWLON or Tsunami Warning Center Reference Guide (U.S. Indian Ocean Tsunami Warning System Program, 2007) performance and maintenance standards has not been determined.
Adequacy of the Geographical Coverage of the Coastal Sea Level Gauge Network
Following the disastrous 2004 Indian Ocean tsunami, many additional global sea level observing stations have become available for the purpose of tsunami detection and warning, including those enabled in the United States by P.L. 109-424. Despite this increase in the number of near-real-time-reporting, rapid-sampling coastal sea level gauges, a map of the sea level station coverage (e.g., Figure 4.4 for the Pacific Ocean) reveals that large regions with no coverage remain, such as Central America and southern Mexico, the Kuril Islands north of Japan, and most of the Caribbean Islands, as pointed out previously (Bernard et al., 2007). In addition, this dependence on data supplied by foreign agencies, although mitigated somewhat by the redundancies and overlaps in coverage, exposes a vulnerability of the tsunami detection and warning activities to potential losses in data availability.
A recent earthquake in the Caribbean illustrates the issue of coverage. On May 27, 2009, a magnitude 7.3 earthquake occurred off the coast of northern Honduras. Eight minutes after the earthquake, the PTWC issued a Tsunami Watch for Honduras, Belize, and Guatemala. Worst-case-scenario tsunami forecast models suggested tsunami amplitudes up to nearly 1 m given initial earthquake source parameters. No rapidly sampled, near-real-time sea level gauges exist in the western Caribbean, so the PTWC could only wait for visual reports. After 74 minutes, the PTWC canceled the watch based on the following, in the PTWC’s own words: “ … This center does not have access to any real-time sea level gauges in the region that would be used to quickly detect and evaluate the tsunami if one were present. However, enough time has passed that any nearby areas should already have been impacted. Therefore, this center is canceling the tsunami watch it issued earlier” (Pacific Tsunami Warning Center Message, May 27, 2009).
Gaps in the coastal sea level network exist, such as revealed by the Honduran earthquake in May 2009. No analysis has been undertaken to evaluate critical coverage gaps with regards to the tsunami warning decision process. Furthermore, no analysis has been undertaken to determine the relative importance of each existing coastal sea level gauge to the tsunami warning decision and evacuation decision processes. Although there is some degree of redundancy in coverage in the current sea level gauge network for some purposes, there has been no evaluation of the associated risk and the vulnerability of the warning process to failures of single or multiple stations.
The spacing of sea level gauges for the purpose of tsunami detection is sparse, because it is now known that tsunamis can be quite directional, focusing the majority of their energy within a narrow sector, perpendicular to the seafloor rupture direction. For instance, Figure 4.3 displays the modeled beam pattern of a small tsunami generated by a large (magnitude 8.3) Kuril Islands earthquake on November 15, 2006. Given the array of sea level gauges in Figure 4.4, it is obvious that the maximum amplitudes of this tsunami were not observed in near-real time. Because DART stations were not yet in place off the Kuril Islands, only the Midway Island (28.2° N, 177.4° W) station at the far northwest end of the Hawaiian archipelago provided significant advance notice to forecasters of the possible size of the tsunami at the main Hawaiian Island to the southeast. Had the Midway Island station been temporarily inoperative, forecasters
would have been forced to issue a warning at Hawaii, given the magnitude of the earthquake, with a subsequent costly and time-consuming evacuation of coastal zones. As it was, the Midway Island record confirmed that the tsunami was not going to significantly threaten lives or property in the main Hawaiian island, and no evacuation order was issued.
After a similar Kuril Island earthquake on October 4, 1994, the lack of direct confirmation of the existence of a tsunami (including lack of high-resolution sea level data from the temporarily inoperative Midway Island station) resulted in the issuance of a warning that precipitated an unnecessary evacuation of Hawaii’s coastal zones.
Although many gaps exist in the sea level network for rapid tsunami detection, limitations in U.S. and international resources preclude immediate closure of all gaps, and some of these gaps are more important than others. A sophisticated analysis is needed to evaluate critical coverage gaps for coastal sea level gauges to inform the warning decision process. Ideally, such a study would include an evaluation of a region’s tsunami-producing potential, sensitivity analysis of source location, tsunami travel time, local population density, timing for initial warning versus evacuation decision process for communities at risk, and warning/evacuation time gained for additional station coverage. Such an analysis could also determine the relative importance of each existing coastal sea level gauge to the tsunami warning decision and evacuation decision processes. Although there is some degree of redundancy in coverage in the current sea level gauge network, there has been no evaluation of the associated risk and the vulnerability of the system to failures of single or multiple stations. It is possible that isolated gauges near historically tsunami-producing seismic zones would be considered highly important, while individual gauges among a relatively compact group of gauges might be considered less important (although the need for at least one gauge within the group might be considered highly important). Such an assessment of the relative importance of existing gauges could then be the basis of prioritization for maintenance schedules and enhancement opportunities, and for the identification of critical stations that are not under U.S. control and may require augmentation with new U.S. gauges as well as operations and maintenance support.
In order to mitigate the cost of enhancing and maintaining tsunami-useful sea level monitoring stations, the U.S. Tsunami Program could continue coordinating with other programs interested in monitoring sea level variability for other purposes, such as climate variability. Sea level stations maintained by the NOS, UHSLC, etc., have evolved from their primary missions to include higher sampling and reporting rates to serve the tsunami community. Coastal stations with a broad user base have enhanced sustainability.
Reliability of the Coastal Sea Level Gauge Network
International coastal sea level networks vary greatly in station density, transmission rates, and data quality. Improved near-real-time international sea level data observations are crucial to proper TWC response for events distant to U.S. territories, and are necessary for the TWCs to provide advice to their international customers.
Recommendation: Two important concerns regarding the entire coastal sea level network employed by the TWCs in their warning activities need to be addressed soon, as follows:
-
A priority list of the coastal sea level stations should be constructed, based at first on the experience of the TWC forecasters, and later updated from the results of the more objective coverage analysis described in the previous section.
-
A risk assessment of the data flow from the highest priority stations should be performed.
U.S. or international stations deemed high priority with a high risk that the data flow could be interrupted for more than very short periods of time should thereafter be carefully monitored and, if possible, upgraded by the appropriate authority (national or international) to meet all requirements for a tsunami monitoring sea level station that are listed in the Tsunami Warning Center Reference Guide (U.S. Indian Ocean Tsunami Warning System Program, 2007). As an example of prioritization, note that as of June 26, 2009, all five DART stations covering the Aleutian Islands west of the Dateline, and the Kuril Islands to Hokkaido, had been inoperative for nearly all of 2009. Such failures meant that the Midway Island coastal station at 28.2° N, 177.4° W, was the only sea level station that forecasters had available during the first six months of 2009 to evaluate whether a tsunami created in the Kuril Island, and directed toward the southeast (e.g., Figure 4.3), was bearing down on Hawaii. Therefore, the Midway Island station is a strong candidate for high-priority status.
Compliance with the Reference Guide’s recommendations would be a good starting point for assessing the risk in the data flow from each high-priority sea level station. Much of the needed information is now available at the IOC’s SLSMF (http://www.vliz.be/gauges/) discussed previously. SLSMF also has the information needed to determine data stream reliability, at least since 2007. SLSMF is actually a very appropriate place to obtain such reliability information because it lists only data that was initially made available in near-real time over the Global Telecommunications System, not what was eventually available after internal memory was finally accessed during a maintenance operation.
Coastal Sea Level Data Processing
In January 2008, NTHMP issued a report (National Tsunami Hazard Mitigation Program, 2008) intended to identify vulnerabilities in the U.S. environmental data streams needed by the TWCs to effectively detect tsunamis and make accurate tsunami forecasts. The data streams under consideration included, among others, sea level data from DART buoys and from U.S. coastal gauges. The committee identified findings in NTHMP (2008) with respect to processing, distribution, archiving, and long-term access to tsunami-relevant sea level data that remain highly relevant today including the following issues:
-
There is currently no routine acquisition of the 15-second CO-OPS data, which are most relevant for model validation, and there is no routine retention of these data.
-
Fifteen-second data are only collected on request and have no quality control or archive.
-
One-minute data are not currently quality controlled to the same level as the six-minute data.
-
No formal long-term archive for the TWC coastal water level data is in place, although a minimal-service archive of the PTWC Hawaiian sea level data is being maintained and some of the TWC data reach the IOC’s Sea Level Station Monitoring Facility.
-
Retrospective data from the TWCs cannot be easily accessed.
The absolute time accuracy of 15-second data (30s Nyquist period) should be 0.035 seconds if archival or even near-real-time data are to be processed between stations using correlation or coherence methods. Time accuracy at this level is required in order to preserve phase relationships at the highest observed frequencies (i.e., 1/(2*15) Hz). Such absolute accuracy is not difficult to achieve.
Recommendation: The committee endorses the following recommendations of the NTHMP report (National Tsunami Hazard Mitigation Program, 2007) for the TWCs to:
-
Create a formal data archive for both CO-OPS and TWC data and metadata, including 15-second data.
-
Address 1-minute and 15-second quality control issues in unison with the archive issue to ensure quality of archive.
-
Enact Federal Geographic Data Committee (FGDC)-compliant station metadata.
-
Create an operational website providing a portal for 15-second tsunami station water level data.
This committee did not undertake an assessment of the processing, distribution, archiving, and long-term access to tsunami-relevant sea level data originating from international sea level stations. As previously stated, the near-real-time, tsunami-relevant sea level data available to the TWCs via the GTS (and archived at the IOC’s SLSMF; http://www.vliz.be/gauges/) is not quality controlled.
Conclusion: Despite the excellent accomplishments by NOAA with respect to improving the processing, distribution, archiving, and long-term access to the tsunami-relevant sea level data that it collects, there remain several inadequacies. There is currently no routine acquisition, quality control, or archiving of the 15-second NOS/CO-OPS data, which are most relevant for model validation. In addition, NOS/CO-OPS 1-minute data are not currently quality controlled to the same level as their 6-minute data; and no formal long-term archive for TWC coastal water level data exists.
Description of the Deep-ocean Assessment and Reporting of Tsunamis (DART) Network
To ensure early detection of tsunamis, especially where the coastal sea level network is sparse or nonexistent, and to acquire data critical to near-real-time forecasts, NOAA has placed
DART stations in regions with a history of generating destructive tsunamis. The DART technology was developed at NOAA’s PMEL under the U.S. National Tsunami Hazard Mitigation Program (González et al., 1998; http://nthmp-history.pmel.noaa.gov/index.html) to provide early detection of tsunamis regardless of the source (http://www.ndbc.noaa.gov/dart/dart.shtm). A DART station comprises an autonomous, battery powered, bottom pressure recorder (BPR) on the seafloor and a companion moored surface buoy that forwards the data it receives acoustically from the BPR to an onshore receiver via satellite links (Figure 4.5; see González et al., 1998). The BPR collects and internally stores pressure and temperature data at 15-second intervals. The stored pressure values are corrected for small temperature-related offsets and converted to an estimated sea-surface height (the height of the ocean surface above the seafloor). The BPR water height resolution is 1 mm in water depths to 6,000 m, and the maximum timing error is 15 seconds per year.
The station has two data reporting modes: standard and event. In standard mode, data are transmitted less frequently to conserve battery power. Event mode is triggered when internal detection software in the BPR identifies anomalous pressure fluctuations associated with the passage of a tsunami. During event mode, all 15-second data are transmitted for the first few minutes, followed by 1-minute averages. If no further events are detected, the system returns to standard mode after 4 hours.
There have been two types of operational DART stations: the first generation DART stations (DART I) became operational in 2003, but all six were replaced with the second generation DART stations (DART II) by early 2008. The DART II station has two-way communications between the BPR and the TWCs/National Data Buoy Center (NDBC) using the Iridium commercial satellite communications system (Meinig et al., 2005). The two-way communication allows the TWCs to set stations into event mode in anticipation of possible tsunamis or to retrieve high-resolution (15-second interval) data in 1-hour blocks for detailed analysis, and allows near-real-time troubleshooting and diagnostics. NDBC receives the data from the DART stations and distributes the data in near-real time to the TWCs via NWS secure communications and to other national and international users via the GTS. The data is also available on the NDBC website, and event data is highlighted when a system has been triggered.
Adequacy of the Geographical Coverage of the DART Network
The NDBC completed, in a little more than two years, an upgrade and expansion of the DART array from 6 DART I stations to the present 39 DART II stations, as shown in Figure 4.6. The expansion was supported with funding from the Tsunami Warning and Education Act (P.L. 109-424). In addition, Figure 4.6 shows the locations of 9 DART stations purchased, deployed, maintained, and operated by Chile, Australia, Indonesia, and Thailand.
Planning for the deployment and siting of the expanded DART network was initiated at a workshop attended by representatives of NOAA, the USGS, and academia on July 6-7, 2005, in Seattle (Geist et al., 2005). The central goal of the workshop was to determine an optimal network configuration that would meet multiple mitigation objectives, while addressing scientific,
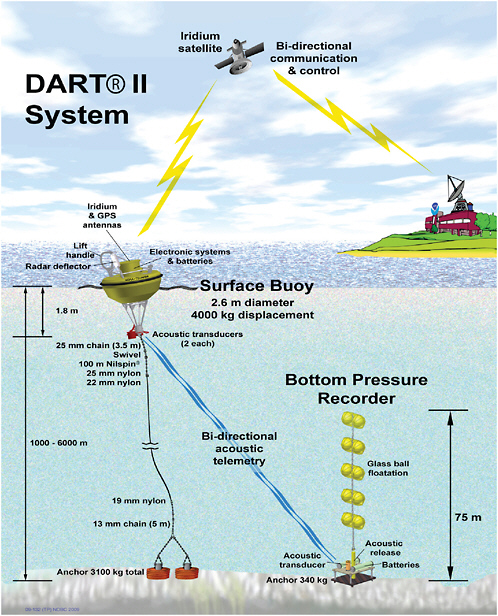
FIGURE 4.5 Schematic depicting a DART station’s components: the surface buoy with acoustic transducers communicates with the BPR acoustic transducer and then transmits data via the Iridium antenna to satellites; the BPR detects changes in bottom pressure and temperature. SOURCE: http://www.ndbc.noaa.gov/dart/dart.shtml; National Data Buoy Center, NOAA.
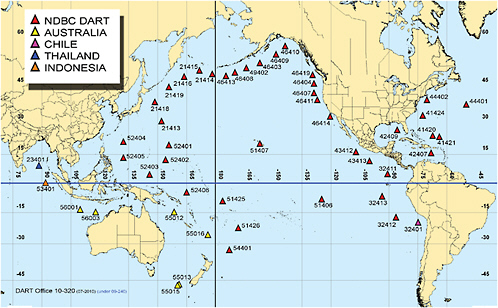
FIGURE 4.6 Map displays the locations of DART stations around the world. Red diamonds depict the 39 DART stations maintained and operated by NOAA’s National Data Buoy Center (NDBC). Nine other DART stations are maintained and operated by non-U.S. agencies, as indicated in the legend. SOURCE: http://www.ndbc.noaa.gov/dart.shtml; National Data Buoy Center, NOAA.
engineering, operational, logistical, and political constraints. The process that began at this workshop was augmented by an optimization analysis, which was subsequently completed at the NOAA Center for Tsunami Research (NCTR) at PMEL. To the extent that the constraints on siting can be quantified and the benefits expressed in functional form, array design can be approached as a problem in optimization. This avenue was explored using a tool called NOMAD (Nonlinear Optimization for Mixed vAriables and Derivatives; Audet and Dennis, 2006). Although the scheme was tested for only relatively simple cases, the methodology shows promise as an example of a scientifically robust process for siting and prioritizing stations in an operational sensor network.
The methodology and final rationale for the siting of DART stations are the subjects of a NOAA technical memorandum (Spillane et al., 2008). The final siting decisions were based on the workshop recommendations, as well as site recommendation reports produced at NCTR in consultation with the TWCs, with input from the USGS, NDBC, and other interested parties. The technical memorandum provides a starting point for continued refinement of the siting decisions and extension of the DART array, if necessary, while also providing information to aid efforts by the international community to extend the network coverage.
The net result of the deliberations on the siting of the DART stations is the current array displayed in Figure 4.6. The prioritization of groups of these sites is presented in Table 4.1 (Spillane et al., 2008). Some of the more important issues involved in site selection are described in Box 4.1.
The committee does not find any serious gaps in the geographic coverage of the DART network as designed, with regard to providing timely and accurate warnings and forecasts of far-field tsunamis on U.S. coasts. It can certainly be argued that denser coverage of open-ocean sensors would provide important redundancy capacity (in light of current reliability problems discussed below) and would provide more opportunities to improve the accuracy of model-generated wave forecasts. From a more global perspective, gaps in coastal sea level station coverage (as revealed in the Caribbean region, for instance; see previous section), which expose
TABLE 4.1 Sub-Region Allocations and Priorities Within the Overall U.S. DART Array
|
Array Sub-Group |
Instruments Assigned |
Pre-Existing Sites |
Priority |
|
Alaska/Aleutians |
6 |
3 |
1 |
|
Western Pacific |
6 |
0 |
2 |
|
Puerto Rico/Caribbean |
3 |
0 |
3 |
|
West Coast |
5 |
2 |
4 |
|
Southwest Pacific |
4 |
0 |
5 |
|
Central/South America |
4 |
0 |
6 |
|
Atlantic |
3 |
0 |
7 |
|
Gulf of Mexico |
1 |
0 |
8 |
|
Northwest Pacific |
5 |
0 |
9 |
|
Hawaii/Mid-Pacific |
2 |
2 |
N/A |
|
SOURCE: Spillane et al., 2008; NOAA. |
|||
|
BOX 4.1 Siting Considerations for DART Stationsa Tsunami Signal-Timeliness, Signal-to-Noise, and Signal Complexity Issues:
Engineering and Survivability Issues:
|
vulnerabilities of non-U.S. territories in the TWCs’ AORs, could be filled by DART stations if the resources of international partners are insufficient to fill the gaps with coastal sea level stations. However, the high cost of DART acquisition and maintenance may preclude any significant network growth.
NOAA is to be commended for having developed a prioritization scheme for DART stations and for having rapidly deployed the DART array. Looking to the future, the committee con-
|
foul weather or ship scheduling. Even though tsunamis do not occur frequently, redundancy in the array is still desirable. The surface buoy has two independent complete communication systems for full redundancy. In addition, in high-risk source regions, a certain amount of overlap in spatial coverage is desirable so that instrument failures may be partially compensated by having more than one DART in the region capable of providing a timely, high-quality signal. Communication Issues:
Logistical Issues:
Other Issues:
|
cludes that the numbers, locations, and prioritizations of the DART stations should not be considered static. These parameters of the DART network clearly deserve frequent re-consideration in light of constantly changing fiscal realities, survivability experience, maintenance cost experience, model improvements, new technology developments (even new DART designs), increasing international contributions, and updated information on the entire suite of siting issues listed in Box 4.1. In addition, simulations of the effectiveness of the DART network, under
numerous earthquake scenarios and under various DART failure scenarios, should continue to help improve the network design (Spillane et al., 2008). The potential contributions of optimization algorithms to the design process have not been exhausted.
A component of the periodic re-evaluations of the DART network needs to be the re-evaluation of the prioritization of each group of DART stations, not just individual stations, with detailed justifications for these determinations. In particular, the committee questions the rationale for the very low priority of the group of five DART stations deployed in the Northwest Pacific (Table 4.1) that provide coverage from the Dateline along the western Aleutian Islands, and past the Kuril Islands to Hokkaido. The Kuril Islands in particular have been the source of numerous tsunamis large enough to invoke tsunami watches and warnings. At the very least, DART stations covering the Kuril Islands would have a high value for the prevention of false alarms.
DART station prioritization could be refined by first distinguishing prioritization criteria based on the system’s primary function in the detection process. A list of criteria might include:
-
detection of a large tsunami,
-
detection of a medium to small tsunami (to mitigate false alarms),
-
providing data for scaling forecast models during the occurrence of a large tsunami, and
-
providing data for forecast model validation after the fact.
Depending on the order of importance of criteria such as these, quite different prioritizations of the DART stations might result. For instance, the value of the DART stations in the Western Pacific south of 25° N (Figure 4.6) is primarily for scaling forecast models, since the numerous island stations in the region (Figure 4.4) can adequately perform the tsunami detection function. The value of the DART stations in the Northwest Pacific is primarily for the detection of medium to small tsunamis, in order to confirm that a large tsunami has not been generated and thus avoid the issuance of an unnecessary warning with its attendant costly evacuation. Depending on the relative importance of the criteria in the list above, the North-west Pacific DART stations may be more important than the Western Pacific DART stations, contrary to the present prioritization represented in Table 4.1.
Conclusion: NOAA is to be commended for having developed a prioritization scheme for the distribution of the DART stations and for having rapidly deployed the DART array. There are no serious gaps in the geographic coverage of the DART network as designed, with regard to providing timely and accurate tsunami warnings and forecasts for at-risk U.S. coasts and territories. However, the vulnerabilities of non-U.S. territories in the TWCs’ AORs were not a high priority in the network design, and the potential contributions of optimization algorithms to the design process have not been exhausted.
Recommendation: NOAA should regularly assess the numbers, locations, and prioritizations of the DART stations, in light of constantly changing fiscal realities,
survivability experience, maintenance cost experience, model improvements, new technology developments (even new DART designs), increasing international contributions, and updated information on the entire suite of siting issues listed previously.
Reliability of the DART Network
Since the build-up of the DART network began in 2006, it has experienced significant outages that can have adverse impacts on the capability of the TWCs to issue efficient warnings, to use near-real-time forecasts, and to cancel warnings when a tsunami threat is over. The data loss also reduces post-tsunami model validation capability. Figure 4.7 indicates how network availability steadily declined to a low of 69 percent in February 2009. The number of DART stations deployed grew from 10 in July 2006 (7 new DART II systems, along with 3 older DART I systems) to 39 in March 2008 (including replacement of the original DART I systems with DART II systems). By March 2009, only a year after the DART array was completely deployed,
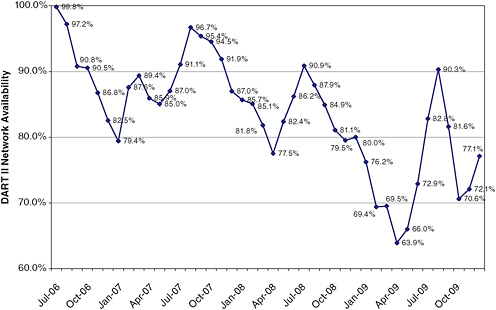
FIGURE 4.7 Chart of DART II network performance through December 2009, defined as the percentage of hourly transmissions of water column heights received vs. expected. The peaks in performance occur during Northern Hemisphere summer when maintenance is performed. Note, however, that the peak values in performance are decreasing with time as well. SOURCE: National Data Buoy Center, NOAA.
12 of the 39 DART station buoys were nonoperational despite the four-year design lifetime of the DART II systems.
Maintenance occurs in the summer months, accounting for the annual cycle in Figure 4.7. The declining trend in performance is emphasized in Figure 4.8 that depicts the median age of the deployed DART stations as increasing while the median age of failed systems has declined below the median age of deployed systems and hovers around one to two years. A system availability of 69 percent is significantly below the network performance goal of 80 percent, which perhaps is not surprising for such a large, new, and admittedly hurriedly-deployed set of complex systems that are deployed in very harsh environments. (For comparison, the effort to establish a German Indonesian Tsunami Early Warning System (GITEWS; http://www.gitews.de/index.php?id=5&L=1) has expended more than 55 million over the past five years, resulting in deployment of a single open-ocean tsunami sensor that has been operational for only six months to date, in 2007-2008.)
The issue of low network performance is exacerbated by the fact that clusters of nearby DART stations tend to be nonoperational for many months, leaving large gaps in DART coverage. For example, five stations cover the Aleutian Islands west of the Dateline, past the Kuril
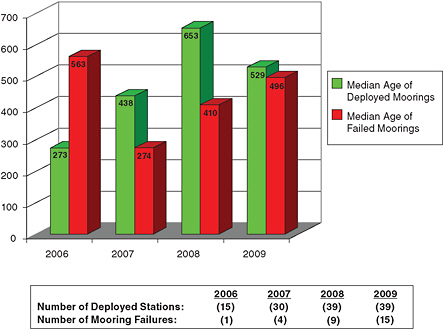
FIGURE 4.8 Median age of deployed DART II moored systems and median age of failed DART II moored systems. SOURCE: National Data Buoy Center, NOAA.
Islands to Hokkaido. Although the Kuril Islands region produced many small basin-wide tsunamis over the past five years, all of these stations had failed by December 2008, and four had failed in October 2008, or earlier. None were repaired until late June 2009, after weather conditions had improved enough to reduce the risk of shipboard operations. As of May 2010, three of these five DART stations have been inoperative since September, 2009.
The optimization scheme used for planning the locations of the DART stations and testing their ability to detect tsunamis basin-wide is based on an assumption of nearly 100 percent performance (Spillane et al., 2008). There is a small amount of redundancy and overlap in the DART network design in case of a single DART failure, but the consequences of multiple DART failures have not been considered. Given the current geographic coverage, the DART network is only useful for tsunami detection and forecasting if it is operational nearly 100 percent of the time. In a practical sense, when one DART station is inoperative, its neighbors on either side must be operational. If two neighboring DARTs become inoperative, then there must be an immediate mitigating action. A minimum first step in rectifying this situation is to establish more explicit priorities for the DART stations in order to provide guidance for NDBC’s maintenance activities. Table 4.1 from Spillane et al. (2008) provides the coarsest priorities set for the initial DART deployments, but the report does not provide justifications for the prioritizations, and they are not specific enough for the purpose of prioritization of maintenance schedules.
Figure 4.7 emphasizes that maintenance of inoperative gauges is slow and generally performed on an annual cycle irrespective of the timing of outages. Even with many DART stations inoperative in late 2008, NDBC’s repair plan was to restore all nonoperational DARTs by the end of July 2009. As a consequence of the pervasive outages of the DART stations, the TWCs cannot depend on the DART network for tsunami forecasting. According to NDBC personnel, the budget only allows for annual routine maintenance and no funds are available for “discrepancy response” (that is, nonroutine maintenance for inoperative gauges) (National Data Buoy Center, personal communication, 2009). The committee has assumed that summer time maintenance cycles are, at least in large part, dictated by north Pacific weather. If this is the case, the maintenance of the high-priority DART buoys may not be practical or even possible. NDBC’s budget for maintaining the DART stations decreased the past few years, despite the mandate in P.L. 109-424 for NOAA to “ensure that maintaining operational tsunami detection equipment is the highest priority.” However, lack of maintenance funding explains only part of the present problem with DART station failures. The number of DART II system failures is higher than expected, with a current median time to failure of approximately one year when the design lifetime was four years (Figure 4.8).
The task of building and deploying the DART buoys in two years, by Presidential directive, has been challenging for NDBC. To meet the mid-2007 deadline, the DART II was rushed to production and deployment without the customary level of testing required for a complex system like the DART, with its relatively extreme operational environment. This rapid deployment schedule required an active reliability improvement program, concurrent with initial operations and funding, to sustain effective operations while reliability improvements were defined and implemented. However, budget cuts slowed both maintenance and reliability improvement. Furthermore, NDBC had no prior experience with seafloor instrumentation, acoustic modem
communications, or taut-line surface moorings before the transfer of operations from PMEL. The committee’s assessment revealed problems that reduced the effectiveness of the technology transfer from PMEL to NDBC, including a lack of training of NDBC personnel on DART deployment methods, a preference for NDBC mooring deployment procedures that conflict with PMEL’s recommended deployment procedures for the DART stations, and a lack of coordination of post-transition research activities. These observations are consistent with other issues raised in a report by the Inspector General of the Department of Commerce about the need to make improvements to some of NDBC’s buoy maintenance operations (U.S. Department of Commerce Office of Inspector General, 2008). The report found that technology transfers from PMEL to NDBC have not been well coordinated and planned, and it offered several recommendations to address these concerns, such as ensuring that data requirements and technical specifications are clearly defined prior to the transition and that adequate funding is available to cover the transition costs. The report also recommends better coordination on research and development projects between the two NOAA centers to avoid duplication of efforts.
DART II failure modes cut across the suite of components in the DART II stations, such as bottom pressure sensor faults; acoustic transducer failures; tilt sensor failures; CPU, acoustic modem, and interface board failures on both the BPR and buoys; and mooring hardware failures. By far the most common problem is mooring hardware failure. For example, of the 12 DART II stations listed as inoperative on May 11, 2009, 8 were listed as “adrift.” In other words, the mooring line holding the surface buoy had parted so that the surface buoy had drifted away from the location of the BPR. Although NDBC has an active failure analysis program, this program needs improvement; for instance, when a buoy goes “adrift,” neither it nor the mooring remnants left on site are presently recovered by NDBC, so that the cause of the mooring line failure, or other failure mode, remains undetermined. There are many possible causes for mooring line and buoy failures, such as faulty components, improperly assembled moorings, physical interference from “long-line” fishing activity, fish bite, vessel collisions resulting in buoy sinking, vandalism, extreme environmental conditions, metal fatigue, high currents towing the buoy under water, and improper mooring scope on deployment due to error in water depth determination and/or mooring line measurements (an allowable error is 1.5 percent or less). In response to these problems, NDBC held a mooring workshop in February 2010 with participants from Woods Hole Oceanographic Institution (WHOI), PMEL, SIO, Science Applications International Corporation (SAIC), and other agencies and institutions. A broad spectrum of topics was addressed, and specific issues affecting DART reliability were identified and summarized for NDBC management.
A principal objective of NDBC’s effort to improve DART reliability is to reduce ship time costs. A system that requires unanticipated maintenance visits using costly ship time reduces availability of funds for other activities.
The committee analyzed the benefits and disadvantages inherent in each of these maintenance approaches. In order to maintain the current DART network configuration, adequate resources are needed for maintenance, including funding for unscheduled ship time to effect repair and replacement of inoperable DART stations. The alternative approach would be to invest the majority of resources into improving the DART station reliability to get closer to the
design goal of a four-year lifetime (Figure 4.8), which would reduce the need to fund ship time for station maintenance. The second choice implies that DART stations are maintained sparingly, with only minimal attention to the integrity of the network’s tsunami detection capability, until the reliability of the DART stations is improved. In this case, it must be understood and acknowledged that the DART network might be fully deployed but will not be fully functional until such time as the reliability of the DART stations gets much closer to the design goal of a four year lifetime than the present median time-to-failure of just over one year.
A partial amelioration of the draconian choices above could come from exploring new maintenance paradigms, such as (1) simplifying the DART mooring for ease of deployment from small, contracted vessels that are available, for instance, from the commercial fishing fleet and the University-National Oceanographic Laboratory System (UNOLS) fleet; and (2) maintaining a reserve of DART buoys for immediate deployment upon the occurrence of a significant gap in the network, weather permitting.
The transfer of the DART technology from research (at PMEL) to operations (at NDBC) did not include the establishment of mechanisms for scientific or TWC operational feedback into the management of the program.
Conclusion: There is insufficient station redundancy in the DART network. Since the build-up of the DART network began in 2006, it has experienced significant outages that have a potentially adverse impact on the capability of the TWCs to issue efficient warnings, use near-real-time forecasts, and cancel the warnings when a tsunami threat is over. Worse, multiple, neighboring DART stations have been seen to fail in the North Pacific and North Atlantic, leaving vast stretches of tsunami-producing seismic zones un-monitored. This situation persists for long periods of time. The committee considers it unacceptable that even a neighboring pair of DART stations in high-priority regions is inoperative at the same time. Although an 80 percent performance goal may be satisfactory for the entire DART network, and for individual gauges, a much better performance is required for neighboring pairs of DART stations, especially in high-priority regions.
Recommendation: In order to bring NDBC into compliance with P.L. 109-424, NDBC should engage in a vigorous effort to improve the reliability of the DART stations and minimize the gaps caused by outages.
Conclusion: The transfer of the DART technology from research (PMEL) to operations (NDBC) did not include the establishment of mechanisms for scientific or operational feedback from PMEL or the TWCs into the management of the program. The DART network reliability could be enhanced by improving the technological and scientific knowledge transfer between PMEL and NDBC and the management of the continued joint development of next generation DART stations.
Conclusion: Continued engineering refinements of the DART concept will allow NOAA to establish a more sustainable capability with reduced costs of construction, deployment,
and maintenance. The committee supports, and encourages the continuation of, NDBC’s recent effort (February 2010 workshop) to engage industry, academia. and other NOAA agencies for help in solving its problems with DART reliability.
Recommendation: The committee encourages NDBC to establish rigorous quality control procedures, perform relentless pre-deployment tests of all equipment, and explore new maintenance paradigms, such as simplification of DART mooring deployment and maintaining a reserve of DART stations for immediate deployment.
Recommendation: NDBC should improve its efforts at failure analysis, especially through more vigorous attempts to recover both buoys that have gone “adrift” and the mooring remnants that are left on site.
Conclusion: DART presents an outstanding opportunity as a platform to acquire long time series of oceanographic and meteorological variables for use for climate research and other nationally important purposes. Potentially a DART buoy could also telemeter data acoustically from a seafloor seismograph although the demands on DART power would increase proportionally. The additional power requirements for acoustic and satellite telemetry would press the current design of the buoy thereby increasing risk to the primary goal of tsunami detection. Nevertheless, broadening the user base could enhance the sustainability of the DART program over the long term and future designs should consider additional sensors. Other programs, such as the coastal sea level network, have encouraged a broad user base to enhance sustainability of their infrastructure.
Recommendation: NOAA should encourage access to the DART platform (especially, use of the acoustic and satellite communications capabilities) by other observational programs, on a not-to-interfere basis; that is, the primary application (tsunami warning) justifies the cost, but DART presents an outstanding opportunity as a platform to acquire long time series of oceanographic and meteorological variables for use for climate research and other nationally important purposes. Broadening the user base would be expected to enhance the sustainability of the DART program in the future.
Conclusion: In a world of limited resources, a strategic decision needs to be made as to whether it is more important to maintain the current DART network at the highest level of performance or to focus on improving the DART station reliability.
A first step could be for NOAA to establish a strategic plan that determines whether (1) it is most important to maintain the DART II network at the highest level of performance right now (meaning that the first priority for resources is maintenance, including funding of costly ship time to repair and replace inoperative DART stations as soon as possible), or (2) it is most important that NDBC focus first on improving DART station reliability, at the possible expense of maintenance.
DART Data Processing
NDBC has enacted automated quality checks for DART data as it is delivered in near-real time, as well as post-processing quality analyses for archived DART data dating back to 2003 (http://www.ndbc.noaa.gov/dart.shtml). Even older (since 1986) quality-controlled BPR data can be found at NGDC (http://www.ngdc.noaa.gov/hazard/DARTData.shtml). Currently, the archived data comprise the 15-minute sea level samples from the “standard” mode of DART operation, as well as the 15-second and 1-minute samples transmitted during the “event” mode of operation. Access to the continuous 15-second sea level data that are stored internally in the DART BPRs, and are retrieved after recovery of each BPR, has not yet been automated; the data is available upon request from NGDC.
To facilitate the use of the 15-second data for studying such phenomena as atmospherically-generated “meteo-tsunamis,” coastally-generated infra-gravity waves, and the earth’s seismic “hum,” among other phenomena, quality-controlled 15-second data could be made available from an archive center such as NGDC. The NTHMP (2008) recommendations for enhancing the quality and availability of tsunami-relevant data (see sub-section on Coastal Sea Level Data Processing) also apply to the DART station data.
Sea Level Data Integration into Other U.S. and Global Observation Systems
The coastal sea level data and metadata are available through the IOS Sea Level Monitoring Facility (http://www.vliz.be/gauges/index.php). However, the IOC website does refer back to Permanent Service for Mean Sea Level (PSMSL), the British Oceanographic Data Center (BODC), and the UHSLC for low-frequency and high-frequency research quality sea level data. In addition, the expanded DART array data and metadata are available globally from the NDBC website (http://www.ndbc.noaa.gov/dart.shtml), which can be reached through NGDC. However, edited bottom pressure data are not available after 2004 and are awaiting review.
However, with respect to the integration of the U.S. DART and coastal tsunami-relevant sea level stations, the committee has found no evidence that an integration with Integrated Ocean Observing System (IOOS), Global Ocean Observing System (GOOS), or Global Earth Observation System of Systems (GEOSS) is being pursued or implemented, despite a recommendation in the NTHMP (2008) report to “develop an observing system architecture to design, build, deploy and operate tsunami observation and data management systems in conjunction with IOOS and the all-hazards GEOSS. Tsunami near-real-time observation systems (including seismic, water level, and oceanographic) and data management systems (including modeling and archiving) are key elements of IOOS and GEOSS.”
The DART buoy platforms present an outstanding opportunity to acquire long time-series data of oceanographic variables for nationally important research and monitoring goals, including for climate research. Giving other observational programs access to the DART platform (especially, use of the acoustic and satellite communications capabilities) provides an opportu-
nity for leveraging resources (ship time for maintenance, long-term funding for maintenance or replacements) and is encouraged by the committee.
Similarly, there is great value in the continued coordination of U.S. tsunami-focused sea level observation efforts with other U.S. and international programs interested in monitoring sea level variability for other purposes, such as climate variability and climate change.
Conclusion: Because coastal sea level stations have evolved from their primary mission to serve a broad user community, their long-term sustainability has been enhanced.
The following are conclusions and recommendations related to the detection of tsunamis with sea level sensors:
Assessment of Network Coverage for Tsunami Detection and Forecasting
Recommendation: NOAA should assess on a regular basis the appropriateness of the spatial coverage of the current DART sea level network and coastal sea level network (U.S. and international), in light of constantly changing fiscal realities, survivability experience, maintenance cost experience, model improvements, new technology developments, and increasing or decreasing international contributions. Especially, NOAA should understand the vulnerabilities of the detection and forecast process to the following: (1) gaps in the distribution of existing gauges and (2) failures of single or multiple stations.
A first step in the assessment could be the establishment of explicit criteria, based on TWC forecaster experience and on the arguments outlined for the DART site selection (Spillane et al., 2008). An appropriate aid in this process would be simulations (e.g., Spillane et al., 2008) of the effectiveness of the combined sea level networks, under numerous earthquake scenarios and under various station failure scenarios. Such a study would also consider a region’s tsunami-producing potential, sensitivity analysis of source location, tsunami travel time, local population density, timing for initial warning versus evacuation decision process for communities at risk, and warning/evacuation time gained for additional station coverage. The contributions of optimization algorithms to the network design process could be explored more fully as well.
Station Prioritization
Recommendation: NOAA should prioritize the existing DART stations and coastal sea level gauges (both U.S. and international) according to their value to tsunami detection and forecasting for both U.S. territories and other AORs of the TWCs. Furthermore, this priority list should be merged with the results from the network coverage assessment (above) to determine the following: (1) maintenance priorities and schedules; (2) network expansion priorities; and (3) identification of critical stations that are not under U.S. control and may require either augmentation with new U.S. gauges or operations and maintenance support.
An important aspect of this activity would be to develop and publish criteria, such as the following examples: (1) value of a station for initial detection of a large tsunami near an active fault zone, to maximize warning lead time; (2) value of a station for initial detection of a medium to small tsunami, to mitigate false alarms; (3) value of a station for scaling forecast
models of inundation of U.S. territories; (4) value of a station for after-the-fact model validation; and (5) density (sparsity) of the observing network in the region.
Data Stream Risk Assessment and Data Availability
Recommendation: NOAA should assess on a regular basis the vulnerabilities to, and quality of, the data streams from all elements of the sea level networks, beginning with the highest priority sites determined per the recommendations above.
Coastal station vulnerabilities can be assessed by the following: (1) whether the operating agency is committed to gauge maintenance, which can be assessed by the continuous availability (or not) of the station’s data on the IOC’s Sea Level Station Monitoring Facility (http://www.vliz.be/gauges/) and (2) whether the station adheres to the station requirements, processing protocols, quality control procedures, distribution, long-term archiving, and retrospective access recommendations in the Tsunami Warning Center Reference Guide (U.S. Indian Ocean Tsunami Warning System Program, 2007).
The risk assessments, along with the prioritization lists described above, could be used to determine the following: (1) whether authority for a U.S. gauge should be transferred to a different U.S. agency: for example, the TWCs have acknowledged that they do not have the resources to properly maintain the gauges under their authority; authority for maintenance of these gauges could be transferred to NOS/CO-OPS or the UHSLC, with appropriate funding; (2) whether aid should be offered to an international partner; and (3) whether a substitute gauge should be established in a nearby location.
Sea Level Network Oversight
Recommendation: In view of (1) the declining performance of the DART network, (2) the importance of both the DART and coastal sea level networks for tsunami detection and forecasting, and (3) the overlapping jurisdictions among federal as well as non-federal organizations, NOAA should establish a “Tsunami Sea Level Observation Network Coordination and Oversight Committee” to oversee and review the accomplishment of the recommendations listed above.
The committee would report to the management level within NOAA that has the responsibility and authority for ensuring the success of the U.S. Tsunami Program. The oversight committee would be most useful if its members represented a broad spectrum of the community concerned with tsunami detection and forecasting (e.g., forecasters, modelers, hardware designers, operations and maintenance personnel) from academia, industry, and relevant government agencies.
FORECASTING OF A TSUNAMI UNDER WAY
In contrast to inundation models used for evacuation planning in advance of an event (see Chapter 2), near-real-time forecast models produce predictions after a seismic event has been detected, but before tsunamis arrive at the coast, which is the ultimate goal of the monitoring
and detection system. These forecast models make available to emergency managers in near-real time the time of first impact as well as the sizes and duration of the tsunami waves, and give an estimate of the area of inundation, similar to hurricane forecasting.
The entire forecasting process has to be completed very quickly. For example, Hawaii Civil Defense needs about 3 hours to safely evacuate the entire coastline. As most far-field tsunamis generated in the North Pacific take less than 7 hours to strike Hawaii, the entire forecast, including data acquisition, data assimilation, and inundation projections, must take place within 4 hours or less. Although this sounds like a comfortable margin, in fact it is quite a short time period compared to many other natural disasters, especially since it can take anywhere from 30 minutes to 3 hours to acquire sufficient sea level data (Whitmore et al., 2008). For hurricanes, forecasts are made days in advance of landfall and evolve spatially at scales over 100 times slower than a tsunami. The time window for a forecast for a near-field tsunami event is even smaller, because the first waves may arrive in less than 30 minutes (see the section on Instrumental Detection of Near-Field Tsunamis below).
The importance of forecasting the duration of wave arrivals, and forecasting the sizes of each arrival, is well known; for example, the largest and most destructive wave of the tsunami originating off the Kuril Islands on November 15, 2006, was the sixth wave to hit Crescent City, California. This wave hit more than two hours after the first wave arrival (Uslu et al., 2007; Barberopoulou et al., 2008; Dengler et al., 2008).
Although time-of-arrival information has been available since the 1960s (Ambraseys, 1960), only beginning in the 1990s (e.g., Kowalik and Whitmore, 1991; Whitmore and Sokolowski, 1996; Titov and González, 1997), with full development not completed until a decade later, have forecast methodologies been employed to provide estimates of inundation prior to wave arrival and of duration (see Whitmore, 2003; Mofjeld, 2009; Titov, 2009). The use of near-real-time forecasting models is only possible because of data from the coastal and open-ocean sea level networks. Modeling tsunamis based on seismic data alone is currently not very accurate, as noted in the above section on Detection of Earthquakes. The importance of accurate forecasts of maximum wave height was illustrated quite clearly in the wake of the recent Chilean earthquake on February 27, 2010.
In the United States, NOAA’s WC/ATWC and PMEL have developed distinct tsunami forecast systems (respectively, Alaska Tsunami Forecast Model (ATFM), http://wcatwc.arh.noaa.gov/DataProcessing/earthvu.htm; and SIFT, http://nctr.pmel.noaa.gov/tsunami-forecast.html) to provide information on tsunami arrival times, wave sizes, and event durations at the shoreline. An advanced version of the ATFM is currently in development at the WC/ATWC.
These systems employ pre-computed, archived event scenarios, in conjunction with near-real-time sea level observations. The PMEL system takes the forecast a step further by providing inundation distances and run-up heights that enable even more targeted evacuations. These forecast models allow the TWCs to make more accurate tsunami wave predictions than were possible without them, enabling more timely and more spatially refined watches and warnings (e.g., Titov et al., 2005; Geist et al., 2007; Whitmore et al., 2008). The PTWC was able to forecast reasonably well the observed tsunami heights in Hawaii more than five hours in advance of the Chilean tsunami arrival (Appendix J). The models place an additional emphasis
on the importance of the proper operation of the sea level stations, especially the open-ocean DART stations, whose sea level observations of tsunami waves are not distorted by bathymetric irregularities and local harbor resonances that affect the coastal sea level observations.
Japanese scientists have been leading in tsunami forecast modeling, have had forecast models in operation for a while (including for near-field events), and are able to draw from a very sophisticated, densely covered observation network. They are also very active in developing new methods for real-time forecasting (e.g., using the inversion method; Koike et al. 2003).
In brief, the SIFT model identifies an interim wave field from its database based on the seismic data (inferred source parameters and epicentral location) once an earthquake is triggered. As the tsunami arrives at sea level stations along its propagation path, tsunami amplitude data are used to improve the forecast by scaling the pre-computed free-surface distribution. Finally, the resultant scaled surface is used to initialize a boundary value problem and determine, at high resolution, the wave field, including inundation at the locations of interest. The three steps, in more detail, are as follows:
-
A pre-computed database of wave fields from unit earthquake sources is consulted: NOAA/ PMEL built a database of 1,299 unit earthquakes. The seafloor displacement is computed by the linear-elastic dislocation theory and is applied for each unit earthquake, each representing a magnitude 7.5 earthquake with a deformation area 100 km long by 50 km wide. Because the NOAA system was initially developed to produce forecasts for U.S. coastlines, the current database includes only events in the Pacific Ocean and the Caribbean Sea, although efforts are under way to extend the database to the Indian Ocean and the Mediterranean Sea. In addition, the database was developed for thrust events only and is now being updated for other types of earthquakes, particularly for the Caribbean region. By linearly combining the wave fields from adjacent unit sources, the most plausible and realistic tsunami scenarios are roughly inferred from the earthquake parameters. For example, a magnitude 8.7 earthquake with an approximate 400 km by 50 km deformation area requires superimposing the results from four adjacent segments. Because the unit sources are arranged in a pair of parallel rows, larger events with widths on the order of 100 km can also be represented. Each archive includes data on the spatial distribution of wave heights and fluid velocities; this information is needed to initialize the boundary conditions, which is then used to calculate in near-real time the inundation in specific locales.
-
Data assimilation from DART station data is performed: In this step, near-real-time measurements of the tsunami are used to scale the combined wave field constructed from the database. Once the tsunami is recorded by the DART sensor, the pre-computed wave time series (wave heights and arrival times) are compared to and scaled using the observed wave time series by minimizing a least square fit. This scaling process can achieve results as soon as the full wavelength of the leading wave is observed and is updated with observations of the full wave time series. When the wave arrives at the next buoy, the tsunami wave heights are corrected again, although the experience to
-
date with 16 events has shown that even a single DART buoy is sufficient to scale the pre-computed wave fields appropriately for qualitatively accurate predictions.
-
Inundation estimates using the nonlinear model, Method of Splitting Tsunami (MOST), are developed: Once the combinations of wave fields from the pre-computed scenarios are constrained by the DART sea level data using the least squares fit technique, the database is queried for wave height and fluid velocity time series at all sea-boundaries of the region targeted for the inundation forecast. At each boundary point, the time histories of heights and velocities are used to initialize the boundary conditions. The inundation computation proceeds using the nonlinear MOST model that includes shoaling computations of wave inundating dry topography, until inundation estimates are obtained. The process is built on the Synolakis (1987) theory of a solitary wave propagating over constant depth and then evolving over a sloping beach. The wave field of approaching waves in deep waters are assumed to be linear, so there are reasonable interim estimates for the entire flow including reflection from the beach; i.e., where the constant depth and sloping regions connect. Once there is a linear solution in the deep waters (where depths are more than 20 m), this input can be used to solve the nonlinear evolution problem on a sloping beach (Carrier and Greenspan, 1958).
Figure 4.9 displays the SIFT tsunami predictions at two stations after the February 2010, Chilean earthquake. One of these stations is at an open-ocean island (Midway Island) at the northwestern end of the Hawaiian Archipelago; the other station is at the North American coast (Santa Barbara, California). In the open ocean, SIFT-predicted amplitudes (although not the phases) agree fairly well with the observed. However, the figure also illustrates the difficulty in predicting coastal amplitudes that are very sensitive to the small-scale details of the model’s bathymetry and coastal geometry. The highest observed wave at Santa Barbara, occurring about four hours after the first arrival, is missed by SIFT. For comparisons of SIFT predictions with many other observations of the Chilean tsunami, go to http://nctr.pmel.noaa.gov/chile20100227/.
For SIFT (but not for ATFM), the ability to make accurate forecasts of tsunami waves is predicated on the availability of DART sea level measurements. The method’s accuracy is tied directly to receiving data from the sea floor in near-real time. ATFM can utilize sea level data from both DART and coastal stations. To date the two technologies have successfully forecast 16 tsunamis with an accuracy of about 80 percent when compared with tide gauge data. (Titov(Titov et al., 2005; Tang et al., 2008, 2009; Wei et al., 2008; Titov, 2009). Although these models forecast wave height reasonably well, forecasting the inundation remains a challenge. To date, only one of the models (ATFM) is fully operational, although the SIFT model is being transitioned. At present, based on its review the committee found no clear process by which the forecasts’ skill is evaluated and improved, nor by which the differences in the forecast outputs are reconciled. As with the ensemble model approach for hurricane forecasts, the committee considers it beneficial to run and compare multiple model outputs. However, a process is needed that assists watchstanders in reconciling the differences and arriving at a single forecast output to be transmitted in the warning products. Such a process is well established in the National
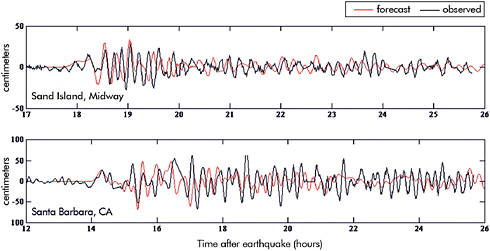
FIGURE 4.9 Comparisons of the February 27, 2010, Chilean tsunami recorded at two U.S. sea level gauges with forecasts obtained from high-resolution model runs. The forecast models were run in near-real time before the tsunami reached the locations shown. The model data for Santa Barbara exhibited a 9-minute early arrival (0.8-1 percent error accumulated during the propagation simulation) that has been removed for the purposes of this comparison. SOURCE: http://nctr.pmel.noaa.gov/chile20100227/; Center for Tsunami Research, NOAA.
Hurricane Center (NHC) or more generally the weather service, where ensemble modeling is commonplace.
Conclusion: Metrics are needed to objectively measure each model performance. In addition, a process is needed by which multiple model outputs can be used to develop a single solution (e.g., ensemble model approach in the NWS and NHC).
Recommendation: The TWCs and the NOAA Center for Tsunami Research at PMEL should continue to work together to bring the SIFT tsunami forecast methodologies into full operational use. The utility of the methodologies could be improved by ensuring that TWC staffs undergo a continuous education and training program as the forecast products are introduced, upgraded, and enhanced.
INSTRUMENTAL DETECTION OF NEAR-FIELD TSUNAMIS
Near-field tsunamis present a daunting challenge for emergency managers. Even if the near-shore populace is well informed about the potential for a tsunami when the ground shakes, and even if local managers receive information from forecasters of an impending
tsunami within minutes after the earthquake, there will likely only be an additional few minutes before inundation, barely enough time for individuals to flee a short distance. The earthquake itself, if severe enough, may have already disrupted local communications, destroyed structures, and cut evacuation routes, as happened in Samoa during the September 29, 2009, tsunami (http://www.eqclearinghouse.org/20090929-samoa/category/emergency-management-response). Nevertheless, successful evacuations have occurred during the recent events in Samoa and Chile.
As for communities a little farther away from the tsunami source (where a tsunami might strike within an hour or so), the lack of communications could mean that tsunami forecasters will not receive data from the coastal sea level gauges that the tsunami reaches first. These communities might also be too distant from the triggering earthquake to have felt the ground shaking sufficiently to regard this as their warning. These communities depend on the detection system to very rapidly assess the threat and deliver the warning product and evacuation order.
Almost every tsunami, because their likely sources are along undersea fault zones that tend to be near the continents or islands, will have a near-field region that is affected relatively soon (within minutes) after the earthquake, as well as a whole suite of regions at varying distances that are affected from minutes to many hours after the earthquake. As an example, Figure 4.10 presents a simulation of the great 1700 tsunami that was generated by a magnitude 9.0 earthquake on the Cascadia subduction zone. After 1 hour, the leading tsunami wave crest has already inundated the local coastlines of Oregon, Washington, and Vancouver Island and has reached as far south as San Francisco. After 2 hours, the leading crest is well within the Southern California Bight.
For the benefit of the communities at intermediate and greater distances from likely tsunami source regions, and given the possibility that a near-coast earthquake will not only generate a large tsunami but also will destroy infrastructure (including sea level gauges or the telecommunication paths for their data) on the nearby coast, offshore open-ocean gauges that provide near-real-time, rapidly sampled sea level observations are needed. This need motivated the placement of five DART stations off the coasts of California, Oregon, Washington, and British Columbia (see Figure 4.6). Note that at least two of these DART stations would have observed the 1700 tsunami (Figure 4.10) well before the initial wave crest reached San Francisco.
Despite the short lead time for a near-field tsunami, there is still value in providing rapid official warning to the local populace, so long as people are not taught to wait for such a warning if they have already felt a strong earthquake. Such formal warning from every possible means (e.g., loudspeakers, TV, radio, Internet, text message, Twitter, etc.) will urge people to evacuate more quickly (the people will likely be under strained conditions instilled by the strong ground shaking). More importantly, such warning could be the only way to notify the people to evacuate in the event of a tsunami earthquake that, because of its peculiar temporal evolution, generates a tsunami of greater amplitude than would be expected from the small amount of ground shaking. The most catastrophic example is the Meiji Sanriku tsunami of 1896 in northeast Japan. The earthquake magnitude was large, Ms = 7.2, but the ground shaking was so weak that few people were overly concerned about the quake. More than 22,000 people
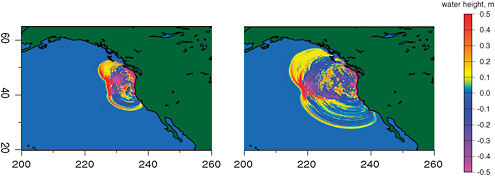
FIGURE 4.10 Two snapshots from a simulation of the great 1700 tsunami that was generated by a magnitude 9.0 earthquake on the Cascadia subduction zone. The left panel shows the sea level displacements after one hour and the right panel after two hours. Warmer colors show wave crests; cooler colors are the troughs. After one hour, the leading crest has already inundated the local coastlines of Oregon, Washington, and Vancouver Island and has passed San Francisco Bay. On the west side of the disturbance, the initial crest is over 800 km from the coast after one hour. After two hours, the initial wave crest is well within the Southern California Bight on its way to Los Angeles. SOURCE: Satake et al., 2003; reproduced by permission of the American Geophysical Union; http://serc.carleton.edu/NAGTWorkshops/ocean/visualizations/tsunami.html.
perished in the huge tsunami that followed, which had a maximum run-up in excess of 30 m. Tsunami earthquakes are not rare. In addition to the Meiji Sanriku tsunami, Okal and Newman (2001) list the following tsunami earthquakes: the 1946 Aleutian Island tsunami; the 1963 and 1975 Kuril Island tsunamis; the 1992 Nicaragua tsunami; the 1994 and 2006 Java tsunamis; and, the 1996 Chimbote, Peru, tsunami. To detect a tsunami earthquake, direct measurements of the water-surface variations and/or water currents are required in near-real time. Such measurements are also critical for detecting tsunamis generated by submarine landslides. One way to accomplish such measurements is to utilize the data from existing and planned cabled ocean observatories.
Several cabled seafloor observatories are currently in operation or will be constructed in the near future off North America. These observatories comprise various sensors or sensor systems that are connected to each other and to the shore by a seafloor communications cable. This cable also provides power to the sensors and a pathway for high-speed data return from the sensors. The sensors gather a variety of oceanic and geophysical data that are transmitted in near-real time via the fiber optic cables from the seafloor to onshore data servers. Among the sensors are those useful for tsunami detection; for example, bottom pressure sensors, seismometers, current meters, hydrophones, gravimeters, and accelerometers. The cable can deliver relatively high amounts of electric power to support many sensors acquiring data at high sampling rates. Observatories are currently in operation off British Columbia (NorthEast Pacific Time-Series Underwater Networked Experiments, NEPTUNE-Canada:
http://www.neptunecanada.ca/) and in Monterey Bay, California (Monterey Accelerated Research System, MARS: http://www.mbari.org/mars/). Another large U.S. observatory has been funded by the NSF for deployment across Oregon’s continental shelf, slope, and the Cascadia subduction zone, over the Juan de Fuca plate, and on to the Juan de Fuca Ridge (Ocean Observatories Initiative, OOI: http://www.interactiveoceans.washington.edu/). Both the NEPTUNE-Canada and OOI networks can be used for quantitative tsunami detection primarily via their seismometers and seafloor pressure sensors.
Off Oregon, Washington, and British Columbia, the water pressure sensors placed on the seafloor cabled observatories can readily replace or enhance the DARTs in providing warning to communities at mid- to far-ranges from the tsunami-producing Cascadia subduction zone. In addition, because the seismic data from the observatories can be used in near-real time by automatic computer algorithms in order to separate seismic and tsunami signals in the pressure data, the pressure gauges can be placed very near, and even on top of, the expected tsunami source regions. This can yield very rapid determination of the generation (or not) of a sizable tsunami, thus providing a capability for producing some modicum of warning to the near-field coasts.
From a pragmatic operational point of view, the utilization of NEPTUNE-Canada and the OOI sensors for tsunami detection could be expected to eliminate the need for the DART buoys off Washington and Oregon, thus freeing up those resources for other purposes.
In Japan, cabled observatories already exist that are focused on collecting measurements of earthquakes and tsunamis. For example, Japan Agency for Marine-Earth Science and Technology (JAMSTEC) has installed three observatories and is constructing a fourth, called Dense Ocean-floor Network System for Earthquakes and Tsunamis (DONET), that specifically aims at capturing the data from the next Tokai earthquake and tsunami. One exceptional event has already occurred on one of JAMSTEC’s observatories, the Tokachi-oki site, which was located atop the source area of the 2003 Tokachi-Oki earthquake; for the first time ever, seafloor sensors observed the pressure variations of the tsunami at the instant of creation. The abrupt changes in water pressure at the seafloor clearly show the seafloor displacements of the earthquake, with sustained acoustic (pressure) waves bouncing up and down between the hard bottom and the sea surface (Li et al., 2009) while the tsunami wave evolves outward therefrom. These observations of the 2003 Tokachi-Oki earthquake and tsunami provided an important lesson: the sensors and cables of an observatory placed at the epicenter can survive the earthquake, allowing the near-real-time data to be used effectively for rapid warning of local tsunamis.
Another possible technology for detecting local tsunamis is high-frequency (HF) radar (Lipa et al., 2006). Coastal HF radar stations produce maps of the ocean surface currents using radar echoes from short period surface gravity waves. A tsunami wave, which exists at longer periods (1-30 minutes) than the waves (~10 seconds) that reflect the radar’s microwave energy, will transport the shorter waves, adding to the ambient current and producing a signature detectable by the radar. The method has not been proven in the field, but theoretical and analytical studies are encouraging. The radars could provide accurate and rapid observations of tsunami waves before they make landfall and thereby aid in the formulation of better warning products.
Many radar stations installed along the coast are threatened by the Cascadia subduction zone (e.g., see http://bragg.coas.oregonstate.edu/). With software enhancements, these stations, and new ones in critical locations, could be key elements of a rapid warning system for near-field events. The radar stations are typically installed on high bluffs overlooking the shore, above any possible inundation. The potential for a broad user base of HF radar data in many locations would help justify the expense of installation and operations, resulting in enhanced sustainability.
Conclusion: Tsunami detection, warning, and preparedness activities for tsunamis arriving within minutes to an hour or so could benefit from existing, alternative technologies for rapid detection, especially considering the current sensor network’s limitations for detecting tsunami earthquakes and tsunamis generated by submarine landslides.
Recommendation: For the purpose of developing more rapid and accurate warnings of local tsunamis, especially along the Washington and Oregon coasts, the committee recommends that the TWCs coordinate with the NEPTUNE-Canada and OOI observatory managers to ensure that their seismic and bottom pressure data are (or will be) made available in near-real time to the appropriate telecommunications gateways. Data interpretation tool(s), jointly applied to the seismic and bottom pressure data, will need to be developed to realize the most rapid tsunami detection possible.
Other NTHMP member states could seek similar opportunities to utilize existing and/or planned systems (including coastal HF radars) for the detection and warning of local tsunamis. It must be emphasized that investment for this adaptation would be minimal, because the observatories are being constructed and will be maintained with funds external to the U.S. Tsunami Program; thus, the benefit could be substantial.
RESEARCH OPPORTUNITIES AND NEW TECHNOLOGIES
The previous sections of this chapter have made it clear that present technologies and methodologies for evaluating the potential of earthquakes to produce dangerous tsunamis, and for detecting and forecasting those tsunamis, are far from the ideal of having an accurate and complete forecast of the expanding tsunami wave train within a few minutes of the initiating rupture. It is appropriate therefore to briefly review nascent technologies and methodologies that might be able to improve the ability of the U.S. TWCs and their international counterparts to provide quicker and more accurate tsunami warnings. Some of these technologies and methodologies, like the undersea, cabled observatories discussed in the previous section, are already available, simply waiting for the appropriate testing and software development to be integrated into the TWCs warning processes. Others require much more development before they will become useful.
Technologies such as satellite altimetry, passive microwave radiometry, ionospheric perturbation detection, and real-time kinematic-global positioning system (RTK-GPS) buoys
have been proposed for detecting tsunamis in the wake of the Indian Ocean event of 2004. Although potentially promising, there has not been any demonstration of a viable operational alternative to the current systems, perhaps due to lack of funding. In general, most alternatives are not adequately sensitive to serve as a replacement for present technologies, with which small waves (<1 cm) can be observed and used for wave model inputs, fine-tuning of forecasts and warnings (including cancellation of warnings), and tsunami research. Nevertheless, continued research and development may prove fruitful. The descriptions below of some interesting technologies and methodologies are provided simply to indicate possibilities and should not be interpreted as endorsements of their utility by this committee.
Duration of High-Frequency P-Waves for Earthquake Moment Magnitude Estimation
Because of the difficulty of obtaining reliable estimates of seismic moments at the long periods relevant to tsunami generation, research is needed to explore the possibility of using other methods, possibly drawing on different technologies, in order to improve the accuracy of moment estimates, and the ability to detect unusual events, such as tsunami earthquakes.
One approach to the near-real-time investigation of large seismic sources consists of targeting their duration in addition to their amplitude. The comparison between the amplitude and duration reveal violations of scaling laws (e.g., slow events such as tsunami earthquakes). Following the 2004 Sumatra earthquake, Ni et al. (2005) noted that source duration can be extracted by high-pass filtering of the P-wave train at distant stations, typically between 2 and 4 Hz. Only P-waves escape substantial inelastic attenuation, so that this procedure eliminates spurious contributions by later seismic phases and delivers a “clean” record of the history of the source.
This approach has been pursued recently by Lomax et al. (2007) and Okal (2007a). In particular, the latter study has applied techniques initially developed in the field of seismic source discrimination (of manmade explosions as opposed to earthquakes) to characterize the duration of the source through the time τ1/3 over which the envelope of the high-frequency P-wave is sustained above one third of its maximum value. It is shown, for example, that this approach would have clearly recognized the 2004 Sumatra earthquake as a great earthquake, or the 2006 Java tsunami earthquake rupture as exceptionally slow. In addition, alternative methods for the rapid identification of source duration of major earthquakes are presently the topic of significant research endeavors, e.g., by Lomax et al. (2007) and Newman and Convers (2008).
The high-frequency band of the Sumatra earthquake was recorded in Japan using the Hi-Net seismic array comprising 700 borehole instruments at an approximate 20 km spacing. Ishii et al. (2005) used the data from the array to produce back-projected images of the earthquake rupture over approximately eight minutes across a 1,300 km long aftershock region including both the slip history and overall extent of the seismic zone. A comparison of the subsequent fault image, when compared to previous great earthquakes, supported the hypothesis that the moment magnitude of the earthquake was 9.3—the largest earthquake ever recorded with modern seismic instruments. The authors believe that such images of the aftershock
zone could be made available within 30 minutes of the initiation of a similar event. Although networks or arrays like Hi-Net are rare, a similar or even more capable array is currently being implemented across the continental United States, funded by the NSF EarthScope program. Today’s high-speed, high-capacity networks coupled with large-capacity computing facilities such as cloud computing provide the technologies for implementing an early warning system. The compressional wave velocity is high (>8 km/s) and will provide fault images more quickly than the hydrophone approaches discussed below. The technique used for acoustics, however, is similar to seismic back-projection.
Conclusion: The P-wave duration and back projection methods appear robust and applicable to high-frequency records. These methods have some advantages over the W-phase approach because they can provide constraints on the rupture length and duration and do not rely on having seismometers with a stable long-period response.
Recommendation: The committee recommends that NOAA and the TWCs consider the use of arrays and networks such as Hi-Net and EarthScope Array National Facility to determine rupture extent and moment of great earthquakes. The networking and computational requirements are significant and would need to be included in TWC upgrades in the future.
Hydroacoustic Monitoring of Underwater Geophysical Events
Sound wave (“hydroacoustic”) signals can propagate a great distance within a waveguide in the ocean, termed the sound fixing and ranging channel (“SOFAR channel”). This propagation was discovered during World War II, and immediately following declassification scientists began exploring the possibility of using hydroacoustic signals generated by large earthquakes (the so-called T phases) for the purpose of tsunami warning (Ewing et al., 1950). With the development of the UN International Monitoring System of the CTBTO, several state-of-the-art hydrophone stations have been deployed in the world ocean, offering an opportunity for complementary use in the context of tsunami warning. Each station comprises three hydrophones separated by approximately 2 km to provide some directionality at low frequencies.
By placing hydrophone sensors within the SOFAR channel, a scientist can “listen” to seafloor seismic, tectonic, and volcanic events occurring at a great distance. The potential of using hydroacoustic techniques to monitor underwater landslides has yet to be fully explored, but it may represent the best approach for detecting unsuspected underwater landslides, as occurred in the 1998 Papua New Guinea (PNG) tsunami (Okal, 2003). However, that detection represents to this day a unique, unrepeated occurrence. Furthermore, the PNG landslide was identified as such because its hydroacoustic signal was too weak for its duration, in violation of earthquake scaling laws. At the same time, T phases can be used to complement the identification of anomalously slow events, such as tsunami earthquakes, because hydroacoustic signals include very high frequencies (3 Hz and above) and their energy bears the imprint of the earthquake at very short periods (Okal et al., 2003).
In this respect, hydroacoustic signals play a complementary role in tsunami warning because they travel slowly (1,500 m/s). However, de Groot-Hedlin (2005) and Tolstoy and Bohnenstiehl (2005) demonstrated that it was possible to use ocean hydrophones to track the rupture of the 2004 Sumatra event from the original epicenter to the termination more than 600 km to the north. The hydrophones were 2,800 and 7,000 km from the epicenter and acoustic propagation required 31-78 minutes while the fault itself ruptured for more than 8 minutes. The information would not be useful for alerting nearby communities but could have provided meaningful warnings for Sri Lanka and more distant countries.
Other properties of T phases can shed some interesting, but again complementary, light on properties of the seismic sources, for example, their duration, along lines similar to the τ1/3 method described earlier. Salzberg (2008) has also proposed to precisely constrain hypocentral depth using the decay of very high frequency (20-80 Hz) T phases from the parent earthquakes. Once such techniques reach an operational status, they could contribute to tsunami warning.
An additional aspect of SOFAR hydrophone sensors is that they can record pressure variations accompanying the passage of the tsunami, and in this sense could supplement the network of DART buoys, as their sensors (in both cases pressure detectors) essentially share the same technology, with the only difference being that the latter are deployed on the ocean bottom. However, within the context of the CTBTO, the Integrated Maritime Surveillance (IMS) sensors have been hard-wired with drastic high-pass filters (with a corner frequency of 10 Hz), and the main spectral components of the 2004 Sumatra tsunami (around 1 mHz) were recorded only as digital noise (Okal et al., 2007). The use of software rather than hardware filters for any future deployment of hydrophones in the SOFAR could be extremely valuable to the tsunami community. The cabled NSF OOI Regional Scale Nodes (RSNs) to be deployed off Washington and Oregon and the existing NEPTUNE-Canada network (see above) could support both bottom pressure gauges as well as hydrophones in the SOFAR channel for enhancing tsunami research and warning in the Cascadia area.
Continuous GPS Measurements of Crustal Movement
When combined with seismic data, continuous global positioning system (GPS) measurements of displacement have proven to be powerful in studying continental earthquakes; for example, in illuminating the processes of earthquake after-slip, creep, and viscoelastic deformation. Continuous GPS can provide a map of the three-dimensional deformation incurred at the surface in the proximity of the epicenter as a result of the earthquake rupture. It provides a resolution to the problem of the long-period component of the seismic source by simply allowing measurement during a time window long enough to be relevant to tsunami generation even for nearby sources.
GPS and broadband seismic measurements differ substantially in that GPS geodetic measurements provide distances between neighboring stations, while individual seismometers are affected by applied forces and signals are proportional to acceleration. Normally, the output of a seismometer is “shaped” to be proportional to velocity above some frequency (1/360 Hz for an STS-1; Appendix G). Because earthquakes cannot apply a constant force at zero fre-
quency, it’s not possible to directly infer displacements from a seismometer. Furthermore, a seismometer is limited by its mechanics and electronics to recording signals smaller than some threshold; arbitrarily large displacements can be measured by GPS.
Bock et al. (2000) demonstrated that GPS receivers can measure ground motion in real time as often as every few seconds. They tested the accuracy of these estimates over baselines as large as 37 km and found that the horizontal components have accuracies no worse than 15 mm; they anticipated that the baselines could be extended to at least 50 km with no further loss in accuracy. The vertical measurements were less useful with accuracies a factor 7-8 times worse. The accuracies have improved over the past decade with the advent of new receivers, new algorithms, and statistical analyses. GPS receivers of 10-50 Hz and methods are now practical and measurements routine (e.g., Genrich and Bock, 2006).
The application of near-real-time, continuous GPS measurements have made great strides as well. For example, Song (2007) used coastal GPS stations (E-W and N-S horizontal measurements) to infer displacements on the seafloor offshore using the location of the fault and inferring the vertical uplift from conservation of mass. Song tested the method against geodetic data from the 2005 Nias, 2004 Sumatra, and 1964 Alaska earthquakes. In the case of Nias and Sumatra, both continuous GPS data as well as campaign GPS data were available. He tested the model against satellite altimetry measurements of the tsunami wave using Topex, Jason, and Envisat data (altimetry profiles included time epochs of 1:55-2:10, 1:48-2:03, and 3:10-3:22 [hr:min after the origin time]). The Nias and Alaska events were also tested against available coastal tide gauge data. The methods were used again after the February 27, 2010, Chile earthquake and later verified by satellite altimetry from JASON-1 & 2 satellites operated by National Aeronautics and Space Administration (NASA) and the French Space Agency.
The successful use of GPS data for these four earthquakes makes a strong case for the use of continuous GPS stations to measure coastal ground displacements to infer the corresponding displacements offshore. In turn, these displacements can be used to predict tsunami generation including accurate wave heights as a function of time, range, and azimuth.
Near-field tsunamis are generated by the rupture of hundreds of kilometers of an offshore subduction fault. As in the case of the Sumatra earthquake this rupture can last as long as eight minutes and more. During this period of time, GPS data will mimic seismic data with oscillatory behavior that obscures the smaller, permanent displacements. The most distant part of the fault from a station can be at least as large as eight minutes of propagation time away, and the displacements generated by that distant source will take as long to propagate back to the station. By that time, however, the static offsets will begin to be apparent, allowing the inference of offshore displacements and realistic assignment of magnitudes (as little as 4-5 minutes after the initiation of faulting). The tsunami associated with the earthquake will not come ashore much earlier than 30 minutes following the beginning of the rupture, and technology-based warnings could be made in time to provide useful warnings. None of these operations lie even remotely outside the capabilities of modern networks, computational workflows, and computing capabilities.
Today there are thousands of GPS geodetic receivers located around the earth. Just in southern California, there are more than 250 continuously recording GPS geodetic stations that
are available in near-real time from a variety of sources (e.g., http://sopac.ucsd.edu; Schmidt et al., 2008). Recently, NSF Geosciences elected to undertake the improvement and densification of seismic and geodetic stations in the Cascadia region including the enhancement of near-real time access to GPS (http://www.oceanleadership.org/2010/nsf-cascadia-initiative-workshop/). Sweeney at al. (2005) have demonstrated that centimeter-level horizontal accuracy can be achieved on the seafloor using GPS coupled to seafloor geodetic monuments using acoustic methods. These technologies might be extended to verify offshore displacements predicted by accurate coastal GPS stations.
Permanent GPS stations should be incorporated into the tsunami warning program and expanded, if needed, to provide tsunami prediction capabilities. Although Cascadia is one of the most critical sites for U.S. tsunami warning in the near-field regions, Alaska and the Caribbean are also critical sites. There are few new technologies that promise such revolutionary approaches for improving tsunami warning, especially in the near-field region.
Conclusion: GPS geodesy, exploiting near-real-time data telemetry from permanent geodetic stations, holds great promise for extending the current seismic networks to include capabilities for measuring displacements in the coastal environment for great and mega-earthquakes. Displacements onshore can potentially be used to infer offshore displacements in times as short as five minutes in an area such as the Cascadia Fault Zone.
Recommendation: NOAA should explore further the operational integration of GPS data into TWC operations from existing and planned GPS geodetic stations along portions of the coast of the United States potentially susceptible to near-field tsunami generation including Alaska, Cascadia, the Caribbean, and Hawaii. Where GPS geodetic coverage is not adequate NOAA should work with NSF and the states in extending coverage including the long-term operation and maintenance of the stations.
Observation of Tsunami Wave Trains with Satellite Altimeters
Satellite altimeter measurement of the ocean’s surface height, in use since 1978, consists of measuring (with a precision of a few centimeters) the deformation of the surface of the ocean by precisely timing the reflection of a radar beam emitted and received at a satellite. Its capability to detect a tsunami was proposed following the 1992 Nicaragua tsunami (Okal et al., 1999), and it achieved a definitive detection following the 2004 Sumatra tsunami, with a signal of 70 cm in the Bay of Bengal (Scharroo et al., 2005; Ablain et al., 2006). (See also the preceding topic, “Continuous GPS Measurements of Crustal Movement.”)
Although the method has obvious promising potential in the field of tsunami warning, two major problems presently hamper its systematic use: (1) delayed processing of the data, which in the case of the 2004 event was made available to the scientific community several weeks after the event, and (2) the presently sparse coverage of the earth’s oceans by altimetry satellites. In lay terms, the satellite has to be over the right spot at the right time; in the case of the Sumatra tsunami, the passage of two satellites over the Bay of Bengal as the tsunami propa-
gated across was a lucky coincidence. Thus, making satellite altimetry operational for tsunami warning requires geostationary satellites over the ocean basins of interest, or a dense array of low earth orbit (LEO) satellites, with either set-up providing data availability in near-real time. In fact, Iridium Communications, Inc. is designing its second generation of LEO communications satellites (called Iridium NEXT), which are expected to be fully deployed by 2016 and will carry scientific payloads such as altimeters for sea height determination, including observation of tsunamis (http://www.iridium.com/About/IridiumNEXT/HostedPayloads.aspx). The planned constellation of 66 satellites suggests that a tsunami created anywhere in the world could be observed close to the moment of inception. At the present time, however, the NEXT constellation is not being touted as a tool for operational tsunami warning.
Tsunami-Induced Sea-Surface Roughness and “Tsunami Shadows”
Godin (2004) theoretically justified so-called “tsunami shadow” observations (Walker, 1996), namely that the surface of the ocean exhibits a change of appearance during the propagation of a tsunami. In simple terms, the tsunami creates a coherent change in sea-surface slope, inducing turbulence in wind currents at the surface, which in turn results in enhanced roughness of the sea- air interface. Godin et al. (2009) further showed that the phenomenon was detectable in the form of anomalous scattering in the radar signal from the JASON satellite altimeter, during its transit over the wavefront of the 2004 Sumatra tsunami in the Bay of Bengal. This remarkable scientific confirmation and physical explanation of what had amounted to anecdotal reports provides some promise as a complementary means of near-real-time tsunami detection. In its reported form, the method suffers from the same limitations as satellite altimetry, namely the need to have a satellite at the right place at the right time. On the other hand, it may be feasible to develop a land-based detector of sea-surface roughness using over-the-horizon radar technology.
Direct Recording of Tsunami Waves by Island Seismometers
Another notable observation made in the wake of the 2004 Sumatra event was that the actual tsunami wave was detectable on horizontal long-period seismometers located on oceanic islands or on the shores of continental masses (e.g., Antarctica) (Yuan et al., 2005). Okal (2007b) later verified that such signals could be extracted from past events (e.g., Peru, 2001), and showed that the recordings expressed the response of the seismometer to the combined horizontal displacement and tilt of the ocean floor during the passage of the tsunami wave, the latter having such large wavelengths (typically 300 km) that the structure of a small island can be neglected. In particular it was verified that such records could be interpreted quantitatively on this basis, which amounts to saying that near-shore seismometers can play the role of tsunameters deployed on the high seas for tsunami detection. The present network of island seismic stations (see Figure 4.1) thus has the potential of increasing the density of the tsunami (sea level) detection network, at essentially no cost, since the stations already exist.
“Upward Continuation” of the Tsunami Wave and Its Detection in Space
Because of the finite density of the atmosphere, a tsunami wave does not stop at the surface of the sea, but induces a displacement of the atmosphere, in the form of a gravitational wave accompanying the tsunami during its propagation. The volumetric energy density of this upward continuation of the tsunami decreases with height, but because the atmosphere rarefies even faster, the amplitude of the resulting vibration will actually increase with height. A tsunami wave of amplitude 10 cm at the surface of the ocean will reach 1 km at the base of the ionosphere at an altitude of 150 km. This fascinating proposition was initially suggested by Peltier and Hines (1976) and confirmed by Artru et al. (2005) during the 2001 Peruvian tsunami. The detection methodology uses dense arrays of GPS receivers, because large-scale fluctuations of the ionosphere affect the propagation of the electromagnetic waves from the GPS satellites, thus distorting the signals recorded at the receivers. Occhipinti et al. (2006) have successfully modeled such records quantitatively and have shown that other space-based techniques involving reflection at the bottom of the ionosphere (e.g., over-the-horizon radar) could be useful for remote detection of a tsunami on the high seas without the need to instrument the ocean basin itself. The speed of propagation of the atmospheric gravity wave, however, is very low and presents an even greater complication than that described above for acoustic propagation in the ocean’s SOFAR channel.
Conclusion: Novel and potentially useful approaches to the estimation of earthquake magnitude and tsunami detection are emerging. Some of these approaches could become operational in the not-too-distant future with proper support for research and testing.


