
6
Tracking Footprints of Maize Domestication and Evidence for a Massive Selective Sweep on Chromosome 10
FENG TIAN,* NATALIE M. STEVENS,* and EDWARD S. BUCKLER IV*†‡
Maize domestication is one of the greatest feats of artificial selection and evolution, wherein a weedy plant in Central Mexico was converted through human-mediated selection into the most productive crop in the world. In fact, the changes were so astounding that it took much of the last century to identify modern maize’s true ancestor. Through modern genetic studies, the molecular basis of this evolution is being unraveled. Maize’s new morphology and adaptation to diverse environments required selection at thousands of loci, and we are beginning to understand the magnitude and rates of these genetic changes. Most of the known major genes have experienced strong selection, but only small regions surrounding the selected genes exhibit substantially reduced genetic diversity. Here, we report the discovery of a large region on chromosome 10 involved in adaptation or domestication that has been the target of strong selection during maize domestication. Unlike previously described regions in the maize genome, 1.1 Mb and >15 genes lost genetic diversity during selection at this region. Finally, the prospects of a detailed understanding of maize evolution are discussed with consideration of both top-down and bottom-up approaches.
Although man does not cause variability and cannot even prevent it, he can select, preserve, and accumulate the variations given to him by the hand of nature almost in any way that he chooses; and thus he can certainly produce a great result.
Charles Darwin (1868b)
With its meager ear containing only 2 entwined rows of well-armored kernels, teosinte grows on Mexican hillsides. This grass might easily have been overlooked were it not for its abundant variation, a gift not lost on early agriculturists. Within the last 10,000 years, early Native Americans were able to transform teosinte into a plant whose ears would feed the world. It was a transformation so striking and so complex that some researchers did not believe it was possible, leading to years of competing theories and intense debate. But as Darwin himself recognized, when the desires of humans meet the diversity of nature the result can indeed be astounding.
The molecular revolution of the last 2 decades has provided compelling evidence that teosinte is the progenitor of modern maize. Here, we discuss the rich genetic diversity at the source of this morphological conversion and examine how human selection has impacted this diversity. One key question concerning maize domestication remains to be resolved: Was maize domestication the result of selection on a small number of loci with large effects, a large number of loci with small effects, or both? Recent genetic evidence has provided clues about the relative contributions of large-effect and small-effect loci. We discuss how future studies will help unravel the mysteries surrounding maize domestication and how this information is key to future improvements of maize.
ORIGINS OF MAIZE
Maize (Poaceae) is a member of the world’s most successful family of agricultural crops, including wheat, rice, oats, sorghum, barley, and sugarcane. Maize belongs to the genus Zea, a group of annual and perennial grasses native to Mexico and Central America. The genus Zea includes wild taxa known collectively as teosinte (Zea mays ssp. parviglumis) and domesticated corn or maize (Z. mays ssp. mays).
For many years, relationships within the genus Zea were the subject of much controversy. The central difficulty in the taxonomy of maize and the identification of its closest relatives was the absence of a coblike pistillate inflorescence, or “ear,” in any other known plant. Whereas teosinte produces only 6–12 kernels in 2 interleaved rows protected by a hard outer covering (Fig. 6.1), modern maize boasts a cob consisting of as
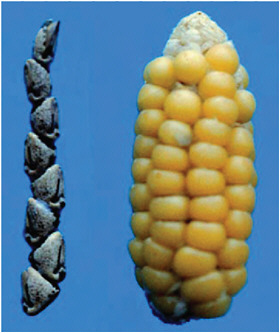
FIGURE 6.1 The seed spike, or ear, of teosinte (Z. mays ssp. parviglumis) consists of 2 interleaved rows of 6–12 kernels enclosed in a hard fruitcase (cupule). This female inflorescence, which differs so dramatically from that of maize, has led to much controversy and debate surrounding the origins of maize. (Photos by John Doebley.)
many as 20 rows or more with numerous exposed kernels. In fact, teosinte is so unlike maize in the structure of its ear that 19th-century botanists failed to recognize the close relationship between these plants, placing teosinte in its own genus, Euchlaena (Doebley, 1990). Essentially, every new genetic technology and approach developed over the last century has been applied in an effort to resolve the question of precisely how teosinte and modern maize are related genetically.
The tremendous differences in morphology between teosinte and maize led Paul Mangelsdorf and his colleague Robert Reeves in the late 1930s to propose the Tripartite Hypothesis (Mangelsdorf and Reeves, 1938, 1939; Mangelsdorf, 1974). This hypothesis stated that maize was domesticated from a now-extinct wild maize from South America; teosinte originated from a cross between maize and another grass, Tripsacum; the abundant diversity in maize was thought to be caused by “contamination” of Tripsacum chromosomes. This hypothesis was validated by their successful cross of maize and Tripsacum, although only a few, largely sterile maize-Tripsacum hybrids were obtained through surgical rescue of embryos. They also analyzed backcross populations of maize-teosinte hybrids and identified 4 factors (which they interpreted as 4 Tripsacum chromosomal segments)
responsible for the morphological differences between maize and teosinte (Mangelsdorf and Reeves, 1938, 1939; Mangelsdorf, 1974).
For George Beadle, however, the morphological differences between maize and teosinte were not so large as to require an extinct ancestor. In his Teosinte Hypothesis, Beadle stated that maize is simply a domesticated form of teosinte (Beadle, 1939). He believed that, through artificial selection by ancient humans, several mutations with relatively large effects could have transformed teosinte into maize. Beadle actually used Mangelsdorf and Reeves’s own data against them, claiming that their 4 factors might just as well correspond to 4 major genes, each of which controlled a single trait that differentiated teosinte from maize. He also challenged their idea that a cross between maize and Tripsacum, which took Herculean efforts, would have ever occurred in nature.
Despite these profound physical differences and controversial hypotheses, various morphological, cytological, and genetic studies would eventually delineate relationships within the genus Zea. H.G. Wilkes laid the foundation for the current classification scheme in 1967 with the first thorough monograph on teosinte (Wilkes, 1967). This work was expanded by the rigorous evaluation of numerous traits and the discovery of many new populations by Sanchez et al. (1998). In 1980, Hugh Iltis and John Doebley (Doebley and Iltis, 1980; Iltis and Doebley, 1980) produced a system of classification that considered the probable evolutionary relationships between Zea taxa.
The issue was further resolved through numerous molecular and cytogenetic studies over the last century. One early indication that maize is strongly allied with teosinte came from studies of both chromosome morphology and number. Most Zea species and subspecies, including maize, have 10 chromosomes (Kato, 1976; Kato and Lopez, 1990), whereas most Tripsacum species have either 18 or 36 chromosomes (Mangelsdorf and Reeves, 1938, 1939). Additionally, the cytogenetic chromosomal knobs of maize are most similar to knobs of Z. mays ssp. parviglumis and mexicana (Mangelsdorf, 1974; Kato, 1976; McClintock et al., 1981). Molecular genetic findings have consistently refined these relationships with data from isozymes (Doebley et al., 1984), chloroplast DNA (Doebley et al., 1987), and ribosomal DNA (Buckler and Holtsford, 1996), all of which implicate ssp. parviglumis as the closest living relative of modern maize. Simple sequence repeat markers later suggested that maize was derived in a single domestication event from ssp. parviglumis from the Balsas River valley (Matsuoka et al., 2002). That study revealed that ssp. mexicana is separated from all maize (ssp. mays) samples, whereas samples of ssp. parviglumis overlap those of maize, documenting the close relationship between ssp. parviglumis and maize and supporting the phylogenetic inference that the latter subspecies was the sole progenitor of maize (Matsuoka et al., 2002).
The overall result of these analyses is that the 2 relevant subspecies of Z. mays (i.e., Z. mays ssp. mays, and Z. mays ssp. parviglumis) are only slightly differentiated from one another throughout most of their genomes but have, in a very short period, evolved very different morphologies.
Maize has varied in an extraordinary and conspicuous manner.
Charles Darwin (1868b)
VARIATION: THE FOOD OF EVOLUTION
The ability of Native Americans and modern breeders to transform a wild grass into the world’s largest production grain crop is not only the product of skillful breeding, but also a tribute to the tremendous diversity of the teosinte genome. Millennia before Darwin’s time, these ancient farmers first practiced what Darwin would later preach, that selection must be combined with natural variation for evolution to take place. As it turns out, teosinte is extremely diverse, with modern molecular studies measuring nucleotide diversity at silent sites in Z. mays ssp. parviglumis at ≈2–3% (Goloubinoff et al., 1993; Eyre-Walker et al., 1998; Hilton and Gaut, 1998; White and Doebley, 1999; Whitt et al., 2002). This begs the question as to why Z. mays ssp. parviglumis has such high genetic diversity. In general, population genetic theory predicts that the level of selectively neutral molecular diversity is a joint function of mutation rate and effective population size, both of which would seem to be large in Z. mays ssp. parviglumis. A high rate of mutation has been documented in grasses (Gaut et al., 1996), and population size for this wild grass has historically been quite large, especially for the teosintes near maize’s region of origin (Moeller et al., 2007).
Any 2 maize varieties differ from one another in 1.4% of their DNA (silent sites) (Tenaillon et al., 2001). This level of nucleotide diversity is 2- to 5-fold higher than that of other domesticated grass crops and 14 times higher than that of humans. Indeed the divergence between 2 maize lines is approximately equivalent to the difference between humans and chimpanzees (Chen and Li, 2001). This high level of genetic diversity results mainly from the unusually large amount of genetic diversity in its wild progenitor, Z. mays ssp. parviglumis, and the absence of a severe domestication bottleneck. Indeed, maize has apparently maintained a substantial proportion (60–70%) of the variation of its wild progenitor (Tenaillon et al., 2001; Wright et al., 2005), probably because humans (both ancient and modern) rely heavily on domesticated corn as a basis for subsistence, requiring thousands of plants to produce sufficient food for even small family groups (Hillman and Davies, 1990; Buckler et al., 2001). However, this is not the case for some other domesticated crops.
For example, tomato experienced a very severe genetic bottleneck as the crop was carried from the Andes to Europe, resulting in a loss of ≈95% of genetic diversity (Miller and Tanksley, 1990; Bai and Lindhout, 2007), probably because the selection of a horticultural crop like tomato is usually done on a single-plant basis with small numbers of selected plants (Bai and Lindhout, 2007).
WHAT WERE THE STEPS OF DOMESTICATION LIKE?
On the surface, both dueling hypotheses (i.e., Tripartite Hypothesis and Teosinte Hypothesis) focused on the origins of corn, but at the core of the controversy was a Darwinian debate that was much more fundamental and far-reaching. In one corner were evolutionary traditionalists who held that evolution proceeds slowly over time, because of the accumulation of many small changes in numerous genes. For them, the dramatic transformation from teosinte to maize was deemed impossible in the mere 10,000 years that humans have been domesticating plants, and a more “logical” starting point for natural selection was needed. In the other corner were people like Beadle and Emerson who saw evolution as being more rapid if propelled by changes in a few significant genes. So, although teosinte and maize look strikingly different, the observed differences might be accounted for by only a few major genes, thus explaining why the 2 plants were otherwise genetically similar.
Indeed, the size of the individual evolutionary step depends strongly on the trait under consideration. As we will show below, the initial morphological changes that enabled the shift from a wild grass to a grass whose reproduction depends on humans likely involved only a few genes with large effects. Adaptation to different environments and the increase in harvestable yield, however, probably involved thousands of genes with small effects.
Recent quantitative trait loci (QTL) analyses have provided evidence supporting the notion that a few regions of the maize genome specify the key traits that distinguish maize from teosinte. Beadle conducted what could be considered the intellectual precursors of such QTL analyses. Using basic Mendelian ratios from 50,000 maize and teosinte hybrids, Beadle (1972, 1977, 1980) recognized that as few as 5 loci might be involved in important ear and plant morphological changes. More than 20 years later, QTL mapping would validate this hypothesis, identifying 5 regions of the maize genome with large effects on basic morphology (Doebley et al., 1990; Doebley and Stec, 1991). Two of these regions have now been characterized thoroughly.
A single major locus, teosinte glume architecture1 (tga1), has been identified as a QTL controlling the formation of the tough protective covering on
teosinte kernels that is mostly lacking in maize (Dorweiler et al., 1993). The stone-like fruitcase surrounding teosinte kernels assures their unscathed passage through an animal’s digestive tract, allowing seed dispersal. Because teosinte’s hard glumes made it very difficult to eat, Native Americans were likely growing, harvesting, and grinding teosinte kernels themselves before the mutation leading to a softer glume came along. Thus, this mutation was probably among the first targets of selection during the domestication process. We now know that a single amino acid mutation in a transcription factor is the most likely cause of this radical change (Wang et al., 2005). And given the radical change in phenotype, it is not surprising that this mutation is not present in teosinte, which would likely be very deleterious in the wild. Given a number of assumptions, the selection intensity can be estimated at 3–4% (Wang et al., 2005). Despite this high intensity, the genomic region encompassed by this selective sweep is relatively small (the 3′ end of the gene retains substantial diversity in common with teosinte), an outcome that appears to be consistent with the maintenance of rather large population sizes and relatively unrestricted recombination throughout the domestication process.
A second locus, teosinte branched1 (tb1), which dictates a difference in plant architecture (long lateral branches terminated by male tassels in teosinte vs. short lateral branches tipped by female ears in maize) has been successfully cloned (Doebley et al., 1995, 1997; Wang et al., 1999). Because this locus represents a key step in maize domestication, its nucleotide diversity should be reduced when compared with neutral sites. Indeed, within the promoter region of tb1, maize possesses only 3% of the diversity found in teosinte (Wang et al., 1999). As is also true for tga1, selection does not appear to have reduced diversity throughout the entire gene. However, the low-diversity region extends 60 kb upstream regions containing some repetitive DNA but no other genes (Clark et al., 2004). Although there is some evidence for multiple functional elements in tb1, the major element is 60 kb upstream of the gene (Clark RM, et al., 2006). There is also evidence for a second, distant interfering sweep at this locus (Camus-Kulandaivelu et al., 2008). The timing and sequence of such character selection by early farmers is now being revealed by the fusion of molecular biology and archaeological research. Surveys of tb1 in ancient DNA have suggested that selection at this locus occurred 4,400 years ago (Jaenicke, 2003). It appears that the allele for this transformation is present in teosinte, but this possibility needs to be tested rigorously (i.e., by unraveling the full allelic series). The fitness of this locus in wild plants and whether the gene might be advantageous in particular environments is also unclear.
The large phenotypic effects of tga1 and tb1 undoubtedly facilitated their molecular cloning. However, how representative are these genes for
the genetic basis of the domestication syndrome? With the development of a larger QTL mapping population with more power to detect QTL, Briggs et al. (2007) were able to identify more regions that contributed to the morphology of domesticated maize. In total, they detected 314 QTLs for 22 morphological traits over 2 locations. Of these, only 14 QTLs individually explained >10% of the phenotypic variation in a given trait. Most of these 14 QTLs are large-effect loci identified as essential for the transformation of teosinte to maize (Doebley and Stec, 1993). The number of QTLs detected per trait varied substantially from 6 to 26. Interestingly, for some traits they did not detect large-effect QTLs but only a number of small-effect QTLs. These results suggested that although a few genes may make the species dependent on humans for propagation, the subsequent process of genetic modification to meet human needs such as increased harvestable yield and better kernel quality or adaptation to local environments might have involved more loci with small effects, resulting in a more complex evolutionary pattern. Indeed, large-scale surveys of molecular diversity have indicated that thousands of genes might have been involved in the domestication and improvement processes. Recently, the characterization of agronomically important pathways and the dissection of complex traits have further enhanced our understanding of maize domestication.
Surveys of random markers and genes throughout the maize genome suggested that numerous genes have been targets of selection since domestication (Vigouroux et al., 2002, 2005; Wright et al., 2005; Yamasaki et al., 2005). In screens of microsatellites, ≈5% of the genome was deduced from indirect evidence to have been targeted by selection (Vigouroux et al., 2002, 2005). In their survey of 774 maize genes, Wright et al. (2005) provided another estimate of the proportion of the genes under selection: ≈2–4%. If the maize genome contains 59,000 genes, Wright et al.’s estimation suggested that a minimum of 1,200 genes throughout the genome have been targets of selection during maize domestication.
Starch is the key product of maize, accounting for 73% of the kernel’s total weight. The genes involved in starch synthesis are among the most important for grain production, critical to both the yield and the quality of the grain. Association analysis of 6 major candidate genes involved in starch biosynthesis (ae1, bt2, sh1, sh2, su1, and wx1) revealed that 4 of them were significantly associated with either starch concentration or composition, each of which explained <10% of phenotypic variation (Wilson et al., 2004). The survey of the nucleotide diversity and selection testing at these 6 genes was striking. Four of the 6 loci exhibited evidence of selection (Whitt et al., 2002). Ancient DNA analysis from maize samples unearthed in Mexico and the southwestern United States has also revealed that the su1 alleles known to occur in modern maize were
likely under selection between 1,800 and 900 years ago (Jaenicke, 2003). These results suggested that Native Americans and modern breeders might have focused on improving the yield of starch and favored different amylopectin qualities.
The genetic dissection of maize flowering time and kernel composition has also argued that, despite large changes in phenotype, the alleles at the basis of these traits generally have small effects. Today, maize landraces flower from 36 days to >180 days after planting (M. Goodman, personal communication). But even at the Vgt1 locus, one of the biggest effect genes involved in the adaptation to northern environments has only a 1.5-day effect (Salvi et al., 2007; J. Peiffer, personal communication).
To investigate the genetic architecture of kernel oil content, the University of Illinois has conducted the world’s longest controlled selection experiment; they have selected for maize with high and low kernel oil concentration for >70 generations. This selection has expanded the range of phenotypic variation ≈20-fold between high and low oil lines. However, a molecular QTL analysis suggested that >50 genes control the variation with no major genes (Laurie et al., 2004).
SELECTION ON CHROMOSOME 10
Several large-effect QTLs for local adaptation (Ribaut et al., 1996; Bouchez et al., 2002; Mano et al., 2008; Wang et al., 2008) and domestication traits (Briggs et al., 2007) have been localized to the vicinity of bin 10.04 on chromosome 10. These studies suggest that recent positive selection for domestication and adaptation traits may have played an important role in shaping patterns of genetic diversity in this region. We evaluated this hypothesis by resequencing a diverse panel of maize and teosinte germplasm (see Materials and Methods). Here, we demonstrate that this region exhibits a more extensive signal for positive selection than any other known region in the maize genome.
Initially, sequencing of candidate genes under a chromosome 10 QTL peak highlighted ZmETR2, a maize orthologue of the Arabidopsis ethylene receptor ETR2 (Sakai et al., 1998). ZmETR2 had unusually low genetic diversity in maize relative to teosinte, suggesting possible selection at this locus. To investigate the signature of selection in this region in more detail, we sequenced 22 loci spanning ≈4 Mb in a panel of 28 diverse maize inbreds and 16 teosinte (Z. mays ssp. parviglumis) inbreds (see Materials and Methods). Maize exhibits severely reduced nucleotide diversity relative to teosinte across a 1.1-Mb region of chromosome 10 (Fig. 6.2A). Only 3.6% of the silent site diversity was retained in maize as compared with teosinte (Table 6.1). This extreme reduction of diversity suggested that functional variants within this 1.1-Mb region might have experienced recent and strong positive selection.
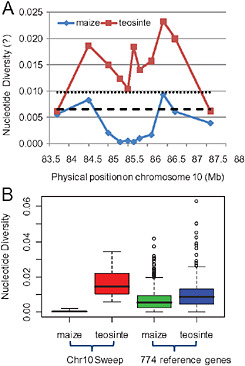
FIGURE 6.2 Nucleotide variation of studied regions on chromosome 10. (A) Nucleotide diversity (π) for maize and teosinte along the investigated regions on chromosome 10. The dotted line and dashed line represent the average nucleotide diversity of 774 genes (Wright et al., 2005) in teosinte and maize samples, respectively. (B) The comparison of nucleotide diversity (π) between chromosome 10 selective sweep and 774 reference genes (Wright et al., 2005).
To delimit the region affected by the selective sweep, we performed 3 selection tests. (i) We compared the observed heterozygosity in maize and teosinte samples to those from simulations to determine whether the empirical pattern is significantly different from that expected under the standard neutral demographic models. We detected significant deviations from neutral expectation at loci 4–20 in maize (P < 0.05) (Table 6.1). No significant deviations from neutral expectations were observed at loci 1–3 and loci 21–23 in maize samples and all loci in teosinte samples. (ii) We used the HKA test (Hudson et al., 1987) to examine within-species polymorphisms and between-species divergence. Under the neutral theory of molecular evolution, the amount of within-species diversity should be correlated with levels of between-species divergence (Kimura, 1983). We first examined the heterogeneity of the polymorphism to divergence ratio across the studied loci. We found significant heterogeneity across investigated loci in maize (χ2 = 17.65, P = 0.016), suggesting that these loci
TABLE 6.1 Summary of Sequence Data of Chromosome 10 Regions Investigated
|
Locus |
Position, Mb |
Maize |
Teosinte |
πmaize/πteosinte (%) |
||||||||||||
|
N |
L |
S |
πsilent |
θsilent |
Tajima’s D |
k |
N |
L |
S |
πsilent |
θsilent |
Tajima’s D |
k |
|||
|
1 |
83.70 |
14 |
191 |
2 |
0.0056 |
0.0032 |
1.932 |
NA |
13 |
198 |
4 |
0.0062 |
0.0065 |
−0.153 |
NA |
89.7 |
|
2 |
84.50 |
27 |
497 |
4 |
0.0083 |
0.0069 |
0.550 |
0.024 |
15 |
462 |
9 |
0.0187 |
0.0201 |
−0.524 |
0.023 |
44.4 |
|
3 |
85.00 |
21 |
377 |
2 |
0.0021 |
0.0061 |
−1.514 |
0.027 |
8 |
467 |
11 |
0.0150 |
0.0138 |
−0.958 |
0.028 |
14.0* |
|
4 |
85.30 |
26 |
413 |
1 |
0.0004** |
0.0006** |
−0.714 |
NA |
12 |
400 |
19 |
0.0124 |
0.0157 |
−0.930 |
NA |
3.2** |
|
5 |
85.50 |
27 |
474 |
0 |
0.0000** |
0.0000** |
NA |
NA |
11 |
475 |
25 |
0.0152 |
0.0180 |
−0.718 |
NA |
0.0** |
|
6 |
85.50 |
28 |
334 |
1 |
0.0006** |
0.0008* |
−0.363 |
NA |
12 |
336 |
15 |
0.0104 |
0.0148 |
−1.268 |
NA |
5.8** |
|
7 |
85.65 |
27 |
405 |
0 |
0.0000** |
0.0000** |
NA |
NA |
9 |
429 |
16 |
0.0157 |
0.0146 |
0.385 |
NA |
0.0** |
|
8 |
85.65 |
28 |
446 |
1 |
0.0002** |
0.0006** |
−1.151 |
0.052 |
11 |
465 |
12 |
0.0061 |
0.0066 |
−0.758 |
0.054 |
3.3** |
|
9 |
85.65 |
25 |
559 |
1 |
0.0000** |
0.0000** |
−1.151 |
0.041 |
10 |
683 |
26 |
0.0219 |
0.0230 |
−0.283 |
0.05 |
0.0** |
|
10 |
85.65 |
28 |
626 |
1 |
0.0016** |
0.0009** |
1.213 |
0.026 |
12 |
627 |
11 |
0.0132 |
0.0139 |
−0.212 |
0.027 |
12.1* |
|
11 |
85.65 |
27 |
582 |
1 |
0.0000** |
0.0000** |
−0.338 |
0.009 |
12 |
552 |
5 |
0.0142 |
0.0134 |
0.227 |
0.003 |
0.0** |
|
12 |
85.65 |
27 |
716 |
0 |
0.0000** |
0.0000** |
NA |
0.021 |
8 |
714 |
7 |
0.0086 |
0.0100 |
−0.667 |
0.020 |
0.0** |
|
13 |
85.65 |
28 |
561 |
0 |
0.0000** |
0.0000** |
NA |
0.057 |
11 |
515 |
14 |
0.0089 |
0.0093 |
−0.183 |
0.057 |
0.0** |
|
14 |
85.65 |
27 |
787 |
1 |
0.0002** |
0.0003** |
−0.728 |
NA |
14 |
751 |
20 |
0.0068 |
0.0084 |
-0.784 |
NA |
2.9** |
|
15 |
85.65 |
27 |
610 |
1 |
0.0003** |
0.0004** |
−0.338 |
NA |
11 |
570 |
48 |
0.0290 |
0.0300 |
0.045 |
NA |
1.0** |
|
16 |
85.65 |
26 |
466 |
3 |
0.0009** |
0.0017* |
−1.090 |
NA |
8 |
558 |
51 |
0.0344 |
0.0353 |
0.035 |
NA |
2.6** |
|
17 |
85.65 |
28 |
660 |
3 |
0.0006** |
0.0012** |
−1.165 |
NA |
10 |
652 |
64 |
0.0338 |
0.0352 |
−0.200 |
NA |
1.8** |
|
18 |
85.65 |
26 |
501 |
3 |
0.0006** |
0.0016* |
−1.513 |
NA |
11 |
557 |
48 |
0.0296 |
0.0307 |
−0.165 |
NA |
2.0** |
|
19 |
85.80 |
27 |
720 |
9 |
0.0010** |
0.0036 |
−2.275** |
NA |
11 |
750 |
29 |
0.0142 |
0.0129 |
−0.073 |
NA |
7.0** |
|
20 |
86.10 |
26 |
421 |
3 |
0.0017** |
0.0019* |
−0.216 |
NA |
14 |
461 |
28 |
0.0158 |
0.0191 |
−0.743 |
NA |
10.8** |
|
21 |
86.40 |
26 |
595 |
21 |
0.0094 |
0.0161 |
−1.496 |
NA |
13 |
586 |
28 |
0.0233 |
0.0261 |
−0.421 |
NA |
40.3 |
|
22 |
86.70 |
27 |
487 |
12 |
0.0061 |
0.0089 |
−0.846 |
NA |
15 |
467 |
22 |
0.0200 |
0.0206 |
−0.241 |
NA |
30.5* |
|
23 |
87.60 |
25 |
670 |
5 |
0.0039 |
0.0023 |
1.967 |
0.025 |
11 |
666 |
12 |
0.0063 |
0.0068 |
−0.411 |
0.026 |
61.9 |
|
NOTES. Locus 1, pza00048 obtained from Wright et al. (2005); 2, pzb03525; 3, pzb03526; 4, pzb03527; 5, pzb03528; 6, pzb03529; 7–18, pzb03530–pzb03532, pzb02831, pzb03533–pzb03540; 19, pzb03541; 20, pzb03542; 21, pzb03543; 22, pzb02753; 23, pzb02851. The relative physical locations of investigated regions are based on the Maize Agarose FPC Map (www.genome.arizona.edu/fpc/maize). N, number of sequence; L, the length of a given locus; S, number of segregating sites; π and θ were estimated for noncoding and synonymous sites; k, divergence between maize or teosinte and Tripsacum dactyloides. NA, not available. *Significant at the 0.05 level. **Significant at the 0.01 level. |
||||||||||||||||
have experienced different evolutionary histories. Then, using 9 known unlinked neutral genes (Tenaillon et al., 2001) as controls, we found significant departures from neutral expectation at loci 8–13 (χ2 = 54.08, P < 0.0001) in maize. Locus 3 is marginally significant (χ2 = 12.83, P = 0.095), and loci 2 and 23 are not significant (P = 0.186 and 0.119, respectively). We did not detect any significant departure from neutral expectations in teosinte samples in any of the tests. Moreover, we can exclude selective constraints and low mutation rates as reasons for the observed pattern because neither divergences in maize or teosinte were found to be significantly different from the genomewide average when using Tripsacum dactyloides as an outgroup (Table 6.1). (iii) We evaluated the probability of the observed reduction of genetic diversity in maize relative to teosinte under the neutral maize domestication bottleneck model. We simulated a population bottleneck for each studied locus by using parameters of the maize domestication bottleneck model established in Wright et al. (2005) (see Materials and Methods). Significant deviations from expectations under a neutral domestication bottleneck were detected at loci 3–20 (P < 0.05), suggesting that the severe loss of genetic diversity at loci 3–20 in maize relative to teosinte cannot be explained by the maize domestication bottleneck alone. Thus, selection might have strongly shaped the genetic diversity of these loci.
Phylogenetic analysis of the investigated region revealed a star-like phylogeny within this swept region, a typical characteristic of selective sweep (Kaplan et al., 1989; Meiklejohn et al., 2004). Outside of the swept regions, however, the genealogies reverted to neutral expectation, with all maize samples interspersed with teosinte samples.
The large interval (1.1 Mb) affected by this selective sweep suggested that selection was recent and strong. However, the size of this sweep could be caused by a low local recombination rate. Preliminary evidence from mapping populations suggested that the local recombination is suppressed ≈5-fold (M. McMullen, personal communication). Indeed, the nucleotide estimates of population recombination rate indicated that the recombination rate across the sweep region (Rn = 0.0414) was ≈3-fold lower than it was at the known selection target, tga1 [Rn = 0.1205 (Wang et al., 2005)]. This result suggested that low recombination has contributed to the size of the sweep, but probably, low recombination does not fully explain the 10- to 30-fold difference in size of the selective sweeps between the chromosome 10 region and those at tga1 and tb1.
We next assessed the strength of selection responsible for the chromosome 10 sweep. Kim and Stephan (2002) proposed a composite likelihood ratio (CLR) test for detecting positive selection along a recombining chromosome. This method compares the likelihood of the observed pattern of nucleotide sequence variation under either a selective sweep or a standard
neutral model. If the resulting LR ratio is significant, this test will provide estimates of selection strength and selection target. We applied the CLR test to a contiguous region in the ZmETR2 region (loci 7–18), because discontiguous sequences increase the chance of false positives (Pool et al., 2006). This restriction made our results more conservative. We detected a significant LR for a selective sweep model versus a neutral model (LR = 64.7, P < 0.001). However, because the CLR test is under the assumption of a randomly mating population of constant size, undetected population structure or a recent bottleneck might produce a similar nucleotide variation pattern as selective sweep (Jensen et al., 2005). To accommodate this weakness in the CLR test, Jensen et al. (2005) proposed a goodness of fit (GOF) test to discriminate between positive selection and nonselective effects. In the GOF test, the selection scenario produced by the CLR test was used as null distribution to evaluate the significance of observed GOF value. We detected a nonsignificant GOF value (┴GOF = 52.37; P = 0.661), suggesting that our rejection of the neutral model in the CLR test is not caused by population structure or demographic forces. In other words, positive selection rather than demography is the likely cause of the pattern observed. Furthermore, the estimated selection strength parameter (2Ns = 22,187.8) is far greater than the value for tga1 (2Ns = 9,232) (Wang et al., 2005). Assuming an effective population size for maize of 100,000 (Wang et al., 2005), the selection coefficients for tga1 and the chromosome 10 selective sweep are 0.046 and 0.111, respectively. Because we used a more conservative parameter of θ, the selection coefficient of the selective sweep on chromosome 10 is at least 2.4 times larger than that of tga1. Strong selection strength surely contributed to the size of the sweep.
Although this large sweep region was not detected by a 774-gene survey by Wright et al. (2005), large sweeps like this have been found in other situations. Among American maize varieties in the 1920s, there was also very strong selection for yellow color, which produced a large sweep around the y1 locus in maize breeding lines (Palaisa et al., 2003, 2004). A similar pattern was observed at the waxy locus in rice (Olsen et al., 2006) and the Sod locus in Drosophila melanogaster (Saez et al., 2003). The challenge for the future is to reconcile how these extremely different patterns of evolution and selection have occurred.
THE FUTURE OF THE REVOLUTION
It was 150 years ago that Darwin so skillfully used domesticated plants and animals to help argue for evolution and natural selection. Over the last 100 years, maize has been a prime example for studying evolution, and tremendous strides have been made in understanding its origins, the genetics of the evolution, the strength of selection, and the archaeological
context. For understanding selection, the patterns are tremendously varied. We have examples of nearly every type of selection footprint: on standing variation and on novel mutations, a few large-effect genes and large numbers of selected genes with apparently small phenotypic effects, small single selective sweeps, and a few massive sweeps. Because we are in the midst of a genomics revolution, tremendous opportunities exist to advance our understanding of molecular processes. Over the next 2 decades we should be able to identify more genes involved in domestication, pinpoint the allelic variants favored through time, and evaluate successful and failed genetic alterations through time and space. Top-down and bottom-up approaches (Ross-Ibarra et al., 2007) are complementary and can be combined to improve our understanding of the domestication process.
The bottom-up approaches are being supercharged by next-generation sequencing, which is providing tremendous opportunities for understanding the regions of selection across the maize genome. With the completion of maize genome sequencing, and the first-generation resequencing to produce a high-resolution maize HapMap, we should soon be able to screen the entire genome for selection and identify a basic set of genes that have been targeted by selection during the domestication of maize. Indeed, we might start to evaluate the relative importance of all kinds of selection patterns. However, such genomic analyses alone will not provide precise information on when, where, and why these regions were targets of selection.
How did varieties of maize adapt to diverse environments throughout the globe? Through the exceptional efforts of maize germplasm curators over the last century, well over 20,000 landraces of maize have been collected throughout the Americas. By combining a global sample of landraces (Vigouroux et al., 2008) with whole genome sequencing, adaptation can be evaluated. Additionally, by relating presumptive adaptations to the increasingly rich Geographic Information System databases on climate and soils, the polymorphisms involved with environmental differentiation may be identified. Although similar molecular studies have been conducted to understand human differentiation around the globe (Rosenberg et al., 2002), these targets of differentiation in maize can be studied experimentally and, most importantly, can be applied to adapting future maize varieties to the world’s rapidly changing environments.
What is the timing and tempo of these selection events? The tempo of selection was important to Darwin and is still a central issue today. With molecular data, we can estimate the intensity of selection and the time since a selective sweep. However, each assessment requires a number of assumptions that include modeling population size, historical recombination rates, migration, and mutation rates. Although there have been some tremendous strides in such modeling, domesticated crops provide a great opportunity to empirically test particular assumptions. Millions
of archaeological botanical samples are available for DNA analysis that can provide hard data on the progress of selection at particular places and times (Piperno et al., 2007; Pohl et al., 2007). Small-scale studies of this style have been conducted in maize (Jaenicke, 2003; Lia et al., 2007), but the future of sequencing whole genomes from well-preserved maize paleobotanic materials is very exciting.
The reason why particular genes have been under selection is a much more difficult question, but resolving it has important implications for future crop development. In the case of tb1 and tga1, we know much about why these loci were selection targets; but in the case of the chromosome 10 region the reasons are currently much less clear. Did selection target only 1 gene and 1 trait in this region or multiple genes and traits? We will not know until mapping identifies the causative nucleotides. Although, with these approaches, it can take years to find a single gene, the maize community is now assembling an unrivaled set of tools for forward trait dissection that will greatly accelerate the process. Altogether, ≈15,500 maize and teosinte genetic stocks have been constructed, which ultimately may permit the dissection of virtually any trait (www.panzea.org). With next-generation sequencing of key founders of this germplasm and community-wide efforts to phenotype a wide range of traits, the top-down approach will likely accelerate rapidly. We expect to make regular connections between top-down and bottom-up approaches.
Maize is at the crossroads of 2 great legacies. Native Americans and nature have worked to produce a species with tremendous natural variation and selective potential that has adapted to numerous environments. The Darwinian intellectual revolution, enabled by modern technology, allows us to understand how maize arrived at its current position and provides the tools to mold maize ever more efficiently for new societal needs with directed evolution. In fact, we are continuing to follow the steps of early Native Americans who transformed teosinte into maize millennia ago. Through allele mining in existing germplasm, beneficial alleles can be discovered and potentially applied to practical breeding. Wild relatives can also be tapped to recover superior alleles that have been lost during domestication and improvement processes. Guided by lessons from past domestication, we are practicing selection magic to pyramid useful genes to produce best varieties.
MATERIALS AND METHODS
Plant Materials and DNA Sequencing
We sampled DNA sequence diversity in a panel of 28 diverse maize inbreds and 16 teosinte (Z. mays ssp. parviglumis) inbreds. The panel was
selected to maximize the genetic diversity of maize (Liu et al., 2003; Flint-Garcia et al., 2005; Yu et al., 2008) and represents a wide geographical distribution of wild teosinte germplasm (www.panzea.org). A total of 28 maize inbred lines are 26 founders of Nested Association Mapping (NAM) (Yu et al., 2008) population and 2 other inbred lines, Mo17 and W22 R-r:std. Sixteen teosinte inbred lines (TIL01-TIL12 and TIL14-TIL17) were kindly provided by John Doebley (University of Wisconsin, Madison). A Tripsacum dactyloides sample (MIA34597) was used as an outgroup to estimate divergence. A total of 23 loci were surveyed to identify the physical boundary of the selective sweep region based on the maize FPC map (www.genome.arizona.edu/fpc/maize). Sequencing reactions were performed on PCR products in both directions with BigDye v3.1 on an Applied Biosystem 3730 automated sequencer. Base calling, quality checks, and sequence assembly were conducted with PHRED and PHRAP (Ewing et al., 1998). Multiple sequence alignments were made by using Biolign (http://en.bio-soft.net/dna/BioLign.html) and manually edited if necessary.
Data Analysis
The number of segregating sites (S), the nucleotide diversity θ (Watterson, 1975) and π (Tajima, 1983) at silent sites, the divergences in maize and in teosinte from Tripsacum, and Tajima’s D statistic (Tajima, 1989) were estimated by using DNAsp 4.10 (Rozas et al., 2003). Insertions and deletions were not included in the analysis. We used the multilocus Hudson-Kreitman-Aguade (HKA) test (Hudson et al., 1987) to test the ratios of DNA sequence polymorphisms to divergence across loci using the Tripsacum dactyloides sequence as an outgroup. We used Hudson’s ms program (Hudson, 2002) to do 10,000 coalescent simulations to estimate the probability of observing a given level of genetic diversity under a standard neutral model with the conservative assumption of no recombination (Hudson, 1990). The expected heterozygosity implemented in the simulation was θ = 0.0064 and 0.0112 in maize and teosinte, respectively, estimated from 774 reference genes (Wright et al., 2005). Coalescent simulations that incorporated the domestication bottleneck (Eyre-Walker et al., 1998; Tenaillon et al., 2004) were performed for each studied locus with the ms program. All parameters in the model were assigned to the established values (Wright et al., 2005). Based on a survey of 774 genes, the best fit of the severity of maize domestication bottleneck (k), the ratio of population size during bottleneck (Nb) to the duration of bottleneck (d), was 2.45 (Wright et al., 2005). The population mutation parameter θ (Watterson, 1975) and population recombination parameter 4Nc (Hudson, 1987) were estimated from the teosinte data. Using the neutral domestica-
tion bottleneck as the null distribution, we evaluated the probability of the observed loss of genetic diversity in maize relative to teosinte based on 10,000 coalescent simulations. The CLR test proposed by Kim and Stephan (2002) was used to test the hitchhiking effect and estimate the selection coefficient. We focused this analysis on the ZmETR2 region (loci 7–18) containing ≈7 kb of contiguous sequence. Ancestral and derived alleles at polymorphic sites were identified by comparing to the Tripsacum sequence. If the derived state of a segregating site could not be determined because of unavailable Tripsacum sequence, we assumed the base with the higher frequency to be ancestral. This assumption is conservative and has little effect in detecting selection (Kim and Stephan, 2002; DuMont and Aquadro, 2005). In those loci with a missing state for particular lines, we assumed the segregating sites at these missing sequences had the ancestral state, which is a conservative assumption as shown by the study of Orengo and Aguadé (2007). We did not provide a selection target estimation for 2 reasons: (i) a partially sequenced region will give a less reliable estimate of the selection target (Jensen et al., 2005; Pool et al., 2006); (ii) this selective sweep affected so many regions that estimating the selection target based on a single region is not meaningful. The basic analysis strategy of the CLR test is the same as that described by Wang et al. (2005) with minor modifications. Instead of estimating θ from local teosinte data as Wang et al. (2005) did for tga1, we used a more conservative estimate of θ = 0.0064, estimated from a genomewide value (Wright et al., 2005) as the expected nucleotide diversity in maize. The scaled per-nucleotide recombination parameter Rn = 0.0414 (Hudson, 1987) is the length-weighted mean of Rn across the ZmETR2 region (loci 7–18) estimated from teosinte data. The significance of the resulting likelihood ratio was evaluated by 1,000 simulations of neutral datasets. The GOF test (Jensen et al., 2005) was further used to distinguish between selective sweep and demographic forces. The significance of the GOF value for the observed data was evaluated by 1,000 simulations under the selection scenario produced by the above CLR test.
ACKNOWLEDGMENTS
We thank Carlyn Buckler, Peter Bradbury, Jason Peiffer, Pat Brown, Rob Elshire, Elhan Ersoz, Sean Myles, Michelle Denton, Joan Zhao, and Linda Rigamer Lirette for excellent comments and editorial assistance. This work was supported by the U.S. Department of Agriculture Agricultural Research Service and National Science Foundation Grants DBI-0321467 and DBI-0820619.


