
Causes and Consequences of Climate Change
Climate change poses significant risks for a wide range of human and natural systems.
This statement, based on the conclusions of the America’s Climate Choices (ACC) panel report Advancing the Science of Climate Change, stems from a substantial array of evidence and is consistent with the conclusions drawn in other recent scientific assessments, including reports by the U.S. Global Change Research Program (USGCRP) and the Intergovernmental Panel on Climate Change (IPCC). Although the scientific process is always open to new ideas and results, the fundamental causes and consequences of climate change have been established by many years of scientific research,1 are supported by many different lines of evidence, and have stood firm in the face of careful examination, repeated testing, and the rigorous evaluation of alternative theories and explanations. This chapter provides a brief overview of some basic facts about the risks posed by climate change (see Box 2.1); additional explanation and detail can be found in the reports noted above.
Earth is warming.2 The average temperature of the Earth’s surface increased by about 1.4°F (0.8°C) over the past 100 years, with about 1.0°F (0.6°C) of this warming occurring over just the past three decades (see Figure 2.1). Warming has also been observed specifically in the lower atmosphere3 and the upper oceans.4 Additional, indirect indications of warming include widespread reductions in glaciers and Arctic sea ice,5 rising sea levels,6 and changes in plant and animal species.7
The preponderance of the scientific evidence points to human activities—especially the release of CO2 and other heat-trapping greenhouse gases (GHGs) into the atmosphere—as the most likely cause for most of the global warming that has occurred over the last 50 years or so.8 This finding is supported by numerous lines of evidence, including:
BOX 2.1
Climate Change and Risk
As used here, the term risk applies to undesired events that may occur in the future but are not certain to occur. Analysts typically quantify risks along two dimensions—the probability that an event will occur, and the magnitude or consequence(s) of the event—and multiply the two to get a risk estimate (probability times consequence).a Consequences, however, have many dimensions. They vary in terms of which human values and concerns they affect (lives, livelihoods, community integrity, nonhuman species, etc.), where they are likely to occur, whom they may affect, and when they are likely to cause harm. Consequences also vary in terms of perception and significance to those who face the risks—for example, in the degree to which the consequence is understood or evokes dread (unknown risks can sometimes concern people more than other risks), and even in the trust in the organizations that manage such risks (mistrust in the managing organizations tends to increase perceived risk).b
The risks posed by climate change are thus complex. As this chapter discusses, climate change drives a variety of biophysical processes, which leads to a variety of potential consequences for many things that people value. Risks will change over time, and consequences will be highly variable across different locations and population groups. Scientific analyses can improve understanding of the risks associated with climate change, including how different human reactions might change those risks and at what cost. One way this is done, for instance, is through scenario analyses that illustrate a range of possible future conditions and that can be used to test out the performance of different response strategies. But regardless of how much supporting scientific information is available, making choices about how to act in the face of uncertainty can prove contentious if people disagree about the nature of the risks they face or about which elements of these risks are most important.
a C. Jaeger, O. Renn, E. A. Rosa, and T. Webler, Risk, Uncertainly and Rational Action (London: Earthscan, 2001).
b P. Slovic, B. Fischhoff, and S. Lichtenstein, “Facts and fears: Understanding perceived risk,” in Societal Risk Assessment: How Safe Is Safe Enough?(R. C. Schwing and W. A. Albers, Jr., eds. New York: Plenum, 1980); O. Renn, Risk Governance: Coping with Uncertainty in a Complex World (London: Earthscan, 2008).
- The concentration of CO2 in the atmosphere has increased markedly over the past 150 years (see Figure 2.2) and is now higher than at any time in at least 800,000 years.9
- The long-term rise in CO2 concentrations can be attributed primarily to the growth in human CO2 emissions from fossil fuel burning (Figure 2.2), with deforestation and other land use and land cover changes also contributing.10
- Concentrations of other GHGs, including methane, nitrous oxide, and certain halogenated gases, have also increased as a result of human activities.11
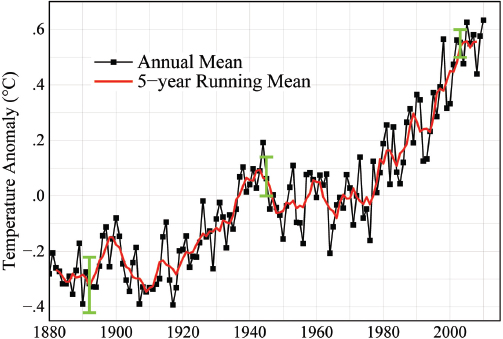
FIGURE 2.1 Global surface temperature change from 1880 to 2010, reported as a deviation from the 1951-1980 average. The black curve shows the globally and annually averaged near-surface temperature derived from a variety of instruments including thermometers, satellites, and various ocean sensors, all carefully calibrated and quality-controlled to remove errors. Green bars indicate the 95 percent confidence interval. The red curve shows a five year running average. The data show considerable year-to-year and decade-to-decade variability, but the long-term trend is clearly one of warming. SOURCE: NASA/ GISS (other research groups find similar results; see, for example, http://www.cru.uea.ac.uk/cru/data/ temperature/).
- Both basic physical principles and sophisticated models of the Earth’s climate system definitively show that when the GHG concentrations increase, warming will occur.
- Careful analyses of observations and model results indicate that natural factors such as internal climate variability or changes in incoming energy from the sun cannot explain the long-term global warming trend.12 Natural climate variability does, however, lead to substantial year-to-year and decade-to-decade fluctuations in temperature and other climate variables (as evident in Figure 2.1).
Global warming has been accompanied by a number of other global and regional environmental changes, which are broadly consistent with the changes expected in a warming world. However, establishing a direct, empirically-based causal link between
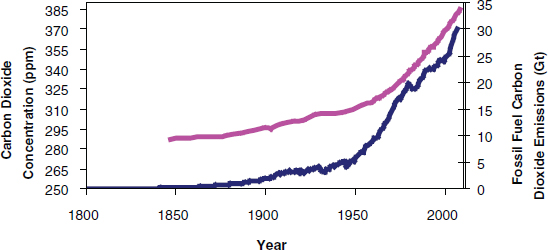
FIGURE 2.2 The concentration of CO2 in the atmosphere (magenta line and left axis, in parts per million), as measured in ice cores and canisters of air collected from multiple locations around the globe, has risen steady since the mid-19th century, with the sharpest rate of increase occurring over the past few decades. Much of this increase can be attributed to global CO2 emissions due to fossil fuel burning (blue line and right axis), which include estimated emissions from the production, distribution, and consumption of fossil fuels, plus a small contribution from cement production. Changes in land use and land cover—especially deforestation—also contribute to changes in atmospheric CO2 concentrations, with current emissions estimated at 4.4 million metric tons per year (or about 12 percent of total emissions from human sources). SOURCE: NRC, America’s Climate Choices: Advancing the Science of Climate Change ( Washington, D.C.: National Academies Press, 2010). See Figure 2.3 from that report for further references.
global warming and these other changes is difficult: often the regional changes remain within the range of past observed variability, the data are not extensive enough, or the models not sufficiently developed to clearly identify an anthropogenic signal. As a result, only a few changes have been directly linked to human activities using formal scientific attribution methods.13
Among the ongoing changes in the physical climate system14 that can be linked, at least in part, to increasing temperatures at the Earth’s surface are widespread melting of glaciers and ice sheets,15 rising global average sea levels,16 and decreases in Northern Hemisphere snow cover17 and Arctic sea ice.18 These changes have, in turn, been linked to a number of impacts on other physical and biological systems over the past several decades.19 For example, permafrost (permanently frozen ground) is thawing across many regions in the Northern Hemisphere,20 lakes and rivers are freezing later and melting earlier.21 Elevated CO2 levels in the atmosphere are also causing widespread acidification of the world’s oceans, which poses significant risks to ocean ecosystems.22
Changes in climate and related factors have been observed in the United States. These were recently assessed in Global Climate Change Impacts in the United States23 and discussed in two of the ACC panel reports (NRC, Advancing the Science and Adapting to the Impacts), and include the following:
- U.S. average air temperature increased by more than 2°F over the past 50 years, and total precipitation increased on average by about 5 percent;24
- Sea level has risen along most of the U.S. coast, and sea level rise is already eroding shorelines, drowning wetlands, and threatening the built environment;25
- Permafrost temperatures have increased throughout Alaska since the late 1970s, damaging roads, runways, water and sewer systems, and other infrastructure;26
- There have been widespread temperature-related reductions in snowpack in the northeastern and western United States over the last 50 years,leading to changes in the seasonal timing of river runoff;27
- Precipitation patterns have changed: heavy downpours have become more frequent and more intense;28 the frequency of drought has increased over the past 50 years in the southeastern and western United States, while the Midwest and Great Plains have seen a reduction in drought frequency;29 and
- The frequency of large wildfires and the length of the fire season have increased substantially in both the western United States and Alaska.30
Projections of future climate change impacts are developed in three steps:
(i) Emission Scenarios: Scientists first develop different scenarios of how GHG emissions and other human drivers of climate change (such as land use change) could plausibly evolve over the 21st century. Each scenario is based on specific assumptions about future social, economic, technological, and environmental change.31
(ii) Climate Simulation: Computer-based models of the climate system32 are then used to estimate how temperature, precipitation, storm patterns, and other aspects of climate would respond to each emission scenario. Typically, a number of different scenarios and models are used to explore a wide range of possible future climate changes.
(iii) Impact Assessment: Finally, researchers evaluate the potential impacts of climate change, including their likelihood and temporal evolution by combining climate
model results with knowledge about the vulnerability33 and adaptive capacity of various human and natural systems.
There are two major sources of uncertainty in future climate projections. One comes from the scenarios of emissions and other socioeconomic changes. Future emissions (and future vulnerability to climate change) will be determined by a complex set of developments taking place around the world—related to population, economic growth, energy, land use, technology and innovation, and other factors. It is not possible to predict how all such factors will change in the coming decades, but scenarios allow us to explore the implications of different pathways.
The second source of uncertainty is the response of the climate system to the increased concentration of GHGs, or “climate sensitivity.” Even if future emissions were known exactly—that is, if a given emission scenario held true exactly—the magnitude of future climate change and the severity of its impacts cannot be predicted with absolute certainty, due to incomplete knowledge of how the climate system will respond. What is known with a high degree of certainty however, is the direction of the climate system’s response to changes in GHG emissions: that is, reducing GHG emissions will lead to less warming and less severe impacts than if emissions are not reduced.
Significant changes are in store. The IPCC’s assessment of future climate change projects that Earth’s average surface temperature will increase (in the absence of new emissions mitigation policies) between 2.0 and 11.5°F (1.1 to 6.4°C) by the end of the 21st century, relative to the average global surface temperature during 1980-1999.34 As discussed above, this range reflects the potential trajectories of future GHG emission rates as well as uncertainties in our understanding of the climate system response. A subset of these results is shown in Figures 2.3 and 2.4.
One notable feature of future climate projections is that the impacts of the differences among GHG emission scenarios grows with time. For example, the lowest and highest emission scenarios in Figure 2.3 lead to similar temperature changes over the next few decades, but very large differences in temperature by the end of the century.35 This represents both a challenge and an opportunity—a challenge because emissions reductions that people make today will have little immediate effect on the climate; an opportunity because emissions reduction efforts made in the near term will affect climate outcomes many decades from now (see Box 2.2).
Two other notable features of the climate projections shown in Figures 2.3 and 2.4 relate to the temporal scales involved. First, the effects of GHG emissions can take
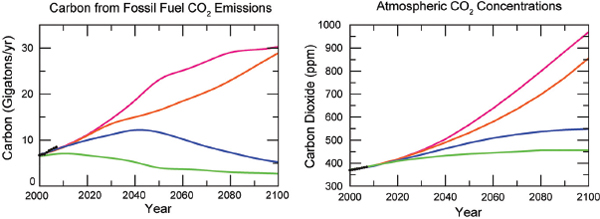
FIGURE 2.3 Observed (black curve) and projected (colored curves) changes in global CO2 emissions (left, in gigatons of carbon) and atmospheric CO2 concentrations (right) for four illustrative scenarios of future emissions. SOURCE: USGCRP, Global Climate Change Impacts in the United States, eds. T. R. Karl, J. M. Melillo, and T. C. Peterson (Cambridge, UK: Cambridge University Press, 2009) and model projections from CMIP3-A (G. A. Meehl et al., “The WCRP CMIP3 multimodel dataset: A new era in climate change research” [Bulletin of the American Meteorological Society, 88, 1383-1394, 2007]). The three scenarios illustrated here are based on IPCC/SRES (N. Nakicenovic et al., Special Report on Emissions Scenarios, International Panel on Climate Change [Cambridge, UK: Cambridge University Press, 2000]) scenarios: B1 (blue line, “lower emissions”), A2 (orange line, “higher emissions”), A1F1 (pink line, “even higher emissions”), and plus constant 20th century forcing (green line).
decades to fully manifest themselves. For example, in the “blue” scenario, emissions peak in 2040 but temperatures continue to increase through the end of the century. Second, climate changes caused by CO2 persist for very long time scales. Figure 2.4 shows that the temperature perturbations produced by emissions in the 20th and early 21st century continue to warm the climate in 2100. In fact, the warming extends well beyond 2100—for CO2, the time scale for such perturbations is millennial (e.g., some of the CO2 we emit today is expected to remain in the atmosphere in the year 3000).36
Future climate change poses numerous known and unknown risks. The impacts of climate change—on coasts, water resources, agriculture, ecosystems, transportation systems, and other human and natural systems—can generally be expected to intensify with warming.37 Some of these impacts are well understood and can be quantified with reasonable scientific confidence, while others are much less understood and can only be qualitatively described. A few examples of impacts that have been projected to occur across a range of future warming scenarios include:
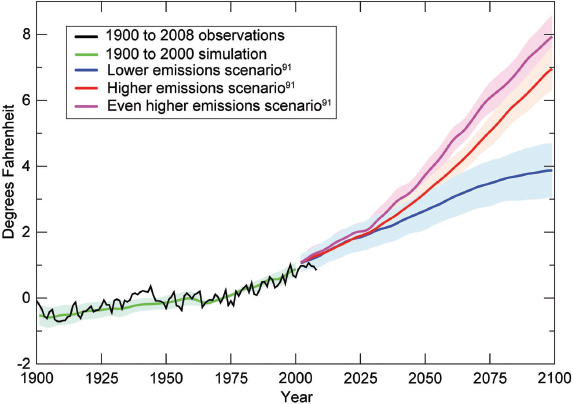
FIGURE 2.4 Observed (black curve) and projected (colored curves) changes in global average surface temperature for three of the illustrative scenarios of future emissions in Figure 2.3 (plus, in green, modeled 20th century climate). The shading around each curve indicates the range of central values produced by 15 different models using the same emission scenario (exact models used are listed in footnote #93 in USGCRP, Global Climate Change Impacts in the United States, eds. T. R. Karl, J. M. Melillo, and T. C. Peterson [Cambridge, UK: Cambridge University Press, 2009]). Other emissions scenarios and models show a substantially broader range of possible future temperature trajectories (see IPCC Climate Change 2007: The Physical Science Basis. Contribution of Working Group I to the Fourth Assessment Report of the Intergovernmental Panel on Climate Change, eds. S. Solomon, D. Qin, M. Manning, Z. Chen, M. Marquis, K. B. Averyt, M.Tignor, and H. L. Miller (Cambridge, UK: Cambridge University Press, 2007). SOURCE: USGCRP, Global Climate Change Impacts, based on observational data from Smith et al., “Improvements to NOAA’s historical merged land–ocean surface temperature analysis (1880–2006)” (Journal of Climate, 21[10]: 2283-2296, 2008) and model projections from CMIP3-A (G. A. Meehl et al., “The WCRP CMIP3 multimodel dataset: A new era in climate change research” [Bulletin of the American Meteorological Society, 88: 1383–1394, 2007]), using the same IPCC emission scenarios as in Figure 2.3.
- more intense, more frequent, and longer-lasting heat waves, both globally38 and in the United States (see Figure 2.5);
- global sea level rise39 with potentially large effects on infrastructure, beach erosion, loss of wetlands, vulnerability to storm surge flooding in the Gulf Coast and other coastal regions,40 and irreversible commitments to future
changes in the geography of the Earth as many coastal and island features ultimately become submerged;41
- widespread bleaching and stresses on coral reefs, globally42 and in the Florida Keys, Hawaii, and U.S. island possessions,43 due to the combined effects of heat stress, ocean acidification,44 pollution, and overfishing;
- greater drying of the arid Southwest (putting additional pressure on water resources) and expansion of deserts in the United States;45
- effects on agriculture due to elevated CO2 levels, temperature and precipitation changes, and also by possible increases in weeds, diseases, and insect pests;46
- shifts in the ranges of forest tree-species (northward and upslope), increases in forest fire risk across much of the western United States,47 and a potential increase in the number of species at risk of extinction;48 and
- increased potential of public health risks, for instance, from heat stress; from elevated ozone air pollution; from certain diseases transmitted by food, water, and insects; and from direct injury and death due to extreme weather events.49
Climate change will affect specific regions and segments of society differently because of varying exposures and adaptive capacities. For instance, public health threats and outcomes are affected not only by climate factors, but also by factors such as wealth and lifestyle, status of public health systems, and access to medical care and information. As another example, coastal cities that have instituted measures to protect critical infrastructure (for utilities, transportation, etc.) may be less vulnerable to the impacts of sea level rise and storm surges.
The physical and social impacts of climate change are expected to have substantial economic implications throughout the United States, but these effects will be unevenly distributed across regions, populations, and sectors.50 Quantitatively estimating economic impacts is controversial, due to the uncertainties in climate change impact projections themselves, and to the lack of sound methodologies for assigning economic value to many key impacts, especially nonmarket costs such as loss of ecosystem services and spillover costs occurring as a result of climate change impacts elsewhere in the world.
In addition to the potential impacts that we are able to identify today, there is a real possibility of impacts that have not been anticipated. This possibility, coupled with our limited ability to predict the timing and location of some climate-related impacts, and our incomplete understanding of the vulnerabilities of different populations and sectors will make adaptation to climate change especially challenging.
BOX 2.2
Emissions Headroom
Although the question of what constitutes a “safe” level of climate change remains a matter of active debate, the United States and much of the international community have expressed support for the goal of limiting global temperature rise relative to the pre-industrial times to no more than 2°C (3.6°F). This target is often stated to be equivalent to limiting global atmospheric CO2 concentrations to no more than 450 ppm. Because of uncertainties in climate sensitivity, however, this is not a precise relationship. The best estimate from climate models is that there is a 50 percent probability of limiting global temperature increase to 2°C or less if CO2 concentrations are not allowed to rise above 450 ppm.a
Another, and perhaps more useful, way to view the problem is in terms of total cumulative CO2 emissions (i.e., the sum of all emissions over time). How much greenhouse gas can be emitted and still keep the global temperature rise below 2°C? A rough estimate can be obtained using the near-linear relationship that exists between the cumulative carbon emissions from human activities since the Industrial Revolution and the long-term rise in the Earth’s average surface temperature.b Based on this relationship, it is estimated that keeping global temperature rise within 2°C requires limiting cumulative emissions to approximately 4000 billion tons of CO2. There is considerable uncertainty in this result however, with the cumulative emissions likely ranging from about 2900 to 5800 billion tons. Cumulative human-related emissions since the Industrial Revolution total about 1800 billion tons of CO2. This leaves an “emissions headroom” (i.e., the remaining amount that can be emitted) of somewhere between 1,100 to 4,000 billion tons of CO2, with a central estimated headroom of roughly 2,200 billion tons.
The world currently emits ~30 billion tons of CO2 per year from fossil fuels, with one-fifth of this amount emitted by the United States. If global emissions continued at that rate, the central estimated headroom would be used up (as a rough approximation) somewhere in the range of 40 to 130 years, with a most probable value of roughly 70 years—after which point emissions would have to drop to zero. Thus the degree of headroom is uncertain—there could be very little left, or there could be a significant amount, depending mainly on uncertainties in the climate sensitivity.
These estimates are undoubtedly too optimistic however, because without policy intervention,
CHAPTER CONCLUSION
Although the exact details cannot be predicted with certainty, there is a clear scientific understanding that climate change poses serious risks to human society and many of the physical and ecological systems upon which society depends—with the specific impacts of concern, and the relative likelihood of those impacts, varying significantly from place to place and over time. It is likewise clear that actions to reduce GHG emissions and to increase adaptive capacity will lower the likelihood and the consequences of these risks.
global emissions will not continue at current rates, but rather, will continue to rise. For instance, NRC, Climate Stabilization Targets projects that total global emissions between 2009 and 2050 will exceed 1,000 billion tons of CO2 under a scenario with no new policy interventions. If the headroom is at the lower end of the range listed above, it would all be used up by 2050 (and, of course, emissions are highly unlikely to drop to zero after that point). In addition, the available headroom shrinks if the goal for limiting global average temperature rise is more stringent than the 2°C target. These uncertainties illustrate how America’s climate choices fundamentally involve judgments and perceptions about acceptable risk.
Commitments to emissions in the form of the infrastructure investments will be key in determining how quickly we use up the emissions headroom. The world has already locked in a large amount of future emissions through both old and recent investments in capital stock (e.g., cars and trucks, home furnaces and boilers, building shells, chemical plants and factories, power plants) and fixed infrastructure investments. One study estimates that if the world were to build no further energy-using stock, while letting every existing fossil fuel-using device reach the end of its useful life without modification, somewhere in the range of 280-700 billion tons of CO2 would be emitted.c How much is emitted above that amount depends critically upon the types of energy infrastructure the world invests in during the coming decades. If much of the new capital stock is powered by fossil fuels, then the emissions headroom will be rapidly depleted. If, on the other hand, concerns over climate change lead to concerted actions to slow the addition of new fossil-fuel-using capital stock, or if existing stock were retired early or retrofit (e.g., retrofits of coal plants to capture and store CO2), the headroom will last longer.
_________________
a IPCC, Climate Change 2007: The Physical Science Basis. Contribution of Working Group I to the Fourth Assessment Report of the Intergovernmental Panel on Climate Change, eds. S. Solomon, D. Qin, M. Manning, Z. Chen, M. Marquis, K. B. Averyt, M.Tignor, and H. L. Miller (Cambridge, UK: Cambridge University Press, 2007)
b NRC, Climate Stabilization Targets: Emissions, Concentrations, and Impacts over Decades to Millennia(Washington, D.C.: National Academies Press, 2010); and H. D. Matthews, N. P. Gillett, P. A. Scott, and K. Zickfeld, “The proportionality of global warming to cumulate carbon emissions” (Nature 459[7248]:829-U823, 2009). Note that in Stabilization Targets, numbers are given in tons of carbon, whereas here they are converted to tons of CO2.
c S. J. Davis, K. Calderia, and D. Matthews, “Future CO2 emissions and climate change from existing energy infrastructure” (Science10 329[5997]:1330-1333, 2010, doi: 10.1126/science.1188566).
Waiting for unacceptable impacts to occur before taking action is imprudent because many of the impacts of GHGs emitted today will not fully manifest themselves for decades; and once they do appear, they can be with us for hundreds or even thousands of years. The amount of warming is expected to increase with the cumulative amount of GHGs emitted, and thus the chances of encountering dangerous climate impacts grows with every extra ton we emit. At the same time, national and world demand for energy is on the rise, and new investments in energy infrastructure are inevitable. If those investments are in CO2-emitting infrastructure, we will have committed ourselves to growing GHG emissions for decades to come.
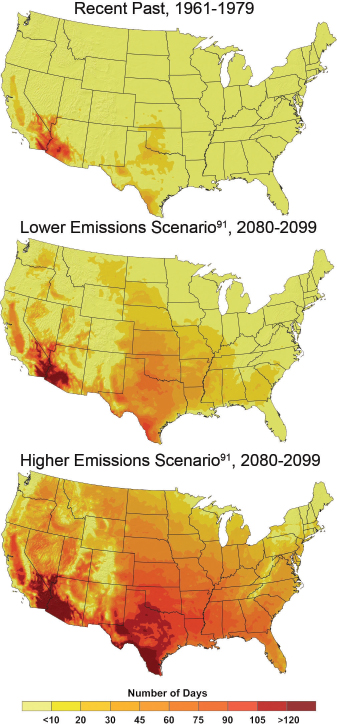
FIGURE 2.5 The number of days per year in which temperatures are projected to exceed 100°F by late this century compared to the 1960s and 1970s under two different scenarios of future GHG emissions (IPCC SRES scenarios B1 and AIF1, illustrated in Figure 2.3). SOURCE: USGCRP Global Climate Change Impacts, p. 90.
Thus in the judgment of the committee, the environmental, economic, and humanitarian risks of climate change indicate a pressing need for substantial actions to limit the magnitude of climate change and to prepare for adapting to its impacts. Undertaking such actions will require making choices in the face of incomplete and imperfect information about the future.


