
CHAPTER SEVEN
Sea Level Rise and the Coastal Environment
The coastlines of the United States and the world are major centers of economic, social, and cultural development, and coastal areas are home to critical ecological and environmental resources. Climate change poses a number of risks to coastal environments. Foremost among these is sea level rise, which threatens people, ecosystems, and infrastructure directly and also magnifies the impacts of coastal storms. Coastal environments face a variety of other stresses, such as pollution, development pressures, and resource harvesting, that can interact with climate-related changes and potentially increase the vulnerability of coastal areas.
Coastal managers, businesses, governments, and inhabitants are all concerned about current and future risks to coastal areas. In order to develop adequate responses to the risks posed by climate change and sea level rise, they require answers to questions such as the following:
-
How much will sea level rise in the future and on what time scales?
-
How will sea level rise and changing storm patterns translate into local problems such as erosion, flooding, damage to infrastructure, and loss of ecosystems?
-
What coastal protection measures are physically and economically feasible and socially and environmentally acceptable in different locations, and how much time do we have to start implementing these measures?
-
At what point is it more cost effective to retreat from the shoreline than to defend coastal land uses in place?
-
How uncertain is the information about sea level rise and other coastal (physical, ecological, and socioeconomic) processes, and what are the implications of these uncertainties for decision making?
This chapter summarizes the information that is currently available regarding the history, causes, projections, and consequences of sea level rise and other climate-related changes that affect or may affect coastal environments. It includes updated projections of sea level rise and the impacts of sea level rise and other climate changes on coastal systems, and also discusses scientific knowledge to support responding to sea level rise. The final section of the chapter describes some of the additional scientific
information that will be needed to better understand and develop more effective responses to sea level rise and other coastal management challenges.
OBSERVED SEA LEVEL CHANGES
Sea level has varied dramatically over Earth’s history. For the past two to three million years, the ice age cycles—which are driven by periodic variations in Earth’s orbit (see Chapter 6)—have led to regular fluctuations in sea level of several hundred feet. During an ice age, significant amounts of water are stored in continent-sized glaciers called ice sheets that are up to several miles thick. Much of this ice melts during warm interglacial periods, and the resulting water raises global sea level substantially when it enters the oceans. During the most recent ice age, which peaked about 26,000 years ago, global average sea level was approximately 400 feet (120 meters) lower than it is today.
By carefully analyzing the depths and dates of coral reefs, geologists have reconstructed the temporal history of sea level rise during the recovery from the last ice age (Fairbanks, 1989; Peltier and Fairbanks, 2006). This rise was not steady, but rather punctuated by periods of rapid rise of as much as 2 inches (5 centimeters) per year; it is inferred that these periods of rapid rise were driven by pulses of water from melting ice (Figure 7.1). By approximately 6,000 years ago—or around the time that agriculture expanded and larger-scale civilizations were first established—global average sea level had risen to close to its present-day value, and it subsequently remained relatively steady. Other direct and indirect observations have allowed oceanographers to estimate past sea levels going back a few thousand years. These historical records suggest that there was little net change in sea level from the first century A.D. to 1800 (Church et al., 2008; Sivan et al., 2004).
Intrumental Records of Sea Level Rise
Instrumental records for sea level date back about 140 years, when systematic measurements by tide gauges became available (NRC, 1990b). During the past few decades, tide gauge records have been augmented by satellite measurements that give precise sea level maps across the entire globe. Together, these modern records indicate that sea level has been rising since the mid-19th century, and that the rate of increase has been accelerating in recent years (Figure 7.2). For example, in the late 19th century, when tide gauge readings begin to provide accurate global sea level estimates, the rate of sea level rise was about 0.02 inches (0.6 millimeters) per year
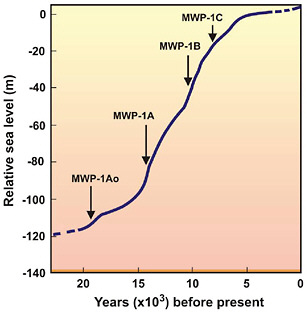
FIGURE 7.1 Illustration of relative sea level rise since the last ice age: 26,000 years ago, sea level is estimated to have been about 400 feet (120 meters) lower than it is today. This curve was assembled using analyses of coral reefs all over the world. The abbreviation MWP refers to various meltwater pulses, which caused sea level to rise relatively rapidly. MWP-1AO, ~19,000 years ago; MWP-1A, ~14,600 to 13,500 years ago; MWP-1B, ~11,500 to 11,000 years ago; MWP-1C, ~8,200 to 7,600 years ago. SOURCE: Gornitz (2009).
(Church and White, 2006); in the last half of the 20th century, this increased to approximately 0.07 inches (1.8 millimeters) per year (Miller and Douglas, 2004); and over the past 15 years, the rate of sea level rise has been in excess of 0.12 inches (3 millimeters) per year (Katsman et al., 2008; Vermeer and Rahmstorf, 2009). Ice core records show that atmospheric CO2 concentrations have been rising since about 1830 (see Chapater 6), so sea level and CO2 increases are generally coincident. Clear indications of interannual and decadal variability can also be seen in Figure 7.2. Distinguishing the effects of natural climate variability from human-caused warming is one of the challenges of understanding the details of past sea level rise and anticipating its future course.
![FIGURE 7.2 Annual, global mean sea level as determined by records of tide gauges (red curve with error bars, from Church and White [2006]; blue curve, from Holgate and Woodworth [2004]) and satellite altimetry (black curve, from Leuliette et al. [2004]). For the last half of the 20th century, the rate of sea level rise can be estimated as being about 0.07 in/yr (1.8 mm/yr), with the most recent decade exhibiting a rate of sea level rise over 0.12 in/yr (3 mm/yr). The red and blue curves show deviations in sea level relative to the 1961 to 1990 period; the black curve shows deviations from the average of the red curve relative to the 1993 to 2001 period. SOURCE: Bindoff et al. (2007).](/openbook/12782/xhtml/images/p2001c3c5g238001.jpg)
FIGURE 7.2 Annual, global mean sea level as determined by records of tide gauges (red curve with error bars, from Church and White [2006]; blue curve, from Holgate and Woodworth [2004]) and satellite altimetry (black curve, from Leuliette et al. [2004]). For the last half of the 20th century, the rate of sea level rise can be estimated as being about 0.07 in/yr (1.8 mm/yr), with the most recent decade exhibiting a rate of sea level rise over 0.12 in/yr (3 mm/yr). The red and blue curves show deviations in sea level relative to the 1961 to 1990 period; the black curve shows deviations from the average of the red curve relative to the 1993 to 2001 period. SOURCE: Bindoff et al. (2007).
CAUSES OF SEA LEVEL RISE
Past, present, and future changes in global sea level are mainly caused by two fundamental processes: (1) the thermal expansion of existing water in the world’s ocean basins as it absorbs heat and (2) the addition of water from land-based sources—mainly ice sheets and glaciers, but also other smaller sources. Geological processes (subsidence and uplift), ocean circulation changes, and other processes are important for determining local and regional rates of sea level rise, but the total volume of the world’s oceans—and hence global average sea level—is essentially controlled by thermal expansion and addition of water from land-based sources.
Ocean Thermal Expansion
The ocean is by far the most important heat reservoir in the climate system, with a heat storage capacity more than 1,000 times larger than that of the atmosphere. In
fact, measurements of changes in ocean heat content show that 80 to 90 percent of the heating associated with human greenhouse gas (GHG) emissions over the past 50 years has gone into raising the temperature of the oceans (Levitus et al., 2001; Trenberth and Fasullo, 2010) (see Figure 7.3). One consequence of the large thermal capacity of the oceans is that it takes many years for the climate system to warm in response to GHG emissions; for example, as discussed in Chapter 6, global surface temperatures would continue to warm for many decades even if GHG concentrations and other climate forcings were stabilized at present values). Moreover, as heat is absorbed by the oceans, the volume of the water expands, causing sea levels to rise. Approximately 50 percent of the observed sea level rise since the late 19th century has been attributed to thermal expansion of the warming oceans (Gornitz et al., 1982).
Ocean expansion is neither spatially uniform nor steady in time (Levitus et al., 2009; Lozier et al., 2008). Over the last half century, ocean thermal expansion has varied from approximately one quarter of the total sea level contribution (1961-1993) to a
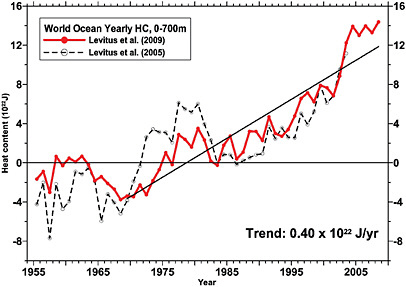
FIGURE 7.3 Increase in globally averaged ocean heat content (HC) for the topmost 700 m of the ocean. The dashed black line represents estimates from Levitus et al. (2005); the red line shows estimates from Levitus et al. (2009). For both lines, the values are calculated with respect to the 1957 to 1990 periods. The solid black line shows the positive trend in ocean heat content from 1969 to 2008. Units are 1022 Joules. SOURCE: Levitus et al. (2009).
little over one half (1993-2003; Bindoff et al., 2007). The absorption of heat energy by the oceans varies from place to place on interannual and decadal time scales, and the warmer waters of the tropics and near the ocean surface expand more in response to a given temperature increase than the cold waters at high latitude and at depth (Fofonoff, 1985). Monitoring spatial and temporal heat content changes of the ocean is thus important for predicting both the global average and spatial patterns of future sea level rise, as is developing a better understanding of mixing processes that distribute heat in the oceans.
Ice Sheets
Land ice contained in the world’s glaciers and ice sheets contributes directly to sea level rise through melt or the flow of ice into the sea (Figure 7.4). In contrast, when sea ice, which is already floating on the ocean surface, melts, it contributes only a negligible amount to sea level rise (Jenkins and Holland, 2007; Noerdlinger and Brower,
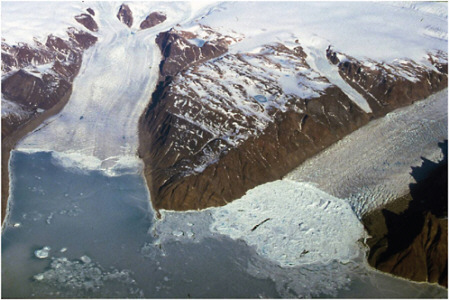
FIGURE 7.4 Outlet glaciers in Northwest Greenland. SOURCE: Photo by K. Steffen.
2007). If all of the water currently stored as ice on land surfaces around the world were to melt, sea levels would rise up to 230 feet (70 meters; Bamber et al., 2001; Lythe and Vaughan, 2001). It is important to note, however, that the estimated time scale for complete melting of the major ice sheets is on the order of hundreds to thousands of years (Gregory et al., 2004; Lambeck and Chappell, 2001; Meehl et al., 2007a).
The major ice sheets of Greenland and Antarctica contain the equivalent of 23 and 197 feet (7 and 60 meters) of sea level rise, respectively. Recent observations of these ice sheets have revealed that not only are they shrinking (e.g., Lemke et al., 2007), but their rate of loss may have increased over the last decade (Lemke, et al., 2007; Rignot et al., 2004, 2008; Thomas et al., 2006; Velicogna, 2009). In Greenland, ice sheet melt has increased 30 percent over the past 30 years (Mote, 2007). In both Greenland and Antarctica, many outlet glaciers are accelerating their seaward flow, hastening the delivery of ice to the surrounding seas (Howat et al., 2007; Rignot and Kanagaratnam, 2006; Rignot et al., 2008). In many cases, when an outlet glacier reaches the sea, a large floating portion extends into the surrounding water, forming long, thin ice tongues or larger, thicker ice shelves that buttress the outlet glacier and restrain some of its discharge. Many of these ice shelves and ice tongues have retreated, thinned, and weakened—and in some cases, collapsed suddenly as seen in Figure 7.5—which has allowed the glaciers that discharge into the surrounding bodies of water to flow much more rapidly (Rignot and Kanagaratnam, 2006; Rignot et al., 2004, 2008; Scambos et al., 2004).
The implications of the loss of floating ice are particularly significant in West Antarctica, where ice shelves are enormous and much of the ice rests on a soft, deformable bed of rock that lies below sea level. The disappearance of Antarctic ice shelves and the retreat of the ice sheet at the continent’s margins would allow the surrounding sea water to flow into the ice-bedrock interface, eroding the ice further from underneath and enhancing its discharge. The time scales of these processes are not well known, but, with the equivalent of 11 feet (3.3 meters) of sea level stored in the West Antarctic Ice Sheet (Bamber et al., 2009), this potential instability is of great importance to future sea level rise.
Two mechanisms contribute to the accelerating ice sheet loss to the ocean: (1) increased surface melt (in Greenland) and the associated lubrication of the ice-bedrock interface by surface meltwater during summer, and (2) increased calving processes and thinning at the glacial termini induced by a warming ocean, which in turn leads to faster ice flow and thinning upstream. For the Greenland ice sheet, increased surface melting is associated with earlier onset and longer length of the melt season (Mote, 2007). In addition to the increase in melt runoff, meltwater from the ice sheet surface
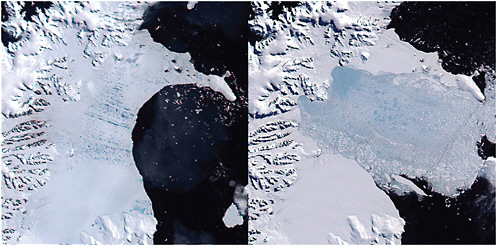
FIGURE 7.5 Larsen-B Ice Shelf (left) January 31, 2002, and (right) March 17, 2002. The 2,018-mile (3,250-km) section of ice shelf, estimated to be over 10,000 years old and 650 feet (200 meters) thick, disintegrated in 6 weeks. White areas correspond to the ice shelf and glaciers on the Antarctic Peninsula, and dark blue/black indicates ocean. The light blue streaks (left panel) correspond to melt ponds on the ice; the larger areas of light blue (right panel) indicate where the ice shelf has collapsed and formed icebergs. Some of the glaciers that fed the ice shelf accelerated by eightfold within months of the collapse. SOURCE: MODIS imagery courtesy of NASA and the National Snow and Ice Data Center.
can penetrate through crevasses or tunnels in the ice (moulins) to the bed, where it can lubricate the ice-bedrock interface, causing a summertime acceleration of glacier flow (Joughin et al., 2008; Zwally et al., 2002). This summer acceleration hastens the flow of ice toward the edges of the ice sheet, where it can melt or calve more rapidly. Recent paleoclimate reconstructions and modeling studies indicate that human GHG emissions have elevated Arctic air temperatures in recent decades by 2.5°F (1.4°C) above those expected from natural climate cycles (Kaufman et al., 2009), meaning that continued surface melting and melting of outlet glacier floating ice tongues can be expected.
Recent analysis of ICESat altimetry data (Pritchard et al., 2009) reveal that ice sheet thinning is mainly confined to the margins for both the Greenland and Antarctic ice sheets. This observation can be ascribed to ocean-driven melting, a mechanism supported by the recent discovery of a warming ocean around Greenland that appears to be contributing to year-round calving into the ocean (Hanna et al., 2009; Holland et al., 2008; Rignot et al., 2010; Straneo et al., 2010). An analysis of time-dependent changes in ice flow rates (Joughin et al., 2008) also suggests that ice-ocean interactions tend
to dominate coastal ice losses. Numerical modeling (Nick et al., 2009) further supports this conclusion and suggests that tidewater outlet glaciers adjust rapidly to changing boundary conditions at the calving terminus. Expanded monitoring of both air and sea temperatures at high latitudes and an improved understanding of ice sheet dynamics will be needed to improve scientific knowledge of these processes.
Mountain Glaciers, Ice Caps, and Other Contributors to Sea Level Rise
The world’s glaciers and ice caps contain the water equivalent of up to 2.4 feet (0.72 meters) of sea level (Dyurgerov and Meier, 2005). They have consistently been contributing about one quarter of the total sea level rise over the past 50 years, staying roughly proportional to the overall rate of sea level rise (Bindoff et al., 2007). Mountain glaciers are expected to continue to be a significant contributor to sea level rise during this century, and their retreat poses significant risks to populations that depend on glacial runoff as a water source (see Chapter 8). However, unlike the Greenland and Antarctic ice sheets, mountain glaciers are relatively small and do not carry the potential for large and sudden contributions to sea level rise.
There are additional contributions to sea level rise from other human activities such as wetland loss, deforestation, and the extraction of groundwater for irrigation and industrial use. While estimates of the size of these sources are somewhat uncertain, they are believed to be small relative to land ice melting and may be partially offset by the increased storage of water behind dams and in other surface reservoirs over the past century and a half (e.g., Chao et al., 2008). Moreover, the observed recent sea level rise rate of over 0.12 inches (3.3 ± 0.4 millimeters) per year (Cazenave et al., 2010) is consistent with what would be expected from the combination of thermal expansion of the oceans and melting of ice on land (Bindoff et al., 2007). Hence, the overall contribution of other land-based sources to global sea level rise is thought to be small. Nonetheless, small glaciers and ice caps remain important contributors to sea level rise, and their respective contributions need to be better understood.
PROJECTIONS OF FUTURE SEA LEVEL RISE
The Intergovernmental Panel on Climate Change (IPCC) estimated that sea level would rise by an additional 0.6 to 1.9 feet (0.18 to 0.59 meters) by 2100 (Meehl et al., 2007a). However, this projection was based only on current rates of change and was accompanied by a major caveat regarding the potential for substantial increases in the rate of sea level rise. The 2007 IPCC projections are conservative and may underestimate
future sea level rise because they do not include one of the two major processes contributing to sea level rise discussed in this chapter: significant changes in ice sheet dynamics (Rahmstorf, 2010). While the growth of ice sheets—mainly through snow accumulation—is an inherently slow process, the processes that govern ice sheet losses, in particular discharge rates, can be strongly nonlinear, with the potential for sudden changes (Overpeck et al., 2006), as illustrated in Figure 7.5. Thus, there is a real potential for ice sheets to shrink rapidly, causing a rapid rise in sea levels. Unfortunately, we do not yet have a good understanding of the processes that control the flow rates; consequently, the potential for rapid ice sheet losses is not well understood at this time. This uncertainty prevented the IPCC from providing a quantitative estimate of how much ice sheet losses might contribute to sea level rise in the coming century.
Research on current and potential future rates of sea level rise has advanced considerably since the IPCC Fourth Assessment Report, which was based on data published in 2005 or earlier. Some research conducted during the past several years suggests that sea level rise during the 21st century could be several times the IPCC estimates, as shown in Figure 7.6. Empirical techniques (e.g., Grinsted et al., 2009; Rahmstorf, 2007; Vermeer and Rahmstorf, 2009) that relate sea level to historical average temperatures
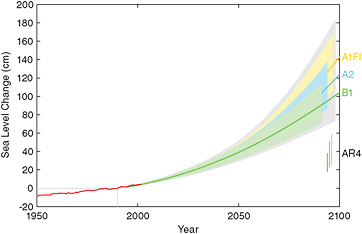
FIGURE 7.6 Projection of sea level rise from 1990 to 2100, based on IPCC temperature projections for three different GHG emissions scenarios (pastel areas, labeled on right). The gray area represents additional uncertainty in the projections due to uncertainty in the fit between temperature rise and sea level rise. All of these projections are considerably larger than the sea level rise estimates for 2100 provided in IPCC AR4 (pastel vertical bars), which did not account for potential changes in ice sheet dynamics and are considered conservative. Also shown are the observations of annual global sea level rise over the past half century (red line), relative to 1990. SOURCE: Vermeer and Rahmstorf (2009).
suggest that a sea level rise of up to nearly 5 feet (1.4 meters) is possible by 2100. By incorporating this empirical effect into models, Horton et al. (2008) estimates a sea level rise of 2 to 2.6 feet (0.62 to 0.88 meters) by 2100. In other work, Rohling et al. (2008) find that a rise rate of up to 5 feet (1.6 meters) per century is possible, based on paleoclimatic evidence from past interglacial periods (including the most recent interglacial period, 110,000 years ago, when global temperatures were 3.6°F [2°C] higher than today and sea levels were 13 to 20 feet [4 to 6 meters] higher). Kopp et al. (2009) estimate that sea level peaked at 22 to 31 feet (6.6 to 9.4 meters) higher than today during the last interglacial period and had a 1,000-year average rise rate between 1.8 and 3 feet (0.56 to 0.92 meters) per century. Pfeffer et al. (2008) used geophysical constraints of ice loss to suggest that a 2.5-foot (0.8-meter) sea level rise is more likely, with a 6.5-foot (2-meter) rise the maximum to be expected by 2100. Others (Siddall et al., 2009) suggest that a 2.5-foot (0.8-meter) rise is the most we could experience by 2100, based on a model that is fit to data only since the last glacial maximum.
The differences among these estimates highlight the uncertainties involved in sea level rise projections; however, there is widespread consensus that substantial long-term sea level rise will continue for centuries to come (Overpeck and Weiss, 2009). A considerable amount of sea level rise is to be expected simply from past CO2 emissions as the ocean heat content catches up with radiative forcing (see Chapter 6); furthermore, the risk of ice sheet collapse, and the attendant large rates of sea level rise, will increase if GHG concentrations in the atmosphere continue to increase. The task of determining how much sea level rise to expect, when to expect it, and its regional character is a critical scientific challenge given the large numbers of people, assets, and economic activity at risk, and the substantially different planning and management challenges managers would face if they had to prepare for and adapt to a sea level rise of 2, 4, or 8 feet over the course of one century. While the risks cannot be quantified at present, the consequences of extreme and rapid sea level rise could be economically and socially devastating for highly built-up and densely populated coastal areas around the world, especially low-lying deltas and estuaries (Anthoff et al., 2010; Lonsdale et al., 2008; Nicholls et al., 2007; Olsthoorn et al., 2008; Poumadère et al., 2008; see further discussion below).
Regional Variability in Sea Level Rise
As noted above, sea level rise will not be uniform across the globe. Regional variations in the rate of sea level rise occur for a number of reasons. Some coasts are still adjusting to the disappearance of glaciers—the weight of glacial ice pushed them down, and they are still rising in response to the loss of ice. In other regions, coasts may be
subsiding because of distant glacial rebound or subsurface fluid withdrawal due to water, oil, or gas extraction. Regional variation in sea level rise rates can also stem from changes in the Earth’s rate of spin as water is redistributed from the poles as high-latitude ice melts. Several studies indicate that sea level rise will be particularly problematic for both coasts of the United States as a result of the altered global mass distribution; they may experience 20 percent greater sea level rise than the global average (Bamber et al., 2009; Mitrovica et al., 2001). Differing spatial patterns in sea level trends have already been observed with satellite altimetry (Wunsch et al., 2007).
Changes in the intensity of ocean currents could also produce regional variations in sea level rise. For example, Yin et al. (2009) suggest that a warming-induced slowdown of the Atlantic meridional overturning circulation would contribute to a 6- to 8-inch (15- to 20-centimeter) additional rise in sea level for New York and Boston. However, such changes in the ocean circulation are highly uncertain, since they depend on poorly known parameterizations of vertical mixing in ocean models. Other studies suggest that an intensification, rather than a slowdown, of the overturning circulation with global warming is possible (Huang, 1999; Nilsson et al., 2003), in which case sea levels would fall on the U.S. east coast. A critical factor needed to resolve these disparate projections is a better understanding of vertical mixing processes in the ocean, which are sensitive to changing stratification and govern the absorption of heat by the ocean at all latitudes.
Role of Ice Sheets in Producing Potential Climate Surprises
The same factors that can contribute to accelerated sea level rise over relatively short periods of time could also potentially lead to other abrupt climate changes or “climate surprises” (see Chapter 6). For example, if the Greenland ice sheet were to shrink substantially in a short period of time, freshwater delivery to key deep-water formation regions of the North Atlantic could alter the ocean structure and influence its circulation. Normally, the surface waters of the North Atlantic release large amounts of heat to the atmosphere, thereby becoming sufficiently dense to sink and return southward, making room to be replaced with more warm water from the south. This meridional overturning circulation is important for the oceanic redistribution of heat from the tropics to the Northern Hemisphere; it is confined to the North Atlantic because of its higher salinity and thus greater density than the North Pacific (Haupt and Seidov, 2007).
Compelling evidence has been assembled indicating that rapid freshwater discharges to the North Atlantic due to the breaking of ice dams and drainage of meltwater
lakes during the termination of the ice ages caused abrupt circulation changes in the oceans, with significant impacts on regional climate (Boyle and Keigwin, 1987; Lehman and Keigwin, 1992; McManus et al., 2004). The paleoclimate record indicates that the strong meltwater pulses diluted the surface waters of the North Atlantic and rendered them too buoyant to sink, thus shutting down the meridional overturning circulation for centuries at a time (Alley et al., 2003; Broecker, 1987; NRC, 2002a). These shutdowns of the overturning circulation were associated with a dramatic cooling of European climate and also influenced global weather patterns (Vellinga and Wood, 2002). Whether human-caused warming will cause similar abrupt climate changes in the future is an important topic for research (Rahmstorf, 1995) . A freshening of the surface waters of the North Atlantic over the past 50 years has been well documented (Boyer et al., 2005; Curry et al., 2003; Dickson et al., 2002; Levitus, 1989) but it is unclear if climate change will ultimately lead to a gradual slowing or even an acceleration of the meridional overturning circulation ( as discussed above). Many models suggest that some slowing of the meridional overturning circulation will result from the ice melting and increased Arctic river discharges that are already taking place, but these models have poor representation of oceanic mixing processes and coastal freshwater discharges. Thus, while the risk of these and other possible abrupt changes in climate should be taken seriously, much work remains to develop confident projections of future ocean circulation changes resulting from the ongoing freshening of the North Atlantic.
IMPACTS OF SEA LEVEL RISE AND OTHER CLIMATE CHANGES ON COASTAL ENVIRONMENTS
Coastal areas are among the most densely populated regions of the United States, and around the world. In 2003, 53 percent of the U.S. population lived in (1) counties with at least 15 percent of its total land area located within the nation’s coastal watershed or (2) a county with a portion of its land that accounts for at least 15 percent of a coastal cataloging unit1 bordering the ocean and the Great Lakes, and 23 of the 25 most densely populated counties in 2003 were coastal counties (Crossett et al., 2004). Considering only coastal counties that border the ocean or contain flood zones with at least a 1 percent chance every year of experiencing flooding from coastal storms and being impacted by wave action, the coastal population, excluding the Great Lakes counties, was 85,640,000, or 30 percent of the total U.S.
population in the 2000 Census (Crowell et al., 2007).2 Such population concentration and growth are accompanied by a high degree of development and use of coastal resources for economic purposes, including industrial activities, transportation, trade, resource extraction, fisheries, tourism, and recreation. They also imply significant investments in infrastructure to support these human activities (see Chapters 12 and 13).
While humans have always made use of coastal resources and areas, permanent settlements with high levels of investment and infrastructure are a relatively recent phenomenon, as prehistoric peoples and even early settlers of the United States did not have the technology to protect themselves against storms. The modern concentration of people, human activities, development, and infrastructure is taking place in one of the most dynamic environments on Earth, where land, ocean, and climate are constantly changing. This interaction between a highly variable natural environment and the growing pressures from human use and development produces multiple stresses that make coastal areas particularly vulnerable to additional impacts from climate change.
The IPCC (Nicholls et al., 2007), the recent Global Climate Change Impacts on the United States report by the U.S. Global Change Research Program (USGCRP, 2009a), and other studies have documented that a growing number of well-studied coastal areas are already experiencing the effects of rising sea levels and related changes in climate. Physical damage and economic losses from coastal storms and related flooding, erosion, and cliff failures in highly developed regions are increasing; coastal wetlands, hemmed in by human development and deprived of river-borne sediment supplies, are being lost at an increasing rate; the frequency of coral bleaching and mortality events is increasing (see Chapter 9); water quality is declining from the combined impacts of effluent, higher water temperatures, and changes in runoff; saltwater is increasingly intruding into coastal groundwater resources (see Chapter 8); and coastal ecosystems are almost exclusively negatively impacted by the combination of all these climatic changes and human pressures, undermining fisheries, tourism, and long-term sustainability of coastal areas (Nicholls et al., 2007).
Increases in average sea level magnify the impacts of extreme events on coastal landscapes. Relatively small changes in average sea level can have dramatic impacts on storm surge elevation and on the inland extent and frequency of flooding events, depending on coastal topography and the existence of protective structures such as
seawalls, levees, and dikes (e.g., Kirshen et al., 2008). For example, analyses for San Francisco Bay indicated that increases in average sea level as small as 1 foot (0.3 meter) would lead to floods as high as today’s 100-year floods (that is, a flood that could be expected to occur once every one hundred years under current climate conditions) every 10 years (Field et al., 1999). Interestingly, in a number of locations along the U.S. coastline, average higher high water (the higher of the two high waters of any tidal day) is rising faster than average sea level, for reasons not yet fully understood; this increases the risk of extensive coastal flooding even more than the rise in average sea levels would suggest (Flick et al., 1999, 2003). In general, the direct losses of coastal habitat and built environments from gradual sea level rise can be greatly amplified by the far larger impacts of flooding, erosion, and wind damage caused by extreme events (Adams and Inman, 2009; Flick, 1998; Nicholls and Tol, 2006; Nicholls et al., 1999; Pendleton et al., 2009; Sallenger et al., 2002; Zhang et al., 2004).
The economic impacts of climate change and sea level rise on coastal areas are probably the second most frequently studied economic impacts in the United States after those on agriculture. Since the first study of this sort in 1980 (Schneider and Chen, 1980), economic impact assessment methodologies have become increasingly sophisticated, though they remain partial and subject to the commonly cited challenges of cost-benefit analyses (see Chapter 17). Analysts have examined the damage potential of gradual sea level rise on taxable real estate in coastal areas subject to inundation; expected impacts of extreme events (floods) on land loss, housing structures, property values, and building contents, as well as integrated impact analyses of combined sea level rise and extreme events; the wider impacts of sea level rise on economies dependent on coastal areas; and the cost of various response options (e.g., seawalls and other hard structures to prevent inundation or erosion loss, beach nourishment requirements as higher sea levels increase the rate of coastal erosion and sediment movement, and relocation or retreat from the shoreline; e.g., Bosello et al., 2007; Nicholls et al., 2007; Yohe et al., 1999). Simple conclusions about the nationwide magnitude of economic impacts cannot be drawn from these studies as metrics, modeling approaches, sea level rise projections, inclusions of coastal storms, and assumptions about human responses (e.g., the type and level of protection) vary considerably. The U.S. National Assessment’s coastal sector assessment (Boesch et al., 2000) estimated the cumulative cost of an 18-inch (46-centimeter) sea level rise by 2100 at between $20 and $200 billion, and a 3-foot (roughly 1-meter) sea level rise produced roughly double this figure. The wide range of estimates illustrates the considerable uncertainties involved in the underlying assumptions and calculations. Consistent approaches across U.S. coastal regions would provide much improved understanding of the economic threats.
Steady progress is being made toward more interdisciplinary, integrated analyses of the impacts of sea level rise and other climate and climate-related changes on coastal areas (see Box 4.2). However, most analyses to date still have not assessed economic impacts on culturally or historically important sites, or on coastal infrastructure such as wastewater treatment plants, water supply (drinking water treatment and desalination facilities), utilities (natural gas, electricity, and telephone lines), roads, airports, harbors, and other transportation infrastructure although there are some notable exceptions for certain U.S. locations (e.g., Heberger et al., 2009; Larsen et al., 2008; NRC, 2008g). Impacts on nonmarket values such as the loss of natural habitat have been equally challenging to assess and therefore are still often omitted from economic impact assessments. Coastal ecosystems such as dunes, wetlands, seagrass beds, and mangroves provide numerous ecosystem goods and services, ranging from nursery habitat for certain fish and shellfish to habitat for bird, mammal, and reptilian species, including some endangered ones; protective or buffering services for coastal development against the impacts of storms; water filtering and flood retention; and the aesthetic, cultural, and economic value of beaches and coastal environments for recreation, tourism, and simple enjoyment (for detailed reviews of this literature see Darwin and Tol, 2001; Nicholls et al., 2007; West and Dowlatabadi, 1999).
As climate continues to change and sea level continues to rise through the twenty-first century, these physical, ecological, and socioeconomic impacts on coastal areas are expected to increase and intensify. Moreover, they can be expected to be exacerbated by continued growth in human pressures on coastal areas. Even if sea level rise were to remain in the conservative range projected by the IPCC (0.6 to 1.9 feet [0.18 to 0.59 meters])—not considering potentially much larger increases due to rapid decay of the Greenland or West Antarctic ice sheets—tens of millions of people worldwide would still become vulnerable to flooding due to sea level rise over the next 50 years (Nicholls, 2004; Nicholls and Tol, 2006). This is especially true in densely populated, low-lying areas with limited ability to erect or establish protective measures. In the United States, the high end of the conservative IPCC estimate would result in the loss of a large portion of the nation’s remaining coastal wetlands. The impact on the east and Gulf coasts of the United States of 3.3 feet (1 meter) of sea level rise, which is well within the range of more recent projections for the 21st century (e.g., Pfeffer et al., 2008; Vermeer and Rahmstorf, 2009), is shown in pink in Figure 7.7. Also shown, in red, is the effect of 19.8 feet (6 meters) of sea level rise, which could occur over the next several centuries if warming were to continue unabated.
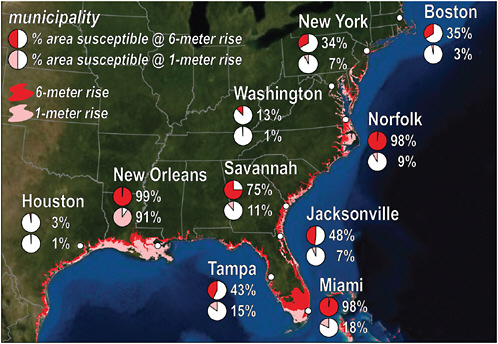
FIGURE 7.7 Areas of the east and Gulf coasts of the United States susceptible to coastal inundation following a 3.3-foot (1-meter; pink shading) or 19.8-foot (6-meter; red shading) sea level rise. Pie charts show the percentage of some cities that are potentially susceptible to 3.3-foot (1-meter; pink) or 19.8-foot (6-meter; red) sea level rise. SOURCE: Overpeck and Weiss (2009).
RESPONDING TO SEA LEVEL RISE
General scientific understanding of people’s vulnerability and ability to adapt to sea level rise and other climate changes has increased substantially in recent years, though place-based, sector-specific knowledge remains extremely limited. Developing countries are expected to generally face greater challenges in dealing with the impacts of rising sea levels because of large exposed populations and lower adaptive capacity—which is largely a function of economic, technological, and knowledge resources, social capital, and well-functioning institutions (Adger et al., 2007; Nicholls et al., 2007). However, even in developed countries like the United States, significant gaps remain in our understanding of the impacts of sea level rise, especially for specific locations (Moser, 2009a), as well as considerable challenges in translating our greater adaptive capacity into real adaptation action on the ground (Adger et al., 2007, 2009b;
NRC, 2010a; O’Brien et al., 2006; Repetto, 2008). Certain technological options such as seawalls and levees are not feasible in all locations, and in many they could negatively impact the coastal ecology, beach recreation and tourism, and other social values (e.g., aesthetics). At the same time, a wide range of barriers and constraints make “soft” solutions equally challenging—these include changes in land use, planning, and, ultimately, retreat from the shoreline, with the associated costs and social and ecological consequences. Such constraints and limits on adaptation are increasingly recognized and researched (Adger et al., 2009b; Moser and Tribbia, 2006; Moser et al., 2008; NRC, 2010a). While there is extensive research about, and experience dealing with, coastal hazards, significant further research is required to determine the most appropriate, cost-effective, least ecologically damaging, and most socially acceptable adaptation options in the face of significantly faster rates of sea level rise than has been historically experienced. Past coastal hazards management approaches may not be ecologically sustainable or economically affordable in light of some of the high-end sea level rise projections.
While many research questions about managing coastal ecosystems and hazards remain (see, e.g., JSOST, 2007), the fundamental best practices are well known and include building new structures, elevating existing structures above flood elevation, and maintaining dunes as storm buffers. However, these measures are not frequently employed because underlying incentives and self-reinforcing factors favor continued development in at-risk areas, structural protection, and repeated emergency intervention (Burby, 1998; Kunreuther, 2008; Mileti, 1999; Platt, 1996, 1999). An additional challenge is how to evaluate and weigh near-term costs and benefits against long-term costs and benefits, given that neither is known with much precision and such evaluations are inherently place-specific. A critical research topic is how to foster adaptive coastal management actions with a long-term, systemic perspective while avoiding the worst economic, social, and ecological consequences for coastal areas (see also Chapter 4). Finally, little is known about local vulnerability to sea level rise in the context of multiple stresses, such as increased storm surge or rainfall rates, or about the feasibility and acceptability of various adaptation options. These issues are discussed in a recent synthesis of the impacts of climate change and vulnerability of coastal areas of the U.S. mid-Atlantic region (CCSP, 2009a; Najjar et al., 2009; Wu et al., 2009).
RESEARCH NEEDS
Significant sea level rise is expected for the foreseeable future, but the physical science of sea level rise and related climatic changes remains incomplete, making specific projections highly uncertain at this time. Moreover, place-specific social and ecological
understanding of vulnerability and adaptation potential in coastal regions is severely lacking. Decision makers and other stakeholders should assume that changing scientific understanding as well as environmental and societal conditions will require considerable policy flexibility and make for potentially difficult tradeoffs. Thus, an adaptive risk management approach is indicated (see Box 3.1 and NRC, 2010b). Key research advances that would assist in improving both understanding and decision making include the following:
Reduce the scientific uncertainties associated with land-ice changes. Comprehensive, simultaneous, and sustained measurements of ice mass and volume changes and ice velocities are needed, along with measurements of ice thickness and bed conditions, both to quantify the current contributions of ice sheets to sea level rise and to constrain and inform ice sheet model development for future assessments. These measurements, which include satellite, aircraft, and in situ observations, need to overlap for several decades in order to enable the unambiguous isolation of ice melt, ice dynamics, snow accumulation, and thermal expansion. Equally important are investments in improving ice sheet process models that capture ice dynamics as well as interactions with the ocean and the ice bed. Efforts are already under way to improve modeling capabilities in these critical areas, but fully coupled ice-ocean-land models will ultimately be needed to reliably assess ice sheet stability, and considerable work remains to develop and validate such models—especially given the relatively small number of qualified researchers currently working in this area. Sustained observations and analysis programs are also needed for improving understanding and projections of glaciers and ice caps. Finally, additional paleoclimate data from ice cores, corals, and ocean sediments would be valuable for testing models and improving our understanding of the impacts of sea level rise.
Improve understanding of ocean dynamics and regional rates of sea level rise. Direct, long-term monitoring of sea level and related oceanographic properties via tide gauges, ocean altimetry measurements from satellites, and an expanded network of in situ measurements of temperature and salinity through the full depth of the ocean water column are needed to quantify the rate and spatial variability of sea level change and to understand the ocean dynamics that control global and local rates of sea level rise. A better understanding of the dependence of ocean heat uptake on vertical mixing and the abrupt change in polar reflectivity that will follow the loss of summer sea ice in the Arctic are some of the most critical improvements needed in ocean and Earth system models. In addition, oceanographic, geodetic, and coastal models are needed to predict the rate and spatial dynamics of ocean thermal expansion, sea level rise, and coastal inundation. The need for regionally specific information creates additional challenges. For example, coastal inundation models require better
bathymetric data in the coastal seas, improved elevation data on land, the inclusion of wave and spillover effects, better data on precipitation rates and stream flows, ways of dealing with storm-driven sediment transport, and the ability to include the effects of built structures on coastal wind stress patterns.
Develop tools and approaches for understanding and predicting the vulnerability to, and impacts of, sea level rise on coastal ecosystems and coastal infrastructure, as well as for translating this understanding into decision-relevant information. The impacts of sea level rise on wetlands, coral reefs, marine fisheries, and estuarine bays and rivers need to be evaluated in concert with the impacts associated with increasing levels of CO2 in the atmosphere and oceans, increasing nutrient inputs from land, and changes in use or management (see also Chapter 9). Likewise, the impacts of sea level rise on infrastructure, including ports, roads, cities, dikes, levees, and freshwater aquifers and storage facilities, should take into account potential shifts in storm patterns, rainfall rates, and other climate changes (see also Chapters 12 and 13). Improved valuation of nonmarket values, and development of decision-support tools to assess the trade-offs between physical, ecological, and social impacts and response options (see below) are needed to inform coastal management decisions that require long lead times.
Expand the ability to identify and assess vulnerable coastal regions and populations and to develop and assess adaptation strategies to reduce their vulnerability. With sea level rise acting in combination with other physical, social, and economic stressors, the ability to assess the social-ecological vulnerability of coastal regions, improve society’s adaptive response options (through technological, economic, and land use changes), and identify constraints to adaptation (including legal, social, political, infrastructure-related, and economic issues) are all critical research needs (see also Chapter 4). This area of research has received very little attention to date, leaving many U.S. coastal communities without adequate place-specific information to inform their adaptation decisions.
Develop decision-support capabilities for all levels of governance. Methods for identifying preferences and weighing alternative adaptive responses will be needed as environmental and social conditions change over time. Frameworks and approaches need to be developed for the evaluation of market and nonmarket values of affected assets and habitats; of the economic costs and other consequences of different response options to sea level rise on both highly developed and less developed shorelines; and of the social and environmental feasibility of different adaptation options (including technological, economic, physical, ecological, social, or legal options) for different coastlines. This will require improved information of the kinds listed
above, as well as financial and technical resources that enable decision makers to engage in adaptation planning and actions.
Build capacity. There is a significant shortage of expertise to conduct place-based vulnerability and adaptation needs assessments in coastal regions of the United States (as well as in other sectors and regions, as discussed in Chapter 4), making it extremely challenging to meet the rapidly increasing demand for such information by decision makers. Thus, a strong emphasis on training and capacity building is needed to generate human resources that can produce and also use the information essential for effective adaptation planning along U.S. coasts.


