
A10
PRELIMINARY OBSERVATION OF THE EPIDEMIOLOGY OF SEASONAL AND PANDEMIC INFLUENZA A (H1N1) IN SOUTH AFRICA, 2009
B. D. Schoub, M.D., D.Sc., F.R.C.Path.,72 B. N. Archer, B.Med., M.P.H.,73 C. Cohen, M.Sc., M.B.B.Ch., F.C.Path.,73 D. Naidoo, M.Sc.,74 J. Thomas, M.B.B.Ch., F.C.Path.,74 C. Makunga, B.Sc.Hons., M.B.B.Ch.,74 M. Venter, Ph.D.,74 G. Timothy, M.B.B.Ch.,75 A. Puren, Ph.D., M.B.B.Ch.,73 J. McAnerney, R.N.,74 A. Cengimbo, M.B.B.Ch.,74 and L. Blumberg, M.B.B.Ch., M.Med.73
Introduction
The 2009-H1N1 influenza A pandemic took many by surprise. Unexpectedly arising in North America and spreading rapidly throughout the northern hemisphere summer, it encircled the globe within a couple of months. This event has again highlighted the crucial need for a more comprehensive global surveillance system for influenza (Lipsitch et al., 2009; Ortiz et al., 2009).
The World Health Organization (WHO) Influenza Programme has provided valuable information on circulating influenza viruses globally through its network of 128 national influenza centers in 99 countries, supported by five WHO collaborative centers (WHO, 2002, 2008, 2009a). Virus isolates from the majority of these laboratories provide the basis for the annual recommendation by WHO of the strains to be incorporated into the influenza vaccines for the Northern and Southern Hemispheres in February and September, respectively, of each year (WHO, 2009b,c).
However, the African continent is poorly capacitated for influenza surveillance (Schoub et al., 2002). Of the 46 countries constituting the WHO AFRO region, only 18 possess national influenza centers and only 10 are able to perform diagnostic PCR (WHO, 2009d,e). As of September 30, 2009, 12,382 cases of 2009-H1N1 influenza A were reported from this region; the great majority (93 percent) were reported from South Africa (WHO, 2009f).
Influenza Surveillance in South Africa
Systematic surveillance for influenza in South Africa dates back to 1984, when the first surveillance network of sentinel medical practitioners, the “Viral
Watch,” was established in Johannesburg (Besselaar et al., 2001; McAnerney et al., 1994; Schoub et al., 1986, 1994). Currently, the Viral Watch network consists of 243 sentinel sites, which provide clinical and epidemiological data on influenza in the community, as well as material for isolation and antigenic and molecular characterization of viruses, for input to WHO for decision making as to annual vaccine composition recommendations. In response to the 2009-H1N1 influenza A pandemic, the Viral Watch program was supplemented with an additional 10 hospital-based sites situated in all 9 provinces. Additional surveillance was provided by a Severe Acute Respiratory Infection (SARI) surveillance program, also established in 2009 in four large hospitals in three provinces. In addition, a large number of diagnostic specimens were received by the laboratory following widespread concern around the pandemic. Finally, active surveillance was introduced to collect information on all laboratory-confirmed cases due to 2009-H1N1 influenza A nationally, from both private and public laboratories.
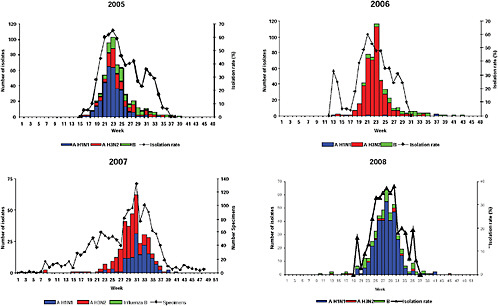
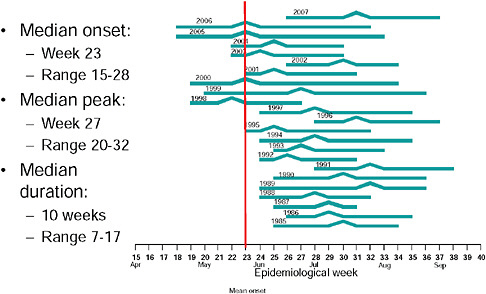
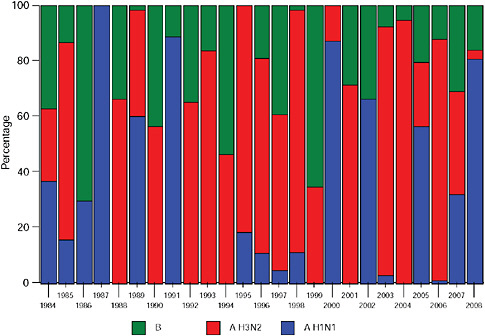
Up until 2009, the pattern of influenza isolations, as identified through the Viral Watch program, universally showed a typical unimodal distribution, as shown in Figure A10-1, with a median onset at week 23 (range 15-28), a median peak at week 27 (range 20-32) and a median duration of 10 weeks (range 7-17) (Figure A10-2). This pattern is consistent with other temperate Southern Hemisphere countries. The distribution of influenza subtypes is shown in Figure A10-3. Over the past 25 years, H3N2 was the dominant subtype in 13 of the years, H1N1 in 7, and influenza B in 2 of the years, with an equal distribution of all three in 2 years and an equal combination of H3N2 and B in one of the years.
The 2009-H1N1 Influenza A Pandemic in South Africa
The epidemic curve of the 2009-H1N1 influenza A pandemic as determined through active surveillance for all laboratory-confirmed cases nationally in South Africa, as of September 29th, is shown in Figure A10-4. The first case of 2009-H1N1 influenza A was confirmed in South Africa on June 13, some 2 months after that of the United States and a month or more after other Southern Hemisphere countries (Table A10-1). The reason for this inordinate delay in importation into South Africa is probably related to the relatively low volume of air traffic between it and North America (Chen and Wilson, 2008; Khan et al., 2009).
The first confirmed South African case was in a healthy 16-year-old boy who had visited family in Texas and returned to South Africa on June 10th presenting with clinical signs and symptoms of influenza-like-illness (ILI). A positive diagnosis of 2009-H1N1 influenza A infection was made at the National Institute for Communicable Diseases (NICD) using the CDC real-time (RT-) PCR protocol for the detection and characterization of swine influenza. He was treated with oseltamivir on day 3 after onset of symptoms and made an uneventful recovery; no secondary contacts were identified. During the following 2 weeks, NICD continued to detect sporadic (H1N1) among individuals returning from North America,
![FIGURE A10-4 Epidemic curve of laboratory-confirmed pandemic 2009-H1N1 influenza A cases and deaths by week, South Africa, as of December 15, 2009 (n[cases] = 12,683).](/openbook/12799/xhtml/images/p2001b2d6g287001.jpg)
FIGURE A10-4 Epidemic curve of laboratory-confirmed pandemic 2009-H1N1 influenza A cases and deaths by week, South Africa, as of December 15, 2009 (n[cases] = 12,683).
TABLE A10-1 First Confirmed Cases of 2009-H1N1 Influenza A
|
Argentina |
May 16 |
|
Australia |
May 7 |
|
Chile |
May 17 |
|
New Zealand |
April 28 |
|
Uruguay |
May 27 |
|
USA |
April 17 |
|
South Africa |
June 13 |
South America, and Europe, with documented cases of local transmission resulting to a close household contact. A week later, on June 27th, an outbreak of H1N1 occurred at a sports event in Johannesburg, where 20 young athletes with ILI were confirmed at NICD as pandemic H1N1. The index case of this cluster was probably an 18-year-old male attending from Zimbabwe, believed to have been infected while in transit (possibly through contact with other travellers). Over the next 2 weeks the number of confirmed cases rose steeply and, on July 13th, a month after the first case was diagnosed, over 100 cases had been confirmed in South Africa. At that stage the majority of cases were identified in the Gauteng province, the province with the largest population (incorporating both Johannesburg and Pretoria) and with the highest international exposure through OR Tambo International Airport in Johannesburg. In conformance with the WHO recommendations
to cease universal laboratory testing of all suspected cases once the 100-case mark had been reached, the NICD and other academic centers reverted to testing only selected cases. Of the first 100 cases, 42 gave a travel history consistent with having acquired the infection abroad (Table A10-2).
Epidemiological Characteristics
As of September 29, 2009, a total of 11,729 cases had been confirmed nationally (Figure A10-4). The first death was confirmed on July 28th; a 22-year-old male student with no apparent comorbid condition. As of September 28th, 83 deaths had been laboratory-confirmed; the details are described below.
The 2009 influenza season, as reflected through the Viral Watch program (community influenza surveillance), showed, for the first time, a bimodal curve (Figure A10-5). A similar bimodal distribution of 2009-H1N1 influenza A cases was also seen from the SARI program (Figure A10-6). Using mid-year population estimates (STATSSA, 2009), incidence data of laboratory-confirmed cases per 100,000 population were calculated for each of the nine provinces of South Africa (Table A10-3). The highest incidence was, not unexpectedly, seen in the Gauteng province, the commercial hub of the country, which is the smallest province geo-
TABLE A10-2 Travel History of 42 Cases Within the First 100 Investigated
|
North America |
6 |
14% |
|
USA |
6 |
|
|
South America |
5 |
12% |
|
Argentina |
2 |
|
|
Brazil |
2 |
|
|
Chile |
1 |
|
|
Europe |
15 |
36% |
|
Other European Countries |
5 |
|
|
Germany |
1 |
|
|
Greece |
1 |
|
|
Netherlands |
1 |
|
|
Sweden |
1 |
|
|
Turkey |
1 |
|
|
UK |
5 |
|
|
Asia |
8 |
19% |
|
China |
2 |
|
|
Singapore |
4 |
|
|
Dubai |
1 |
|
|
Bali |
1 |
|
|
Other African Countries |
3 |
7% |
|
Mauritius |
2 |
|
|
Zimbabwe |
1 |
|
|
Australia |
5 |
12% |
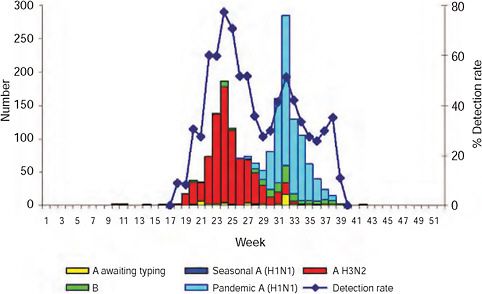
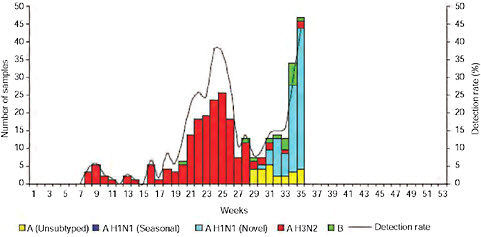
TABLE A10-3 Laboratory-Confirmed Pandemic 2009-H1N1 Influenza A Cases by Province, South Africa, as of December 15, 2009
|
Province |
Laboratory-Confirmed Cases |
|
|
Cumulative Total |
Incidence Rate (per 100,000 population) |
|
|
Eastern Cape |
682 |
10.26 |
|
Free State |
314 |
10.82 |
|
Gauteng |
5,579 |
52.98 |
|
KwaZulu-Natal |
2,258 |
21.61 |
|
Limpopo |
545 |
10.43 |
|
Mpumalanga |
500 |
13.86 |
|
Northern Cape |
134 |
11.68 |
|
North West |
465 |
13.48 |
|
Western Cape |
2,113 |
39.44 |
|
Unknown |
42 |
— |
|
South Africa Total |
12,632 |
25.61 |
graphically but has the largest population, the highest population density, and the greatest contact internationally. This was followed by Western Cape (including Cape Town) and KwaZulu-Natal (including Durban). These provinces are also more urbanized and individuals there would be more likely to seek care and diagnostic testing for influenza than persons in more rural provinces. The age distribution of cases showed a predominance in children and young adults as also seen in countries throughout the world (CDC, 2009; Gilsdorf and Poggensee, 2009; Levy-Bruhl and Vaux, 2009; Lytras et al., 2009; Munayco et al., 2009; WHO, 2009g)—Figure A10-7, Table A10-4. The ages ranged from newborn to 90 years with a median age of 16 years. The age distribution curves for the different influenza subtypes as they presented in the Viral Watch program were compared. The pandemic 2009-H1N1 influenza A pattern was distinct from both the H3N2 of 2009 and the seasonal H1N1 of 2008 (Figures A10-8 and A10-9) and more closely resembled that of influenza B in 2009 (Figure A10-10).
Preliminary Investigation of the First 100 Cases
A more detailed follow-up investigation was carried out on the first 100 cases in South Africa. These cases, however, represented a more affluent, upper socioeconomic section of the population and were also not representative of the racial composition of the South African population (Table A10-5). International travel within 7 days of onset of symptoms was reported in 42 cases and no travel or any contact with international travelers in the remainder. Only a minority of cases had recognized comorbid conditions—asthma (7), heart disease (5), preg-
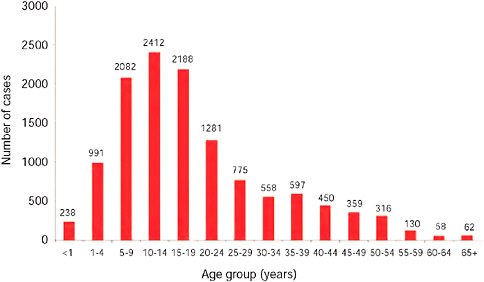
FIGURE A10-7 Number of laboratory confirmed pandemic 2009-H1N1 influenza A cases by age group, as of December 15, 2009 (n = 11,729).
TABLE A10-4 Pandemic 2009-H1N1 Influenza A Cases by Age Group, South Africa, as of December 15, 2009
|
Age (years) |
Number |
Incidence per 100,000a |
Percentage of total |
|
1-4 |
1,229 |
243 |
10 |
|
5-9 |
2,082 |
402 |
18 |
|
10-14 |
2,412 |
460 |
21 |
|
15-19 |
2,188 |
420 |
19 |
|
20-24 |
1,281 |
260 |
11 |
|
25-29 |
775 |
175 |
7 |
|
30-34 |
558 |
144 |
5 |
|
35-39 |
597 |
182 |
5 |
|
40-44 |
450 |
184 |
4 |
|
45-49 |
359 |
159 |
3 |
|
50-54 |
316 |
155 |
3 |
|
55-59 |
130 |
79 |
1 |
|
60-64 |
58 |
45 |
0.5 |
|
>65 |
62 |
26 |
0.5 |
|
aPopulation figures based on mid-year population estimates 2009 (STATSSA, 2009). |
|||
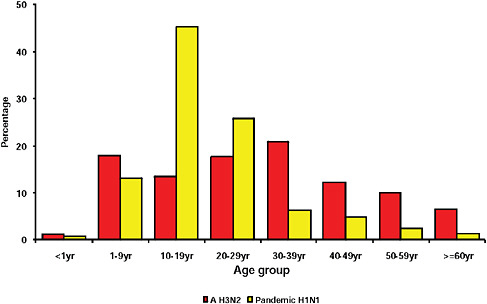
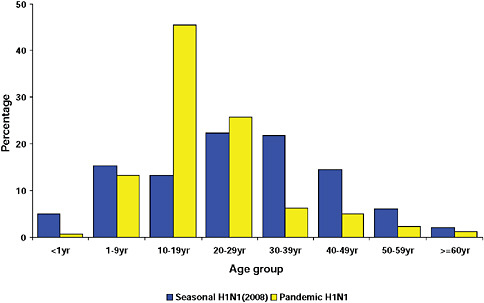
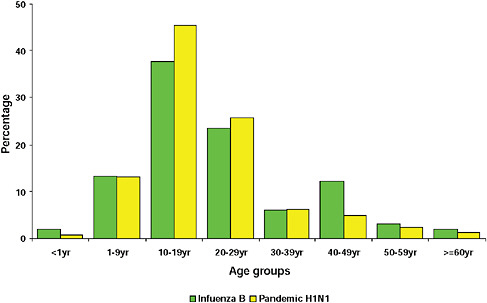
FIGURE A10-10 Age distribution of patients with influenza B and pandemic 2009-H1N1 influenza A.
TABLE A10-5 Breakdown of First 100 Cases by Race
|
Race |
H1N1 Cases N / Percentage |
Total South African Populationa N / Percentage |
|
Asian |
12 |
2.6 |
|
African |
6 |
79.3 |
|
Mixed race |
5 |
9.0 |
|
White |
74 |
9.1 |
|
Unknown |
3 |
— |
|
Total |
100 |
100.0 |
|
aBased on 2009 mid-year population estimates (STATSSA, 2009). |
||
nancy (3), and obesity (2) (BMI > 30). The distribution of reported symptoms in these cases followed that seen generally throughout the world (Eurosurveillance, 2009b-e)—Figure A10-11.
The mean time from onset of symptoms to presentation at a health facility was 2.0 days (SD 1.5 days, range 0-7 days) and symptom onset to recovery was 7.9 days (SD 1.5 days, range 0-7 days). Eleven cases were hospitalized, some as a precaution to isolate the patient and 6 developed complications including pneumonia (3), otitis media (1), myocarditis (1), and other (1).
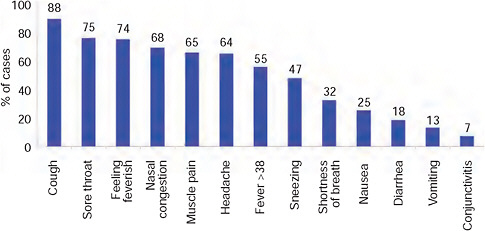
FIGURE A10-11 Reported symptoms in first 100 confirmed cases, South Africa.
Preliminary Investigation of Deaths
As of December 17, 2009, 92 laboratory-confirmed deaths were recorded in South Africa. The ages range from 3 days to 70 years, with a median age of 33 years—significantly higher than the overall median age of 15 years. Deaths were more common in females (60 percent) whereas the gender ratio was approximately equal in nonfatal cases. This was due, to a large extent, to the unusually large proportion of deaths in pregnant woman: 26 of the 91 cases (28 percent) with known clinical history. All but three of the deaths in pregnancy occurred in the third trimester (one in the second trimester and two in the puerperium). Of the 14 pregnancy-related fatal cases with known HIV status, 10 (71 percent) were HIV-positive; the national HIV seroprevalence in women attending public-sector antenatal clinics is 29 percent (Department of Health, 2009). Other comorbid conditions in this group were tuberculosis (TB) in 9 (11 percent) and pre eclampsia in 2 (8 percent).
Of the 66 nonpregnant deaths, most (61 percent) were male. HIV was recorded in 6 of 17 patients (35 percent) as compared to the overall HIV prevalence of 17 to 19 percent for South Africa (Department of Health, 2009). Active TB was found in 2 of 46 cases (4 percent) and other comorbid conditions included obesity (12 of 46; 26 percent), diabetes (11 of 45; 24 percent), and cardiac disease (8 of 44; 18 percent).
Conclusion
In many respects the 2009-H1N1 influenza A pandemic has behaved similarly to both developed and developing countries throughout the world. These
include age distribution, epidemiology, clinical features and overall relative mildness. The late introduction into South Africa appeared, to some extent, to be due to relatively lower air traffic levels and provided a window to observe any further genetic movement in the virus. Phenotypic changes in the virus were certainly not apparent from the clinical and epidemiological observations. Virological characterization is presently under way to determine antigenic drift, resistance, and presence of any virulence markers. Two particular risk groups in South Africa do perhaps need to be highlighted—those involving pregnancy and HIV. Although pregnancy is a well-recognized risk factor in H1N1 (Jamieson et al., 2009; Mangtani et al., 2009), South Africa experienced an unusually high number of women in late pregnancy who succumbed to H1N1. Second, the high rate of HIV positivity in both pregnant and nonpregnant individuals who died (considerably higher than the background HIV positivity in these two groups) needs special attention. In both groups the HIV prevalence was nearly double that of the respective national prevalence rates (Department of Health, 2009). These are, however, preliminary observations and are subject to potentially significant bias. For example, pregnancy may well be a factor that could increase the likelihood of a death being reported because of relatively greater access to a health facility. Also HIV may be artificially high as patients with more advanced disease and the stigma of HIV infection may be more likely to be treated and also more likely to succumb to H1N1. Whether persons living with HIV constitute a risk group for more severe influenza infection in the absence of secondary infection remains to be established (Kunisaki and Janoff, 2009). A study in an HIV-infected pediatric population in South Africa, also failed to demonstrate differences in outcome of influenza infection (Madhi et al., 2002). An understanding of these risk factors is of urgent importance, particularly in countries with a high prevalence of HIV and limited vaccine resources.
References
Besselaar, T. G., B. D. Schoub, and J. M. McAnerney. 2001. Phylogenetic studies of South African influenza A viruses: 1997-1999. In Options for the Control of Influenza IV, edited by A. D. M. E. Osterhaus, N. Cox, and A. W. Hampson. Proceedings of the Fourth International Conference on the Control of Influenza IV, Crete, Greece, September 23-28, 2000. Excerpta Medica 1219:139-145.
CDC (Centers for Disease Control and Prevention). 2009. Update: Novel influenza A (H1N1) virus infections—worldwide, May 6, 2009. Morbidity and Mortality Weekly Report 58(RR17):453-457.
Chen, L. H., and M. E. Wilson. 2008. The role of the traveler in emerging infections and magnitude of travel. Medical Clinics of North America 92(6):1409-1432.
Department of Health. 2009. 2008 National Antenatal Sentinel HIV and Syphilis Prevalence Survey, South Africa.
ECDC Working Group on Influenza A(H1N1)v. 2009. Preliminary analysis of influenza A(H1N1)v individual and aggregated case reports from EU and EFTA countries. Eurosurveillance 14(23), http://www.eurosurveillance.org/images/dynamic/EE/V14N23/art19238.pdf (accessed October 22, 2009).
Gilsdorf, A., and G. Poggensee. 2009. Influenza A(H1N1)v in Germany: the first 10,000 cases. Eurosurveillance 14(34), http://www.eurosurveillance.org/ViewArticle.aspx?ArticleId=19318 (accessed October 22, 2009).
Jamieson, D. J., M. A. Honein, S. A. Rasmussen, J. L. Williams, D. L. Swerdlow, M. S. Biggerstaff, S. Lindstrom, J. K. Louie, C. M. Christ, S. R. Bohm, V. P. Fonseca, K. A. Ritger, D. J. Kuhles, P. Eggers, H. Bruce, H. A. Davidson, E. Lutterloh, M. L. Harris, C. Burke, N. Cocoros, L. Finelli, K. F. MacFarlane, B. Shu, S. J. Olsen. 2009. H1N1 2009 influenza virus infection during pregnancy in the USA. Lancet 374(9688):451-458.
Khan, K, J. Arino, W. Hu, P. Raposo, J. Sears, F. Calderon, C. Heidebrecht, M. Macdonald, J. Liauw, A. Chan, and M. Gardam. 2009. Spread of a novel influenza A (H1N1) virus via global airline transportation. New England Journal of Medicine 361(2):212-214.
Kunisaki, K. M., and E. N. Janoff. 2009. Influenza in immunosuppressed populations: a review of infection frequency, morbidity, mortality, and vaccine responses. Lancet Infectious Disease 9(8):493-504.
Levy-Bruhl, D., and S. Vaux. 2009. Influenza A(H1N1)v investigation teams. Modified surveillance of influenza A(H1N1)v virus infections in France. Eurosurveillance 14(29), http://www.eurosurveillance.org/images/dynamic/EE/V14N29/art19276.pdf (accessed October 22, 2009).
Lipsitch, M., S. Riley, S. Cauchemez, A. C. Ghani, and N. M. Ferguson. 2009. Managing and reducing uncertainty in an emerging influenza pandemic. New England Journal of Medicine 361(2):112-115.
Lytras, T., G. Theocharopoulos, S. Tsiodras, A. Mentis, T. Panagiotopoulos, and S. Bonovas. 2009. Enhanced surveillance of influenza A(H1N1)v in Greece during the containment phase. Eurosurveillance 14(29), http://www.eurosurveillance.org/ViewArticle.aspx?ArticleId=19275 (accessed October 22, 2009).
Madhi, S. A., N. Ramasamy, T. G. Bessellar, H. Saloojee, and K. P. Klugman. 2002. Lower respiratory tract infections associated with influenza A and B viruses in an area with a high prevalence of pediatric human immunodeficiency type 1 infection. Pediatric Infectious Disease Journal 21(4):291-297.
Mangtani, P., T. K. Mak, and D. Pfeifer. 2009. Pandemic H1N1 infection in pregnant women in the USA. Lancet 374(9688):429-430.
McAnerney, J. M., S. Johnson, and B. D. Schoub. 1994. Surveillance of respiratory viruses—a 10 year laboratory based study. South African Medical Journal 84(8 Pt. 1):473-477.
Munayco, C. V., J. Gomez, V. A. Laguna-Torres, J. Arrasco, T. J. Kochel, V. Fiestas, J. Garcia, J. Perez, I. Torres, F. Condori, H. Nishiura, and H. Chowell. 2009. Epidemiological and transmissibility analysis of influenza A(H1N1)v in a southern hemisphere setting: Peru. Eurosurveillance 14(32), http://www.eurosurveillance.org/images/dynamic/EE/V14N32/art19299.pdf (accessed October 22, 2009).
Ortiz, J. R., V. Sotomayor, O. C. Uez, O. Oliva, D. Bettels, M. McCarron, J. S. Bresee, and A. W. Mounts. 2009. Strategy to enhance influenza surveillance worldwide. Emerging Infectious Diseases 15(8):1271-1278.
Schoub, B. D., S. Johnson, J. M. McAnerney, E. Martin, and I. L. Dos Santos. 1986. Laboratory studies of the 1984 influenza epidemic on the Witwatersrand. South African Medical Journal 70(13):815-818.
Schoub, B. D., S. Johnson, and J. M. McAnerney. 1994. Benefits and limitations of the Witwatersrand influenza and acute respiratory infections surveillance programme. South African Medical Journal 84(10):674-678.
Schoub, B. D., J. M. McAnerney, and T. G. Besselaar. 2002. Regional perspectives on influenza surveillance in Africa. Vaccine 20(2):S45-S46.
STATSSA (Statistics South Africa). 2009. Mid-year population estimates 2009, www.statssa.gov.za (accessed November 17, 2009).


