
Workshop Overview1
THE DOMESTIC AND INTERNATIONAL IMPACTS OF THE 2009-H1N1 INFLUENZA A PANDEMIC: GLOBAL CHALLENGES, GLOBAL SOLUTIONS
In March and early April 2009, a new, swine-origin 2009-H1N1 influenza A virus (S-OIV)2 emerged in Mexico and the United States. During the first few weeks of surveillance, the virus spread by human-to-human transmission worldwide to over 30 countries, causing the World Heath Organization (WHO) to raise its pandemic alert level to Phase 5 of 6. On June 11, 2009, the WHO raised the worldwide pandemic alert level to Phase 6 in response to the sustained global spread of the 2009-H1N1 influenza A virus. President Obama, on October 24, 2009, signed an official proclamation declaring the 2009-H1N1 influenza A swine flu outbreak a national emergency in the United States (The White House, 2009). This declaration does “hereby find and proclaim that, given that the rapid increase in illness across the Nation may overburden health care resources and that the temporary waiver of certain standard Federal requirements may be warranted in order to enable U.S. health care facilities to implement emergency operations plans, the 2009 H1N1 influenza pandemic in the United States constitutes a national emergency.”
This novel, swine-origin, influenza A virus has now become the first pandemic of the twenty-first century. The international scientific, public health, security, and policy communities quickly mobilized to characterize the novel virus (hereinafter 2009-H1N1 influenza A) and address its potential effects. Within six months of the discovery of the 2009-H1N1 influenza A virus, researchers had gained considerable knowledge about the latest pandemic influenza virus and produced a vaccine against it, but many scientific and policy questions raised by the 2009-H1N1 influenza A virus remained to be answered.
The arrival of an influenza pandemic in 2009 was both anticipated and unexpected. That a novel, readily transmissible, influenza virus would spread widely and rapidly along with its globe-trotting hosts seemed inevitable; that this pandemic strain emerged in the Americas, rather than Asia, surprised many infectious disease experts. “We have all been preparing for a pandemic,” veteran flu researcher Robert Webster of St. Jude Children’s Research Hospital remarked recently (Webster, 2009). “H5N1 [Avian influenza] has been at the top of our list and surprise, surprise, 2009-H1N1 influenza A came out of left field.”
In the months since the initial identification of the 2009-H1N1 influenza A virus, the disease has now spread to over 213 countries and territories while scientists, healthcare providers, policy makers, the media, and the general public attempted to anticipate, and mitigate, the myriad potential consequences of the evolving pandemic. Studies of the evolution of influenza viruses attest to their essential unpredictability, but knowledge gathered during the recent influenza season in the Southern Hemisphere can inform strategies to address the expected resurgence of 2009-H1N1 influenza A with winter’s return to the Northern Hemisphere. This effort will also be advanced by the ongoing evaluations of public health capacities to address current and future challenges presented by this pandemic, its economic repercussions, and its sociopolitical effects.
In the recent past, the Institute of Medicine’s (IOM’s) Forum on Microbial Threats has convened several workshops focused on pandemic disease emergence, spread, and response. The first followed the emergence of severe acute respiratory syndrome (SARS) in 2003 (IOM, 2004); others considered the potential global threat posed by H5N1 influenza virus (IOM, 2004, 2005, 2007a,b) and the dynamics of infectious disease transmission in a highly interconnected world (IOM, 2010). Within months of its declaration as the first pandemic of the twenty-first century, the Forum convened a 2-day public workshop, on September 15th and 16th, 2009, to discuss the domestic and international impacts of, and responses to, the 2009-H1N1 influenza A pandemic. Through invited presentations and discussions, participants explored the origins, evolution, and epidemiology of the 2009-H1N1 influenza A virus; potential lessons learned from 2009-H1N1 influenza A infection patterns in the Southern Hemisphere; the role of disease detection, surveillance, and reporting in mapping and anticipating disease spread and evaluating the effects of mitigation measures; progress toward and prospects for vaccine and drug development and availability; considerations
for the use of nonpharmaceutical interventions to reduce 2009-H1N1 influenza A transmission; and the global public health responses to the pandemic as it continues to unfold.
Organization of the Workshop Summary
This workshop summary was prepared by the rapporteurs for the Forum’s members and includes a collection of individually authored papers and commentary. Sections of the workshop summary not specifically attributed to an individual reflect the views of the rapporteurs and not those of the Forum on Microbial Threats, its sponsors, or the IOM. The contents of the unattributed sections are based on the presentations and discussions at the workshop.
The workshop summary is organized into sections as a topic-by-topic description of the presentations and discussions that took place at the workshop. Its purpose is to present lessons from relevant experience, to delineate a range of pivotal issues and their respective problems, and to offer potential responses as discussed and described by the workshop participants. Manuscripts and reprinted articles, submitted by some but not all of the workshop’s participants, may be found in Appendixes A1 through A14.
Although this workshop summary provides an account of the individual presentations, it also reflects an important aspect of the Forum’s philosophy. The workshop functions as a dialogue among representatives from different sectors of the infectious disease communities and allows them to present their beliefs about which areas may merit further attention. These proceedings summarize only the statements of participants in the workshop and are not intended to be an exhaustive exploration of the subject matter or represent the findings, conclusions, or recommendations of a consensus committee process.
2009-H1N1 Influenza A in Context
This workshop took place amid broad-based, global efforts to characterize the 2009-H1N1 influenza A virus, determine its evolutionary origins, and evaluate its potential public health and socioeconomic consequences, while monitoring and mitigating the impact of a fast-moving pandemic. The presentations summarized in this report, and the original contributions by the speakers collected in Appendix A, offer a snapshot of these activities taken in the late summer of 2009, as the Northern Hemisphere’s flu season approached and as the United States prepared to undertake a campaign of mass immunization against 2009-H1N1 influenza A.
What Is Influenza?
The influenza viruses are members of the family Orthomyxoviridae and include influenza virus types A, B, and C (see Box WO-1). Influenza is typically
transmitted from infected mammals through the air by coughs or sneezes, creating aerosols containing the virus, and from infected birds through their droppings. Influenza can also be transmitted by saliva, nasal secretions, and feces. Infections occur through contact with these bodily fluids or with contaminated surfaces. Influenza viruses can remain infectious for about one week at human body temperature, for more than 30 days at 0°C (32°F), and indefinitely at very low temperatures (such as lakes in northeast Siberia). They can be inactivated easily by disinfectants and detergents.
Box WO-1 provides a general overview of influenza virus classification, structure, and life cycle. For a complete overview on this topic and an extensive reference list please see Treanor (2010).
The scientific and public health response to the 2009-H1N1 influenza A pandemic was both informed and influenced by observations of past pandemics and seasonal influenza epidemics, by the response to an abortive pandemic threat from H1N1 swine influenza in 1976, and from ongoing efforts to address the pandemic threat posed by the highly pathogenic H5N1 avian influenza, following its emergence in humans in 1997. In this section, we review these events in order to establish the 2009-H1N1 influenza A pandemic within a historic and scientific context.
Ten apparent influenza pandemics, five of which occurred during the nineteenth century, have been recorded over the past 300 years. The three twentieth-century pandemics—presented in Table WO-1—which began in 1918, 1957, and 1968, respectively, are known to have been caused by three different antigenic subtypes3 of the influenza A virus, denoted H1N1, H2N2, and H3N2 in order of their emergence (Morens et al., 2009). While these pandemics varied widely in terms of their geographic origins and epidemiological characteristics, all gave warnings of their arrival, featured significant increases in mortality among younger age groups (a phenomenon known as “pandemic age shift”), and continued to cause morbidity and mortality months to years beyond their peaks (Simonsen et al., 2005) as will be discussed in greater detail, below.
1918–1919: “Mother of All Pandemics”
Beginning in the spring of 1918, the H1N1 influenza virus that infected approximately one-third of the world’s population was exceptionally virulent (IOM, 2005; Taubenberger and Morens, 2006). It caused an estimated 50–100 million deaths, with a case-fatality rate of greater than 2.5 percent (compared with less
than 0.1 percent for other pandemic strains). As Morens et al. (2009) point out, all influenza pandemics since that time, and indeed most cases of influenza A worldwide (other than human infections from avian viruses such as H5N1 and H7N7), have been caused by descendants of the 1918 virus, as illustrated in Figure WO-2. These include the H2N2 (1957) and H3N2 (1968) viruses, which possessed key genes from the 1918 virus along with additional avian influenza genes. Hence, the 1918 H1N1 virus is truly the “mother” of all influenza pandemics.
In the spring of 1918, a “herald wave” of relatively mild influenza cases occurred in New York City. That fall, a second wave of severe disease (and in many places, a subsequent wave in early 1919) produced significantly higher rates of mortality among people between the ages of 20 and 34, and particularly among pregnant women, than is typical of seasonal influenza epidemics (Simonsen et al., 2005). Two conditions tended to occur (both individually and in combination) in these fatal H1N1 cases: bronchopneumonia, likely caused by a secondary bacterial infection, and severe acute respiratory distress, often leading to cyanosis (CIDRAP, 2009).
Despite its depiction as the “Spanish flu,”4 the geographic origin of the 1918 H1N1 strain of the influenza virus remains a mystery (CIDRAP, 2009). It is likely that the virus, which had previously infected birds, emerged as a human pathogen in the Midwestern United States and accompanied American troops to Europe during World War I. Some investigators believe that the avian virus jumped into swine at approximately the same time it began to infect humans (Morens et al., 2009; Zimmer and Burke, 2009). Others contend, based on viral phylogeny, that genetic components of the 1918 pandemic strain circulated among swine and humans as early as 1911, which in turn suggests that the pandemic virus was generated by reassortment over a period of years and not introduced directly from birds into humans (Smith et al., 2009). Swine are believed to act as a “mixing vessel” for the reassortment of avian and human viruses (Salomon and Webster, 2009). As noted earlier, such events in doubly infected pigs generated the 1957 and 1968 pandemic influenza strains.
1957: A Model for 2009?
Between 1957 and 1958, an estimated 25 percent of the U.S. population was infected with pandemic H2N2 influenza, resulting in nearly 70,000 fatalities out of an estimated 1 million deaths worldwide (CIDRAP, 2009; Henderson et
|
BOX WO-1 The Influenza Life Cyclea The Orthomyxoviridae are a family of single-stranded RNA viruses that includes five genera: Influenza virus A, Influenza virus B, Influenza virus C, Isavirus, and Thogotovirus. A sixth has recently been described (Presti et al., 2009). The first genus contains viruses that cause influenza in vertebrates, including birds, humans, and other mammals. Influenza B and C viruses circulate in humans. Isaviruses infect salmon; thogotoviruses infect both vertebrates and invertebrates such as ticks (Ely, 1999; Jones and Nuttall, 1989; Raynard et al., 2001). Viral Replication Viruses can only replicate in living cells. Influenza infection and replication is a multistep process: the virus must first bind to and enter the cell, then deliver its genome to a site where it can produce new copies of viral proteins and RNA, assemble these components into new viral particles, and finally exit the host cell. Influenza viruses infect epithelial cells of the respiratory tract by attaching to sialic acid receptors. The virus particle contains a genome consisting of eight single stranded, negative sense RNA genes surrounded by viral proteins and a host-derived lipid membrane. The surface of the virus particle contains spikes of hemagglutinin (HA) that are responsible for attachment of virions to the cell surface. The HA binds to sialic acid receptors located at the tip of glycan chains conjugated to host cell membrane proteins and lipids (stage 1 in Figure WO-1)—typically in the nose, throat, and lungs of mammals and in the intestines of birds. Multivalent binding of the virus particle to the cell triggers uptake by endocytosis and subsequent fusion of the viral envelope to the endosome membrane, delivering the genome into the host cell cytoplasm. Once inside the cell, the acidic conditions in the endosome cause two events to happen: first part of the HA protein fuses the viral envelope with the vacuole’s membrane, then the M2 ion channel allows protons to move through the viral envelope and acidify the core of the virus, which causes the core to disassemble and release the viral RNA and core proteins. The viral RNA (vRNA) molecules, accessory proteins, and RNA-dependent RNA polymerase are then released into the cytoplasm (stage 2). The M2 ion channel is blocked by amantadine drugs, preventing infection. These core proteins and vRNA form a complex that is transported into the cell nucleus, where the RNA-dependent RNA polymerase begins transcribing complementary positive-sense vRNA (stages 3a and 3b). The vRNA is either exported into the cytoplasm and translated (stage 4) or remains in the nucleus. Newly synthesised viral proteins are either secreted through the Golgi apparatus onto the cell surface (in the case of neuraminidase and hemagglutinin, stage 5b) or transported back into the nucleus to bind vRNA and form new viral genome particles (stage 5a). Other viral proteins have multiple actions in the host cell, |
|
including degrading cellular mRNA and using the released nucleotides for vRNA synthesis and also inhibiting translation of host cell mRNAs. Negative-sense vRNAs that form the genomes of future viruses, RNA-dependent RNA polymerase, and other viral proteins are assembled into a virion. HA and neuraminidase molecules cluster into a bulge in the cell membrane. The vRNA and viral core proteins leave the nucleus and enter this membrane protrusion (stage 6). The mature virus buds off from the cell in a sphere of host phospholipid membrane, acquiring HA and neuraminidase with this membrane coat (stage 7). As before, the viruses adhere to the cell through hemagglutinin; the mature viruses detach once their neuraminidase has cleaved sialic acid residues from the host cell. Drugs that inhibit neuraminidase, such as oseltamivir, therefore prevent the release of new infectious viruses and halt viral replication. After the release of new influenza viruses, the host cell dies (Figure WO-1). 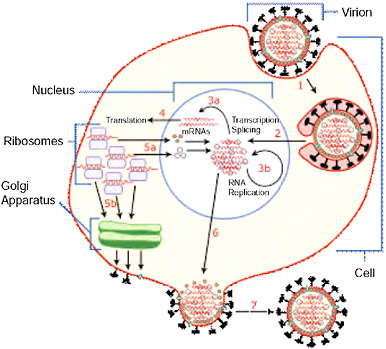 FIGURE WO-1 Host cell invasion and replication by the influenza virus. The steps in this process are discussed in the text. SOURCE: Wikipedia (2007 [figure], 2009 [text]). |
TABLE WO-1 Mortality Associated with Influenza Pandemics and Selected Seasonal Epidemic Events, 1918-2009a
al., 2009). Once again, influenza morbidity and mortality were skewed toward younger people (ages 5 to 35) compared with nonpandemic years. The first U.S. cases of what became known as the “Asian flu,” reported in June 1957, followed outbreaks on military bases in Korea and Japan in April and May of that year (Henderson et al., 2009). Throughout the summer of 1957, outbreaks of mild illness occurred throughout the United States in conference centers, summer camps, migrant workers’ barracks, and other such institutional settings. Although these local outbreaks were characterized by attack rates that in some cases exceeded 50 percent, little community-wide transmission appeared until schools reopened in the Fall.
Beginning in mid-September, an epidemic wave of influenza swept U.S. communities (Henderson et al., 2009). Vaccine (which was no more than 60 percent effective against the virus) became available in limited supply in October, but
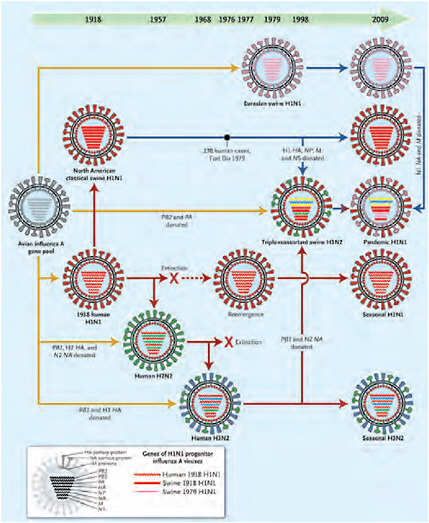
FIGURE WO-2 Genetic relationships among human and relevant swine influenza viruses, 1918–2009. Yellow arrows reflect exportation of one or more genes from the avian influenza A virus gene pool. The dashed red arrow indicates a period without circulation. Solid red arrows indicate the evolutionary paths of human influenza virus lineages; solid blue arrows, of swine influenza virus lineages; and the blue-to-red arrow, of a swine-origin human influenza virus. All influenza A viruses contain eight genes that encode the following proteins (shown from top to bottom within each virus): polymerase PB2, polymerase PB1, polymerase PA, hemagglutinin (HA), nuclear protein (NP), neuraminidase (NA), matrix proteins (M), and nonstructural proteins (NS). The genes of the 1918 human and swine H1N1 and the 1979 H1N1 influenza A viruses were all recently descended from avian influenza A genes, and some have been “donated” to the pandemic human H1N1 strain.
SOURCE: Reprinted with permission from Morens et al. (2009). Copyright © 2009 Massachusetts Medical Society. All rights reserved.
it was too little, too late to slow the progression of the epidemic across the United States. By mid-November, numbers of new cases and deaths from influenza and pneumonia had leveled off and begun to decline. Following a return to normal levels in December, a second wave of excess mortality due to respiratory illness began in January 1958 and peaked the following month.
Henderson et al. (2009) note several similarities in epidemiologic behavior between the 1957 H2N2 pandemic and the 2009 H1N1 pandemic: both arose early in the year and spread widely during the spring, both abated over the early summer months in the Northern Hemisphere while major epidemics developed in the Southern Hemisphere (as is also typical of seasonal influenza), and both (to date) were marked by relatively mild illness with low case-fatality rates.
1968 (United States) and 1969 (Europe)
Pandemic H3N2 emerged in Hong Kong in 1968 and spread rapidly across the globe. During the winter of 1968-1969, the virus caused an estimated 40,000 deaths in the United States, but in Europe, it inexplicably smoldered until the following winter before causing significant morbidity and mortality (Simonsen et al., 2005). That this pandemic was the least deadly of the three twentieth-century pandemics may be due to the fact that only the H antigen in H3N2 had “shifted” with respect to the previous pandemic H2N2 strain. In people born before 1891, the presence of H3 antibodies may have also afforded this otherwise vulnerable population some degree of protective immunity against the H3N2 influenza A virus. In the United States, people between the ages of 45 to 64 were shown to have a threefold higher risk of death from pandemic H3N2 than from epidemic influenza during the years prior to and following the pandemic (Simonsen et al., 2005).
1976 Swine Flu: The Pandemic that Wasn’t
Early in 1976, an outbreak of swine-origin influenza among military personnel at Fort Dix, New Jersey, resulted in 13 confirmed cases, including one death (CIDRAP, 2009). Serologic studies suggested that more than 200 soldiers had been infected with an H1N1 virus and that person-to-person transmission had occurred (Sencer and Millar, 2006). The outbreak, however, never spread beyond Fort Dix. Its origin remains unknown (CIDRAP, 2009). The major events in the swine flu vaccination campaign, adapted from Neustadt and Feinberg (1978), are presented in Box WO-2.
Similarities between the 1976 H1N1 virus and the 1918 H1N1 pandemic strain prompted concern that a similarly devastating pandemic was imminent, recalled keynote speaker David Sencer, who in 1976 was the director of the Centers for Disease Control (CDC). He reviewed the process by which the decision was made to start a mass vaccination program to protect the American public from
|
BOX WO-2 The 1976 Swine Flu Campaign: Chronology of Major Events 1976
1977
SOURCE: Adapted with permission from Neustadt and Fineberg (1978). |
this apparent threat, and then—amid political wrangling and media scrutiny—to suspend that program less than three months later in order to investigate a possible serious side-effect of the vaccine (see Sencer and Millar in Appendix A11). Sencer said that the intention of his remarks was to highlight “what went right” in this series of events that is often referred to as a “fiasco” or “debacle” (Neustadt and Fineberg, 1978).
Within days of the identification of the 1918-like H1N1 virus from Fort Dix, representatives from the military, the National Institutes of Health, the Food and Drug Administration (FDA), and the New Jersey Department of Health met to determine a plan of action, which included heightened disease surveillance in and around Fort Dix, determining whether infected individuals had prior contact with pigs (which turned out to be negative), and serologic testing of recruits to determine viral spread at Fort Dix (Sencer and Millar, 2006). While the virus had spread from person to person among more than 200 military recruits on the base, no additional cases of swine flu were ever detected in the community surrounding Fort Dix. These findings were reviewed by the Advisory Committee on Immunization Practices (ACIP) of the U.S. Public Health Service, which concluded that the new virus had pandemic potential and that an immunization program should be launched in order to reduce the morbidity and mortality associated with a possible influenza pandemic.
After considering several alternative responses to these recommendations, Sencer, in his capacity as director of the CDC, proposed that private pharmaceutical companies under contract to the federal government should produce enough vaccine to immunize the entire U.S. population against H1N1, and that immunization should proceed as quickly as possible through federally funded programs organized and conducted by state health departments (Sencer and Millar, 2006). Federal legislation5 to this effect was quickly passed and vaccine production and testing began. Progress toward mass immunization was temporarily stalled when the vaccine manufacturers demanded indemnification against claims of any adverse reactions associated with the vaccines. After the federal government acceded to this demand, more than sufficient vaccine was produced to immunize more than 40 million people within 10 weeks, beginning on October 1, 1976.
After cases of Guillain-Barré Syndrome (GBS)—an extremely rare disorder in which the body’s immune system attacks part of the peripheral nervous system—were diagnosed in some recipients shortly after vaccination with the swine flu vaccine, anxiety arose about whether the vaccine was causally associated with this rare disorder. On December 16, federal officials suspended all immunizations in order to investigate this possibility. This action essentially ended the swine flu immunization program. According to Sencer, despite the controversy it engendered, this program achieved success in several areas, most notably surveillance for disease transmission and adverse events associated with the vaccine, as well as the rapid and effective implementation of mass immunization on an unprecedented scale.
|
5 |
National Influenza Program (P.L. 94-380): An act to amend the Public Health Service Act to authorize the establishment and implementation of an emergency national swine flu immunization program and to provide an exclusive remedy for personal injury or death arising out of the manufacture, distribution, or administration of the swine flu vaccine under such program. For more information, see http://thomas.loc.gov/cgi-bin/bdquery/z?d094:SN03735:@@@L&summ2=m& (accessed November 5, 2009). |
Events surrounding the 1976 outbreak offer lessons to policy makers as they address the current “swine flu” pandemic, Sencer observed. First and foremost, he advised, one must “expect the unexpected” (the failure of a pandemic to arise despite transmission of a virus with pandemic potential, or the appearance of “excess” cases of a rare disorder associated with immunization, for example) and prepare in advance to cope with surprises. Second, he noted that effective communication of health policies by medical experts prevents the appearance that these policies are driven by politics rather than science. Finally, he said, “when lives are at stake, it is better to err on the side of overreaction than underreaction. Because of the unpredictability of influenza, responsible public health leaders must be willing to take risks on behalf of the public. This requires personal courage and a reasonable amount of understanding by the politicians to whom these public health leaders are accountable.”
All policy decisions entail risks and benefits to decision makers, as well as to those directly affected by the decision, Sencer added. “In 1976, the federal government wisely opted to put protection of the public first,” he concluded, ”just as the current [a]dministration is doing and doing exceedingly well.”6
H5N1: A Persistent Pandemic Threat
Sometime prior to 1997, the H5N1 strain of avian influenza (bird flu) virus began circulating in poultry in parts of Asia (Pandemic Plan, 2005). In the first documented instance of human infection, the virus caused 18 cases and 6 deaths in Hong Kong in 1997. The outbreak in humans coincided with outbreaks of highly pathogenic H5N1 in poultry on farms and in live markets (Pandemic Plan, 2005). Because of the potential for further poultry-to-human spread of H5N1 viruses in the poultry markets, the Hong Kong government enlisted government employees from several agencies to assist in the Hong Kong-wide slaughter of chickens and other fowl. This 4-day effort, beginning on December 29, resulted in the slaughter of 1.5 million chickens and several hundred thousand other domestic fowl (Bridges et al., 2002). Many experts believe that the destruction of the Hong Kong Special Administrative Region’s entire poultry population of 1.5 million birds averted a pandemic by immediately removing opportunities for further human exposure (WHO, 2005b). Following the poultry eradication campaign in Hong Kong, the H5N1 influenza virus did not reappear until the end of 2003 (WHO, 2005b).
In early 2004, millions of birds died as the highly pathogenic H5N1 avian influenza (HPAI) spread rapidly across Asia (Pandemic Plan, 2005; WHO, 2005b). Massive culling of birds occurred in Thailand and Vietnam following the deaths of 23 of 34 patients, respectively, with confirmed H5N1 infections (Pandemic Plan, 2005; WHO, 2005b).
Near the end of January, the situation in poultry exploded. Outbreaks in the Republic of Korea, Vietnam, Japan, and Thailand were followed by reports in Cambodia, Lao People’s Democratic Republic, Indonesia, and China.
The H5N1 outbreaks in poultry were historically unprecedented. Previously, Highly Pathogenic Avian Influenza (HPAI) was considered a rare disease. Never before had HPAI spread so widely and rapidly to cause outbreaks in so many countries at once. Within three months, more than 120 million birds died or were destroyed. (Pandemic Plan, 2005)
Responding to the threat presented by this newly emerged and highly pathogenic virus, public health agencies at all levels began preparations for a pandemic that has yet to materialize (IOM, 2005, 2007a,b). Although human-to-human transmission of H5N1 has apparently occurred in a few cases, the vast majority of human infections have come from contact with infected poultry.7
The current H5N1 virus tends to bind deep inside mammalian lung tissues, as compared with seasonal influenza viruses, which attach to nasal and pharyngeal tissues, and from which they are more easily spread by coughs and sneezes (Shinya et al., 2006; van Riel et al., 2006). However, with time—particularly given the establishment of the virus in Asia—H5N1 may evolve more efficient transmission among humans and other mammalian hosts, or it may reassort with highly transmissible influenza A viruses, such as the current H1N1 pandemic strain.
2009-H1N1 Influenza A: A Predictable Surprise
Preparations for the emergence of a human pandemic strain of H5N1 influenza led to the detection of the first U.S. cases of 2009-H1N1 influenza A, according to Nancy Cox of the CDC. One of two initial U.S. cases of 2009-H1N1 influenza A, which occurred in children in southern California, was discovered in a trial of an investigational diagnostic tool that had been developed to detect the H5N1 influenza A virus; the other human case was identified from a sample collected as part of an influenza surveillance project (CDC, 2009e). “We were really focusing on the emergence of H5N1,” Cox explained, “so the device was calibrated to detect influenza A-positive samples and to determine if they were H3, H1, or H5. This particular sample from the first case was negative for H3, H1, and H5 but positive for influenza A, so the San Diego public health officials were notified,” she explained.
The first specimen was sent to a reference laboratory in the state health department of Wisconsin, where researchers were unable to determine the viral subtype using the latest polymerase chain reaction (PCR)-based influenza assay
developed by the CDC. Based on preliminary genetic characterization, CDC scientists identified the strain as a novel H1N1 swine triple-reassortant virus (CDC, 2009e). However, Cox continued, the PCR results and the lack of apparent contact between the patient and pigs led the CDC investigators to suspect that this virus was “something different,” so they quickly sequenced the complete viral genome and reported their findings to the WHO. Soon thereafter, the CDC learned of the second patient and confirmed the involvement of the novel H1N1 virus strain in this case as well.
At the same time—mid-April 2009—a similar series of events, as described by speaker Guillermo Ruiz-Palacios of the National Institute of Medical Sciences and Nutrition in Mexico City, occurred in Mexico (see also CDC, 2009f). The first two cases of 2009-H1N1 influenza A to be discovered in Mexico were, at first, thought to be SARS, he said. When investigators in Mexico City failed to identify the SARS coronavirus or any other pathogen capable of inducing severe respiratory distress, samples were sent simultaneously to the CDC in Atlanta and to Health Canada in Winnipeg for further testing. The Canadian laboratory received and tested the samples first, and determined that a swine influenza virus was the cause of illness in the Mexican index cases. On April 23, the Mexican, Canadian, and American investigators all realized that they were characterizing the same H1N1 influenza A virus. The number of 2009-H1N1 influenza A cases mounted in Mexico and the United States as the virus quickly spread globally. On June 11, 2009, the WHO raised the worldwide pandemic alert level to Phase 6 in response to the sustained global proliferation of the novel influenza A (H1N1) virus.
In a world poised to prevent a devastating H5N1 avian influenza pandemic originating out of Asia, the appearance of an influenza pandemic in the form of a relatively mild (to date) swine-origin virus originating (apparently) in the Americas was a surprise. The rapid spread of the 2009-H1N1 influenza A virus has only underscored the reality that international travel and commerce has provided an efficient link to the rest of the world for the spread of emerging infectious diseases—a reality confirmed in a recently published communication in the New England Journal of Medicine (Khan et al., 2009). Today, international travel and commerce (most notably the explosive growth of commercial air transportation over the past 50 years) drives the rapid, global distribution of microbial pathogens and the organisms that harbor them (Gubler, 1998; IOM, 2003). International air-traffic patterns,8 as illustrated in Figure WO-3, provided a sensitive predictor of H1N1 importation and yet another example of the ability of contemporary travelers to move between most places in the world in less time than the incubation period for many infectious diseases (Wilson, 2003).
The 2009-H1N1 influenza A pandemic also underscores the role of the animal–human interface as a factor in infectious disease emergence, spread, and
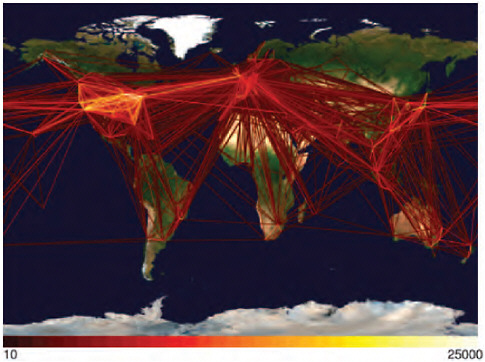
FIGURE WO-3 The rate of globalization has accelerated to the point where we are connected as never before via globalized travel and trade networks.
SOURCE: Reprinted with permission from Hufnagel et al. (2004).
establishment (IOM, 2003, 2010). This too was anticipated. Having documented a rapid increase in the phylogenetic and antigenic diversity of circulating swine influenza strains in the United States, Webby and coauthors (2004) presciently warned that “the growing complexity of influenza at this animal–human interface and the presence of viruses with a seemingly high affinity for reassortment makes the United States swine population an increasingly important reservoir of viruses with human pandemic potential” (Webby et al., 2004).
Their concern was shared by the CDC, according to Cox, who noted that participants in a CDC-sponsored meeting of the Council of State and Territorial Epidemiologists on influenza at the animal–human interface held in early April 2009—before all but a very few epidemiologists were aware of 2009-H1N1 influenza A—had identified a series of goals to address what was to them a theoretical risk. These goals included:
-
the speedier identification of novel influenza A virus (IAV) infections in humans;
-
assessment of risk for the potential for human-to-human transmission of novel IAVs;
-
identifying risk groups for severe disease;
-
the development and global distribution of diagnostic reagents capable of identifying novel IAV infections; and
-
the development of vaccine strain candidates of novel IAVs with pandemic potential.
“Little did we know that later on in that very month we would be exercising all of these goals very actively,” Cox recalled.
As Cox and several other participants in the September workshop observed, had the global public and animal health communities recognized the diversity of influenza viruses present in the world’s swine populations as a zoonotic threat worthy of surveillance, the emergence of 2009-H1N1 influenza A may have been anticipated and recognized at an even earlier stage of the disease’s emergence out of Mexico (see also discussion in a subsequent section, “The Scientific Response”). However, as speaker Kennedy Shortridge of the University of Hong Kong observed, the global response to the new virus has been swift. “It’s something that wouldn’t have been possible 15 years ago,” he added, “so we’ve come a long way.”
Many speakers and discussants also noted that this relatively mild pandemic, identified prior to its global spread by researchers poised to respond to the potential threat from the highly pathogenic H5N1 avian influenza virus, presents significant opportunities to improve influenza surveillance and monitoring, refine epidemiologic models, and enhance pandemic preparations in anticipation of the next “killer flu.”
Situation Assessment and Future Challenges
In late June 2009, President Obama requested that his Council of Advisors on Science and Technology (PCAST) undertake an evaluation of the 2009-H1N1 influenza A pandemic and the nation’s response to a probable recurrence in the fall of 2009. Their report, issued in early August, examines and critiques the emerging federal response to a second wave and suggests additional opportunities for mitigation (PCAST, 2009). A similar process occurred at this workshop, as participants assessed the 2009-H1N1 influenza A pandemic to date and anticipated an H1N1 influenza A resurgence in the Northern Hemisphere during the Fall influenza season.
In his keynote address to the workshop, Keiji Fukuda of the World Health Organization (WHO) noted several successes of the global response to the 2009-H1N1 influenza A pandemic, including:
-
early detection and reporting of the novel virus;
-
early and ongoing scientific investigations;
-
functional global communications among countries and organizations;
-
wide sharing of viruses, genetic sequences, and related information;
-
provision of assistance and guidance;
-
on-time development and production of a pandemic vaccine;
-
increased access to antiviral drugs; and
-
modest enactment of trade and travel restrictions.
According to Fukuda, however, the 2009-H1N1 influenza A pandemic also highlighted and underscored the “tremendous disparities worldwide in terms of understanding, capacities, resources, and socioeconomic impact.”
Among the many ongoing challenges associated with 2009-H1N1 influenza A, Fukuda identified two as particularly daunting: the need for clear messages in an increasingly complex and fast-changing communications environment, and the need to provide equitable access to resources to address this and other emerging pandemics. Nevertheless, it appears that the world has been spared for the moment from the “worst-case scenario” in as much as the morbidity and mortality associated with infection by the 2009-H1N1 influenza A virus to date has been mild to moderate for most people, and the pandemic arose in a highly developed region of the world where sophisticated systems were already in place and viruses, information, and assistance were freely shared. “We [were] extremely lucky in a number of respects,” he concluded. “I don’t think this is the kind of situation that we can count on in the future.” Moreover, he went on to say that counting on such aspects of the current scenario as the basis for future planning would be a strategic mistake.
Characterizing the Virus
Cox reported that the CDC quickly generated an unprecedented amount of gene sequence data for the 2009-H1N1 influenza A virus—over 1,700 genes from more than 430 virus isolates obtained from 360 cases—in addition to multiple isolates from some cases of special interest. At the time of the workshop 70 entire viral genomes had been sequenced, she said, and many more gene sequences and total viral genomes have been contributed by laboratories globally. “I think we can really thank all of the public health labs and all of the hospitals and all of those who worked together so seamlessly to put this information into the public domain,” she said.
These sequences, and subsequent initial experiments toward vaccine development, revealed a number of key characteristics of the 2009-H1N1 influenza A virus, summarized by Cox below:
-
Its combination of gene segments had not been reported previously.
-
It is a product of reassortment between European swine and North American swine lineage triple reassortant influenza A viruses, which likely occurred through a process of two or more steps.
-
No genetic markers for severe disease were detected.
-
The collection of viral sequences was genetically and antigenically homogeneous, suggesting a single source introduction in humans; this simplified selection of a representative vaccine virus.
-
Passage in eggs at limit dilution9 and growth in tissue culture can select for viruses with altered antigenic properties.
-
Unlike seasonal H1N1 viruses, 2009-H1N1 influenza A viruses grow to high titer without adaptation in the lungs of mice, ferrets, and macaques.
-
It retains alpha-2,3 receptor binding properties that may allow it to replicate better in the human upper respiratory tract.
-
It is resistant to amantadine and rimantadine; sporadic cases of resistance to oseltamivir have also been detected globally, mostly in association with pre-exposure prophylaxis.
Origins of the 2009-H1N1 Influenza A Genome
Viral isolates from index cases of 2009-H1N1 influenza A were characterized as “swine-origin” influenza on the basis of genomic analysis, which revealed their similarity to previously characterized swine influenza viruses (CDC, 2009e). In his workshop presentation speaker Michael Worobey of the University of Arizona described the further use of genomics to trace the evolution of the 2009-H1N1 influenza A virus and estimate the time of its emergence in humans (Smith et al., 2009). Taking advantage of steady rates of molecular evolution—that is, mutation rates revealed by sequence comparisons—typical of viruses in general and influenza viruses in particular, Worobey and coworkers compared the sequences of multiple 2009-H1N1 influenza A viral isolates, obtained between March and May 2009, with each other and with those of swine influenza viruses, using a technique called Bayesian molecular clock analysis. This enabled them to reconstruct the series of reassortment events that produced 2009-H1N1 influenza A, as illustrated in Figure WO-4.
When applied separately to each of the eight genes10 that comprise the influenza A virus genome, this analysis revealed a combination of segments derived from two swine influenza lineages: the classical “triple-reassortant” H1N1 virus that has long circulated in Eurasia and North America, and a more recent “avian-like” Eurasian version of H1N1 virus that jumped from birds to pigs prior to 1979. Additional “molecular clock” calculations suggest that the progenitor of the 2009-H1N1 influenza A virus has been circulating in pigs for a decade or so and that the virus began to infect humans near the end of 2008, Worobey stated. Another speaker, Eddie Holmes of Pennsylvania State University, estimated that
|
9 |
A method of obtaining a pure culture of bacteria or viruses by subculturing from the highest dilution in which the organism is demonstrably present (http://medical-dictionary.thefreedictionary.com/limit+dilution, accessed November 5, 2009). |
|
10 |
All influenza A viruses contain eight genes that encode for the following proteins: polymerase PB2, polymerase PB1, polymerase PA, hemagglutinin (HA), nuclear protein (NP), neuraminidase (NA), matrix proteins (M), and nonstructural proteins (NS) (Morens et al., 2009). |
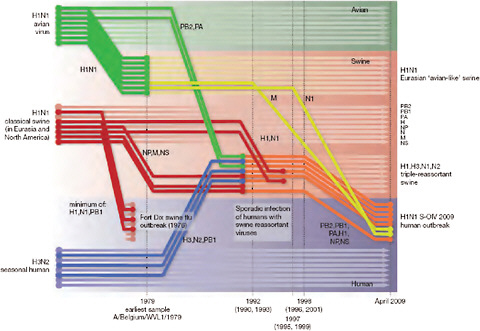
FIGURE WO-4 Reconstruction of the sequence of reassortment events leading up to the emergence of S-OIV. Shaded boxes represent host species; avian (green), swine (red), and human (grey). Colored lines represent interspecies-transmission pathways of influenza genes. The eight genomic segments are represented as parallel lines in descending order of size. Dates marked with dashed vertical lines on “elbows” indicate the mean time of divergence of the S-OIV genes from corresponding virus lineages. Reassortment events not involved with the emergence of human disease are omitted. Fort Dix refers to the last major outbreak of S-OIV in humans. The first triple-reassortant swine viruses were detected in 1998, but to improve clarity the origin of this lineage is placed earlier.
SOURCE: Reprinted from Smith et al. (2009) with permission from Nature Publishing Group.
2009-H1N1 influenza A emerged between late December 2008 and February 2009 based on genetic diversity in viral isolates collected worldwide between April and June 2009. Worobey noted that, upon making the transition to infecting humans, the viral “molecular clock” appeared to run significantly faster—though consistently so—than it had done in swine. This apparent acceleration in evolution rate in the new host could be driven by adaptation or permitted by relaxed selection for amino acid changes, Worobey said, adding that it might also be a transient condition or an artifact of the short period over which they had sampled for 2009-H1N1 influenza A viral evolution.
Worobey characterized the decade-long gap between the emergence of the precursor of the 2009-H1N1 influenza A virus in pigs and its subsequent jump
to humans as a period of “unsampled diversity” in swine influenza viruses. Cox agreed and added that “the precise nature of the evolution and origin of the 2009 H1N1 viruses are unlikely to be well defined due to lack of influenza surveillance in swine and other susceptible mammalian hosts.”
Ongoing Evolution of 2009-H1N1 Influenza A
Having considered the evolutionary origins of the 2009-H1N1 influenza A virus, discussion turned to this virus’s evolutionary present and future. Presenter Eddie Holmes of Pennsylvania State University established a context for this topic by describing current knowledge on the evolution of seasonal influenza A viruses. Although most such research has focused on changes in the hemagglutinin (HA) protein, crucial both for its function and as the main component in seasonal influenza vaccine (Smith et al., 2004), attention has more recently turned to mutations occurring throughout the viral genome. Holmes and coworkers investigated the diversity of influenza A viral lineages within a restricted sampling area—New York State—between 1997 and 2005 (Nelson et al., 2007, 2008). There they found evidence that multiple flu strains were being introduced into the region each season, imported from a distant “mixing pot” of influenza viral strains. Research by others suggests that this global influenza reservoir is located in East and Southeast Asia (Russell et al., 2008).
As a result of this dynamic, each person carries millions of variant influenza viruses, and many are infected with completely different viral strains and even different influenza types (A and B), Holmes continued. Viral reassortments occur easily under these conditions. “Many people have discussed reassortment in terms of the various pandemic strains [and how they cross] species boundaries,” he said. “We saw that reassortment happens frequently within a particular subtype … there’s been lots of reassortment in the history of seasonal H1N1 viruses.”
Regarding the short evolutionary history of the 2009-H1N1 influenza A virus, which he and coworkers have gleaned from their analysis of 409 complete genome sequences from human isolates obtained worldwide between April and July 2009, Holmes made three general observations about the global pool of 2009-H1N1 influenza A viruses:
-
they currently have limited sequence diversity;
-
their populations consist of multiple lineages; and
-
local epidemics are characterized by founder effects.11
Although these investigators did not find evidence of reassortment events involving the 2009-H1N1 influenza A virus, Holmes speculated that they were likely to have occurred, but could not be detected, due to the large degree of sequence similarity among these isolates. Few of the mutational changes that have occurred to date within the 2009-H1N1 influenza A viral genome are likely to affect viral function. Rather, he said, they were probably finding transient deleterious mutations, “most of which will be defective and won’t get anywhere.” Holmes observed that “it’s very early days in this evolutionary process. We’re five, six months into this epidemic. We can see some diversity. The real interesting evolutionary things will happen when [2009-H1N1 influenza A] starts to compete in the Northern and Southern hemispheres with the seasonal strains that co-circulate.”
When asked how more representative collections of influenza strains might be obtained, Holmes recommended two complementary approaches. One is to choose a few locations and study them in detail, as he has done with the counties around New York City. The other is to obtain sequences from as many sites as possible, as has been attempted in comparisons of the HA antigens.
Pathology and Pathogenesis
While most human infections with 2009-H1N1 influenza A to date apparently have been mild, a significant number of cases have required hospitalization, and at least 16,713 deaths due to 2009-H1N1 influenza A had been reported to the WHO as of March 12, 2010 (WHO, 2010a). Investigations of fatal cases in the United States, described by speaker Sherif Zaki of the CDC, have provided valuable insights into the pathogenicity of 2009-H1N1 influenza A.
Of 137 fatal cases of suspected 2009-H1N1 influenza A occurring between April 29 and August 20, 2009, 77 were confirmed (about half by autopsy) by the CDC to have been caused by 2009-H1N1 influenza A, Zaki said. Other diagnoses in some of the suspect cases included leptospirosis, spotted-fever rickettsiosis, other bacterial infections, and sepsis. The median age of the 2009-H1N1 influenza A fatalities was 38 years (range 2 months to 84 years); the average duration of illness was 8 days (range 1 to 39 days). Underlying conditions—including extreme morbid obesity, hypertension, cardiovascular disease, pregnancy, and asthma—were associated with 90 percent of these patients.
Primary viral pneumonia is considered to be a major contributor—and in some cases the sole cause—of the many 2009-H1N1 influenza A deaths. However, Zaki noted, bacterial co-infections were present in about 30 percent of the fatal cases, most commonly involving Streptococcus pneumoniae which, he stressed, is in many cases a vaccine-preventable infection (Louie et al., 2009b). Pulmonary embolism was detected in about 15 percent of fatalities. While the significance of this finding is not clear, and may be related to acute respiratory distress syndrome (ARDS) or other co-morbid conditions, Zaki said he expects
this percentage to rise now that pathologists are looking specifically for this condition in suspected 2009-H1N1 influenza A cases.
Zaki reported that histopathological studies of respiratory tissues from autopsied patients revealed several features not typically seen in fatal cases of seasonal influenza. Viral load, as visualized with antigen-based immunohisto-chemistry, was strikingly high in fatal cases of 2009-H1N1 influenza A compared with seasonal influenza. In addition, 2009-H1N1 influenza A viruses were present in peripheral lung tissues as seen in H5N1 avian influenza but not typically with seasonal influenza viruses, which target the upper respiratory tract. Lung tissues infected with 2009-H1N1 influenza A showed evidence of diffuse alveolar damage, the physical manifestation of ARDS (Figure WO-5)—an acute lung injury with a 40 percent case fatality rate. “This looks like avian flu on steroids,” remarked Zaki, who added that recent studies suggest that 2009-H1N1 influenza A and H5N1 viruses bind to the same receptors in peripheral lung tissues (Childs et al., 2009; Soundararajan et al., 2009).
Similarly striking differences in pathogenesis between 2009-H1N1 influenza A and seasonal influenza have been observed in cellular and animal studies (Itoh
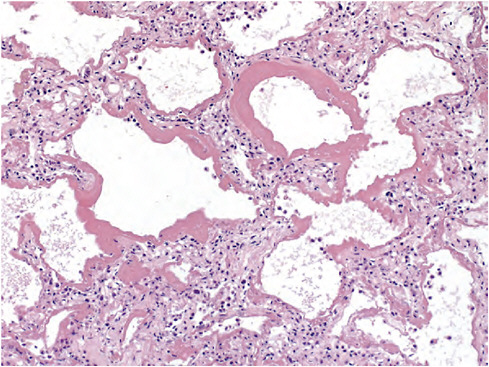
FIGURE WO-5 Lung tissues infected with 2009-H1N1 influenza A show evidence of diffuse alveolar damage, the physical manifestation of acute respiratory distress syndrome.
SOURCE: Zaki (CDC).
et al., 2009; Munster et al., 2009). To begin with, there is little physical resemblance between the spherical viral particles typical of seasonal H1N1 influenza and the filamentous 2009-H1N1 influenza A, as revealed by electronmicroscopy by speaker Yoshihiro Kawaoka, of the University of Wisconsin, and coworkers (Figure WO-6). The biological significance of these morphological differences is unknown (Itoh et al., 2009).
Kawaoka also described comparative studies of 2009-H1N1 influenza A and seasonal H1N1 infections in mice, ferrets, and macaques (nonhuman primates). All mice infected with 106 plaque-forming units (p.f.u.) of the index California isolate (CA04) of 2009-H1N1 influenza A died, while all those infected with the same concentration of 50 different variants of seasonal H1N1 viruses lost weight, but recovered. Only two of five 2009-H1N1 influenza A viral isolates (including CA04), however, were found to kill mice in this assay. All five 2009-H1N1 influenza A isolates were found to replicate well in both the trachea and the lung of the infected mice, while the seasonal H1N1 virus did not.
The researchers used a ferret model to compare 2009-H1N1 influenza A and seasonal H1N1 transmission. As illustrated in Figure WO-7, ferrets housed in separate cages, without direct or indirect contact, did not transmit the control virus, H5N1, but efficiently transmitted both seasonal H1N1 and 2009-H1N1 influenza A. Similar results were obtained by Munster et al. (2009) in a ferret pathogenesis model. These researchers also determined that while replication of seasonal H1N1 was confined to the nasal cavity of ferrets, 2009-H1N1 influenza
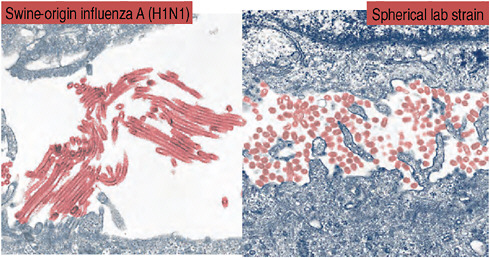
FIGURE WO-6 Spherical viral particles typical of seasonal H1N1 influenza, and the filamentous 2009-H1N1 influenza A.
SOURCE: Adapted from Neumann et al. (2009) with permission from Macmillan Publishers Ltd.
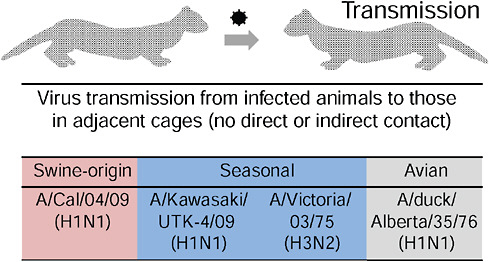
FIGURE WO-7 Virus transmission from infected ferrets to those in adjacent cages.
SOURCE: Kawaoka (2009).
A also replicated in the trachea, bronchi, and bronchioles. They also found that 2009-H1N1 influenza A was shed more profusely than was seasonal H1N1 from the ferret upper respiratory tract.
In cynomolgus macaques, Kawaoka and colleagues found that 2009-H1N1 influenza A replicated far more efficiently than did seasonal H1N1. As was also the case in mice and ferrets, the CA04 isolate of 2009-H1N1 influenza A appeared more damaging to lung tissue than the currently circulating seasonal H1N1 virus. While some macaques infected with seasonal H1N1 experienced mild lung lesions, the lungs of those infected with the 2009-H1N1 influenza A virus showed signs of severe disease, such as alveoli filled with fluid and inflammatory cells as illustrated in Figure WO-8.
“The ability of CA04 to replicate in the lungs of mice, ferrets and nonhuman primates, and to cause appreciable pathology in this organ, is reminiscent of infections with highly pathogenic H5N1 influenza viruses,” Kawaoka and coworkers observed (Itoh et al., 2009). “We therefore speculate that the high replicative ability of [2009-H1N1 influenza A] might contribute to a viral pneumonia characterized by diffuse alveolar damage that contributes to hospitalizations and fatal cases where no other underlying health issues exist.”
Potential Protections
CDC researchers measured the antibody response to the 2009-H1N1 influenza A resulting from previous influenza infection or vaccination in different age
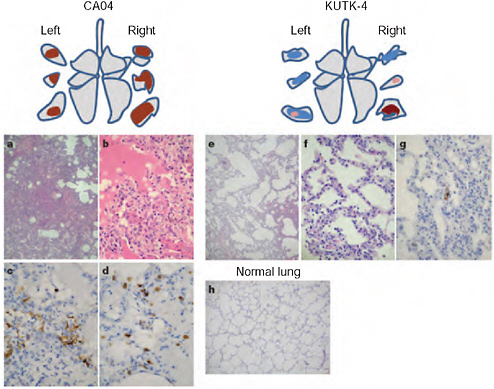
FIGURE WO-8 Pathological examination of the lungs of infected cynomolgus macaques. A-h, Representative of pathological images of CA04-infected (macaque no. 1, a-d), KUTK-4-infected (macaque no. 7, e-g) and mock-infected (h) lungs on day 3 after infection. One or two sections per lung lobe were examined. Representative findings are shown to depict the distribution of lesions in the sections (shown as cross-sections placed next to illustrations of each lung lobe), with or without viral antigen, as follows: brown, severe lung lesion containing moderate to many viral-antigen-positive cells; pink, mild lung lesions containing a few viral-antigen-positive cells; blue, lung lesions with alveolar wall thickening, with remaining air spaces unaffected. Original magnification: a, e, h, ×40; b-d, f, g, ×400.
SOURCE: Itoh et al. (2009).
groups in order to examine the possibility that humans might possess preexisting immunity to 2009-H1N1 influenza A and to evaluate the interaction of the virus with seasonal vaccine-induced antibodies (CDC, 2009d; Hancock et al., 2009). While only a very few people born after 1980 were found to have detectable cross-reactive antibodies against 2009-H1N1 influenza A, 34 percent of people born before 1950 had significant cross-reactive titers. Therefore, Cox said, “we postulate that the viruses that were circulating during the 1940s and early 1950s may have had cross-reactive epitopes on them,” a hypothesis that the CDC is
continuing to pursue. A workshop attendee, who had examined age-specific 2009-H1N1 influenza A fatality data from across the globe, found patterns to suggest that the residual immunity is to the pre-1957 strain of H1N1; he noted that a major antigenic shift occurred in the virus that year.
Kawaoka and coworkers also investigated cross-reactivity to 2009-H1N1 influenza A by examining two sets of sera, each representing a broad range of age groups: one collected before the emergence of 2009-H1N1 influenza A in 1999, and the other collected afterward, in April 2009 (Itoh et al., 2009). As illustrated in Figure WO-9, with few exceptions only individuals born before 1918 were shown to possess neutralizing antibodies against 2009-H1N1 influenza A. These investigators therefore concluded that only infection with the 1918 H1N1 virus—derivatives of which have been maintained in pigs in the years since the human
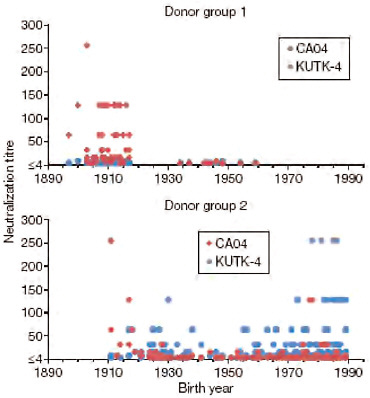
FIGURE WO-9 Neutralization activities in human sera against viruses. Human sera of donor groups 1 (collected in 1999) and 2 (collected in April and May of 2009) were subjected to neutralization assays with CA04 and KUTK-4. Because the sera of donor group 1 were collected in 1999, little neutralization activity was expected against KUTK-4, which was isolated in 2009.
SOURCE: Itoh et al. (2009).
pandemic, and from which seasonal human H1N1 strains have diverged—could provide immunoprotection against 2009-H1N1 influenza A.
Both groups obtained similar data but interpreted them differently, Cox suggested. However, she added, the next step would be to examine these laboratory data in conjunction with epidemiological data, to determine whether the cross-reactive antibodies are actually protective. “What we’ve seen, not only for the Spring cases in the Northern Hemisphere, but also for the influenza seasons that occurred in the Southern Hemisphere, is that those over 60 are relatively spared from this disease.” Outbreaks of 2009-H1N1 influenza A in nursing homes and long-term care facilities have yet to occur, she observed.
A recent study found that multiple major histocompatibility complex (MHC)–restricted epitopes12 are conserved in the nucleoprotein,13 matrix protein,14 and hemagglutinin protein15 of 2009-H1N1 influenza A (Xing and Cardona, 2009). The authors suggest that these epitopes may initiate the activation of infected macrophages16 and antiviral cytokine17 production, and help host defenses. They concluded that cross-reactive cell-mediated immunity18 to pandemic (H1N1) 2009 virus through conserved MHC class I-restricted epitopes19 may exist in persons previously immunized against, or exposed to, seasonal influenza.
Kawaoka also investigated the susceptibility of the 2009-H1N1 influenza A virus to a panel of antiviral drugs. As previously noted, there have been multiple sporadic isolations of oseltamivir-resistant 2009-H1N1 influenza A viruses. This is not surprising, he said, because about 18 percent of patients who
|
12 |
The surface portion of an antigen capable of eliciting an immune response and of combining with the antibody produced to counter that response (http://medical-dictionary.thefreedictionary.com/epitopes, accessed November 5, 2009). |
|
13 |
Any of a group of substances found in the nuclei of all living cells and in viruses and composed of a protein and a nucleic acid (http://medical-dictionary.thefreedictionary.com/nucleoprotein, accessed November 5, 2009). |
|
14 |
Structural proteins linking the viral envelope with the virus core (http://encyclopedia.thefreedictionary.com/matrix+protein, accessed November 5, 2009). |
|
15 |
Hemagglutinin (HA) is a species-specific binding protein that allows for the virus to bind to the cell membrane of host respiratory cells and propagate through cellular processes (http://biology.kenyon.edu/BMB/Chime2/2005/Cerchiara-Holsberry/FRAMES/start.htm, accessed November 6, 2009). |
|
16 |
A type of white blood cell that ingests foreign material and is a key player in the immune response to foreign invaders such as infectious microorganisms (http://www.medterms.com/script/main/art.asp?articlekey=4238, accessed November 5, 2009). |
|
17 |
A human or animal factor that is induced by interferon in virus-infected cells and mediates interferon inhibition of virus replication (http://medical-dictionary.thefreedictionary.com/antiviral+protein, accessed November 6, 2009). |
|
18 |
An immune response that does not involve antibodies but rather involves the activation of macrophages, natural killer (NK) cells, antigen-specific cytotoxic T-lymphocytes, and the release of various cytokines in response to an antigen (http://encyclopedia.thefreedictionary.com/cell-mediated+immunity, accessed November 5, 2009). |
|
19 |
MHC class I-restricted CD8+ T cells play a central role in protective immunity (http://tompoole.name/proxy.php?url=http://www.pnas.org/content/97/22/12210.full, accessed November 6, 2009). |
are infected with seasonal influenza and treated with oseltamivir harbor drug-resistant viruses. Using a mouse model, Kawaoka and coworkers tested licensed and experi mental influenza drugs against 2009-H1N1 influenza A and found that the virus is sensitive to an experimental neuraminidase inhibitor and an experimental broad- spectrum viral RNA polymerase inhibitor, in addition to oseltamivir and zanimivir, as may be seen in Figure WO-10 (Itoh et al., 2009). For the time being, it seems, the antiviral “first line of defense” against 2009-H1N1 influenza A is holding (see the final section of this summary for further discussion of antiviral drugs for 2009-H1N1 influenza A).
The Pandemic’s Progress
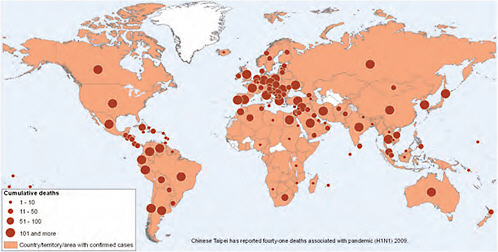
According to the WHO, as of April 4, 2010, 2009-H1N1 influenza A had spread to over 213 countries and had resulted in over 600,000 laboratory-confirmed cases and at least 17,700 deaths (WHO, 2010a,b). These numbers represent only the “tip of the iceberg” of morbidity and mortality associated with infection by the virus, as they reflect only those patients who have sought medical care and have undergone serologic, confirmatory, testing for the virus.
In mid-July, the WHO announced that “the increasing number of cases in many countries with sustained community transmission is making it extremely difficult, if not impossible, for countries to try and confirm them through laboratory testing” and that “the counting of individual cases is now no longer essential in such countries for monitoring either the level or nature of the risk posed by the pandemic virus or to guide implementation of the most appropriate response measures” (WHO, 2009b). Countries were urged to focus on diagnosing severe cases, and the WHO discontinued issuing country-specific counts of confirmed cases. The WHO began to provide a weekly “situation update” instead, gauging trends in four qualitative indicators: the global geographic spread of influenza, trends in acute respiratory diseases, the intensity of respiratory disease activity, and the impact of the pandemic on healthcare services (WHO, 2009d). Figure WO-11 depicts the global distribution and cumulative deaths due to 2009-H1N1 influenza A.
Because the 2009-H1N1 influenza A virus emerged just before the onset of the influenza season in the Southern Hemisphere, attention was focused on that region to see how the pandemic, and the virus itself, might evolve. Cox reported that, in general, the epidemiological characteristics of 2009-H1N1 influenza A noted in the initial disease wave in Central and North America—for example, attack rates, risk groups for infection, and disease severity—remained stable through the Southern Hemisphere’s influenza season (see Box WO-3). In addition, the 2009-H1N1 influenza A virus itself also appeared unchanged: virus samples obtained from the Southern Hemisphere continued to match the vaccine seed isolate; the majority of Southern Hemisphere isolates were sensitive to neuraminidase inhibitors (unlike seasonal H1N1); and no genetic markers associated with severe influenza in other strains (e.g., the 1918 H1N1 pandemic virus
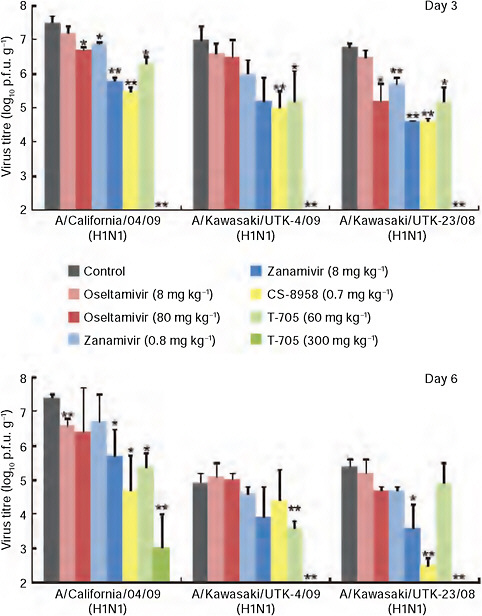
FIGURE WO-10 CA04 sensitivity to antiviral compounds in mice. Mice were intranasally inoculated with 104 p.f.u. (50 μl) of CA04, KUTK-4, or A/Kawasaki/UTK-23/08 (H1N1). At 1 h after infection, mice were administered oseltamivir phosphate, zanamivir, CS-8958, T-705, or distilled water and PBS (control). Three mice per group were killed on days 3 and 6 after infection and the virus titers in lungs were determined by plaque assays in MDCK cells; results are reported as means ± s.d. The statistical significance of differences in lung virus titers of control mice and those treated with antivirals were assessed by use of the Student’s t-test (* P < 0.05; ** P < 0.01).
SOURCE: Itoh et al. (2009).
|
BOX WO-3 Clinical and Epidemiological Overview of 2009-H1N1 Influenza A Transmission characteristics: In general, household secondary attack rates (a measure of the risk of someone being infected with a disease by an ill close contact) for 2009-H1N1 influenza A are slightly lower than attack rates for seasonal influenza. This suggests that pharmaceutical and nonpharmaceutical mitigation measures may appreciably limit the spread of 2009-H1N1 influenza A prior to the development of an effective vaccine. Indeed, the use of antiviral medications (which can reduce viral shedding) to treat cases or prevent influenza in household contacts may already have decreased secondary attack rates. Age profile: Age-specific frequency of cases is highest among school-age children and young adults; the lowest frequency of cases occurs among the elderly. Symptoms: Most people infected with 2009-H1N1 influenza A virus experience uncomplicated influenza-like illness, with full recovery within a week, even without medical treatment. Severe cases: Small subsets of 2009-H1N1 influenza A patients rapidly develop very severe progressive pneumonia, which in turn is often associated with failure of other organs, or marked worsening of underlying asthma or chronic obstructive airway disease. Primary viral pneumonia is the most common finding in severe cases and a frequent cause of death. This is markedly different from severe cases of seasonal influenza, which tend to involve secondary bacterial infections. |
and H5N1 avian influenza virus) had been detected in any of the 2009-H1N1 influenza A virus isolates.
Several speakers described the recent Southern Hemisphere influenza season, during which the clinical and epidemiological characteristics of the morbidity and mortality associated with the 2009-H1N1 influenza A pandemic, as reflected in Box WO-3, remained essentially unchanged. Some Southern Hemisphere countries experienced simultaneous or serial epidemics of multiple viral diseases, as shown in Box WO-4. In many, but not all, cases the 2009-H1N1 influenza A virus eventually dominated other seasonal influenza strains. Much as Ruiz-Palacios found co-infections with multiple respiratory viruses (including parainfluenza 1, 2, and 3; respiratory syncytial virus [RSV]; and the coronavirus that causes bronchitis) in a majority of Mexican patients with severe disease, one might expect to find similar co-infections in other locations with multiple viral epidemics.
|
Secondary bacterial infections have been found in approximately 30 percent of fatal cases of 2009-H1N1 influenza A. Bacteria frequently reported include Streptococcus pneumoniae and Staphylococcus aureus, including methicillin-resistant strains in some cases. These infections can be prevented with antimicrobial (i.e., antibacterial, antiviral, antifungal agents) therapy during early treatment of 2009-H1N1 influenza A.a Risk of severe or fatal illness is highest in three groups: pregnant women, especially during the third trimester of pregnancy; children younger than 2 years of age; and people with chronic lung disease, including asthma. However, significant numbers of severe cases occurred in previously healthy young people in the absence of any known predisposing risk factors. In addition, the overall fatality rate was highest in persons over 50 years of age (Louie et al., 2009a). Comorbidities associated with severe 2009-H1N1 influenza A include cardiopulmonary diseases, diabetes, pregnancy, and morbid obesity. Antiviral treatment and resistance: The 2009-H1N1 influenza A virus is sensitive to the neuraminidase inhibitors oseltamivir (Tamiflu®) and zanamivir (Relenza®) and resistant to amantadine and rimantadine. There have, however, also been recent sporadic reports of oseltamivir resistance. Accumulating evidence suggests that prompt treatment of confirmed or suspected 2009-H1N1 influenza A with antiviral drugs reduces the severity of illness and improves the chances of survival. SOURCES: CDC (2009b); Fukuda (2009); Munayco et al. (2009); Pourbohloul et al. (2009); WHO (2009f). |
Workshop presentations offered epidemiological and clinical perspectives on the developing pandemic that ranged from the global to the local. The following discussion highlights information that contrasted with general trends as described in Box WO-3, or which provided novel clinical insights on the 2009-H1N1 influenza A virus.
The United States and Mexico
As is typical for the Northern Hemisphere, overall influenza activity declined over the summer in the United States. Localized outbreaks of 2009-H1N1 influenza A, some of them intense, however, continued to occur in different parts of the country (PCAST, 2009). More than 80 outbreaks occurred in summer camps in more than 40 states (Stein, 2009), and the southern United States, where many
|
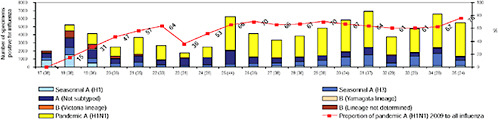
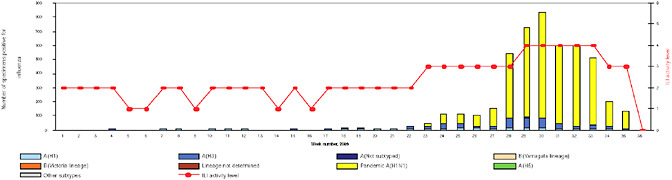
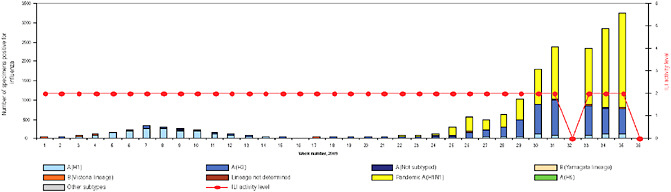
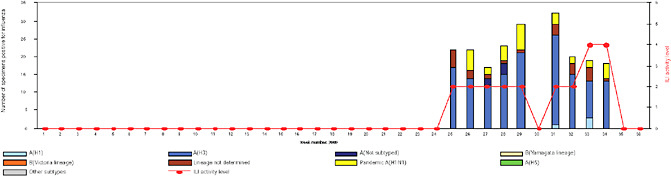
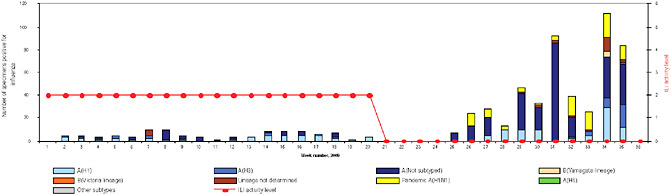
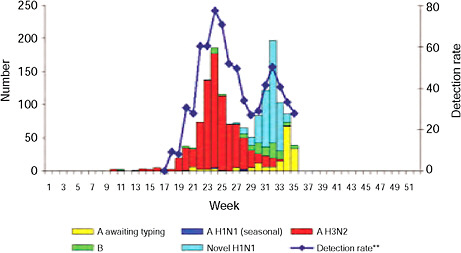
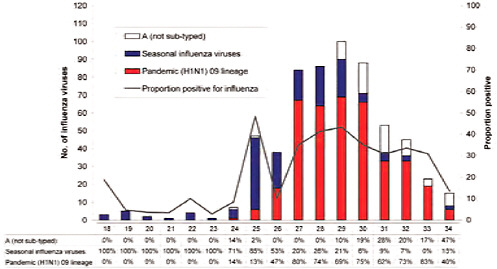
BOX WO-4 Influenza Trends, September 2009 Influenza viruses in circulation, 2009: Multiple viral subtypes (influenza A subtypes, pandemic H1N1, and influenza B) circulated throughout 2009 in both the Southern and Northern Hemispheres (Figures WO-12 and WO-13). Southern Hemisphere influenza season: Several countries experienced multiple viral epidemics that included RSV, parainfluenza, and seasonal influenza (both H3N2 and H1N1); in some cases, 2009-H1N1 influenza A overpowered co-infecting viruses to become the predominant respiratory infection. The following figures, depicting annual influenza trends in Chile (Figure WO-14), Australia (Figure WO-15), Hong Kong (Figure WO-16), Cambodia (Figure WO-17), Kenya (Figure WO-18), South Africa (Figure WO-19), and New Zealand (Figure WO-20), illustrate the significance of 2009-H1N1 influenza A in the Southern Hemisphere 2009 influenza season. As of September 11, 2009, as the Southern Hemisphere influenza season waned, the following trends in ILI were apparent:
SOURCES: Cox (2009); Fukuda (2009); Shortridge (2009). |
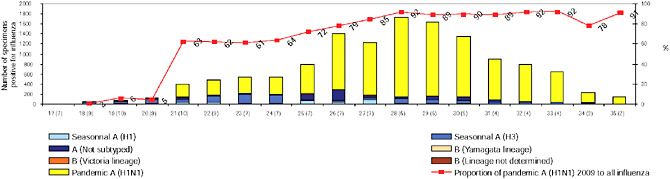
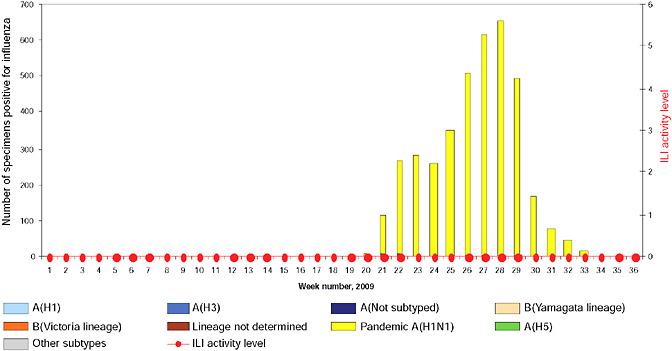
schools resume session in late July, experienced an unusual late summer increase in ILI that has been attributed to 2009-H1N1 influenza A, Cox reported. This pattern was repeated throughout the country with the opening of most schools in early September, as shown in Figure WO-21, and the cases continue to mount.
Mexico experienced two peaks of viral activity, according to Ruiz-Palacios (Figure WO-22). The first peak began no later than March 2, 2009, the date that a blood sample was obtained from a child hospitalized for a respiratory infection as part of a surveillance program. The child was determined, after the fact, to be the earliest confirmed case of 2009-H1N1 influenza A. As the cases—including severe infections—mounted in the Mexico City area, the Mexican government— in an attempt to slow down the spread of the disease—closed all schools on April 24, 2009, and a few days later halted all nonessential activities (Stern and Markel, 2009). A decline in cases followed these interventions, which continued as schools reopened two weeks later and normal life resumed. However, Ruiz-Palacios continued, in early June, 2009-H1N1 influenza A cases started to appear in large numbers in the southeastern state of Chiapas, which, unlike Mexico City, is in the tropics. Although the population of Chiapas is approximately one-fourth that of Mexico City, the number of cases was similar, indicating a much higher rate of infection in Chiapas compared with Mexico City. Ruiz-Palacios attrib-
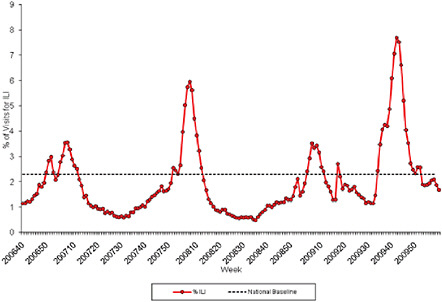
FIGURE WO-21 Percentage of visits for ILI reported by the U.S. Outpatient ILI Surveillance Network (ILINet) weekly national summary, October 1, 2006, to February 27, 2010.
SOURCE: CDC (2010).
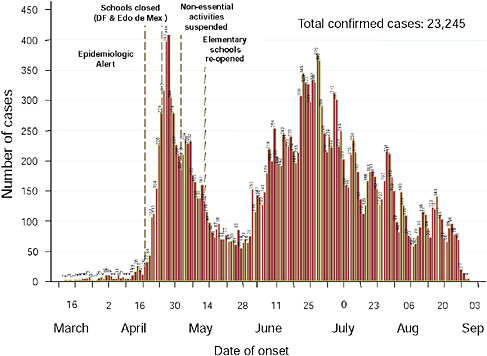
FIGURE WO-22 Epidemic curve in Mexico, cumulative through early September 2009.
SOURCE: Ruiz-Palacios (2009).
uted this to the extreme poverty in Chiapas, and the associated lack of access to adequate hygiene or medical care.
Ruiz-Palacios also reported several findings on the topic of viral shedding in 2009-H1N1 influenza A cases, a significant factor in disease transmission, as may be seen in Figure WO-23. In general, he observed, higher viral titers are present early in the course of 2009-H1N1 influenza A infection. While high titers persisted in some severe cases, he found no relationship between disease severity and viral concentration. In most patients who received antiviral treatment early in the course of disease, viral shedding persisted for no more than two days, he said. By contrast, patients who presented after several days to weeks following the onset of symptoms continued to shed virus for several days following antiviral treatment and, in these cases, the virus was shed not only from the nasopharyngeal and endotracheal tissues20 of these patients, as is typical, but also in their stool and urine. This phenomenon may have contributed to the high rates of 2009-H1N1 influenza A transmission reported in Chiapas and other places where clean water and sanitation are not widely available. In addition, Ruiz-Palacios noted, standard doses
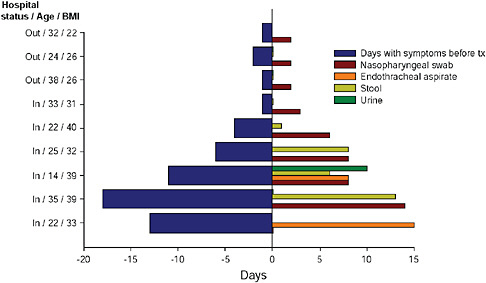
FIGURE WO-23 Viral shedding prior to and following treatment.
SOURCE: Ruiz-Palacios (2009).
of antiviral medications proved insufficient to reduce viral shedding in morbidly obese patients—who were disproportionately affected by severe disease—but that higher doses efficiently halted shedding in this subset of patients.
South America
Speaker and Forum member Eduardo Gotuzzo, of the Universidad Peruana Cayetano Heredia in Lima, Peru, discussed recent experiences and the current status of the 2009-H1N1 influenza A pandemic in South America, with special emphasis on his home country (see Munayco et al., 2009). Following the first confirmed case of 2009-H1N1 influenza A in Peru on May 14, the virus quickly spread among school students (Figure WO-24). Individual schools began to close within days, and a nationwide school closure took place between July 22 and August 1. In order to manage the 2009-H1N1 influenza A pandemic with Peru’s limited resources, only “high-risk” patients received antiviral treatment and no prophylaxis was provided, Gotuzzo said; instead, they relied on behavioral interventions such as stressing the importance of hand washing and mask use (in healthcare settings) to reduce viral transmission. The public health response to the 2009-H1N1 influenza A pandemic in Peru was based on, and supported by, the country’s pandemic influenza plan, which had been established five years earlier, he added. However, as the 2009-H1N1 influenza A pandemic unfolded, Gotuzzo and his colleagues quickly found that the plan “had to be continuously reviewed and updated.”
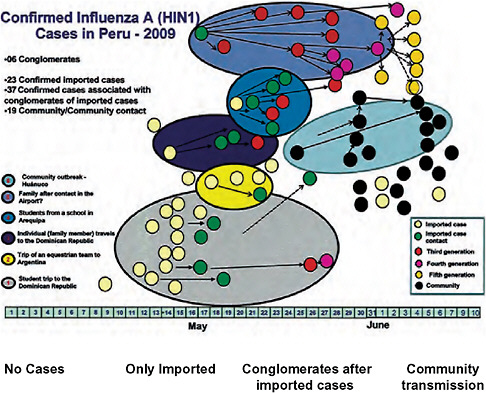
FIGURE WO-24 Confirmed 2009-H1N1 influenza A cases in Peru, 2009.
SOURCE: Dr. Luis Suarez-DGA/Peru.
Gotuzzo also considered an important variable among South American countries’ experiences with 2009-H1N1 influenza A: mortality. Mortality rates associated with infection by the 2009-H1N1 influenza A virus varied widely, raising many questions about the course and treatment of influenza, as well as surveillance and monitoring practices, that have yet to be answered (personal communication, Thais dos Santos, PAHO, January 27, 2010). The striking example of the 2009-H1N1 influenza A pandemic in Argentina—where vastly different mortality rates occurred in different regions—however, offers insights on factors that may contribute to such discrepancies.
Despite the Argentine government’s late April 2009 decision to suspend flights from Mexico, the 2009-H1N1 influenza A pandemic arrived in Argentina in late April/early May with an infected citizen of that country returning from a Mexican vacation (Bustamante, 2009). Speaker Osvaldo Uez, of Argentina’s Instituto Nacional de Epidemiologia, observed that the 2009-H1N1 influenza A virus spread quickly in Buenos Aires, and then throughout the country, after the first case was identified on April 26. By July 22, 2009, the 2009-H1N1 influenza
A pandemic in Argentina caused the second highest number of deaths in the world, just behind that of the United States (ProMED-mail, 2009a). A health emergency was declared in mid-July when the 2009-H1N1 influenza A virus was detected in the Argentinean swine population.21 Schools were closed and citizens of Argentina were advised to avoid crowded areas (Buenos Aires Herald, 2009; ProMED-mail, 2009b). Estimates suggest that over a million people in Argentina became infected with the virus (see Uez in Appendix A13). Because provincial officials in Buenos Aires delayed school closures, and hospitals there initially provided antiviral treatment only to patients with severe respiratory symptoms, mortality rates were high, Uez reported: at least 29 deaths occurred among a population of approximately 259,000 in health region 2 of the Province of Buenos Aires. “It was like seeing the disease in its natural course, if you will; an experiment in nature,” he said. By contrast, he noted, in Argentina’s southern-most province, Tierra del Fuego, schools were closed quickly, public gatherings such as sports events were canceled, and patients with influenza-like symptoms consistently received antiviral treatment. There, in a population of 130,000, only one confirmed death due to 2009-H1N1 influenza A occurred.
Asia and Australasia: Implications of Co-Infections
The example of Argentina illustrates that while the epidemiological profile of 2009-H1N1 influenza A pandemic remained stable through the Southern Hemisphere’s influenza season, its impact varied widely within and between countries. In an article (Bertozzi et al., 2009) that appeared in Nature days before the workshop describing scientific and public health challenges in affected countries, interviews with representatives of Australia, Vietnam, and India revealed very different experiences with the 2009-H1N1 influenza A pandemic. In Australia, which as of January 15, 2010, has reported 191 deaths out of more than 37,680 confirmed 2009-H1N1 influenza A cases (Australian Government, Department of Health and Aging, 2010), influenza was particularly hard on the indigenous population, which suffered disproportionate rates of severe disease (Bertozzi et al., 2009). In Vietnam, where the virus arrived relatively late in their influenza season and where past experiences with SARS and H5N1 encouraged pandemic preparation (Bertozzi et al., 2009), 58 deaths have been reported among the 11,186 confirmed 2009-H1N1 influenza A cases, as of February 10, 2010 (WHO Representative Office in Viet Nam, 2009). In India, where the virus was transmitted in city clusters, it was predicted that even if the pandemic remained moderate in its intensity, it would have a severe impact on the population due to its high
density, youthful demographic (half of all Indians are younger than 25 years of age), and low awareness of the pandemic (Bertozzi et al., 2009). As of March 4, 2010, 1,385 confirmed deaths due to 2009-H1N1 influenza A have been reported in India (WHO/SEARO, 2010).
Workshop speakers Cox and Shortridge addressed another important feature of the recent Southern Hemisphere influenza season in Asia, as well as in New Zealand: the arrival of multiviral influenza epidemics involving 2009-H1N1 influenza A (see Box WO-4 on page 34). In certain parts of Asia, Cox reported, the 2009-H1N1 influenza A virus has failed to replace the H3N2 viruses. In both northern and southern China, H3N2 continues to represent about half of all isolated influenza viruses according to Cox of the CDC. “We’re watching H3N2 circulation very carefully,” said Cox. Shortridge observed that the “amalgam” of co-circulating 2009-H1N1 influenza A and seasonal H1N1 and H3N2 viruses poses an important question for vaccine production: will the 2009-H1N1 influenza A virus become the dominant influenza A virus, or will all three strains continue to coexist? And what about influenza B viruses? “There’s going to be a hell of a job for the vaccine manufacturers if we have this collection of viruses year after year,” he concluded (see Shortridge in Appendix A12).
Shortridge also noted the potential implications of the co-circulation of 2009-H1N1 influenza A with the H5N1 avian influenza A virus. This is bound to occur in parts of southern Asia, where H5N1 is endemic in domestic and wild birds and occasionally infects humans. “We’re getting terribly carried away and so we should be with [2009-H1N1 influenza A],” he said, “but don’t forget there are other viruses around to reassort with.” H5N1 viruses have recently been isolated in humans in mainland China, and in poultry and wild birds in several Asian countries, he reported.
Shortridge’s concerns about the potential for viral reassortment stem from his long experience as a public health researcher in mainland China and Hong Kong, where, he said, “as soon as you go to the villages, the feeling is palpable and you know that this is a place for pandemics and has been for a long time.” He noted that the Chinese character for home depicts a roof with a pig underneath, and the long tradition of pigs—as well as poultry—sharing human dwellings continues to this day (Figure WO-25). He characterized these circumstances as “a wonderful alchemy for the emergence of pandemic influenza virus.” Shortridge believes (though, he acknowledged, this belief is not universal) that the 1918 H1N1 pandemic virus emerged in humans in China, and—in addition to traveling through Europe to America—was transmitted from humans into pigs in China. By contrast, he observed, there have been no reported cases of humans infecting pigs with the 2009-H1N1 influenza A virus,22 and rates of disease in mainland
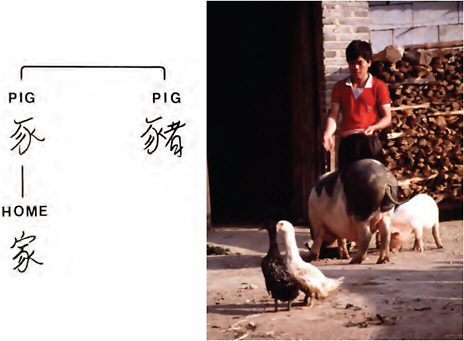
FIGURE WO-25 The long tradition of pigs and poultry sharing human dwellings in China.
SOURCE: Shortridge (2009).
China have been relatively low compared with Hong Kong and other countries in the region.
Africa
Low rates of reported 2009-H1N1 influenza A cases and deaths in Africa probably result from a combination of two factors, according to speaker Barry Schoub of the National Institute for Communicable Diseases, South Africa: a comparatively low volume of tourism, and a dearth of infectious disease surveillance (see Schoub in Appendix A10). He pointed out, however, that South Africa experienced a significant outbreak during the Southern Hemisphere influenza season,
during which 2009-H1N1 influenza A overtook seasonal H2N3 to become the dominant influenza virus circulating in that country, as illustrated in Box WO-3.
The 2009-H1N1 influenza A pandemic did not reach South Africa—where it had sparked what Schoub called an “intensive search” for the virus propelled by public demand—until June 13th. A 16-year-old boy who had visited Texas introduced the 2009-H1N1 influenza A virus to South Africa; additional imported cases came primarily from the United States, Australia, and the United Kingdom. The pandemic is now established in South Africa with sustained community transmission occurring in most major cities. As of March 10, 2010, more than 12,640 laboratory-confirmed cases of 2009-H1N1 influenza A, and 93 deaths, have been reported in all 9 provinces, with the majority in Gauteng and Western Cape provinces (WHO/AFRO, 2010). The highest incidence rates of the 2009-H1N1 influenza A pandemic occurred in provinces that receive the majority of international travelers and which are also crowded urban areas, he reported.
Preliminary epidemiological findings in South Africa track closely with those reported from the initial Northern Hemisphere wave, Schoub said. Most cases (66 percent) have appeared in people 10-24 years of age. He noted, however, that these data highlighted two particular risk groups that sustained higher mortality rates compared to the rest of the population: pregnant women and people coinfected with HIV. Although pregnancy is a well-recognized risk factor in 2009-H1N1 influenza A (Jamieson et al., 2009; Mangtani et al., 2009), this preliminary study found an unusually high number of confirmed deaths among women in late pregnancy. Both pregnant and non-pregnant HIV-positive individuals died at considerably higher rates from 2009-H1N1 influenza A infection than HIV-negative individuals, he reported.
The Scientific Response
Several workshop presentations and considerable discussion focused on the rapid, multipronged scientific response to the emergence of 2009-H1N1 influenza A, which was primed by global anticipation of an H5N1 avian influenza pandemic and strengthened by increased—though still inadequate—scrutiny of emerging zoonotic diseases, as several workshop participants observed. Influenza surveillance ramped up as the pandemic unfolded, as did questions about how to improve and expand these efforts to address future emergent threats and inform the global public health response to 2009-H1N1 influenza A. Nevertheless, many critical decisions, such as those relating to the manufacture and distribution of the 2009-H1N1 influenza A vaccine, had to be made based on incomplete data. Under these circumstances, mathematical models provided a rational basis for decision making, and a means to reconsider and refine strategies as both the pandemic and the models evolved. At the same time, the pandemic offered investigators an important opportunity to analyze an emerging disease in real time and, thereby, inform public health policy.
This section describes the interdependent pursuits of surveillance, modeling, and research on influenza biology and epidemiology during the early months of the 2009-H1N1 influenza A pandemic. Workshop participants described key findings and challenges encountered in each of these fields and noted their significance to present and future efforts to address emerging infectious diseases.
Surveillance
U.S. efforts before and after 2009-H1N1 influenza A The first U.S. cases of 2009-H1N1 influenza A were quickly diagnosed, and the viral genome was sequenced and published online, according to Cox, thanks to recent surveillance initiatives to detect and investigate swine influenza cases in humans. “Novel influenza of humans has been a notifiable disease in the United States for a number of years,” she stated, “and there have been increasing efforts ongoing at state health departments, at [the] CDC, and in conjunction with our [U.S. Department of Agriculture (USDA)] partners to investigate these human cases of swine influenza and try to determine the extent of spread of swine influenza in humans when these instances arose.”
The CDC also moved quickly to develop vaccine candidates, Cox said, making the decision to do so on April 18, the day after the second viral isolate was identified. “We did that because there was absolutely no evidence that the first two patients had had any contact with livestock [and] we also had heard that there was influenza-like illness activity in contacts of these two individuals, and so we thought it was better to be safe than sorry,” she explained.
At the same time, the CDC amplified surveillance efforts directed at the 2009-H1N1 influenza A virus; these included enhanced detection, testing, virologic and epidemiologic surveillance, case reporting through ILInet,23 and mortality surveillance. The agency also developed diagnostic RT-PCR24 pandemic H1N1 kits, which—having been granted an Emergency Use Authorization by the
|
23 |
ILInet is a nationwide surveillance program for influenza-like illness (ILI) conducted by the CDC in collaboration with state health departments. More than 2,700 physicians in all 50 states were enrolled in this network during the 2008–2009 influenza season, during which they reported the total number of patient visits each week and number of patient visits for ILI by age group (0-4 years, 5-24 years, 25-49 years, 50-64 years, >65 years). These data are transmitted once a week to a central data repository at CDC via the Internet or fax (http://www.health.state.ny.us/diseases/communicable/influenza/recruits.htm, accessed January 6, 2010). |
|
24 |
Reverse transcription polymerase chain reaction (RT-PCR) is a variant of polymerase chain reaction (PCR), a laboratory technique commonly used in molecular biology to generate many copies of a DNA sequence, a process termed “amplification.” In RT-PCR, however, the RNA strand is first reverse transcribed into its DNA complement (complementary DNA, or cDNA) using the enzyme reverse transcriptase, and the resulting cDNA is amplified using traditional or real-time PCR. Reverse transcription PCR is not to be confused with real-time polymerase chain reaction (Q-PCR/qRT-PCR), which is also sometimes (incorrectly) abbreviated as RT-PCR (http://en.wikipedia.org/wiki/Reverse_transcription_polymerase_chain_reaction, accessed November 6, 2009). |
FDA—were provided in less than 3 weeks to state health departments and Department of Defense (DOD) laboratories, as well as to laboratories in 140 countries. As of early September, Cox reported, more than 1,000 such kits had been distributed to more than 100 labs domestically, 15 DOD labs, and to more than 250 labs in 140 countries.
As Cox and Worobey noted previously, however, a period of “unsampled diversity” in swine influenza viruses (SIVs) preceded the emergence of the pandemic strain of the 2009-H1N1 influenza A virus. “There’s lots of room for improvement in our surveillance of swine flu in pigs,” said Worobey, who advocated for global sequence-based surveillance of influenza-like disease in humans and animals. “If we had been doing that kind of thing, we may have picked up on this new flu strain a month or two or three earlier than we did,” he speculated. “We can take a lot of lessons from this example … [for] the next time a virus runs into humans, perhaps one that has a higher virulence.” While acknowledging that a comprehensive sampling of SIVs might not permit identification of strains that could jump to humans and cause a pandemic, “it would be great to actually be able to at least try to do that,” he said. Influenza surveillance in humans is even more crucial, he noted: “It’s a very rare event, but [when] any new flu strain jumps into humans and does anything more than sporadic transmission … we need to be bracing ourselves for the possibility that it’s going to be the next pandemic.”
“We’ve really tried to close this gap in surveillance for SIVs among swine and swine workers,” Cox said of the CDC. However, she noted, there is no existing systematic surveillance for SIV in the United States, nor is there a global effort. Reporting of SIV is not required by the World Organization for Animal Health (OIE). Cox further characterized recent requirements imposed with the emergence of 2009-H1N1 influenza A (which now presents a risk to swine) as “loose.” In September 2008, Cox reported, the CDC provided the USDA with $1.5 million to initiate a pilot project to conduct more systematic SIV surveillance, after increased numbers of triple-reassortant SIVs were detected in humans. Cox noted that additional potential benefits to increased SIV surveillance (on either a regional or a global basis) include improved vaccine strain selection and better SIV diagnostics for swine and other mammalian species.
As the 2009-H1N1 influenza A pandemic continues through the Northern Hemisphere’s influenza season, the CDC plans to maintain its enhanced epidemiologic and virologic surveillance, Cox said. Focus on the diagnosis of severe cases, hospitalizations, and deaths due to the 2009-H1N1 influenza A virus will continue, but—much as the WHO advised in July—there will be no attempt to count cases. The CDC will also conduct syndromic surveillance for ILI and pursue new sources of surveillance data, she added. “We expect that seasonal influenza viruses will co-circulate with [2009-H1N1 influenza A],” Cox stated, “but the timing, spread, and severity of the 2009-2010 influenza season are unpredictable.”
Investigations of outbreaks in healthcare settings In his presentation on challenges for controlling the transmission of the 2009-H1N1 influenza A virus in healthcare facilities, Michael Bell of the CDC described a series of case studies conducted in May designed to examine disease transmission patterns among healthcare workers. At that time, he observed, this group did not appear to be overrepresented among 2009-H1N1 influenza A cases. Among 81 confirmed cases of 2009-H1N1 influenza A among healthcare personnel in 25 states, Bell and coworkers found that about 40 percent were community infections, and that more than half of infections that workers might have acquired from patients occurred in outpatient settings. Most disturbing of the study’s findings was “a tremendous lack of adherence to even basic infection control recommendations,” Bell observed (these recommendations are discussed in a subsequent section entitled “The Public Health Response”). Many of these healthcare personnel were apparently unaware that they should be taking precautions when evaluating patients with undiagnosed 2009-H1N1 influenza A infection, and that most reported that they had worked while ill.
To illustrate the varied impact of the 2009-H1N1 influenza A pandemic in healthcare settings, Bell offered the following examples:
-
In an Ohio location where no prior community transmission of the 2009-H1N1 influenza A virus had occurred, a surgical resident returned from a rodeo show at which he had apparently become infected with the virus, exposing 166 coworkers before he became ill. About two-thirds of them received antiviral prophylaxis, although many discontinued treatment due to the gastrointestinal side effects associated with the antiviral medication. None of the exposed individuals became symptomatically ill.
-
Upon investigation of a 2009-H1N1 influenza A infection cluster in a Chicago hospital where patients with unrecognized infections had not been isolated, it was determined that transmission had occurred in equal parts among the general community, between hospital workers, and between hospital workers and patients.
-
None of the 721 elderly residents of a long-term care facility in Boston became infected with the 2009-H1N1 influenza A virus from two healthcare personnel who were working while ill with influenza. However, 18 more staff members—7 of whom had contact with residents—reported ILI that could have been contracted from their coworkers.
Monitoring outbreaks on the Internet The near ubiquity of the Internet, and the voluminous information it carries, makes it an ideal platform for a variety of surveillance strategies (Brownstein et al., 2009; IOM, 2007b). As speaker Lawrence Madoff of the University of Massachusetts explained, informal sources—such as blogs, chat rooms, and analyses of Web searches—provide considerable information on disease outbreaks and their impacts that can be gathered and
assessed quickly. He contrasted that with the traditional “ground-up” flow of public health information from healthcare practitioners and laboratories through multiple administrative layers to national or international governmental bodies (and then back down the same chain in the form of health policy guidance or recommendations).
Focusing on the International Society for Infectious Diseases’ Program for Monitoring Emerging Diseases, known as ProMED-mail, and its performance during the 2009-H1N1 influenza A pandemic, Madoff (who has served as a ProMED-mail editor since 2002) described a range of informal surveillance programs, as well as efforts under way to measure and improve their performance. Founded in 1994, ProMED-mail has grown into a large, publicly available reporting system with more than 55,000 subscribers in nearly every country, he said. ProMED-mail posts information on outbreaks and case reports, including many provided by or gleaned from readers. Many of these readers first became aware of ProMED-mail during the SARS pandemic, which ProMED tracked from an early rumor about an unusual disease outbreak in south China (Morse, 2007). “We expect our readers to write to us and tell us what they know,” Madoff said, adding that “ProMED frequently publishes press reports from non-health media. ProMED moderators screen all posted reports and attempt to limit releases to about seven reports per day in order to prevent ‘information overload.’”
ProMed emphasizes the concept of One Health®,25 which places human health within a larger ecological context, Madoff said. Recognizing the importance of the animal–human health interface, ProMed tracks animal diseases of agricultural importance in livestock, as well as reports of zoonotic diseases. A significant number of ProMED staff members are veterinary specialists. Another key principle of the ProMED culture is transparency, because, he noted, “we can’t predict who’s going to need to know” the information ProMED provides. “Who would have guessed,” he wondered, “that doctors in an emergency room in Toronto were going to be seeing cases of SARS within days of ProMED’s initial post on the disease?”
The volume of potential surveillance information available on the Internet quickly grew beyond the capacity of individuals to search for it, leading to the
|
25 |
Health experts from around the world met on September 29, 2004, for a symposium focused on the current and potential movements of diseases among human, domestic animal, and wildlife populations, which was organized by the Wildlife Conservation Society and hosted by The Rockefeller University. Using case studies on Ebola, avian influenza, and chronic wasting disease as examples, the assembled expert panelists delineated priorities for an international, interdisciplinary approach for combating threats to the health of life on Earth. The product—called the “Manhattan Principles” by the organizers of the “One World, One Health®” event—lists 12 recommendations for establishing a more holistic approach to preventing epidemic/epizootic disease and for maintaining ecosystem integrity for the benefit of humans, their domesticated animals, and the foundational biodiversity that supports us all. For more information, see http://www.oneworldonehealth.org/ (accessed July 16,2009). |
creation of automated web crawlers such as the Global Public Health Information Network (GPHIN), operated by the Public Health Agency of Canada (IOM, 2007b; Mawudeku et al., 2007). Available on a paid subscription basis system, GPHIN provides early warning of disease outbreaks to public health officials at all levels of government, as well as to agencies such as the CDC and the WHO, who use GPHIN reports to detect and track emerging diseases. HealthMap, based at the Children’s Hospital in Boston, combines an automated surveillance system with a geographical interface, producing maps of disease outbreaks. HealthMap reports are freely available online.26 A more recent addition to the automated surveillance approach is the monitoring of Internet search term usage, which is the strategy employed by Google Flu Trends27 (Ginsberg et al., 2009). Its premise, Madoff explained, is that people with influenza or their family members will search the Internet for information on such topics as “flu,” “fever,” or “Tamiflu®.” This approach has detected some local influenza peaks before other surveillance methods were able to do so, he said.
Human-based Internet surveillance systems—including the CDC’s Epi-X,28 the International Society for Tropical Medicine’s GeoSentinel,29 and the WHO’s Global Outbreak Alert and Response Network (GOARN)30—provide equally valuable information that often complements or reinforces intelligence from automated systems, Madoff said. Because each Internet surveillance system picks up different signals, having a variety of approaches in operation maintains overall balance and fills information gaps. Madoff concluded that “redundancy in this setting is a good thing.” Moreover, he added, these surveillance systems complement traditional public health reporting. “We certainly don’t see [informal source surveillance systems] replacing the traditional public health [surveillance] system,” he concluded.
|
26 |
|
|
27 |
|
|
28 |
CDC’s web-based communications solution for public health professionals. Through Epi-X, CDC officials, state and local health departments, poison control centers, and other public health professionals can access and share preliminary health surveillance information—quickly and securely. Users can also be actively notified of breaking health events as they occur. For more information, see http://www.cdc.gov/epix/ (accessed November 5, 2009). |
|
29 |
A worldwide communication and data collection network for the surveillance of travel-related morbidity. It was initiated in 1995 by the International Society of Travel Medicine (ISTM) and the CDC as a network of ISTM member travel/tropical medicine clinics. GeoSentinel is based on the concept that these clinics are ideally situated to effectively detect geographic and temporal trends in morbidity among travelers, immigrants, and refugees. For more information, see http://www.istm.org/geosentinel/main.html (accessed November 5, 2009). |
|
30 |
A technical collaboration of existing institutions and networks who pool human and technical resources for the rapid identification of, confirmation of, and response to outbreaks of international importance. GOARN provides an operational framework to link this expertise and skill to keep the international community constantly alert to the threat of outbreaks and ready to respond. For more information, see http://www.who.int/csr/outbreaknetwork/en/ (accessed November 5, 2009). |
One of the earliest reports of the 2009-H1N1 influenza A pandemic-to-be appeared on HealthMap on April 1, marking the outbreak of pneumonia that occurred in the small town of La Gloria, Veracruz, Mexico. Madoff acknowledged, however, that informal surveillance played “a relatively minor role” in the early detection of the emergence of the 2009-H1N1 influenza A virus. Rather, he observed, the “traditional public health system actually worked quite well in this outbreak,” particularly systems put in place in anticipation of an H5N1 avian influenza pandemic. Today, he added, informal sources play an important role in monitoring the pandemic’s progress. Workshop participants suggested that informal surveillance systems might also be employed prior to a 2009-H1N1 influenza A immunization campaign to identify and quash inaccurate information on vaccine risks, as well as to provide an alternative means to monitor for adverse vaccine event allegations.
Madoff described several approaches that he and colleagues are developing for evaluating and improving early outbreak detection by informal source surveillance systems. This is the goal of a collaboration between HealthMap and ProMED, which will convert ProMED’s archive of more than 40,000 reports into a structured database. Careful analysis of its content will permit the identification of gaps in surveillance systems by disease type, geography, or language, Madoff explained. Such content analysis may suggest timely indicators of disease outbreaks that distinguish them from background “noise.” For example, he observed, outbreaks of pneumonia (such as the one in early April in La Gloria, Veracruz) are common; what are the “unique” traits that would mark it as a disease emergence event? Often, the information that is needed to recognize an emerging disease must be obtained from official sources, so ProMED frequently issues requests for the verification of information they have received, he said.
Because areas of the Southern Hemisphere are not well represented in its collection of informal sources, Madoff said, ProMED is developing regional surveillance programs with such partners as the Asociación Panamericana de Infectología (API or Pan American Association of Infectious Diseases) in South America and the Mekong Basin Disease Surveillance Group,31 and creating new networks in Africa. ProMED is also looking for new ways to monitor diseases, including surveys of social networking sites such as Facebook and Twitter.
Smart surveillance Introducing his workshop presentation, entitled “Ecological Factors to Understanding Influenza Risk,” Peter Daszak of the Wildlife Trust emphasized the profound influence of human activity—travel, trade, agriculture, land use, and animal domestication—on infectious disease emergence (see
|
31 |
The Mekong Basin is home to six countries: Cambodia, China, Laos, Myanmar, Vietnam, and Thailand. In 1999, delegates from these countries agreed to start disease surveillance collaborations under the name Mekong Basin Disease Surveillance (MBDS). For more information, see http://www.mbdsoffice.com/ (accessed November 17, 2009). |
Daszak in Appendix A2; Daszak, 2009b). Having examined these influences in relation to a variety of emerging pathogens, including Nipah virus, West Nile virus, and SARS, Daszak and colleagues conceive of disease emergence as a series of discrete events. Rarely is the series completed, leading to the global spread of a new pathogen, he explained. Instead, zoonotic diseases that spill over into human populations tend to die out, hitting an evolutionary “dead end.” If we were really good at surveillance, he observed, we could develop predictive strategies based on interactions between wildlife and livestock and conduct our surveillance in a “smarter” way. These predictive strategies, it is hoped, would enable us to recognize when a pathogen was likely to emerge into human populations and we could respond accordingly.
In the course of pursuing this goal, Daszak and coworkers have examined several emerging diseases and, through detailed ecological analyses, have attempted to predict subsequent transmission routes and future geographic spread. The results could be used to target surveillance efforts, making them more cost-effective, or “smarter.” In the case of H5N1 avian influenza, Daszak’s group considered whether the disease was likeliest to reach the United States through the poultry trade, through wild bird migrations, or through wild birds imported by the pet trade. First, they determined the pathways by which H5N1 had spread through Asia, Europe, and North Africa (Kilpatrick et al., 2006a). “The poultry trade within southeast Asia was the prime driver of the spread of H5N1 in the first few years,” Daszak said. “Then once [H5N1] got out of Asia and across into Eastern Europe, there was a rapid spread, most likely due to wild birds.” Although the importation of birds from countries where H5N1 had been detected had been banned in the United States, Daszak’s group predicted that the virus would nonetheless enter the country through the “back door,” via birds that were first imported into Mexico and Canada, rather than with migratory birds on the Alaska flyway, which had been a focus of U.S. H5N1 surveillance efforts.
When they attempted to apply similar analyses to 2009-H1N1 influenza A after the early outbreaks in order to determine how and why it emerged in Mexico, Daszak’s group found their model was “pretty useless” due to the lack of surveillance for influenza in swine, as previously discussed. Trade in swine is vast in both volume and geography, he explained. He estimated that, in the past decade, up to 1.5 million hogs moved to Mexico from the United States and Canada, and they in turn could have been bred in Australia, Latin America, Asia, or Europe. Without rigorous surveillance for SIVs in these widely mixing swine herds, he said, “it’s impossible to say anything else about the origin of that virus from an ecological perspective other than that huge trade in pigs and poultry is going to lead to this sort of event.”
Daszak and coworkers then tried to devise a predictive model to anticipate where the next 2009-H1N1 influenza A outbreaks were likeliest to occur—a tool that could be used to target intervention efforts to minimize the global impact of an infectious disease. They began by examining direct and secondary airline
flights originating from Mexico, which gave a reasonable prediction of where outbreaks actually occurred. When they included an additional variable—such as national healthcare spending over the previous year—that accounted for the likelihood that a particular country would report an outbreak, the model predicted outbreaks with “incredibly rigorous probability,” Daszak reported. When the next virus with pandemic potential emerges, he continued, the WHO should target resources to countries that receive a high volume of travelers, and particularly those that spend relatively little on healthcare (which could be approximated by gross domestic product, or GDP), where cases are unlikely to be detected or reported quickly (Daszak, 2009a).
An even “smarter” surveillance program would actually predict where the next zoonosis would emerge. To approach this daunting task, Daszak’s group created an emerging disease database by identifying as closely as possible the point origin of every emerging disease between 1940 and 2004 (Jones et al., 2008). These spatial patterns in emerging infectious disease (EID) events, when corrected for geography and timing of discovery, Daszak said, revealed “hot spots” for infectious disease emergence in places where the animal–human interface is particularly active. As it turns out, the area in Mexico where 2009-H1N1 influenza A appears to have emerged occupies one of these hot spots, he added (Figure WO-26).
Daszak’s group continues to refine this general model and adapt it to predict geographic transmission patterns for specific pathogens, including West Nile virus (Kilpatrick et al., 2006b) and the H5N1 virus (Gilbert et al., 2008). In the
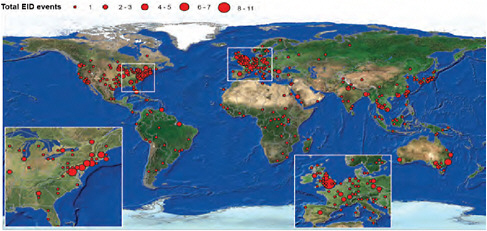
FIGURE WO-26 Spatial pattern in emerging infectious disease events. Main hotspots are in high latitude, developed countries.
SOURCE: Reprinted from Jones et al. (2008) with permission from Macmillan Publishers Ltd.
case of influenza, this process involves determining viral transfer rates between all involved species, locating geographic hot spots for emergence, and examining viral reassortment events. They also hope to use the model to determine the drivers of disease spillover from wildlife into livestock and from livestock into people, and in particular to compare the extent to which intensive production of livestock and backyard farming contribute to this process.
Modeling
A timely response to an incipient pandemic results from decisions based on uncertain data and assumptions regarding the nature of the threat at hand, according to speaker Marc Lipsitch of Harvard University (Lipsitch et al., 2009). As the 2009-H1N1 influenza A pandemic unfolded, Lipsitch and coworkers created models to estimate parameters of infection and to inform the public health response—an experience, he said, that highlights inherent assumptions and uncertainties and also suggests ways to increase both the accuracy and timeliness of impact estimates (see Lipsitch in Appendix A7).
Estimating severity Several assumptions regarding the severity of 2009-H1N1 influenza A derived from analyses of H5N1, Lipsitch observed. A community mitigation strategy devised to address the threat posed by H5N1 influenza, developed by the U.S. government in 2007, included a pandemic scale based on attack rate and case fatality rate (CFR)—the number of deaths divided by the total number of infections—coupled with tailored interventions, as shown in Figure WO-27 (HHS, 2007). Early CFRs that could be calculated based on early data on 2009-H1N1 influenza A were inconsistent, however, ranging from 4 percent in Mexico to 0.1 percent in the United States, he recalled. Subsequent analyses, based on larger pools of data, continued to produce varied estimates of the CFR, ranging from a low of 0.0004 percent (Wilson and Baker, 2009) to a high of 1.2 percent (Garske et al., 2009). Estimates of the reproduction number (R0)—a measure of transmissibility reflecting the average number of secondary infections caused by each primary infection in the early part of an outbreak—for 2009-H1N1 influenza A have been less variable, Lipsitch noted, with many close to 1.5.32 When his group incorporated corrections for missing data and variable reporting over the course of the pandemic into their calculations, they obtained a higher estimate of R0 for the spread of the 2009-H1N1 influenza A virus, between 1.7 and 1.8 (White et al., 2009).
In an attempt to obtain better estimates of the severity of the 2009-H1N1 influenza A pandemic in the United States, Lipsitch and coworkers examined
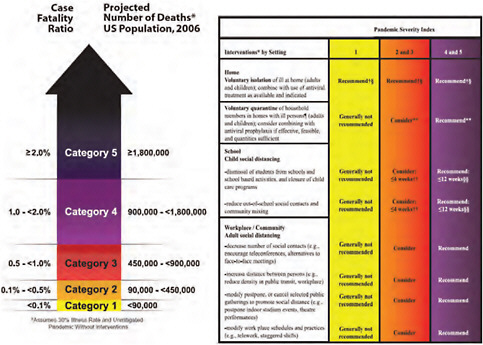
FIGURE WO-27 The pandemic severity scale developed by the U.S. government for planning and response.
SOURCE: HHS (2007).
several stages of the so-called “severity pyramid” depicted in Figure WO-28, using data on influenza cases and deaths from three different sources, each of which represented the most precise measure of a particular parameter of severity. Because the number of serologically-infected people is unknown, Lipsitch’s group could not calculate a true CFR, but instead determined a symptomatic case fatality ratio (sCFR), or the number of deaths divided by the number of symptomatic cases. Their first estimate of sCFR for this data set, 0.045 percent, was ten times lower than an estimate based on data from New Zealand (Wilson and Baker, 2009). The lack of correspondence between these calculations was largely due to differences in estimates of the percentage of symptomatic patients who sought medical attention and the corresponding estimates of how many symptomatic cases had occurred. Using an alternate methodology, Lipsitch and coworkers considered the possibility that 12 percent of the population of New York City had experienced symptomatic H1N1 infection during the spring (corresponding to the proportion who had experienced ILI, as self-reported in a New York City phone survey during a period of high 2009-H1N1 influenza A activity). This methodology resulted in a lower estimated sCFR of 0.007 percent, closer to the
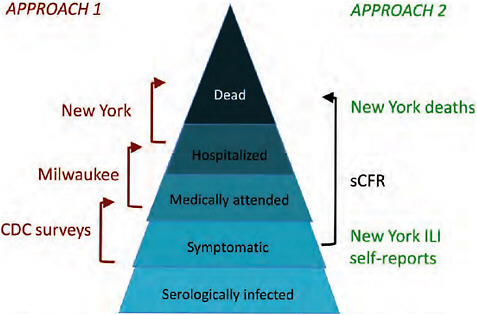
FIGURE WO-28 Severity pyramid.
SOURCE: Reprinted from Presanis et al. (2009).
New Zealand estimate of 0.005 percent (Table WO-2). The “true” ratio probably lies between these [two] numbers, Lipsitch said.
The most striking feature of the data presented in Table WO-2 is the range of severity estimates among the four age classes and, in particular, the disproportionate impact of the 2009-H1N1 influenza A pandemic on nonelderly adults (aged 18 to 64 years). This distinction from seasonal influenza—in which approximately 90 percent of the deaths are in people over 65, mainly due to complications rather than to the direct effect of influenza infection—makes comparisons between the potential impact of 2009-H1N1 influenza A infections with that of seasonal influenza challenging. Lipsitch noted, moreover, that the pandemic’s severity will increase if the 2009-H1N1 influenza A virus evolves greater virulence; if secondary infections became more prevalent; or even if more elderly people become infected, as they would likely die in greater proportions due to comorbid conditions. “Barring any changes in the virus, I think we can say we’re in a Category 1 pandemic (according to the scale in Figure WO-26) … [and] we’re certainly under the 0.1 percent case fatality ratio,” Lipsitch concluded. “That’s really become clear in the last month or so.”
However, as Forum member Michael Osterholm of the University of Minnesota pointed out, impact comparisons based on overall death rates tell only part of the story. If large numbers of people between the ages of 20 and 30 die, he
TABLE WO-2 Age-Specific Severity Estimates
observed, influenza will assume the role of a major global killer, and it will produce untold “collateral damage.” “Nobody is thinking what might happen to U.S. or global supply chains when pandemic flu hits [developing] countries, where the primary workforce are the young, who are most affected by the virus,” Osterholm told Nature (Bertozzi et al., 2009). Despite the dire predictions of many about the mortality associated with the 2009-H1N1 influenza A pandemic, it is proving to be the mildest influenza pandemic on record (Presanis et al., 2009).
Lessons for surveillance Notwithstanding the extraordinary international effort to address 2009-H1N1 influenza A, Lipsitch observed that epidemiological data remain inadequate in terms of both quality and completeness. With severity measures still uncertain to an order of magnitude, public health is limited to general approaches, rather than precise ones, to optimizing interventions, he said. Improvements in influenza surveillance will be needed in order to reduce uncertainty and support a rapid, precise, evidence-based response.
When asked by a workshop participant whether it might be possible to establish a system to generate high-quality epidemiological data in the event of disease emergence, Lipsitch replied that, having given this possibility considerable thought, it is most important to be able to determine how many people become infected during an epidemic. “We don’t know how many people really had influenza-like illness, and I think part of the problem is that we don’t have any kind of centralized way to track that,” he explained. Various approaches have been suggested for establishing such a capacity, he added. They include repeated, routine, telephone surveys to gauge ILI and care-seeking behavior, and, calculating a population-based estimate of medically-attended cases, as is done in New Zealand and the United Kingdom (cases are typically reported as a percent of visits in the United States). Lipsitch added that he was encouraged by the CDC’s significant expansion of surveillance capacity to address 2009-H1N1 influenza A, but wondered aloud whether this momentum could be sustained once the pandemic passes.
Research in Real Time
In a commentary published in Science in early May 2009, Fineberg and Wilson (2009) recalled the 1976 swine flu outbreak at Fort Dix and reminded readers that “scientists and policy-makers have often failed to take advantage of the opportunity to learn and adjust policy in real time.” Decision makers at that time failed to consider—and investigate—additional information that might have led them to a different course of action, the authors observed. Thus, they urged the pursuit of “real-time answers” to scientific questions in five areas critical to policy making regarding 2009-H1N1 influenza A: pandemic risk, vulnerable populations, available interventions, implementation possibilities and pitfalls, and public understanding. Similarly, Forum chair David Relman, of Stanford Univer-
sity, advocated the practice of something he called “as you go science,” which he defined as “applied science in the true sense of designing experiments with imperfect information, with hastily formulated hypotheses … and then incorporating the results into rational decision making that is well communicated.”
Scientists, as well as decision makers, must fight their tendency to react to the most recent threat—which, prior to the emergence of 2009-H1N1 influenza A, was considered to be H5N1 influenza, observed speaker Jesse Goodman, Chief Scientist of the FDA. Instead, they must continually assess the current situation and identify the assumptions under which they operate, he advised. In his remarks to the workshop concerning the scientific research agenda for the 2009-H1N1 influenza A virus, Goodman recognized the many-pronged effort to produce, evaluate, and improve vaccines, and the potential of this work to answer current questions, such as, “Why is one dose sufficient, and why do people without preexisting immunity respond so well?” He also noted the need to conduct “practical science,” which he defined as research that produces clinical guidance, on such topics as respiratory protection (as discussed in the next section, “The Public Health Response”). He further contended that there is not enough investment in such “mundane but crucial” research that benefits public health.
Shortridge, at the conclusion of his presentation on the epidemiology of 2009-H1N1 influenza A in Asia, defined four sets of pressing scientific questions raised by the pandemic. First, he said, what we know about the virus so far should lead us to further investigate the H1 subtype, the swine “mixing vessel” hypothesis, and the question as to whether 2009-H1N1 influenza A can act as a “third-party” virus to carry important genes to prevailing seasonal influenza viruses. It should also focus surveillance efforts on viral emergence “hot spots” in order to detect reassortment events involving 2009-H1N1 influenza A, he said, echoing a comment made by Peter Daszak in his prepared remarks.
Second, because the virus’s evolutionary origins suggest patterns of HA antigen “recycling,” Shortridge said, “it’s about time for H2 to come back if it’s going to come back, so we ought to be looking out for H2 antibodies.” To do so, he advocated a systematic global serological study of those born after 1957—a project he acknowledged was “a bit of a tall order” as it would require “a massive, well-structured, well-organized system using one diagnostic technique so that results could be compared.”
Third, Shortridge encouraged comparative structure-function analyses of pandemic viruses in order to determine factors that result in global transmission (and which answer the question, given ecological conditions in China and in other hot spots for emergence, “Why don’t we have a new pandemic every year?”). These studies would include analysis of HA antigenic epitopes, escape mutants, antigenic characteristics associated with persistence in the host, and “non-receptor factors,” such as pathogenesis or the three-dimensional conformation of the HA molecule, that might provide the boost in transmission efficiency that turns a virus into a pandemic strain.
Fourth, given limited supplies of vaccine and antiviral drugs in the event of a pandemic, Shortridge advocated the evaluation of immunomodulatory agents, such as statins, fibrates, and glitazones,33 as a second line of defense (see the next section for additional discussion of this topic). “My vision is very straightforward,” he said, as he concluded his presentation. “It always has been since I went to Hong Kong, and that is no more pandemics. That’s the only way I see flu. It’s quite simple. No pussyfooting around with the niceties; no more pandemics.”
The Public Health Response
As Fukuda observed in his keynote address, the first five months of the first pandemic of the twenty-first century were extraordinarily productive. Much was learned about the 2009-H1N1 influenza A virus and the disease it causes (as described in the previous two sections) and about approaches to controlling it, which will be discussed next. Paramount among these approaches is immunization. As of early 2010, the H1N1 influenza A vaccine is now becoming available to the general public. At the time of the workshop, several technical decisions related to vaccine production and distribution remained under consideration. Fukuda noted, however, that the most fundamental issue to be resolved—one that is far too complex and fraught to be settled before this pandemic runs its course—is how much access developing countries will have to a pandemic vaccine as well as to antiviral medications and other means of mitigating a pandemic’s impact. This issue, which Fukuda framed as one of “global solidarity,” galvanized workshop discussions regarding global and national public health responses to the 2009-H1N1 influenza A pandemic.
Workshop participants also considered smaller-scale impacts of the 2009-H1N1 influenza A pandemic: on cities and their public health departments, on hospitals and their staffs, and on individual patients and their family members. Much has been learned about the public health response to pandemic influenza in these settings and the challenges and opportunities to be met as the 2009-H1N1 influenza A virus returned to the Northern Hemisphere after a not-so-quiet summer. Fukuda’s description of the global stage, set for 2009-H1N1 influenza A’s next act, is therefore equally descriptive at the local scale: “I think it’s fair to say that as difficult as the first several months have been, in a lot of ways it’s the easier part of the pandemic,” he observed. “We’re entering into a period where the issues are now becoming much more complex and difficult to deal with.”
Infection Control
Infection control practices are focused on hospitals, which tend to be amplification centers for infectious diseases, noted Bell of the CDC. Consider emerg-
ing infectious disease such as SARS or Ebola hemorrhagic fever, he said: such diseases may smolder in a population for months or years before a hospital case produces a noticeable outbreak. To prevent or control such threats, Bell noted, several levels of infection control are practiced in hospitals. Standard precautions, such as gloves, gown, and mask, prevent infections due to direct contact with pathogens. Universal precautions, originally developed to prevent transmission of the HIV virus, treat all body fluids as infectious. Transmission-based practices protect against infection by specific diseases known to be spread either through the air, by droplets, or by direct contact.
The distinction between airborne and droplet-borne diseases has important implications for infection control, Bell explained. Droplets, spread by coughing, are generally thought to spread in an arc over distances of three to six feet; masks and other means to block droplets from contact with the mucosa are recommended for infection protection. To protect against the airborne pathogens that cause diseases such as chickenpox, tuberculosis, and measles—which can remain viable, suspended in the air, for hours—requires special air handling procedures such as negative pressure rooms, which protect people in a building from an infected occupant of one room by preventing airborne particles generated in the room of an infected patient from escaping the sickroom into the surrounding environment.
Current recommendations for infection control for seasonal influenza include standard plus droplet precautions, Bell said. However, since initial 2009-H1N1 influenza A precautions were based on pandemic plans designed for H5N1 influenza (expected to be a much greater threat than seasonal influenza), they included single patient rooms (though without special air handling); standard and contact precautions; wearing a respirator when entering a patient room; isolating patients for seven days from onset of symptoms; negative pressure isolation in addition to respiratory protection for aerosol-generated procedures such as bronchoscopy; and encouraging hospitals to increase monitoring and to furlough healthcare personnel who become ill.
Now, having found that the vast majority of 2009-H1N1 influenza A cases do not require hospitalizations—and particularly since some infected patients are asymptomatic—it is clear that infection control alone is insufficient to prevent the virus from being imported into hospitals and other healthcare settings, Bell said. “There’s a huge challenge to be dealt with when individuals are becoming infected by their kids at home, by their fellow commuters, by simply being a member of the population,” he observed. Instead of coming in with recognized, symptomatic patients, 2009-H1N1 influenza A arrives in hospitals through multiple portals, one of which is the front door. “Logistically speaking, the needs for healthcare protection with [2009-H1N1 influenza A] are substantially different from what we’ve seen in the past,” he acknowledged.
It remains to be determined where the pandemic strain of the 2009-H1N1 influenza A and other influenza viruses lie along the transmission continuum between droplet and airborne, and this has a bearing on infection precautions,
Bell continued. The epidemiology of a pathogen transmitted by droplets would be difficult to distinguish from one transmitted by very short distance inhalation, he observed, leaving open the question as to whether a respirator is needed or not (Loeb et al., 2009). He noted that some researchers, using personal samplers for particulates, have detected airborne influenza viruses in clinical settings, but the viability of the viruses was not tested, nor were samples taken “in the community, in the parking lot, or anywhere else,” for comparison. Animal studies demonstrate the transmission of the 2009-H1N1 influenza A virus, presumably by inhalation, over two to three meters (Itoh et al., 2009). Epidemiological studies such as a recent description of 2009-H1N1 influenza A virus transmission within a Chinese tour group (Han et al., 2009) suggests that speaking with an infected person (as opposed to sitting close by in a bus for several hours) significantly raises one’s risk for infection.
To study the “gray zone” between droplet and airborne transmission, Bell and coworkers are building a system that will allow them to aerosolize infectious organisms and measure their loss of viability over hours or days, as a basis for infection control practices. “I don’t want to have a different set of recommendations for every pathogen,” he added, “but for a handful of important ones, maybe we do want [to be] specific. We do it for tuberculosis, so this is a [further] step in that direction.” In the meantime, Bell said, the CDC recommends respiratory protection and special air handling for aerosol-generated procedures involving patients infected with 2009-H1N1 influenza A virus—a practice he would like to see as a standard precaution for all procedures, as it is in autopsies. Bell also suggested that surgical and respirator masks should be improved, possibly by combining them to produce a single product used throughout medical care, and that better-ventilated clinical facilities would make the environment less risky for staff members. He outlined the following goals for an “ideal approach” to infection control which would
-
reduce risk for healthcare personnel;
-
minimize negative effects on patient care;
-
be acceptable to healthcare personnel (i.e., adherence likely);
-
be implementable by healthcare facilities;
-
be consistent with public health approaches in other settings; and
-
be appropriate for demonstrated severity of infection.
Nonpharmaceutical Interventions
Nonpharmaceutical interventions against infectious diseases are intended to slow the spread of infection. They include isolating ill people and quarantining their suspected contacts, closing schools and businesses, and canceling public gatherings (Markel et al., 2007). Unlike medical interventions against pandemic disease, which by reducing illness and death also reduce the likelihood of social
disruption, nonpharmaceutical interventions are undeniably socially disruptive. They must be carefully tuned to maximize their health benefits and minimize the problems they cause for individuals and communities, according to speaker Martin Cetron of the CDC (see Appendix A1). Nonpharmaceutical strategies cannot “stop a pandemic in its tracks,” he said, but they can spread a surge in cases over a longer period of time, which relieves peak burden on healthcare and other critical infrastructures. Such interventions may also reduce attack rates, and thereby, reduce the attendant morbidity and mortality associated with a highly communicable disease.
Cetron described his recent work with Howard Markel and colleagues, of the University of Michigan, that compared the apparent effectiveness of non-pharmaceutical interventions undertaken singly and in various combinations in 43 different U.S. cities during the influenza pandemic of 1918-1919 (Markel et al., 2007). Most of the cities used a combination of strategies, and some applied them in a more timely way than others, resulting in a widespread difference in mortality among them, Cetron said. “The variability that we saw in 1918, I think we will continue to see with this much less severe pandemic in the United States,” he predicted.
Cetron and his colleagues found that no single intervention effectively slowed transmission of infection in the 1918 pandemic but that when several interventions were used together—and particularly when they were instituted early on in the infection’s course in a community and sustained—they appeared to mitigate the impact of the pandemic (an effect Cetron likened to layering slices of Swiss cheese until every hole is covered). Timely, sustained, layered interventions were associated with reduced and delayed peak transmission, and also with reduced morbidity and mortality, Cetron reported. Twenty-three of the cities essentially served as their own controls, he added, for they relaxed the interventions when the first wave of disease subsided (most often, this meant reopening schools), only to succumb to a second, more intense, outbreak of illness and death. Several other studies have noted significant reductions in pandemic impact associated with school closings, Cetron noted. For example, he said, Cauchumez and colleagues (2009) suggested that closing schools could reduce the total number of influenza cases by 15 percent, and peak attack rates by 40 to 50 percent.
Focusing on schools, Cetron noted their uniquely high “social density,” with an average of less than four feet between people (Stern et al., 2009). During the spring wave of the 2009-H1N1 influenza A pandemic, he and colleagues monitored school closures during the brief period (April 27 to May 2) during which the CDC recommended the dismissal of schools with confirmed cases, affecting at least 600,000 students; a 5-day closure followed by reassessment was recommended. “It wasn’t going to stop this pandemic from moving,” he acknowledged, but at that stage, school closure could plausibly protect school-age children and their families, particularly if they included vulnerable individuals, from high rates of infection. To this end, Cetron said, school closures
appear to work if they are undertaken early, before absenteeism begins to climb to 25 percent or more.
However, he added, one also needs to ask whether closure is justified on the basis of the severity of the disease, not just the number of cases, and whether it is truly feasible. “There are many unintended consequences that have to be addressed and offset for this tool to be considered seriously for future use in a more severe event,” he concluded. He noted that several studies have been initiated (and many are ongoing) to examine the costs and benefits of school closure (Cauchemez et al., 2009). These include a comparison of Dallas, where schools closed for seven days during the spring wave of 2009-H1N1 influenza A, and neighboring Tarrant County, Texas, where schools remained open. The CDC also conducted household surveys in areas where schools closed in order to gauge the level of social disruption, which in many areas was less than expected, Cetron observed. Given the mildness of the illness, “if things had gone on much longer, it would have been much more challenging,” he speculated. On the other hand, he noted how quickly the number of cases declined in areas as school dismissed for the summer, and again how quickly cases mounted as school returned to session.
Clearly there were many adverse effects of school closures, he continued; these were highlighted in the CDC’s guidance document on school closure (CDC, 2009a) and in a Harvard public opinion poll conducted in June (Harvard School of Public Health, 2009). In the latter, 51 percent of respondents said they would have to miss some work if schools closed and as a result would experience loss of pay or worse, of their job or business. Based on these findings, and deliberations over the summer, CDC revised its school closure guidance for the fall, Cetron said. Updated guidance for schools, daycare centers, and colleges and universities, along with a series of checklists and toolkits, are available online.34
Communicating the strategies and goals—and the uncertainties—of pandemic mitigation practices and guidance to the public is a challenging task, as Cetron and many other workshop participants noted, and doubly so for non-pharmaceutical interventions. “There is clearly a preference for ‘magic bullet’ interventions over these traditional public health ones,” the toughest being for adults and children to stay home when they are ill. The timing and duration of nonpharmaceutical interventions are also critical to their success, he added, and they must be continually evaluated and adjusted to maintain a positive benefit-to-risk ratio. Early overreactions can be “dialed back,” as happened in the United States once the severity of the disease—or lack thereof—became apparent. This, he argued, was a far better scenario than if initial indications of severity were accurate and no early actions were taken.
Antiviral Drugs
The WHO has recently issued guidance (WHO, 2009g) on the use of antiviral drugs for influenza that includes a consideration of the current susceptibility patterns of pandemic H1N1 virus, situations in which viruses with different susceptibility types might co-circulate, and where there is potential for sporadic zoonotic infections, according to speaker Frederick Hayden of the University of Virginia. The 2009-H1N1 influenza A virus is susceptible to the neuraminidase inhibitors oseltamivir and zanamivir but resistant to the M2 inhibitors amantadine and rimantadine—in contrast to the seasonal H1N1 virus, which is resistant to oseltamivir and sensitive to amantadine and rimantadine (with the exception of a few resistant isolates). The possibility of multiply-resistant pandemic H1N1 viruses might result from reassortment among these two H1N1 viruses or emergence of a transmissible, oseltamivir-resistant pandemic H1N1 strain. Sporadic instances of oseltamivir resistance have been found in pandemic H1N1 viruses; however, without evidence of community transmission to date. In addition, there has been no evidence of reassortment of the neuraminidase or other genes between the pandemic and the seasonal H1N1 viruses.
Both the WHO and the CDC (2009g) had recently updated their guidelines for antiviral use for the treatment and prevention of influenza, Hayden reported, and both focused on early, empiric treatment of persons in risk groups including pregnancy, people (both at-risk and otherwise healthy individuals) with clinical evidence of severe or progressive disease (those showing warning signs of lower respiratory tract involvement), and hospitalized patients. In countries with sufficient antiviral supplies, treatment is also an option for previously healthy persons with apparently uncomplicated illness. Oseltamivir was clearly identified as the pharmaceutical drug of choice by the WHO in patients with serious lower respiratory infections (as occurs in severe cases of 2009-H1N1 influenza A) due to its availability and the dearth of data regarding both tolerability and activity of inhaled zanamivir. Such patients, Hayden added, require high doses and prolonged antiviral therapy. The WHO recommendations were made primarily on the basis of in vitro susceptibility studies with the pandemic virus and of experiences in management of seasonal and H5N1 influenza illness, he said. They are supported, however, by more recent data, including the results of animal studies by Kawaoka’s group (Itoh et al., 2009), described earlier in this summary, and emerging clinical experience in pandemic H1N1 patients.
A study conducted in Viet Nam followed 300 patients with confirmed mild to moderate 2009-H1N1 influenza A infections who were given a standard dose of oseltamivir then sampled for viral RNA or infectious virus to examine how long the virus survived (van Doorn, 2009). Viral RNA was uncommonly detected in the upper respiratory tract in these patients following antiviral treatment. Among the small number of individuals with a detectable a viral RNA signal up to 12 days after starting oseltamivir treatment, none were culture positive or found
to carry oseltamivir-resistant virus. Hayden noted, however, that other patient populations—particularly those with severe infections—did not show such robust responses to oseltamivir. For example, from informal reports he had learned of several patients with severe disease who carried infectious virus for weeks following oseltamivir treatment. These cases highlight the importance of developing more effective antiviral therapies for influenza, Hayden observed, particularly for severely ill patients.
Poor outcomes and fatalities in hospitalized patients (e.g., pregnant women) with severe cases of 2009-H1N1 influenza A have been strongly associated with delayed antiviral treatment (Jain et al., 2009; Jamieson et al., 2009; Louie et al., 2009a; Napolitano et al., 2009; Shannon et al., 2009)—thus the recommendation to treat such high-risk persons as soon as possible after the appearance of symptoms. Some patient studies in seasonal influenza and H5N1 suggest that even late antiviral intervention can be beneficial as long as viral replication is ongoing, Hayden said. In seasonal influenza, three retrospective studies found significant reductions in all-cause mortality in hospitalized patients treated with oseltamivir within about 96 hours after symptom onset (Hanshaoworakul et al., 2009; Lee et al., 2008; McGeer et al., 2007).
A recent modeling study by Lipsitch and colleagues (Goldstein et al., 2009) suggests that predispensing of up to 20 percent of the antiviral stockpile to high-risk patients during an influenza pandemic would likely result in a net savings of life, and this strategy to ensure early access to treatment for high-risk patients warrants further discussion.
Prophylaxis with oseltamivir appears to be effective against pandemic 2009-H1N1 influenza A illness, according to Hayden, but it also appears to be associated with a higher frequency of gastrointestinal complaints (Wallensten et al., 2009) and prophylaxis failure due to resistance than that observed in older studies in seasonal influenza. For example, the first report of likely pandemic H1N1 oseltamivir resistance transmission occurred in close cases at a North Carolina camp where the antiviral was used prophylactically (CDC, 2009c). There was no evidence, however, for further person-to-person spread of resistance beyond cabin mates within the camp. Indeed, between September 1, 2009, and January 2, 2010, there have been only about 42 (CDC, 2009i) sporadic, mostly geographically dispersed detections of oseltamivir-resistant cases of 2009-H1N1 influenza A reported, all of which have had one common neuraminidase mutation (His 275 Tyr) that confers high-level oseltamivir resistance in N1-containing viruses, as well as the two isolates identified in the North Carolina cluster that shared a second mutation in the neuraminidase, Hayden noted. While the majority of these oseltamivir- resistant viruses were detected in treated persons, particularly immunocompromised hosts with prolonged replication of virus and associated oseltamivir treatment, instances were also detected in several persons without drug exposure and more often among persons failing post-exposure prophylaxis. Most instances of oseltamivir resistance resulted in mild, self-limiting illness, except for complications in sev-
eral children and serious disease in immuno compromised patients (Englund et al., 2009). Intravenous zanamivir has been used as salvage therapy35 in several severely ill patients with proven or suspected oseltamivir resistance (Englund et al., 2009; Kidd et al., 2009).
In this regard, the August 7th PCAST report on U.S. preparations for 2009-H1N1 influenza A includes two key recommendations regarding antiviral drug development: to expedite the licensing of intravenous formulations of antivirals and to stimulate the development of new drugs with novel mechanisms of action against influenza in order to reduce the potential for antiviral resistance (PCAST, 2009).
Hayden described several anti-influenza agents currently under investigation:
-
intravenous formulations of neuraminidase inhibitors, zanamivir, peramivir, and oseltamivir. Intravenous peramivir recently became available by Emergency Use Authorization (CDC, 2009h) for hospitalized patients and intravenous zanamivir is available through an emergency Investigational New Drug (IND) process in the United States;
-
a long-acting neuraminidase inhibitor designated CS-8958, under study for use by inhalation;
-
agents directed against other targets involved in influenza virus replication, including T-705, a polymerase inhibitor, and DAS181, an attachment inhibitor; and
-
combination therapies with currently available and investigational agents, which have appeared promising in animal models but which have received limited clinical study (Hayden, 2009). The combination of T-705 and oseltamivir has appeared to be especially promising in murine models (Severson et al., 2009).
Hayden also described several proposals for immunomodulatory therapies, including the use of:
-
convalescent blood products, which were used with apparent success to treat pneumonia patients during the 1918–1919 influenza epidemic (Luke et al., 2006) and have been used in individual patients with severe H5N1 illness and which have been proposed for use in the event of a pandemic;
-
heterosubtypic neutralizing monoclonal antibodies recovered from human IgM memory cells (Throsby et al., 2008), which are active against multiple group 1 hemagglutinin subtypes (e.g., H1, 2, 5, and 9 viruses); and
|
35 |
A final treatment for people who are nonresponsive to or cannot tolerate other available therapies for a particular condition and whose prognosis is often poor (http://www.medterms.com/script/main/art.asp?articlekey=9380, accessed December 15, 2009). |
-
immunomodulatory therapy with agents such as statins, fibrates, in glitazones (Fedson, 2009), and cyclooxygenase 2 inhibitors (Zheng et al., 2008). Controlled studies of statins as adjunctive therapy are planned in patients with influenza-associated acute lung injury. However, Hayden stressed that some immunomodulators like corticosteroids could have deleterious effects on viral replication as well as other adverse effects, that immunomodulators should be studied in conjunction with effective antiviral therapy, and that a much better understanding of pathogenesis of severe disease secondary to pandemic H1N1 is needed to guide selection of the best interventions to study.
Vaccines
Following the identification of 2009-H1N1 influenza A viruses in California children in mid-April (2009), an intense effort produced vaccine candidate viruses by May 27, 2009, according to the CDC’s Cox. “We were able to get them out the door even before the safety testing was done by working globally with all of our partners in a very efficient way,” she recalled. By June 9, the WHO had completed safety studies of the vaccine candidate viruses in ferrets. Additional candidate viruses have been produced since then, she said, because the initial isolates proved inadequate for vaccine manufacture.
Several studies undertaken by the CDC and other agencies determined that seasonal influenza vaccine provides no protection against 2009-H1N1 influenza A. However, Cox added, people who received the 1976 swine influenza vaccine did develop a robust antibody response to the 2009-H1N1 influenza A viruses, as determined by in vitro studies of stored serum. “We feel that it’s really nearly impossible to study those who had the vaccine in 1976 and look at their antibody levels now,” she said. “Most people don’t even remember if they had the vaccine or not, and it would be probably more trouble than it would be worth because we wouldn’t make recommendations that those individuals should not receive vaccine.” As previously noted, the CDC cross-reactivity study (among others) found that about 30 percent of adults born before 1950 had preexisting cross-reactive antibodies to 2009-H1N1 influenza A, and that cross-reactive antibody levels increased slightly in these older adults following vaccination with seasonal influenza vaccine (Hancock et al., 2009).
At the time of the workshop, Treanor calculated that the “enormous profusion” of 2009-H1N1 influenza A vaccine clinical trials listed on clinicaltrials.gov included 38 studies, with a planned enrollment of more than 30,000 subjects. All of the studies were evaluating two-dose schedules, reflecting the reasonable assumption that, due to the antigenic divergence of 2009-H1N1 influenza A from the seasonal H1N1 virus, a priming and boosting dose would be needed to generate sufficient immunity in the population, Treanor explained. However, evidence emerged over the summer that most people, regardless of age, mounted a vigor-
ous immune response to a single dose of unadjuvanted 2009-H1N1 influenza A vaccine (Greenberg et al., 2009). Studies in the United States also showed that, within 14 days of a single dose, subjects generated antibody titers comparable to those achieved with seasonal influenza vaccine, he added. Given this response, Treanor observed, adjuvants might not provide significant dose-sparing for the 2009-H1N1 influenza A vaccine (Greenberg et al., 2009).
Of the vigorous immune response to 2009-H1N1 influenza A vaccine, Treanor said, “I think the only conclusion you can reach from this is that seasonal H1N1 exposure primes for a rapid antibody response to novel H1N1.” He and coworkers are therefore investigating the putative mechanism for H1 priming, trying to determine the features that control it, whether shared epitopes are important to priming, and whether priming can be predicted by measurement of baseline immunity.36 Treanor noted that studies conducted in the 1970s found that prior exposure to H3 and H2 do not prime for a response to H1.
At the time of the workshop, Treanor reported that 2009-H1N1 influenza A vaccines currently licensed in the United States included inactivated subvirion vaccines, manufactured by CSL Limited,37 Sanofi Pasteur, and Novartis, and live attenuated vaccine, manufactured by MedImmune. Licensure for these vaccines followed the same process as the annual updating of the seasonal influenza vaccine, he said, although clinical data continue to be collected on the 2009-H1N1 influenza A vaccine. In children, live influenza vaccines are more efficacious as compared with inactivated vaccines, Treanor said. Children need two doses of either type, but for different reasons: in the case of live vaccines, two-dose schedules were developed to eliminate interference between vaccine components, he explained, rather than to prime and boost, as is the case in inactivated vaccines administered to children and other naïve patients.
Regarding the question of whether the 2009-H1N1 influenza A vaccine should be administered before, after, or in conjunction with the seasonal vaccine, Treanor observed that there is little evidence on which to base such a recommendation, although he noted that individuals in a multivariate analysis who reported having received seasonal vaccine had statistically significantly lower responses to the H5 antigen, which has led to concerns that receiving the seasonal vaccine first will somehow diminish response to the 2009-H1N1 influenza A vaccine. “Some of the studies that NIH is doing are directly addressing that question,” he said.
The CDC has taken several steps to address concerns about the 2009-H1N1 influenza A vaccine arising from the association of GBS with the 1976 swine influenza vaccine, according to Cox. First, they compared the HA and NA antigens of the New Jersey 1976 virus with those of the 2009-H1N1 influenza A
vaccine candidate at the nucleotide and the amino acid level, which they determined to differ by 11 and 8 percent, respectively. This is a significant difference, exceeding the genetic distance between the currently circulating H3N2 viruses and their 1975 predecessors, she said. More important, she noted that the CDC plans to conduct enhanced surveillance for GBS as well as for other adverse events associated with the 2009-H1N1 influenza A vaccine. “We certainly don’t want to focus exclusively on GBS,” Cox emphasized, “but we want to be able to capture adverse events [and] we want to know what the background rate is for the adverse events that we might expect, including other neurologic adverse events that are potentially associated with vaccines.” Thus, she continued, the CDC has coordinated with the FDA, the WHO, and other partners to enhance surveillance for adverse events temporally associated with vaccination. “We are trying to put in place plans to very rapidly investigate whether there might be a causal association if a signal is detected,” she explained.
In addition, Cox said, the CDC is “working very, very hard on communications, because we know how absolutely essential clear, transparent communications are to the public in order for us to have a successful vaccination campaign.” Nevertheless, as she and several other participants acknowledged, there will inevitably be fallout from the temporal association of the 2009-H1N1 influenza A immunization campaign with a variety of poor—but statistically insignificant—health outcomes, as has occurred for several effective vaccines in current use.
Treanor considered several technological innovations under investigation that could speed development of future pandemic vaccines. For example, he said, the 2009-H1N1 influenza A vaccine virus is currently being grown in experimental cell cultures, as well as in eggs. Treanor’s group has explored the expression of HA in insect cells under the control of a recombinant baculovirus in order to generate a subunit vaccine, which he said has properties similar to inactivated vaccine. An Australian company is currently testing a 2009-H1N1 influenza A subunit vaccine, according to Treanor, and they have also reported very vigorous responses to a single dose of recombinant hemagglutinin vaccine against 2009-H1N1 influenza A. It is also possible to express both the HA and the NA antigens along with M antigen38 in insect cells, to produce highly immunogenic virion-like particles, he said; similar approaches involve the decoration of phages with multiple antigens. HA can also be expressed, linked to flagellin in E. coli, to generate a functional antibody response, he reported. “The potential emergence of pandemic viruses has stimulated an enormous amount of product development,” Treanor concluded, including “an incredible number of ways of delivering vaccine antigens.”
Political, Legal, Ethical, and Public Considerations
Several workshop presentations and discussions addressed the social context of the public health response to the 2009-H1N1 influenza A pandemic, which extend from the global perspective of international law and politics to the ethics of clinical practice and its effects on individual patients, their families, and their care providers.
Pandemic influenza and global health governance In his keynote address, Fukuda observed that the International Health Regulations (IHR) provided a solid framework for global discussions of the 2009-H1N1 influenza A pandemic, which began with the detection of the first cases. This was an important goal of the IHR, the legal framework for global cooperation on infectious disease surveillance,39 following its fundamental revision in the aftermath of the SARS pandemic (IOM, 2007b; Stern and Markel, 2004; WHO, 2005a).
The 2009-H1N1 influenza A pandemic also arrived on the heels of a major challenge to the IHR, and to global public health governance in general. In 2006, Indonesia refused to share samples of the H5N1 avian influenza virus, collected within the country, with the WHO’s H5N1 influenza surveillance team (IOM, 2010). The Minister of Health pointed out that developing countries were not in a position to be able to access benefits from such viruses, such as vaccines, in the same way as developed countries and that this situation was inherently unfair and unacceptable. This general perspective was shared by many other countries. Claiming “viral sovereignty” over these samples, the country announced that it would not share them until the WHO and developed countries established an equitable means of sharing the benefits (e.g., vaccines and antiviral drugs) that could derive from viruses collected within its borders. Indonesia criticized the WHO’s practice of distributing influenza viruses it received for surveillance to pharmaceutical companies, which would make patented vaccines from such samples—vaccines that were often too costly for developing countries to purchase.
Proposals to use the IHR as a means to force Indonesia to share H5N1 virus samples for global surveillance purposes failed, because the IHR do not (1) require the sharing of biological samples, and (2) address inequitable access to the benefits derived from such samples, according to speaker David Fidler of Indiana University. Instead, WHO member states passed a resolution at the World Health Assembly in 2007 to initiate a series of intergovernmental meetings to discuss, debate, and develop a new framework for the sharing of influenza viruses and benefits derived from them. Fukuda reported that this intergovernmental process ended in 2009 without complete agreement due to the complexity and
fundamental nature of the issues surrounding this controversy. Nevertheless, he contended, it is both possible and essential to complete a framework to resolve these issues in a socially just and equitable way.
“In many ways this pandemic we are going through right now is the best case scenario,” Fukuda observed, noting its relative mildness and its onset in developed countries. “I don’t think this is the kind of situation that we can count on in the future.” He went on to observe that not only must the virus-sharing dispute be settled in order to promote global equity, justice, and solidarity, but also from a practical standpoint: when a severe pandemic emerges, the world needs to be ready to address it as a global public health threat, not a political conflict. If a worse scenario were to develop with higher rates of mortality and social disruption, it is less likely that developed countries would be willing to distribute vaccines to others as ad hoc donations, and any negotiations would likely be very time consuming, potentially reducing the attention given to ameliorating the pandemic. In the interim, the WHO will respond to the current pandemic by sharing the 150 million to 200 million doses of vaccine pledged to it by member countries and manufacturers. Fukuda reported that the WHO is actively engaged in ongoing negotiations to secure more vaccine and that the WHO plans to distribute vaccine first to health workers in the least-developed countries. The first shipments of vaccine donated by drug manufacturers to developing countries arrived in Mongolia on January 7, 2010, followed a few days later by shipments to Azerbaijan and Afghanistan. However, while the vaccine supply in developed countries is beginning to catch up with or exceed demand, none of the countries that pledged to donate vaccine have fulfilled that promise, including the United States (PBS, 2010).
Fidler, who presented a detailed analysis of the process and incentives for creating a global framework to share viruses and their benefits, observed that this endeavor faces many serious obstacles (see Fidler in Appendix A4). First among these are the skeptical views of such a framework that arise among foreign policy makers who wonder why—given global disparities in just about every other kind of health resources including clean water and adequate food—influenza vaccines and antiviral drugs should receive greater priority in terms of global equity, solidarity, and justice. Foreign policy makers may also worry that even if developing countries are given access to these medical resources, they will be wasted because of weak infrastructures in developing countries, or worse, misused, encouraging antiviral resistance.
Overcoming such skepticism and building an effective global access framework demands careful attention to political and legal considerations, Fidler stressed. On the legal side, he analyzed existing international health agreements and regimes (e.g., the IHR, the International Vaccine Institute) and how they might contribute to this goal, as well as other efforts that have increased access to vaccines and drugs for other diseases (e.g., the United Nations Children’s Fund [UNICEF]). According to Fidler, none of these approaches offered useful
models for a global network on increasing access to influenza vaccines. Turning to the creation and allocation of resources under international law more generally, Fidler noted that the main principle of resource allocation—sovereignty—presents a problem for strategies to share vaccines and drugs, which must address claims of sovereignty by parties in as many as three locations: where the virus strains are isolated, where vaccines or drugs are manufactured, and where vaccines and drugs are sold or exported.
Strategies and policies to create and share resources between countries are strongest, Fidler observed, when they serve the national interests of each state involved. However, Fidler observed that in a mild influenza pandemic, the incentive to share vaccine and antiviral medications is weak; conversely, in a severe pandemic, the incentive to hoard these resources is strong. Similarly, short-term epidemiological uncertainty—as has occurred during the present pandemic—creates incentives for states that likely will have access to vaccines and antivirals to preserve the status quo rather than risk losing resources they may need if the pandemic worsens.
In the face of long political and legal odds, under the “dark cloud” of the H5N1 virus-sharing controversy, and in recognition of the fact that a global access framework would need to be built “from the ground up,” Fidler offered the following components as a basis for constructing such a framework:
-
increased and geographically diversified global influenza vaccine production capacities;
-
increased and sustained interpandemic demand for seasonal influenza vaccines;
-
improved preparedness and response capabilities—perhaps through strengthened emphasis on IHR implementation;
-
accelerated research collaboration on new vaccine manufacturing techniques and other scientific issues (such as the use of adjuvants); and
-
clear “triggers” for pandemic alert levels.
The best model for constructing this framework is to use the IHR, which were recently revised to address emerging infectious diseases, Fidler said. He added, however, that “compared to the problem of equitable access to vaccines and antivirals, what was done with the IHR was picking the low-hanging fruit, [in the form of] information sharing.” The foundation of information sharing—which extends to an obligation to build surveillance and response capacity among all states party to the IHR—must underlie any global access framework, he insisted.
Forum member Terence Taylor emphasized that the breadth of the IHR represents an important strength that should not be compromised. In the case of virus sharing, Taylor stated, “we are being driven by a single disease category, which may not be necessarily helpful in trying to design the long-term, standing global framework.” Instead of basing global benefit sharing on influenza alone,
he continued, it might be better to construct a “network of networks” from existing regional agreements that address such public health issues as foodborne and waterborne diseases and drug distribution. Countries involved in regional efforts “have already bought into cooperation,” Fidler agreed. “You should take advantage of that.”
Asserting that benefit access is “really more a political issue than it is a legal framework issue,” Fukuda observed that improving global access to viruses and their products should permit swift action to decrease uncertainty as to whether a potential pandemic will be mild or severe. “The enlightened self-interest is what do you do to reduce that uncertainty, because everyone needs it reduced to move quickly enough to keep up with fast moving disease events,” he said, which involves concrete steps—such as acquiring information necessary to predicting a pandemic’s impact—to reduce the harm to one’s country. “Before you get to any legal framework, you have to have the political interests lined up,” Fidler responded. “The deal here obviously is the continued flow of information in return for response capacities, whether that is vaccines themselves or whether it is technology.” In the case of the H5N1 negotiations, such a deal has yet to be made for lack of political incentives, he concluded, which demonstrates the difficulties of constructing the broader global framework for access to influenza vaccines envisioned by Fukuda.
Ethical issues in clinical care The ethical principles guiding clinical care during public health emergencies also underlie the granting of extraordinary powers to government officials under the same circumstances, according to speaker Bernard Lo of the University of California, San Francisco (see Appendix A8). Several extraordinary things can happen during public health emergencies, he observed: critical medical resources are in short supply; essential services, such as public safety, are threatened; core social needs, such as the provision of adequate food and shelter, are not adequately met. In the aftermath of Hurricane Katrina, when such conditions led to chaos in New Orleans, many states granted public health officials emergency powers in an attempt to avoid a similar fate, he noted.
Lo articulated the following basic, ethical principles that govern actions during emergencies by public health officials:
-
Provide benefit to the population as whole, not to individual patients; allocate resources prudently.
-
When individual liberty and autonomy must be overridden, choose the least restrictive alternatives and ensure procedural due process.
-
Create fair policies and procedures that treat people in similar situations similarly, without favoritism or discrimination; distribute benefits and burdens fairly (e.g., protect those whose work benefits society but puts them at risk).
-
Maintain duty to care to the extent possible; accept personal risk.
Lo also observed that these principles differ significantly from those of the allocation of scarce resources in the absence of critical shortages: “first come, first served;” the ability to pay; and patients’ informed choices.
When health care resources are severely limited—for example, as ventilators might be in a severe influenza pandemic—they might be triaged, or rationed, with highest priority, as defined by Lo, going to one of the following groups:
-
Those in greatest need. This rationale is used in emergency departments (EDs), but it means resources will be used on patients with poor prognoses; when applied to immunization, 2009-H1N1 influenza A vaccines would go first to pregnant women and infants; for antiviral medications, post-exposure prophylaxis for people with compromised immunity and/or living in residential settings.
-
Those who would benefit most from care. This would maximize the number of lives saved.
-
Those whose work is of instrumental value to the community. This would favor medical and public safety personnel, who would risk seeming self-serving if they made such a decision.
-
Those whose work puts them at increased risk for infection.
The dilemma public officials face in choosing among these potentially conflicting priorities, and applying one of them in an emergency, might be further complicated by a lack of belief in government’s trustworthiness and competence that is widespread in the United States, Lo observed. This may be accompanied to a large extent by distrust of scientific expertise as well.
Lo offered several pragmatic suggestions for developing policies to address ethical issues in an emergency, such as the allocation of life support measures (White et al., 2009). Such policies should be established in advance of need and in consultation with the public, he said. It is particularly important to include vulnerable populations in these discussions, he added, and to ensure that all stakeholders understand the risks of an uncoordinated response to an emergency. Emergency policies should reflect a shared vision of the kind of nation we aspire to be, Lo continued, expressing values we hold in common and embodying the proper role of government. Once established, ethical policies for emergencies should be supported by a focused, consistent media campaign that clarifies both the reasoning behind the policies and the expectations they engender, and which anticipates and responds to public concerns and objections.
When asked how these general principles and suggestions might be translated into specific guidance for hospitals and public health officials at the local level, Lo insisted that robust guidance is founded on a broad understanding of the role of government and the notion of placing public good ahead of any individual’s welfare. People will object to making personal sacrifices in emergencies unless
they grasp this broader vision, he said; when they do, extraordinary heroism often happens. We need to be able to tap into that generosity and altruism first, he said, then build policies around it.
Allocation of healthcare resources is very likely to occur in some U.S. communities during this pandemic, Osterholm said. “I think that if we see even a 20 percent increase in severe cases in many of our communities, we may outstrip our intensive care capabilities and allocation of critical medical equipment and supplies will be necessary,” he predicted. “I don’t think people yet get that because 2009-H1N1 influenza A infection isn’t a severe disease for most of the population.” With hospitals operating at near-full capacity, a shortage in ventilators during a severe influenza pandemic is a likely scenario, Lo agreed. “This situation of a dire shortage of ventilators … is the most poignant and dramatic case, because you have an individual who is critically ill and who without ventilatory support is highly likely to die,” he said. Some have argued that these “identified victims” create dilemmas too painful to be resolved publicly, Lo observed. But, he insisted, such decisions must be public, and predicated on full explanations, or public support for emergency health measures will be severely undermined.
Public communication Cetron, Cox, Lo, and several other workshop participants observed that keeping the public informed about the 2009-H1N1 influenza A pandemic as it developed was one of the most difficult tasks they faced. Goodman cautioned that polarized, “black and white” thinking—“2009-H1N1 influenza A is a scourge or it’s nothing”; “vaccines are perfect or dangerous”—stood in the way of clear communication. Goodman went on to stress that finding ways to get past such polarizing ideas and transparently explain uncertainties to the public was essential for establishing the credibility of science and the government in these matters, and thereby gaining public confidence in the pandemic response.
One aspect of this polarized thinking concerned the pandemic scale adopted by the WHO, which was based solely on the geographic spread of disease but was frequently misinterpreted as indicating disease severity. Recent pandemic plans reflected the severity of the threat posed by H5N1, which was appropriate, Fukuda observed, but it was difficult for countries to adjust to a pandemic influenza that was milder than expected. It was especially problematic to communicate this situation to the public without either overstating or understating the significance of 2009-H1N1 influenza A to public health, he noted. “In retrospect, it is very clear that [progressing] from three to four to five and then six was not seen as changes in levels of preparedness … [but instead as] … going up the scale in terms of severity and alarm,” Fukuda observed. “This is something that I do regret that we could not make this clear enough, and it is something that we’ll have to revisit.”
In the meantime, Goodman of the FDA urged, it is important to prepare for “worst-case” pandemic scenarios, while responding only to what is actually happening—and for the public to recognize and support these efforts. Over the
long term, he said, this will require greater capacity and expertise in scientific communication. Ultimately, the truth must be told, and uncertainties must be identified as such, he continued. Likening false rumors—such as those that circulate on the Internet regarding vaccine safety—to PCR false positives, Goodman observed that both amplified quickly and led to bad decisions. “How we monitor and respond [to these situations] is critical,” he concluded.
Local Perspectives
Speakers Jeffrey Duchin, of the Seattle-King County Department of Health, and Annie Fine, of the New York City Department of Health, reflected on their experiences and those of their departments and cities during the spring wave of the 2009-H1N1 influenza A pandemic and discussed their preparations for the anticipated fall upsurge of influenza activity. Their accounts featured several common elements, as well as a common theme: an under-supported, overloaded public health system. Duchin and Fine reported that:
-
Their departments quickly shifted from case-counting to syndromic surveillance of ILI (along with population surveillance, in New York City).
-
They received conflicting and confusing clinical guidance from the CDC, the WHO, and professional organizations.
-
Their EDs were overwhelmed with the mildly and severely ill, along with the “worried well.”
-
Supply chains for antivirals and N95 masks were fragile and unpredictable.
-
School closures proved of limited use in reducing the surge in illness.
-
Public messaging was a daunting challenge that will only become more difficult with the arrival of the 2009-H1N1 influenza A vaccine.
Duchin provided a detailed description of public health under siege, due to the near-simultaneous arrival of pandemic influenza and economic recession (see Duchin in Appendix A3). “We needed over 200 staff and 40 volunteers for our outbreak response,” he recalled. “On our epi team alone, we required … 41 unique surge staff and 2,500 hours of work. We received about 1,600 calls from healthcare providers alone, not including the public, over the first six weeks,” he continued. “Of course we don’t have enough staff for shift work like most emergency operation centers, and this resulted in a lot of stress on our staff,” he said, many of whom subsequently received layoff notices, withheld during the outbreak, due to budget cuts.
However, he said, some things did go right. “We certainly had a better response than we did during SARS,” he observed, adding that facilities that had made a pandemic plan found it to be useful in managing the 2009-H1N1 influenza A. A regional healthcare coalition expedited the surge response in large healthcare facilities and enabled good communication among hospitals and
between the hospitals and the public health department, he said. “We were at least able to help the hospitals manage their scarce resources by loaning to one another, and they were coordinated with the public health response,” Duchin concluded. He also described Tamiflu® clinics and a call center as particularly useful elements of the public health response.
In New York City, Fine reported that, based on their experience during the spring, the public health department modified several aspects of their surge strategy in order to better manage the anticipated return of 2009-H1N1 influenza A in the fall of 2009. The New York City Department of Health and Mental Hygiene (NYCDOH) would not conduct case-based surveillance but would, instead, continue syndromic surveillance; monitor trends in overall incidence, clinical and epidemiological risk factors, and pathogens; conduct monthly population surveys by telephone; use sentinel hospitals and a primary care network for limited intensive in-patient surveillance; and match laboratory-confirmed cases with registered deaths to determine the number of confirmed influenza deaths.
After hospitals coped with a series of problems not anticipated in their surge plans, her department instituted a series of changes, Fine said. They have reviewed all hospital surge plans and have provided hospitals with guidance on suggested practices in addressing the resurgence of 2009-H1N1 influenza A. After localized shortages occurred during the spring wave, antiviral medications have been made more accessible. Hospitals were requested to activate their incident command systems in mid-September, as schools returned to session. Protocols for using Medical Reserve Corps volunteers remained under consideration but could involve training and preselecting volunteers to work if needed.
To ease pressure on EDs, New York City has established about 100 flu diagnostic and treatment centers that will treat all patients, regardless of their usual source of care or insurance status, Fine said. The clinics will be open evenings and weekends, and will offer seasonal and pandemic vaccines as well as antivirals, should they become unavailable through the commercial sector. Local physicians and health care workers will also receive guidance encouraging them to discuss and prescribe antivirals early for their high-risk patients, in order to ensure access.
Based on his experience during the spring wave of the H1N1 influenza pandemic Duchin called for more vigorous efforts to get antivirals to high-risk individuals. “With the sudden rise and the rapid transmission you can’t expect patients to get to their physicians, get diagnosed, get to the pharmacy, and get their drug in the time frame that you really want that to happen,” he asserted. Moreover, he stated, pharmacies do not maintain their stocks, so even if in theory there is no shortage, there are times when antivirals are locally unavailable. “I think we have to be very aggressive about getting the message out that high-risk patients, pregnant women for example, should have Tamiflu® … now, not wait until they need it when the outbreak is hitting in the community,” he concluded, adding that he would extend that recommendation to other high-risk people.
The tireless efforts demonstrated by Duchin, Fine, and their departments in the face of this pandemic should not obscure the fact that “local public health capacity to respond to H1N1 and other large-scale health emergencies is tenuous and unstable,” as Duchin has observed. Indeed, perhaps the most important lesson learned from the domestic and international public health community’s experiences with the 2009-H1N1 influenza A pandemic is, in his words, that “inadequate long-term sustainable funding for both core public health and health emergency preparedness undermines the ability of local communities to adequately prepare for and respond to large scale health emergencies of any type.”
WORKSHOP OVERVIEW REFERENCES
Andreasen, V., C. Viboud, and L. Simonsen. 2008. Epidemiologic characterization of the 1918 influenza pandemic summer wave in Copenhagen: implications for pandemic control strategies. Journal of Infectious Diseases 197(2):270-278.
Australian Government, Department of Health and Aging. 2010. Australian influenza surveillance 2010—latest report, http://www.healthemergency.gov.au/internet/healthemergency/publishing.nsf/Content/ozflucurrent.htm (accessed January 14, 2010).
Bertozzi, S., A. Kelso, M. Tashiro, V. Savy, J. Farrar, M. Osterholm, S. Jameel, and C. P. Muller. 2009. Pandemic flu: from the front lines. Nature 461(7260):20-21.
Bridges, C. B., W. Lim, J. Hu-Primmer, L. Sims, K. Fukuda, K. H. Mak, T. Rowe, W. W. Thompson, L. Conn, X. Lu, N. J. Cox, and J. M. Katz. 2002. Risk of influenza A (H5N1) infection among poultry workers, Hong Kong, 1997-1998. Journal of Infectious Diseases 185(8):1005-1010.
Brownstein, J. S., C. C. Freifeld, and L. C. Madoff. 2009. Digital disease detection—harnessing the Web for public health surveillance. New England Journal of Medicine 360(21):2153-2155, 2157.
Buenos Aires Herald. 2009. Nationwide alert: Argentina declares health emergency, flu found in pigs, http://www.buenosairesherald.com/BreakingNews/View/6666 (accessed August 21, 2009).
Bustamante, J. 2009. Argentina confirms first H1N1 flu case, http://www.reuters.com/article/latestCrisis/idUSN07423083 (accessed August 21, 2009).
Cauchemez, S., N. M. Ferguson, C. Wachtel, A. Tegnell, G. Saour, B. Duncan, and A. Nicoll. 2009. Closure of schools during an influenza pandemic. Lancet Infectious Diseases 9(8):473-481.
CDC (Centers for Disease Control and Prevention). 2009a. CDC guidance for state and local public health officials and school administrators for school (K-12) responses to influenza during the 2009-2010 school year, http://www.cdc.gov/h1n1flu/schools/schoolguidance.htm (accessed November 3, 2009).
———. 2009b. Novel H1N1 flu: facts and figures, http://www.cdc.gov/h1n1flu/surveillanceqa.htm (accessed November 3, 2009).
———. 2009c. Oseltamivir-resistant 2009 pandemic influenza A (H1N1) virus infection in two summer campers receiving prophylaxis—North Carolina, 2009. Morbidity and Mortality Weekly Report 58(35):969-972.
———. 2009d. Serum cross-reactive antibody response to a novel influenza A (H1N1) virus after vaccination with seasonal influenza vaccine. Morbidity and Mortality Weekly Report 58(19):521-524.
———. 2009e. Swine influenza A (H1N1) infection in two children—Southern California, March-April 2009. Morbidity and Mortality Weekly Report 58(15):400-402.
———. 2009f. Update: novel influenza A (H1N1) virus infection—Mexico, March-May, 2009. Morbidity and Mortality Weekly Report 58(21):585-589.
———. 2009g. Updated interim recommendations for the use of antiviral medications in the treatment and prevention of influenza for the 2009-2010 season, http://www.cdc.gov/h1n1flu/recommendations.htm (accessed November 3, 2009).
———. 2009h. Antiviral treatment options, including intravenous peramivir, for treatment of influenza in hospitalized patients for the 2009-2010 season, http://www.cdc.gov/H1N1flu/EUA/Peramivir_recommendations.htm (accessed November 18, 2009).
———. 2009i. 2009-2010 influenza season week 52 ending January 2, 2010, http://www.cdc.gov/flu/weekly/ (accessed January 14, 2010).
———. 2010. 2009-2010 influenza season week 8 ending February 27, 2010. FluView, http://www.cdc.gov/flu/weekly/weeklyarchives2009-2010/weekly08.htm (accessed March 15, 2010).
Childs, R. A., A. S. Palma, S. Wharton, T. Matrosovich, Y. Liu, W. Chai, M. A. Campanero-Rhodes, Y. Zhang, M. Eickmann, M. Kiso, A. Hay, M. Matrosovich, and T. Feizi. 2009. Receptor-binding specificity of pandemic influenza A (H1N1) 2009 virus determined by carbohydrate microarray. Nature Biotechnology 27(9):797-799.
CIDRAP (Center for Infectious Disease Research and Policy). 2009. Pandemic influenza, http://www.cidrap.umn.edu/cidrap/content/influenza/panflu/biofacts/panflu.html (accessed November 3, 2009).
Cox, N. 2009. Detection and characterization of and response to the emergence of 2009 H1N1 viruses. Presentation given at the September 15-16, 2009 public workshop “The domestic and international impacts of the 2009 influenza A H1N1 pandemic: global challenges, global solutions,” Forum on Microbial Threats, Institute of Medicine, Washington, DC.
Daszak, P. 2009a. A call for “smart surveillance”: a lesson learned from H1N1. EcoHealth 6(1):1-2.
———. 2009b. Ecological factors to understanding influenza risk. Presentation given at the September 15-16, 2009 public workshop “The domestic and international impacts of the 2009 influenza A H1N1 pandemic: global challenges, global solutions,” Forum on Microbial Threats, Institute of Medicine, Washington, DC.
Ely, B. 1999. Infectious salmon anaemia. Mill Hill Essays. National Institute for Medical Research, http://www.nimr.mrc.ac.uk/MillHillEssays/1999/isa.htm (accessed November 18, 2009).
Englund, J., D. Zerr, J. Heath, S. Pergam, J. Kuypers, J. Yager, M. Boeckh, D. Mattson, N. Whittington, E. Whimbey, J. Duchin, T. Uyeki, V. Deyde, M. Okomo-Adhiambo, T. Sheu, A. Trujillo, A. Klimov, L. Gubareva, and M. Kay. 2009. Oseltamivir-resistant novel influenza A (H1N1) virus infection in two immunosuppressed patients—Seattle, Washington, 2009. Morbidity and Mortality Weekly Report 58(32):893-896.
Fedson, D. S. 2009. Confronting the next influenza pandemic with anti-inflammatory and immunomodulatory agents: why they are needed and how they might work. Influenza and Other Respiratory Viruses 3(4):129-142.
Ferguson, N. M., D. A. Cummings, S. Cauchemez, C. Fraser, S. Riley, A. Meeyai, S. Iamsirithaworn, and D. S. Burke. 2005. Strategies for containing an emerging influenza pandemic in Southeast Asia. Nature 437(7056):209-214.
Fineberg, H. V., and M. E. Wilson. 2009. Epidemic science in real time. Science 324(5930):987.
Fukuda, K. 2009. 2009 (H1N1) pandemic lessons for going forward. Presentation given at the September 15-16, 2009 public workshop “The domestic and international impacts of the 2009 influenza A H1N1 pandemic: global challenges, global solutions,” Forum on Microbial Threats, Institute of Medicine, Washington, DC.
Garske, T., J. Legrand, C. A. Donnelly, H. Ward, S. Cauchemez, C. Fraser, N. M. Ferguson, and A. C. Ghani. 2009. Assessing the severity of the novel influenza A/H1N1 pandemic. British Medical Journal 339:b2840.
Gilbert, M., X. Xiao, D. U. Pfeiffer, M. Epprecht, S. Boles, C. Czarnecki, P. Chaitaweesub, W. Kalpravidh, P. Q. Minh, M. J. Otte, V. Martin, and J. Slingenbergh. 2008. Mapping H5N1 highly pathogenic avian influenza risk in Southeast Asia. Proceedings of the National Academy of Sciences 105(12):4769-4774.
Ginsberg, J., M. H. Mohebbi, R. S. Patel, L. Brammer, M. S. Smolinski, and L. Brilliant. 2009. Detecting influenza epidemics using search engine query data. Nature 457(7232):1012-1014.
Goldstein, E., J. C. Miller, J. O’Hagan, and M. Lipsitch. 2009. Predispensing of antivirals to high-risk individuals in an influenza pandemic. Version 4. PLoS Currents Influenza, http://knol.google.com/k/edward-goldstein/predispensing-of-antivirals-to-high/1uji2pldf66z5/1# (accessed November 3, 2009).
Greenberg, M. E., M. H. Lai, G. F. Hartel, C. H. Wichems, C. Gittleson, J. Bennet, G. Dawson, W. Hu, C. Leggio, D. Washington, and R. L. Basser. 2009. Response after one dose of a monovalent influenza A (H1N1) 2009 vaccine—preliminary report. New England Journal of Medicine 361(25):2405-2413.
Gubler, D. J. 1998. Resurgent vector-borne diseases as a global health problem. Emerging Infectious Diseases 4(3):442-450.
Han, K., X. Zhu, F. He, L. Liu, L. Zhang, H. Ma, X. Tang, T. Huang, G. Zeng, and B.-P. Zhu. 2009. Lack of airborne transmission during outbreak of pandemic (H1N1) 2009 among tour group members, China, June 2009. Emerging Infectious Diseases 15(10):1578-1581.
Hancock, K., V. Veguilla, X. Lu, W. Zhong, E. N. Butler, H. Sun, F. Liu, L. Dong, J. R. Devos, P. M. Gargiullo, T. L. Brammer, N. J. Cox, T. M. Tumpey, and J. M. Katz. 2009. Cross-reactive antibody responses to the 2009 pandemic H1N1 influenza virus. New England Journal of Medicine 361(20):1945-1952.
Hanshaoworakul, W., J. M. Simmerman, U. Narueponjirakul, W. Sanasuttipun, V. Shinde, S. Kaewchana, D. Areechokechai, J. Levy, and K. Ungchusak. 2009. Severe human influenza infections in Thailand: oseltamivir treatment and risk factors for fatal outcome. PLoS One 4(6):e6051.
Harvard School of Public Health. 2009. National survey finds six in ten Americans believe serious outbreak of influenza A (H1N1) likely in fall/winter, http://www.hsph.harvard.edu/news/press-releases/2009-releases/national-survey-americans-influenza-a-h1n1-outbreak-fall-winter.html (accessed November 3, 2009).
Hayden, F. 2009. Developing new antiviral agents for influenza treatment: what does the future hold? Clinical Infectious Diseases 48(Suppl 1):S3-S13.
Henderson, D. A., B. Courtney, T. V. Inglesby, E. Toner, and J. B. Nuzzo. 2009. Public health and medical responses to the 1957-58 influenza pandemic. Biosecurity and Bioterrorism 7(3):265-273.
HHS (Department of Health and Human Services). 2007. Community strategy for pandemic influenza mitigation, http://www.flu.gov/professional/community/commitigation.html (accessed November 6, 2009).
Hufnagel, L., D. Brockmann, and T. Geisel. 2004. Forecast and control of epidemics in a globalized world. Proceedings of the National Academy of Sciences 101(42):15124-15129.
IOM (Institute of Medicine). 2003. Microbial threats to health: emergence, detection, and response. Washington, DC: The National Academies Press.
———. 2004. Learning from SARS. Washington, DC: The National Academies Press.
———. 2005. The threat of pandemic influenza. Washington, DC: The National Academies Press.
———. 2007a. Ethical and legal considerations in mitigating pandemic disease. Washington, DC: The National Academies Press.
———. 2007b. Global infectious disease surveillance and detection. Washington, DC: The National Academies Press.
———. 2010. Infectious disease movement in a borderless world. Washington, DC: The National Academies Press.
Itoh, Y., K. Shinya, M. Kiso, T. Watanabe, Y. Sakoda, M. Hatta, Y. Muramoto, D. Tamura, Y. Sakai-Tagawa, T. Noda, S. Sakabe, M. Imai, Y. Hatta, S. Watanabe, C. Li, S. Yamada, K. Fujii, S. Murakami, H. Imai, S. Kakugawa, M. Ito, R. Takano, K. Iwatsuki- Horimoto, M. Shimojima, T. Horimoto, H. Goto, K. Takahashi, A. Makino, H. Ishigaki, M. Nakayama, M. Okamatsu, D. Warshauer, P. A. Shult, R. Saito, H. Suzuki, Y. Furuta, M. Yamashita, K. Mitamura, K. Nakano, M. Nakamura, R. Brockman-Schneider, H. Mitamura, M. Yamazaki, N. Sugaya, M. Suresh, M. Ozawa, G. Neumann, J. Gern, H. Kida, K. Ogasawara, and Y. Kawaoka. 2009. In vitro and in vivo characterization of new swine-origin H1N1 influenza viruses. Nature 460(7258):1021-1025.
Jain, S., L. Kamimoto, A. M. Bramley, A. M. Schmitz, S. R. Benoit, J. Louie, D. E. Sugerman, J. K. Druckenmiller, K. A. Ritger, R. Chugh, S. Jasuja, M. Deutscher, S. Chen, J. D. Walker, J. S. Duchin, S. Lett, S. Soliva, E. V. Wells, D. Swerdlow, T. M. Uyeki, A. E. Fiore, S. J. Olsen, A. M. Fry, C. B. Bridges, L. Finelli, and 2009 Pandemic Influenza A (H1N1) Virus Hospitalizations Investigation Team. 2009. Hospitalized patients with 2009 H1N1 influenza in the United States, April-June 2009. New England Journal of Medicine 361(20):1935-1944.
Jamieson, D. J., M. A. Honein, S. A. Rasmussen, J. L. Williams, D. L. Swerdlow, M. S. Biggerstaff, S. Lindstrom, J. K. Louie, C. M. Christ, S. R. Bohm, V. P. Fonseca, K. A. Ritger, D. J. Kuhles, P. Eggers, H. Bruce, H. A. Davidson, E. Lutterloh, M. L. Harris, C. Burke, N. Cocoros, L. Finelli, K. F. MacFarlane, B. Shu, and S. J. Olsen. 2009. H1N1 2009 influenza virus infection during pregnancy in the USA. Lancet 374(9688):451-458.
Jones, K. E., N. G. Patel, M. A. Levy, A. Storeygard, D. Balk, J. L. Gittleman, and P. Daszak. 2008. Global trends in emerging infectious diseases. Nature 451(7181):990-993.
Jones, L. D., and P. A. Nuttall. 1989. Non-viraemic transmission of Thogoto virus: influence of time and distance. Transactions of the Royal Society of Tropical Medicine and Hygiene 83(5):712-714.
Kawaoka, Y. 2009. Influenza pandemic 2009. Presentation given at the September 15-16, 2009 public workshop “The domestic and international impacts of the 2009 influenza A H1N1 pandemic: global challenges, global solutions,” Forum on Microbial Threats, Institute of Medicine, Washington, DC.
Khan, K., J. Arino, W. Hu, P. Raposo, J. Sears, F. Calderon, C. Heidebrecht, M. Macdonald, J. Liauw, A. Chan, and M. Gardam. 2009. Spread of a novel influenza A (H1N1) virus via global airline transportation. New England Journal of Medicine 361(2):212-214.
Kidd, I. M., J. Down, E. Nastouli, R. Shulman, P. R. Grant, D. C. Howell, and M. Singer. 2009. H1N1 pneumonitis treated with intravenous zanamivir. Lancet 374(9694):1036.
Kilpatrick, A. M., A. A. Chmura, D. W. Gibbons, R. C. Fleischer, P. P. Marra, and P. Daszak. 2006a. Predicting the global spread of H5N1 avian influenza. Proceedings of the National Academy of Sciences 103(51):19368-19373.
Kilpatrick, A. M., L. D. Kramer, M. J. Jones, P. P. Marra, and P. Daszak. 2006b. West Nile virus epidemics in North America are driven by shifts in mosquito feeding behavior. PLoS Biology 4(4):e82.
Lee, N., C. S. Cockram, P. K. S. Chan, D. S. C. Hui, K. W. Choi, and J. J. Y. Sung. 2008. Antiviral treatment for patients hospitalized with severe influenza infection may affect clinical outcomes. Clinical Infectious Diseases 46(8):1323-1324.
Lipsitch, M. 2009. Epidemiology of pH1N1: narrow ing the uncertainty. Presentation given at the September 15-16, 2009 public workshop “The domestic and international impacts of the 2009 influenza A H1N1 pandemic: global challenges, global solutions,” Forum on Microbial Threats, Institute of Medicine, Washington, DC.
Lipsitch, M., S. Riley, S. Cauchemez, A. C. Ghani, and N. M. Ferguson. 2009. Managing and reducing uncertainty in an emerging influenza pandemic. New England Journal of Medicine 361(2):112-115.
Loeb, M., N. Dafoe, J. Mahony, M. John, A. Sarabia, V. Glavin, R. Webby, M. Smieja, D. J. D. Earn, S. Chong, A. Webb, S. D. Walter. 2009. Surgical mask vs N95 respirator for preventing influenza among health care workers: a randomized trial. Journal of the American Medical Association 302(17):1865-1871.
Lopez, L., and S. Huang. 2009. Influenza weekly update, http://www.surv.esr.cri.nz/PDF_surveillance/Virology/FluWeekRpt/2009/FluWeekRpt200934.pdf (accessed December 17, 2009).
Louie, J., K. Winter, K. Harriman, D. Vugia, C. Glaser, B. Matyas, D. Schnurr, H. Guevara, C. Y. Pan, E. Saguar, R. Berumen, E. Hunley, S. Messenger, C. Preas, D. Hatch, G. Chavez, P. Kriner, K. Lopez, D. Sunega, D. Rexin, S. Roach, J. Kempf, R. Gonzalez, L. Morgan, N. Barnes, L. Berman, S. Emery, B. Shu, K. H. Wu, J. Villanueva, S. Lindstrom, D. Sugarman, M. Patel, J. Jaeger, E. Meites, and N. Dharan. 2009a. Hospitalized patients with novel influenza A (H1N1) virus infection—California, April-May, 2009. Morbidity and Mortality Weekly Report 58(19):536-541.
Louie, J., C. Jean, T.- H. Chen, S. Park, R. Ueki, T. Harper, E. Chmara, J. Myers, R. Stoppacher, C. Catanese, N. Farley, E. Leis, C. DiAngelo, A. M. Fry, L. Finelli, M. G. Carvalho, B. Beall, M. Moore, C. Whitney, and D. M. Blau. 2009b. Bacterial coinfections in lung tissue specimens from fatal cases of 2009 pandemic influenza A (H1N1)—United States, May-August 2009. Morbidity and Mortality Weekly Report 58(early release):1-4.
Luke, T. C., E. M. Kilbane, J. L. Jackson, and S. L. Hoffman. 2006. Meta-analysis: convalescent blood products for Spanish influenza pneumonia: a future H5N1 treatment? Annals of Internal Medicine 145(8):599-609.
Mangtani, P., T. K. Mak, and D. Pfeifer. 2009. Pandemic H1N1 infection in pregnant women in the USA. Lancet 374(9688):429-430.
Markel, H., H. B. Lipman, J. A. Navarro, A. Sloan, J. R. Michalsen, A. M. Stern, and M. S. Cetron. 2007. Nonpharmaceutical interventions implemented by US cities during the 1918-1919 influenza pandemic. Journal of the American Medical Association 298(6):644-654.
Mawudeku, A., M. Ruben, and B. Lemay. 2007. Global public health surveillance: the role of non-traditional surveillance tools. In Global infectious disease surveillance and detection: assessing the challenges, finding solutions, S. M. Lemon, M. A. Hamburg, P. F. Sparling, E. R. Choffnes, and A. Mack, rapporteurs. Washington, DC: The National Academies Press.
McGeer, A., K. A. Green, A. Plevneshi, A. Shigayeva, N. Siddiqi, J. Raboud, and D. E. Low. 2007. Antiviral therapy and outcomes of influenza requiring hospitalization in Ontario, Canada. Clinical Infectious Diseases 45(12):1568-1575.
Mills, C. E., J. M. Robins, and M. Lipsitch. 2004. Transmissibility of 1918 pandemic influenza. Nature 432(7019):904-906.
Morens, D. M., J. K. Taubenberger, and A. S. Fauci. 2009. The persistent legacy of the 1918 influenza virus. New England Journal of Medicine 361(3):225-229.
Morse, S. S. 2007. Global infectious disease surveillance and early warning systems: ProMED and ProMED-mail. In Global infectious disease surveillance and detection: assessing the challenges, finding solutions, S. M. Lemon, M. A. Hamburg, P. F. Sparling, E. R. Choffnes, and A. Mack, rapporteurs. Washington, DC: The National Academies Press.
Munayco, C. V., J. Gomez, V. A. Laguna-Torres, J. Arrasco, T. J. Kochel, V. Fiestas, J. Garcia, J. Perez, I. Torres, F. Condori, H. Nishiura, and G. Chowell. 2009. Epidemiological and transmissibility analysis of influenza A(H1N1)v in a Southern Hemisphere setting: Peru. Eurosurveillance 14(32), http://www.eurosurveillance.org/images/dynamic/EE/V14N32/art19299.pdf (accessed November 3, 2009).
Munster, V. J., E. de Wit, J. M. van den Brand, S. Herfst, E. J. Schrauwen, T. M. Bestebroer, D. van de Vijver, C. A. Boucher, M. Koopmans, G. F. Rimmelzwaan, T. Kuiken, A. D. Osterhaus, and R. A. Fouchier. 2009. Pathogenesis and transmission of swine-origin 2009 A(H1N1) influenza virus in ferrets. Science 325(5939):481-483.
Napolitano, L. M., P. K. Park, K. C. Sihler, T. Papadimos, C. Chenoweth, S. Cinti, C. Zalewski, R. Sharangpani, P. Somsel, E. Wells, A. M. Fry, A. E. Fiore, J. M. Villanueva, S. Lindstrom, and T. M. Uyeki. 2009. Intensive-care patients with severe novel influenza A (H1N1) virus infection—Michigan, June 2009. Morbidity and Mortality Weekly Report 58(27):749-752.
Nelson, M. I., L. Simonsen, C. Viboud, M. A. Miller, and E. C. Holmes. 2007. Phylogenetic analysis reveals the global migration of seasonal influenza A viruses. PLoS Pathogens 3(9):1220-1228.
Nelson, M. I., C. Viboud, L. Simonsen, R. T. Bennett, S. B. Griesemer, K. St George, J. Taylor, D. J. Spiro, N. A. Sengamalay, E. Ghedin, J. K. Taubenberger, and E. C. Holmes. 2008. Multiple reassortment events in the evolutionary history of H1N1 influenza A virus since 1918. PLoS Pathogens 4(2):e1000012.
Neumann, G., T. Noda, and Y. Kawaoka. 2009. Emergence and pandemic potential of swine-origin H1N1 influenza virus. Nature 459(7249):931-939.
Neustadt, R. E., and H. V. Fineberg. 1978. The swine flu affair: decision-making on a slippery disease. Honolulu, HI: University Press of the Pacific.
Noble, G. R. 1982. Epidemiological and clinical aspects of influenza. In Basic and applied influenza research, edited by A. S. Beare. Boca Raton, FL: CRC Press. Pp. 11-50.
Pandemic Plan. 2005. H5N1 history: emergence of the influenza A H5N1 subtype (1997-2005), http://reports.typepad.com/pandemic_plan/2005/12/h5n1_history.html (accessed November 4, 2009).
PBS (Public Broadcasting System). 2009. Introduction: Influenza 1918, http://www.pbs.org/wgbh/americanexperience/influenza/introduction (accessed January 11, 2010).
———. 2010. H1N1 vaccine reaching poorer nations as flu fears continue to wane, http://www.pbs.org/newshour/updates/north_america/jan-june10/flu_01-07.html (accessed January 27, 2010).
PCAST (President’s Council of Advisors on Science and Technology). 2009. Report to the President on U.S. preparations for 2009-H1N1 influenza. Washington, DC: Office of Science and Technology Policy.
Pourbohloul, B., A. Ahued, B. Davoudi, R. Meza, L. A. Meyers, D. M. Skowronski, I. Villasenor, F. Galvan, P. Cravioto, D. J. Earn, J. Dushoff, D. Fisman, W. J. Edmunds, N. Hupert, S. V. Scarpino, J. Trujillo, M. Lutzow, J. Morales, A. Contreras, C. Chavez, D. M. Patrick, and R. C. Brunham. 2009. Initial human transmission dynamics of the pandemic (H1N1) 2009 virus in North America. Influenza and Other Respiratory Viruses 3(5):215-222.
Presanis, A. M., D. De Angelis, The New York City Swine Flu Investigation Team, A. Hagy, C. Reed, S. Riley, B. S. Cooper, L. Finelli, P. Biedrzycki, and M. Lipsitch. 2009. The severity of pandemic H1N1 influenza in the United States, from April to July 2009: a Bayesian analysis. PLoS Medicine 6(12):e1000207.
Presti, R. M., G. Zhao, W. L. Beatty, K. A. Mihindukulasuriya, A. P. A. Travassos da Rosa, V. L. Popov, R. B. Tesh, H. W. Virgin, and D. Wang. 2009. Quaranfil, Johnston Atoll, and Lake Chad viruses are novel members of the family orthomyxoviridae. Journal of Virology 83(22):11599-11606.
ProMED-mail. 2009a. Influenza pandemic (H1N1) 2009 (16): Argentina, Sequencing, http://www.promedmail.org/pls/otn/f?p=2400:1001:298185261489014::NO::F2400_P1001_BACK_PAGE,F2400_P1001_PUB_MAIL_ID:1004,78457 (accessed August 21, 2009).
———. 2009b. Influenza pandemic (H1N1) 2009 (07): Argentina, swine, alert, http://www.promed-mail.org/pls/otn/f?p=2400:1001:57555::NO::F2400_P1001_BACK_PAGE,F2400_P1001_PUB_MAIL_ID:1400,78398 (accessed August 21, 2009).
Raynard, R. S., A. G. Murray, and A. Gregory. 2001. Infectious salmon anaemia virus in wild fish from Scotland. Diseases of Aquatic Organisms 46(2):93-100.
Ruiz-Palacios, G. M. 2009. Ground zero: the origins of a pandemic? Presentation given at the September 15-16, 2009 public workshop “The domestic and international impacts of the 2009 influenza A H1N1 pandemic: global challenges, global solutions,” Forum on Microbial Threats, Institute of Medicine, Washington, DC.
Russell, C. A., T. C. Jones, I. G. Barr, N. J. Cox, R. J. Garten, V. Gregory, I. D. Gust, A. W. Hampson, A. J. Hay, A. C. Hurt, J. C. de Jong, A. Kelso, A. I. Klimov, T. Kageyama, N. Komadina, A. S. Lapedes, Y. P. Lin, A. Mosterin, M. Obuchi, T. Odagiri, A. D. Osterhaus, G. F. Rimmelzwaan, M. W. Shaw, E. Skepner, K. Stohr, M. Tashiro, R. A. Fouchier, and D. J. Smith. 2008. The global circulation of seasonal influenza A (H3N2) viruses. Science 320(5874):340-346.
Salomon, R., and R. Webster. 2009. The influenza virus enigma. Cell 136(3):402-410.
San Francisco AIDS Foundation. 2009. Glossary of HIV/AIDS terms, http://www.sfaf.org/custom/glossary.aspx?l=en&a=G (accessed December 15, 2009).
Schnirring, L. 2009. USDA confirms first pandemic H1N1 finding in US pigs, http://www.cidrap.umn.edu/cidrap/content/influenza/swineflu/news/oct1909pig-br.html (accessed November 3, 2009).
Sencer, D. J., and J. D. Millar. 2006. Reflections on the 1976 swine flu vaccination program. Emerging Infectious Diseases 12(1):29-33.
Severson, W. X., Chen, J. Maddry, Y.-K. Chu, C. Jonsson, A. McBrayer, R. Tapp, D. Smee, C. Maddox, S. Ananthan, J. Noah, L. Black, B. Moore, M. Sosa, L. White, and L. Rasmussen. 2009. Discovery of new inhibitors of the influenza H5N1 virus. Antiviral Research 82(2):A36-A37.
Shannon, S., J. Louie, A. Siniscalchi, E. Rico, D. Richter, R. Hernandez, R. Lynfield, L. McHugh, C. Waters, E. Lee, A. Stoute, K. Landers, U. Bandy, N. Pascoe, V. Vernon, T. Haupt, C. Moore, L. Schieve, G. Peacock, C. Boyle, M. Honein, M. Yeargin-Allsopp, E. Trevathan, L. Finelli, T. Uyeki, R. Dhara, A. Fowlkes, D. Christensen, and V. Jarquin. 2009. Surveillance for pediatric deaths associated with 2009 pandemic influenza A (H1N1) virus infection—United States, April-August 2009. Morbidity and Mortality Weekly Report 58(34):941-947.
Shinya, K., M. Ebina, S. Yamada, M. Ono, N. Kasai, and Y. Kawaoka. 2006. Avian flu: influenza virus receptors in the human airway. Nature 440(7083):435-436.
Shortridge, K. F. 2009. Southern Hemisphere, Northern Hemisphere: a global influenza world. Presentation given at the September 15-16, 2009 public workshop “The domestic and international impacts of the 2009 influenza A H1N1 pandemic: global challenges, global solutions,” Forum on Microbial Threats, Institute of Medicine, Washington, DC.
Simonsen, L. D., R. Olson, C. Viboud, E. Heiman, R. J. Taylor, M. A. Miller, and T. A. Reichert. 2005. Pandemic influenza and mortality: past evidence and projections for the future. In The threat of pandemic influenza. Washington, DC: The National Academies Press.
Smith, D. J., A. S. Lapedes, J. C. de Jong, T. M. Bestebroer, G. F. Rimmelzwaan, A. D. Osterhaus, and R. A. Fouchier. 2004. Mapping the antigenic and genetic evolution of influenza virus. Science 305(5682):371-376.
Smith, G. J. D., D. Vijaykrishna, J. Bahl, S. J. Lycett, M. Worobey, O. G. Pybus, S. K. Ma, C. L. Cheung, J. Raghwani, S. Bhatt, J. S. Malik Peiris, Y. Guan, and A. Rambaut. 2009. Origins and evolutionary genomics of the 2009 swine-origin H1N1 influenza A epidemic. Nature 459(7250):1122-1125.
Soundararajan, V., K. Tharakaraman, R. Raman, S. Raguram, Z. Shriver, V. Sasisekharan, and R. Sasisekharan. 2009. Extrapolating from sequence—the 2009 H1N1 “swine” influenza virus. Nature Biotechnology 27(6):510-513.
Stein, R. 2009 (August 10). Preparing for swine flu’s return: new wave expected after virus flourished in Southern Hemisphere. The Washington Post: A1.
Stern, A. M., and H. Markel. 2004. International efforts to control infectious diseases, 1851 to the present. Journal of the American Medical Association 292(12):1474-1479.
———. 2009. What Mexico taught the world about pandemic influenza preparedness and community mitigation strategies. Journal of the American Medical Association 302(11):1221-1222.
Stern, A. M., M. S. Cetron, and H. Markel. 2009. Closing the schools: lessons from the 1918-19 U.S. influenza pandemic. Health Affairs 28(6):w1066-w1078.
Taubenberger, J. K., and D. M. Morens. 2006. 1918 Influenza: the mother of all pandemics. Emerging Infectious Diseases 12(1):15-22.
Thompson, W. W., D. K. Shay, E. Weintraub, L. Brammer, N. Cox, L. J. Anderson, and K. Fukuda. 2003. Mortality associated with influenza and respiratory syncytial virus in the United States. Journal of the American Medical Association 289(2):179-186.
Throsby, M., E. van den Brink, M. Jongeneelen, L. L. Poon, P. Alard, L. Cornelissen, A. Bakker, F. Cox, E. van Deventer, Y. Guan, J. Cinatl, J. ter Meulen, I. Lasters, R. Carsetti, M. Peiris, J. de Kruif, and J. Goudsmit. 2008. Heterosubtypic neutralizing monoclonal antibodies cross-protective against H5N1 and H1N1 recovered from human IgM+ memory B cells. PLoS One 3(12):e3942.
Treanor, J. J. 2010. Influenza virus. In Principles and Practice of Infectious Diseases, 7th Edition, edited by G. L. Mandell, J. E. Bennett, and R. Dolin R. Chapter 165.
University of California Museum of Paleontology. 2009. Founder effect, http://evolution. berkeley.edu/evosite/glossary/glossary_browse.shtml (accessed December 15, 2009).
USDA (U.S. Depart ment of Agriculture). 2009. USDA confirms 2009 pandemic H1N1 influenza virus present in Minnesota fair pig sample, http://www.usda.gov/wps/portal/!ut/p/_s.7_0_A/7_0_1OB?contentidonly=true&contentid=2009/10/0514.xml (accessed November 3, 2009).
van Doorn, R. 2009. Influenza pandemic (H1N1) 2009 (27): Viet Nam, patient data update, August 8, 2009, http://www.promedmail.org/pls/otn/f?p=2400:1202:2994427309200284::NO::F2400_P1202_CHECK_DISPLAY,F2400_P1202_PUB_MAIL_ID:X,78714 (accessed November 3, 2009).
van Riel, D., V. J. Munster, E. de Wit, G. F. Rimmelzwaan, R. A. Fouchier, A. D. Osterhaus, and T. Kuiken. 2006. H5N1 virus attachment to lower respiratory tract. Science 312(5772):399.
Wallensten, A., I. Oliver, D. Lewis, and S. Harrison. 2009. Compliance and side effects of prophylactic oseltamivir treatment in a school in south west England. Eurosurveillance 14(30):1-4.
Webby, R. J., K. Rossow, G. Erickson, Y. Sims, and R. Webster. 2004. Multiple lineages of antigenically and genetically diverse influenza A virus co-circulate in the United States swine population. Virus Research 103(1-2):67-73.
Webster, R. 2009. Evolution of the novel H1N1 influenza virus of swine origin. Remarks to the Forum on Microbial Threats Discussion Meeting, June 16, 2009, Washington, DC.
White, D. B., M. H. Katz, J. M. Luce, and B. Lo. 2009. Who should receive life support during a public health emergency? Using ethical principles to improve allocation decisions. Annals of Internal Medicine 150(2):132-138.
White, L. F., J. Wallinga, L. Finelli, C. Reed, S. Riley, M. Lipsitch, and M. Pagano. 2009. Estimation of the reproductive number and the serial interval in early phase of the 2009 influenza A/H1N1 pandemic in the USA. Influenza and Other Respiratory Viruses 3(6):267-276.
White House. 2009. Declaration of a national emergency with respect to the 2009 H1N1 influenza pandemic, http://www.whitehouse.gov/THE-PRESS-OFFICE/DECLARATION-A-NATIONAL-EMERGENCY-WITH-RESPECT-2009-H1N1-INFLUENZA-PANDEMIC-0 (accessed November 17, 2009).
WHO (World Health Organization). 2005a. International Health Regulations, http://www.who.int/ihr/en/ (accessed November 3, 2009).
———. 2005b. Avian influenza: assessing the pandemic threat, the pandemic threat. Geneva, Switzerland: World Health Organization.
———. 2009a. Avian influenza frequently asked questions, http://www.who.int/csr/disease/avian_influenza/avian_faqs/en/index.html#isthere (accessed November 3, 2009).
———. 2009b. Changes in reporting requirements for pandemic (H1N1) 2009 virus infection, http://www.who.int/csr/disease/swineflu/notes/h1n1_surveillance_20090710/en/index.html (accessed November 3, 2009).
———. 2009c. Pandemic (H1N1) 2009 update 69, http://www.who.int/csr/don/2009_10_09/en/index.html (accessed November 3, 2009).
———. 2009d. Situation updates—pandemic (H1N1) 2009, http://www.who.int/csr/disease/swineflu/updates/en/index.html (accessed November 3, 2009).
———. 2009e. Timeline (22 July 2009 onwards) pandemic (H1N1) 2009 laboratory confirmed cases and number of deaths as reported to WHO, http://gamapserver.who.int/h1n1/cases-deaths/h1n1_casesdeaths.html (accessed January 6, 2010).
———. 2009f. Clinical features of severe cases of pandemic influenza: pandemic (H1N1) 2009 briefing note 13, http://www.who.int/csr/disease/swineflu/notes/h1n1_clinical_features_20091016/en/print.html (accessed November 4, 2009).
———. 2009g. Antiviral use and the risk of drug resistance, http://www.who.int/csr/disease/swineflu/notes/h1n1_antiviral_use_20090925/en/index.html (accessed November 5, 2009).
———. 2010a. Pandemic (H1N1) 2009 update 91, http://www.who.int/csr/don/2010_03_12/en/index.html (accessed March 15, 2010).
———. 2010b. Pandemic (H1N1) 2009 update 76, http://www.who.int/csr/don/2009_11_27a/en/index.html (accessed January 7, 2010).
WHO/AFRO (Regional Office for Africa). 2010. Pandemic (H1N1) 2009 in the African region: update 65, http://www.afro.who.int/ddc/influenzaa/index.html (accessed January 22, 2010).
WHO Representative Office in Viet Nam. 2009. Overview of the current pandemic H1N1 2009 situation, http://www.wpro.who.int/vietnam/sites/dcc/h1n1/ (accessed January 7, 2010).
WHO/SEARO. 2010. Pandemic H1N1 2009, http://www.searo.who.int/EN/Section10/Section2562_15050.htm (accessed January 22, 2010).
Wikipedia. 2007. Virus replication, http://en.wikipedia.org/wiki/File:Virus_Replication_large.svg (accessed November 18, 2009).
———. 2009. Influenza, http://en.wikipedia.org/wiki/Influenza#Replication (accessed November 18, 2009).
Wilson, M. E. 2003. The traveller and emerging infections: sentinel, courier, transmitter. Journal of Applied Microbiology 94(Suppl):1S-11S.
Wilson, N., and M. G. Baker. 2009. The emerging influenza pandemic: estimating the case fatality ratio. Eurosurveillance 14(26).
Xing, Z., and C. J. Cardona. 2009. Preexisting immunity to pandemic (H1N1) 2009. Emerging Infectious Diseases 15(11):1847-1849.
Yuk-hang, N., and L. Chung. 2009 (November 6). Virus passes from humans to pigs in City. South China Morning Post.
Zheng, B. J., K. W. Chan, Y. P. Lin, G. Y. Zhao, C. Chan, H. J. Zhang, H. L. Chen, S. S. Wong, S. K. Lau, P. C. Woo, K. H. Chan, D. Y. Jin, and K. Y. Yuen. 2009. Delayed antiviral plus immunomodulator treatment still reduces mortality in mice infected by high inoculum of influenza A/H5N1 virus. Proceedings of the National Academy of Sciences 105(23):8091-8096.
Zimmer, S. M., and D. S. Burke. 2009. Historical perspective—emergence of influenza A (H1N1) viruses. New England Journal of Medicine 361(3):279-285.


