
4
Technology and Opportunities for the Mitigation of Radio Frequency Interference
The capacity to address interference issues is a key element in any system using the radio frequency (RF) spectrum. This is especially true for passive sensing systems—those that do not transmit but only receive naturally occurring emissions—due to the level of sensitivity required for these systems to extract useful environmental and scientific data. Interference can be caused by a variety of sources: other valid users of the RF spectrum, improperly functioning consumer and commercial equipment, and improper or disallowed use of the spectrum. As the use of the RF spectrum for commercial, industrial, government, and scientific uses continues to increase, the number of potentially interfering sources will increase as well. Mitigation techniques are a limited but critical element in efforts aimed at extracting scientific value from an increasingly difficult RF environment.
The Earth Exploration-Satellite Service (EESS) and Radio Astronomy Service (RAS) have classically limited the impact of interference by using mitigation techniques. However, there are physical limits to the capacity of the “unilateral” techniques that typically have been used, and they often do not provide adequate protection from interference. Recently, new techniques have been suggested, in which the active and passive users of the RF spectrum collaborate in order to share the spectrum. These “cooperative” mitigation techniques may provide a potential for meeting the expanding spectral needs of the passive-sensing community.
This chapter is divided into five sections: §4.1 addresses the expected trends in RF spectrum use that may call for increasing mitigation; §4.2, the drivers of spectrum use; §4.3, the capacity for unilateral mitigation technology; §4.4, the potential for mitigation through cooperative use; and §4.5, the costs of mitigation.
4.1
TRENDS IN ACTIVE SPECTRUM USAGE
One of the primary concerns for passive sensing systems is the explosive growth in industrial, commercial, and consumer devices. This growth is fueled by user demand, investment capital, and the reallocation of underutilized spectral bands. The need for mitigation and the appropriate mitigation technique will vary depending on the type of equipment that will be permitted by the regulatory agencies, the technology being deployed, the time line for the deployment of systems, and the intensity of spectrum usage. This section and the next present a review of current spectrum usage and of the drivers for future spectrum usage, which provides the requisite basis for the development of the appropriate technical and regulatory mitigation strategies.
Current Allocations
Access to spectrum in the United States is assigned by the Federal Communications Commission (FCC) and the National Telecommunications and Information Administration (NTIA). The process is described in useful detail in Chapter 1 of the National Research Council’s 2007 report Handbook of Frequency Allocations and Spectrum Protection for Scientific Uses.1 To summarize, spectrum is typically assigned to services (classes of users) on a primary basis or a secondary basis, and allocations include details on permitted transmission power levels and operation times. The difference between a primary allocation and a secondary allocation is essentially that the users of a secondary allocation must accept interference from the users of a primary allocation and conversely must not interfere with the users of the primary service. The International Telecommunication Union (ITU), an agency of the United Nations, periodically updates its allocation table to coordinate international spectrum usage and prevent problems due to interference. The ITU Radio Regulations (ITU-RR) are not binding on the United States in toto—the real treaty obligation of the U.S. government is that it will not assign transmitter licenses in such a way that will cause interference to stations licensed by other governments that are in accordance with the ITU-RR. Within this framework, national governments create and enforce additional regulations, typically to include additional details and to elaborate on permitted uses of the spectrum. In the United States, federal use of spectrum is managed by the NTIA, whereas nonfederal (i.e., commercial, amateur, and passive scientific) use of spectrum is managed by the FCC. The authority of the FCC and NTIA are parallel in this respect. FCC regulations
concerning the use of the spectrum are codified in Title 47 of the Code of Federal Regulations (47 C.F.R.).
The radio astronomy community is represented in this process as the “Radio Astronomy Service,” and the Earth remote sensing community is represented in this process as the “Earth Exploration-Satellite Service.” A useful synopsis of 47 C.F.R. in terms relevant to the RAS and EESS, including tables of relevant spectral allocations, is given in the Handbook.2 For example, this reference text shows that 2.07 percent of the spectrum below 3 GHz is allocated to the RAS and EESS on a primary basis and that 4.08 percent is allocated on a secondary basis (measured in hertz).
From a regulatory perspective, the RAS and EESS are comparable to all other services, despite the fact that that they do not transmit. Thus, the allocation of spectrum to the RAS and EESS on a primary basis results nominally (but not actually—see below) in clear spectrum. The allocation of spectrum to the RAS and EESS on a secondary basis is useful mainly in the sense that it offers these services a legal basis for providing input into the use of these allocations. It should also be noted that the allocation of a frequency band to the RAS and/or EESS does not prevent interference even if the allocation is on a primary basis. This is because the effective bandwidth of any transmission is essentially unlimited when observed with a sufficiently sensitive instrument. So, for example, the far out-of-band (side-band) emission of a transmission whose center frequency is properly in a band in which it has a primary allocation may, at some level, appear in nearby bands in which the RAS and/or EESS has a primary allocation. This has historically been a severe problem, particularly with respect to interference from services transmitting from satellites in L-band. (See §3.5 for a discussion of radio frequency interference [RFI] from Iridium satellites.) In contrast to active uses of the spectrum, the work of RAS and EESS users can be severely affected when the interference power level is far below the internal noise power level of the detection device, since long integration times are usually used in RAS and EESS measurements to reduce the root-mean-square fluctuations in the internal noise. Thus, this issue affects the RAS and EESS in a way that is fundamentally different from the way that it affects active users of the radio spectrum.
The spectrum in which the RAS and/or EESS has a primary or secondary allocation is relatively small (see Table 4.1). The spectrum in which the RAS and/or EESS has a secondary allocation has diminished usefulness, since there is no protection from the primary users of these bands. As noted in Chapters 2 and 3, the spectrum requirements of the radio astronomy and Earth exploration radio science community currently far exceed the spectrum available to the RAS and EESS on
TABLE 4.1 Total Spectrum Allocated to the Radio Astronomy Service (RAS) and the Earth Exploration-Satellite Service (EESS) Within 9 kHz to 3 GHz
either a primary or a secondary basis. For this reason, these users must routinely observe in bands in which the RAS and/or EESS has neither primary nor secondary allocations. This is authorized since passive (receive-only) scientific use of the radio spectrum is not prohibited in any part of the electromagnetic spectrum. This is also often technically possible because some parts of the spectrum are sparsely utilized, and services that transmit typically do so with poor spectral efficiency in both frequency and time (although current trends are in the direction of increased usage and improved spectral efficiency; see §4.2).
Finding: Owing to their receive-only nature, the passive Earth Exploration-Satellite Service and Radio Astronomy Service, operating from 10 MHz to 3 THz, are incapable of interfering with other services.
Finding: Currently, 2.07 percent of the spectrum below 3 GHz is allocated to the RAS and EESS on a primary basis, and 4.08 percent is allocated on a secondary basis (measured in hertz).
Current Utilization Studies
The allocation of spectrum to a service does not necessarily imply that the allocated spectrum is always used for transmission; neither does it imply that the allocated spectrum cannot be used by others for passive scientific observations. In fact, there are a number of ways in which allocated spectrum might remain free of detectable
transmissions and available for passive scientific observations. For example, in rural areas with low population density, some services may not be used to any detectable degree; that is, transmissions associated with the active services are typically fewer and weaker in these areas (see further discussion later in this section). If the area is remote enough, transmissions may be sufficiently weak so as not to interfere with radio science observations (although such remote areas are reached by satellite and airborne radio sources). More often, however, the situation is intermediate in the sense that significant interference is observed but can sometimes be managed through a combination of interference mitigation techniques (see §4.3 and §4.4).
The “channelization” of frequencies within a given allocation, typically specified either in 47 C.F.R. or as the result of the adoption of an industry standard (e.g., IEEE 802.11), is inherently inefficient. For example, a typical user of the Land Mobile Radio Service might use only a small number of widely spaced channels within the allocated band and may transmit on them only a tiny fraction of the time. Thus even if an active user is received with sufficient strength to prevent the scientific use of some section of the spectrum while that user is transmitting, it is sometimes possible to exploit the sparse “time-frequency” utilization of spectrum by means of the techniques described in §4.3 and §4.4 to observe effectively when the active user is not transmitting. Given the existing trend toward more efficient channelization and increased utilization, however, interference mitigation methods that rely on this property are in danger of becoming less effective over time.
The modulation employed by a transmitter may be inherently inefficient, in the sense that it requires a large swath of spectrum but unevenly distributes the power over the channel. An example is the use of the National Television System Committee (NTSC) standard for analog television (TV), which requires a 6 MHz channel but places the vast majority of the transmitted power into just two carriers constituting only a few hundred kilohertz of bandwidth within this channel (see Figure 4.1). Radio astronomers have been able to observe within active NTSC channels in areas where NTSC transmissions are relatively weak (e.g., deep in the National Radio Quiet Zone [NRQZ]) by observing only within those portions of the channel where relatively little power is present and filtering out those parts of the channel where most of the power is located. However, the introduction of the new digital TV broadcast standard, known as ATSC, makes this technique impossible. This is because the Advanced Television Systems Committee (ATSC) fills the entire 6 MHz channel with a uniform distribution of power, leaving no “hole” through which to observe (see Figure 4.1).
The preceding comments can be summarized as follows: (1) The “allocation” of spectrum historically has not implied the “utilization” of spectrum, which has benefited the passive scientific users of the radio spectrum. (2) Technology trends are moving toward more efficient utilization of allocations, in both time and frequency, which is beginning to severely impact the ability to use some bands
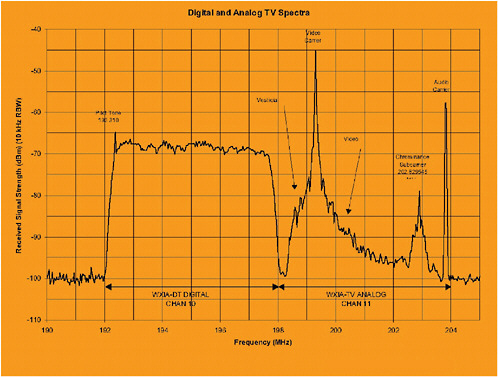
FIGURE 4.1 A comparison of the digital (Channel 10) and analog (Channel 11) television signals. The digital signal is essentially uniform in power across the entire channel, whereas the analog signal transmits most of its information in two narrow bands, leaving holes through which radio astronomers can sometimes observe relatively strong natural sources. Image courtesy of Andrew Clegg, National Science Foundation.
for scientific uses, despite the importance of these uses. As explained later in this chapter, this is true even when taking into account the capabilities of existing and emerging techniques for the mitigation of interference.
For these reasons, passive-sensing scientific users of the radio spectrum are greatly concerned with the utilization of spectrum both within the bands allocated to the RAS and EESS and in all other bands accessible to current and planned instruments. Furthermore, radio astronomers are concerned not only with spectral occupancy at frequencies at which they wish to observe, but they also monitor transmissions in nearby bands that have the potential to create interference through receiver compression—a condition in which an instrument is desensitized because a signal in a nearby band is present with such great strength that the receiver goes nonlinear. In this case the ability to mitigate the interference through filtering, while
retaining sensitivity, is beyond existing technology. The reason for this is that filters must be placed before the saturable active components, and because filters have losses, the system sensitivity is thereby reduced.
The largest radio observatories routinely monitor the RF spectrum and typically maintain continuous monitoring programs of some sort. The results of monitoring campaigns are usually freely available for inspection online—for example, at the interference-monitoring Web sites maintained by the NRAO’s Very Large Array (VLA),3 by NRAO at the Green Bank Telescope,4 and by the National Atmosphere and Ionosphere Center (NAIC) at Arecibo Observatory.5 Unfortunately, these efforts are technically difficult and expensive to maintain and thus often have limited sensitivity and/or restricted time-frequency coverage. As a result, interference that is strong enough to be harmful to radio astronomy may escape detection by existing monitors. With regard to the EESS community, the monitoring of spectral utilization is made even more difficult by the limitations of operations aboard aircraft and satellites and by the coarse spectral resolution of total power radiometers. However, some anecdotal results have been published (see Figures 2.13 through 2.21, 3.10, and 4.2).6
The actual utilization of the radio frequency spectrum has recently become a topic of increasing interest to active users of the spectrum as well. This has resulted in a number of studies reporting measurements of the utilization of the spectrum.7 Typically, the results of such studies report results in terms of spectral occupancy,
|
3 |
See “VLA Radio Frequency Interference” at http://www.vla.nrao.edu/cgi-bin/rfi.cgi; accessed January 13, 2009. |
|
4 |
See “Green Bank Interference Protection Group” at http://www.gb.nrao.edu/IPG/; accessed January 13, 2009. |
|
5 |
See National Atmosphere and Ionosphere Center, Arecibo RFI Web site, at http://www.naic.edu/~rfiuser/; accessed January 13, 2009. |
|
6 |
S.W. Ellingson, G.A. Hampson, and J.T. Johnson, “Characterization of L-Band RFI and Implications for Mitigation Techniques,” Proc. IEEE Geoscience and Remote Sensing Symp. (IGARSS 2003), Vol. 3, pp. 1745-1747, July 21-25, 2003. |
|
7 |
Federal Communications Commission Spectrum Policy Task Force, Report of the Spectrum Efficiency Working Group, November 2002, available at http://www.fcc.gov/sptf/reports.html, accessed January 14, 2010; Frank H. Sanders and Vince S. Lawrence, Broadband Spectrum Survey at Denver, Colorado, NTIA Report 95-321, September 1995; Frank H. Sanders, Bradley J. Ramsey, and Vincent S. Lawrence, Broadband Spectrum Survey at San Francisco, CA, NTIA Report 99-367, May-June 1999; S.W. Ellingson, “Spectral Occupancy at VHF: Implications for Frequency-Agile Cognitive Radios,” Proc. IEEE Vehicular Technology Conf. 2005 Fall—Dallas, Vol. 2, pp. 1379-1382 (September 2005); A.E.E. Rogers, J.E. Salah, D.L. Smythe, P. Pratap, J.C. Carter, and M. Derome, “Interference Temperature Measurements from 70 to 1500 MHz in Suburban and Rural Environments of the Northeast,” Proc. First Int’l Symp. on New Frontiers in Dynamic Spectrum Access Networks (DySPAN 2005), November 8-11, 2005, pp. 119-123; Mark A. McHenry and Dan McCloskey, “Multi-Band, Multi-Location Spectrum Occupancy Measurements,” Proc. 2006 ISART Conference, Boulder, Colorado (March 2006), available at http://www.its.bldrdoc.gov/pub/ntia-rpt/06-438, accessed January 14, 2010. |
which can be defined as the fraction of time that a transmission can be detected at a given frequency, for a given sensitivity and a given time-frequency resolution.
However, the perception of what constitutes occupancy can be different depending on the measurement and the interests of the person interpreting the results. For example, a recent study performed by the Shared Spectrum Corporation reported 13.1 percent occupancy for New York City and 1 percent at Green Bank, West Virginia, inside the NRQZ.8 By contrast, a study of occupancies in terms somewhat more relevant to radio astronomy applications finds occupancy greater than 30 percent even in the relatively rural areas of Westford, Massachusetts, and Hancock, New Hampshire.9 Both studies are probably internally consistent but cannot be compared because of their different assumptions about the appropriate time-frequency resolutions, thresholds of detection, and tolerable levels of out-of-band (OOB) interference. Measurements are also being made that attempt to bridge this gap by reporting results in terms of cumulative distribution functions (CDFs), which resolve “occupancy” as a function of threshold of detection, and by also quantifying the fragmentation of unoccupied bandwidth. This activity is important, because often in both active and passive uses of the spectrum a minimum bandwidth must be available for the channel to be useful.10
While the various efforts of the active and passive user communities have been useful in confirming the sparse time-frequency utilization of the spectrum, most existing studies are of limited help in understanding in detail the potential for interference and for cooperative spectrum use as described later in this chapter. This is due to limited sensitivity (i.e., the inability to detect weak signals that still are sufficiently strong to constitute “occupancy” to a typical user of that band), time resolution that is too coarse to be useful (for example, monitoring a frequency for only a few milliseconds every few seconds, thereby potentially missing strong signals), and frequency resolution that is too coarse to be useful (for example, monitoring bandwidths on the order of hundreds of kilohertz when the signals themselves have bandwidths on the order of kilohertz, thereby desensitizing the measurements) (see Figure 4.2). This is essentially the same problem experienced by the monitoring programs of radio observatories, as mentioned above. Thus,
|
8 |
Mark A. McHenry and Dan McCloskey, “Multi-Band, Multi-Location Spectrum Occupancy Measurements,” Proc. 2006 ISART Conference, Boulder, Colorado (March 2006), available at http://www.its.bldrdoc.gov/pub/ntia-rpt/06-438/; accessed January 14, 2010. |
|
9 |
A.E.E. Rogers, J.E. Salah, D.L. Smythe, P. Pratap, J.C. Carter, and M. Derome, “Interference Temperature Measurements from 70 to 1500 MHz in Suburban and Rural Environments of the Northeast,” Proc. First Int’l Symp. on New Frontiers in Dynamic Spectrum Access Networks (DySPAN 2005), November 8-11, 2005, pp. 119-123. |
|
10 |
S.W. Ellingson, “Spectral Occupancy at VHF: Implications for Frequency-Agile Cognitive Radios,” Proceedings of the IEEE Vehicular Technology Conference 2005 Fall—Dallas, Vol. 2, pp. 1379-1382 (September 2005). |
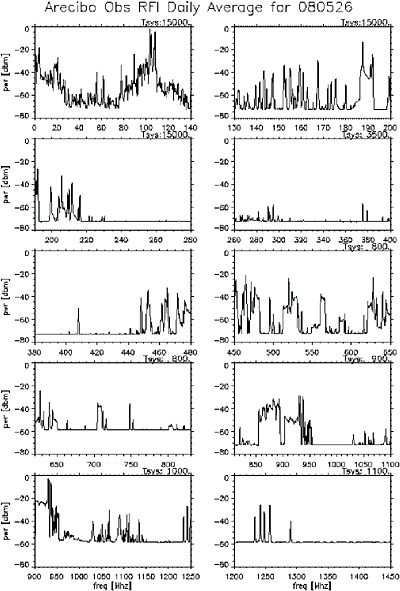
FIGURE 4.2 An example of radio frequency interference measurements made at the Arecibo radio observatory in Puerto Rico on May 26, 2008. The scan from a single location and a single instance in time is from a few megahertz to 1.45 GHz indicating the large number of commercial, government, and consumer uses of the spectrum. Detailed, real-time characterization of the spectrum uses provides an opportunity to prevent unauthorized uses of the spectrum from potentially causing catastrophic interference, as well as the capacity for opportunistically using unused spectrum for enhancing measurements. The Arecibo Observatory is part of the National Astronomy and Ionosphere Center, which is operated by Cornell University under a cooperative agreement with the National Science Foundation.
the passive and active user communities have a common interest in improving the ability to measure the utilization of the radio frequency spectrum.
A time resolution of 1 ms would be able to resolve and potentially classify transmit bursts in most mobile radio communications systems using time-division multiplexing (TDM) duplexing or channelization. Such systems use bursts/packets/frames in lengths of 10 ms to 40 ms due to a trade-off between accuracy in tracking propagation channels and throughput efficiency (payload/header ratio).11
However, a 1 millisecond time resolution would not resolve radar pulses, as these pulses are typically in the 2 to 400 microseconds range.12 Furthermore, if pulses cannot be resolved, it would be more difficult to positively identify the source as radar, as opposed to intermodulation from other things that just happen to be emitting into that frequency. If the pulses are resolved, however, it becomes very easy to identify the source and also to determine whether the sources are “splattering,” “jabbering,” or exhibiting other illicit behaviors. For the purposes of the RAS and EESS, and conceivably for many other applications as well, the activity of these radar pulses is of great interest. Even the multipath from these radars can be problematic to sensitive systems.13 To resolve these radar pulses, a time resolution on the order of 1 microsecond would be needed, which would not be technologically difficult to achieve.
The bandwidth resolution needed for such a spectrum survey could reasonably be 1 kHz; 1 kHz is roughly an order of magnitude less than the minimum standard bandwidth for any communications system above 30 MHz. A bandwidth resolution of 1 kHz would also resolve most communications below 30 MHz. Also, since much RFI comes in the form of unmodulated carriers (e.g., spurious products from transmitters, stuck microphones, etc.), the bandwidth is lower-bounded only by transmitter phase noise and so can be very narrow. A higher bandwidth resolution of, say, 10 kHz, would be too coarse, since most Land Mobile Radio Systems (two-way radios below 1 GHz) are migrating to 6.25 kHz channelization over the next decade.
Spatial resolution is the hardest parameter of the space to “saturate” with a monitoring system. Modern cellular systems use cell sizes ranging from building size to tens of kilometers. Satellite- and HAP-based cell systems can have cells hundreds of kilometers in extent. For terrestrial systems, this is highly frequency-,
terrain-, and protocol-dependent: different systems have different transmitter densities and different typical transmitting powers. Any justifiable angular resolution requirement would be frequency-dependent, such that the survey would achieve lower resolution at lower frequencies and higher resolution at higher frequencies. This relationship has to do with the nature of multipath scattering versus frequency as well as with fundamental limitations in angular resolution—resolution improves with increasing aperture in wavelengths. The ability to locate emitters with sufficient accuracy to facilitate the identification of sources would be the goal of the survey, and given the dependencies mentioned above, the necessary spatial resolution would depend on the frequency and on what can be afforded.
Finding: Greater efforts to collect and analyze radio emission data are needed to support the enforcement of existing allocations and to support the discussion and planning of spectrum use.
Finding: Better utilization of the spectrum and reduced RFI for scientific as well as commercial applications are possible with better knowledge of actual spectrum usage. Progress toward these goals would be made by gathering more information through improved and continuous spectral monitoring. This would be beneficial to both the commercial and the scientific communities.
4.2
MAJOR DRIVERS OF SPECTRUM USE
Current measurements of spectral utilization and its impact on passive systems may not be indicative of future spectral use. The drivers for additional spectral bands for intensive use, the allocation of additional bands, and the development of “smart” flexible radio technology will have a profound impact on future use. The following assessment for the time period 2008-2015 is based on well-established drivers, currently allocated spectral bands, and technology that is under development. This assessment has a high-to-moderate level of confidence. That said, the impact from regulatory changes can be profound—for example, increases in power levels or emission levels permitted outside the primary transmission band could create an RF environment much less useful for passive systems.
Assessment of Trends in Spectrum Use for 2008-2015
The current trend toward more intensive use of the RF spectrum will continue unabated for both commercial and government uses. Within the United States, the continued desire for higher levels of access to the Internet (Figure 4.3), coupled with the increased desire for mobility, will incite the development of new commercial systems. Technology is also a major driver for more intensive use. New mobile
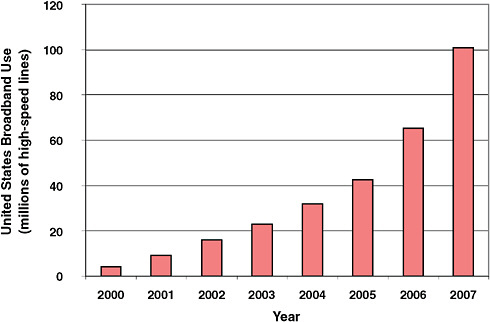
FIGURE 4.3 Broadband services usage in the United States from 2000 through 2007, as indicated by(millions of high-speed lines) the number of high-speed lines (or wireless channels) over 200 kbps in at least one direction. SOURCE: Federal Communications Commission, High-Speed Services for Internet Access Report, March 2008, p. 6, available at http://hraunfoss.fcc.gov/edocs_public/attachmatch/DOC-280906A1.pdf.
devices can integrate the use of multiple modes and bands within a single handset, and they use ever-wider-band RF components that allow for higher data rates. Such devices will drive the continued desire for more spectrum for commercial activities. The combination of mobility and integration has a strongly deleterious effect with respect to passive systems, because it will create a more pervasive use of the spectrum not only in spectral extent but in geographic extent as well.
The greater impact on the EESS community from more intensive use of the spectrum will come from what is occurring in developing nations. Fixed-line infrastructure including copper and fiber is available in highly developed countries except in low-population-density regions. This infrastructure is not available in developing nations, but unused radio spectrum is readily available. Therefore, most commercial deployments, including backhaul, are made entirely out of wireless systems. Economic development in these nations will produce a much higher reliance on wireless systems and will see a much higher growth rate in the use of wireless transmission systems. One example is that in 2006, China had more new cellular subscribers than the total number of U.S. subscribers (see Figure 4.4). The
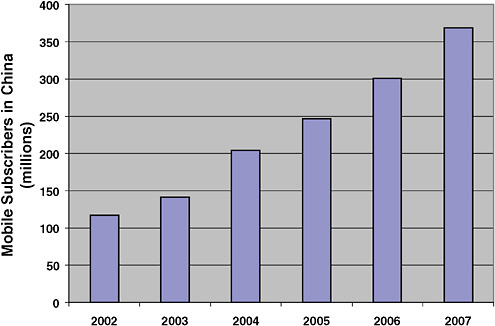
FIGURE 4.4 The number of cellular subscribers in China grew by more than 250 million between 2002 and 2007. SOURCE: China Mobile Ltd. Annual Reports.
ITU has indicated that the number of mobile cellular users worldwide at the end of 2007 was in excess of 3.3 billion.14
Lastly, the mechanism by which spectrum licenses are obtained has a large impact on what is optimized for system deployment. For example, in 2006 the FCC auctioned 90 MHz of spectrum for Advanced Wireless Services (AWS; also known as Third Generation cellular). The auction netted the U.S. Treasury $13.7 billion, which is equivalent to $0.50 MHz-pop.15 This cost is usually called the opportunity cost for the spectrum. High opportunity costs motivate the licensee to use the spectrum quite efficiently to leverage the already-“sunk costs.” This is why cellular operators are very conscious of their spectral efficiency and thus exploit spectral
|
14 |
“Global Mobile Phone Users Top 3.3 Billion by End-2007—Study,” Cellular News, May 24, 2008, available at http://www.cellular-news.com/story/31352.php; accessed January 14, 2010. |
|
15 |
The figure “$0.50 per MHz-pop” indicates that the licenses, if amortized across the entire U.S. population, would be worth $0.50 for every megahertz of bandwidth (it would be somewhat higher if one takes into account the effective population of subscribers). However, with 200 million subscribers and a maximum market penetration of approximately 30 percent, it would yield a value of $2.53 per megahertz per active subscriber. |
reuse techniques by using the same frequency bands at each tower. However, access to spectrum without any opportunity costs tends to motivate the use very differently. For example, the spectrum for public-safety users is provided as a direct grant. These users usually deploy high-site, high-power transmitters to reduce the cost of the infrastructure. The public-safety services are less efficient spectrum users than are the cellular telephone services, since the technology of the former lacks any spectral reuse.
Third-Generation and Fourth-Generation Systems
The 2008-2015 period will see the deployment of new cellular-based services in bands that were allocated in the 2002-2007 period: the 700 MHz band, the AWS bands, and the Broadband Radio Service and Educational Broadband Service (BRS/EBS) bands. These bands were reallocated by the FCC in recognition of the rapid growth in demand made by mobile data services.
700 MHz
The digital TV transition that took place in June 2009 recaptured the spectrum now allocated as channels 52-69 (698-806 MHz). The propagation characteristics of these bands, as well as the lack of incumbents within the band, make this piece of the spectrum highly prized. The band has allocations for Public Safety (763-775 MHz and 793-805 MHz), moderate-power16 cellular operations (746-763 MHz and 776-793 MHz), and high-power17 operations (698-743 MHz). Much of the band was yet to be licensed as of December 2008. In March 2008, an auction took place in which $19.6 billion was bid for the licenses within this band. However, licenses that do not meet the build-out requirements to provide coverage to a required percentage of the U.S. population will be remanded to the FCC, leading to expectations that these bands will be intensively used.
Advanced Wireless Services 1, 2, and 3
The Advanced Wireless Services (AWS) bands include 1710-1755 MHz, 1915-1920 MHz, 1995-2000 MHz, 2020-2025 MHz, and 2110-2180 MHz. In September 2006, the FCC auctioned the 1710-1755 MHz band paired with the 2110-2155 MHz band and denoted it the AWS-1 block. The AWS band is generally called the “3-G” (Third Generation) band and is denoted for mobile voice and data services. The build-out requirements for AWS-1 are not as cumbersome as those
for the 700 MHz band. Additional auctions have been proposed for the AWS-2 and AWS-3 bands.
2.5 GHz: Broadband Radio Service and Educational Broadband Service
The Multipoint Distribution System (MDS); Multi-channel, Multipoint Distribution System (MMDS); and Instructional Television Fixed Service (ITFS) bands that formerly occupied the 2.1 GHz spectrum were reallocated to the 2495-2690 MHz band. The transition also included a name change to the BRS and EBS. Wireless Internet access is the primary use of these bands, which have rules that permit technical flexibility to deploy any technology that meets the emission rules. However, WiMAX (also known as IEEE 802.16) technology is generally the technology that is deployed.
Unlicensed Uses of the Radio Frequency Spectrum
There has been a phenomenal proliferation of unlicensed devices over the past decade, to the great benefit of society.18 Over the past 5 years there have also been significant additions to the types of unlicensed devices and spectral bands available for unlicensed uses. The ultrawideband types of unlicensed devices, the expansion of unlicensed use in the Unlicensed National Information Infrastructure (U-NII) band, and the allocation for 70, 80, and 90 GHz bands are noteworthy.
Unlicensed devices operate at a low enough power to be deemed not harmful to the primary licensee in the band. Unlicensed devices can also operate on a co-primary basis in certain bands. The 900 MHz, 2.4 GHz, and 5.8 GHz bands are three such bands. The 900 MHz band has been popularly used by baby-monitoring device and wireless phone manufacturers. The 2.4 GHz band is the most popular one and is heavily used by wireless local-area networks (also known as Wi-Fi), cordless telephones, security systems, and personal-area networks (also known as Bluetooth) manufacturers. Indeed, unlicensed devices have many societal and commercial benefits.
Ultrawideband
Ultrawideband (UWB) is a technology for transmitting information using a large bandwidth (>500 MHz), which can cross many spectrum-allocation boundaries. UWB was originally accepted as pulse radio, but the FCC and ITU-Radio (ITU-R) now define UWB in terms of a transmission from an antenna for which
the emitted signal bandwidth exceeds the lesser of 500 MHz or 20 percent of the center frequency. The FCC authorizes the unlicensed use of UWB in the 3.1-10.6 GHz band, and the FCC power spectral density emission limit for UWB emitters operating in the UWB band is –41.3 dBm/MHz. These emission limits are consistent with those granted by the FCC for personal computer emissions and intentional emissions for unlicensed devices.
Unlicensed National Information Infrastructure at 5 GHz
The FCC established a schedule for new unlicensed devices that are dynamic frequency selection (DFS)-compliant in the 5.25-5.35 GHz (UNII-2) band and in a new spectral region between 5.470 and 5.725 GHz (UNII-3). 19 The new DFS rule is required in order to allow the coexistence of unlicensed devices with existing military and weather radar systems in the 5 GHz band. The new FCC rule requires that unlicensed devices must comply with DFS to prevent the devices from interfering with incumbent military and weather radar systems. The DFS system must continuously monitor the selected frequency channel during use and if a radar signal is detected, the DFS system must stop and jump to another available channel that has gone through the same selection process.
Millimeter Wave: 70, 80, 90 GHz
In October 2003, the FCC opened 13 GHz of previously unused spectrum at 71-76 GHz, 81-86 GHz, and 92-95 GHz, for high-density fixed wireless.20 Although not explicitly used for unlicensed devices, millimeter-wave communications have many of the characteristics of unlicensed use: many of the requirements in obtaining licenses are minor and would essentially allow a great deal of proliferation of those devices. The FCC will issue an unlimited number of non-exclusive nationwide licenses to non-federal government entities for the 13 GHz of spectrum allocated for commercial use. These licenses will serve as a prerequisite for registering individual point-to-point links. The 71-95 GHz bands are allocated on a shared basis with federal government users. Therefore, a licensee will not be authorized to operate a link under its non-exclusive nationwide license until the link is coordinated with the NTIA with respect to federal government operations and is registered as an approved link with a third-party database manager.
Regulatory Changes That Impact Use
As previously described, the regulatory agencies (NTIA, FCC) determine the appropriate technical parameters for operation in each spectral band. These rules are in constant flux in order to keep current with technological changes and national needs. Since 2005, the regulatory agencies have been moving away from explicit emissions parameters. This change is in recognition of the fact that it is not power but power spectral density and power flux density that better represent proper operating parameters:
-
Power spectral density: In 2007, the FCC changed emission rules for AWS and 700 MHz from 1640 W equivalent isotropically radiated power (EIRP) to 1640 W/MHz EIRP. This change was in response to the penalty to broadband systems.21 The transmitter power of broadband systems was regulated regardless of bandwidth, so these systems would be afforded a lower transmitter power spectral density than that for narrowband systems.
-
Power flux density: The FCC has begun to use power flux density (e.g., Wm–2) as the key emission parameter. This is in response to the previous lack of incentive for using elevation beam shaping to control the interference at ground level and to allow higher power emission limits for more cost-effective commercial deployments. The technical rules for the 700 MHz spectral band allow a transmission power up to 50 kW in portions of the band, but the power flux density must be less than 3,000 microwatts per square meter on the ground.22
These rule changes represent an opportunity to use more sophisticated interference metrics for interference control. The recent changes increased sophistication with both spectral and spatial characterization. It may also be possible to extend regulations to include temporal characterizations that will be useful for developing new interference mitigation techniques.
The regulatory environment has investigated but has yet to address three additional means for interference mitigation:
-
Interference metrics: Metrics have been investigated to clarify what is considered to be harmful interference. Currently the regulators primarily quantify transmitter characteristics in lieu of explicit interference control. One proposal, called Interference Temperature, was closely related to noise
-
temperature, which is used extensively by the RAS community.23 An engineering-based metric would provide clarity for system developers and for policy makers in determining the relative value of systems. The metric could be different for different bands and applications.
-
Regulatory enforcement: Current means of enforcement are primarily by licensee self-enforcement or by the FCC’s use of a limited number of mobile interference-monitoring laboratories (seven in the United States). The proliferation of mobile wireless transmitters within consumer, commercial, and government systems requires new monitoring and enforcement technologies.
-
Inclusion of passive systems in regulatory databases: Current FCC databases include all transmission equipment for site-specific licenses but do not include passive systems such as those used in the EESS and RAS. These databases are used by licensees to determine the potential for interference between systems and to communicate with other licensees on a case-bycase basis. Since the passive systems are not included in the FCC databases, they are not considered in these discussions. Knowledge of the location and operational characteristics of the passive systems would be very useful to licensees for determining impact and possible mutual interference mitigation techniques.
The new techniques for interference control have been investigated by regulators but have not been acted on. These techniques include interference metrics (e.g., interference temperature), improving enforcement technology to provide new
tools for the regulators to ensure compliance with emission rules (e.g., commercial devices used for enforcement measurements, additional mobile measurement systems, etc), and the inclusion of passive systems in regulators’ databases (e.g., the FCC’s Universal Licensing System).
Finding: Current regulatory structure and support infrastructure (such as databases, etc.) are transmitter-centric. Methodologies to incorporate passive systems need to be developed.
Technology Changes That Impact Use
Software-Defined Radios and Cognitive Radios
The development of wideband power amplifiers, synthesizers, and analog/digital (A/D) converters is providing for a new class of communication radios defined by software: the software-defined radio (SDR) and cognitive radio (CR). Although at the early stages of development, this new class of radio ushers in new possibilities as well as possible pitfalls for technology policy. The flexibility provided by the CR class of radio allows for more dynamics within radio operations. The technology also makes possible dynamic collaboration between CR and science users. The same flexibility poses challenges for certification and the associated liability through potential misuse.
SDR provides software control of a variety of modulation techniques, wideband and narrowband operation, communications security functions (such as hopping), and waveform requirements. In essence, components can be under digital control and thus defined by software. The advantage of an SDR is that a single system can operate under multiple configurations, providing interoperability, bridging, and tailoring of the waveforms to meet the localized requirements. SDR technology and systems have been developed for the military. The digital modular radio (DMR) system was one of the first SDR systems. Recently the Defense Advanced Research Projects Agency developed the Small Unit Operations Situational Awareness Systems, a portable SDR operating from 20 MHz to 2.5 GHz. The success of these programs has led to the Joint Tactical Radio System initiative to develop and procure SDR systems throughout the U.S. military.
SDRs exhibit software control over a variety of modulation techniques and waveforms. Software radios can specifically implement the signal processing in software and use digital-to-analog converters to translate from the digital domain to the RF domain. This additional capability essentially has the radio being constructed with an RF front end, a down-converter to an intermediate frequency or baseband, an A/D converter, and a processor. The processing capacity limits the complexity of the waveforms that can be accommodated.
A cognitive radio adds both a sensing and an adaptation element to the software defined radios and software radios. Four new capabilities embodied in cognitive radios will help enable dynamic use of the spectrum: flexibility, agility, RF sensing, and networking.24
-
Flexibility is the ability to change the waveform and the configuration of a device;
-
Agility is the ability to change the spectral band in which a device will operate;
-
Sensing is the ability to observe the state of the system, which includes both the radio unit and more importantly, the RF environment; and
-
Networking is the ability to communicate between multiple nodes and thus facilitate the combining of the sensing and control capacity of those nodes.
These new technologies and radio classes, albeit in their nascent stages of development, are providing many new tools to the system developer while allowing for more intensive use of the spectrum. However, an important characteristic of each of these technologies is the ability to change configuration to meet new requirements. This capacity to react to system dynamics will forever change how new uses of the RF spectrum are addressed.
Microelectromechanical Systems Filters
Microelectromechanical systems (MEMS) involve the integration of mechanical elements, sensors, actuators, and electronics on a common silicon substrate through microfabrication technology.
Recent technology developments have demonstrated the potential to create high-performance MEMS acoustic resonators. Other MEMS filter technologies under development include tunable resonators and multi-pole tunable filters, the integration of filter arrays with switch arrays to create large filter banks, and the integration of filter banks with active RF devices to form complete RF front ends. MEMS-based mechanical resonators and filters have shown promising characteristics in achieving high-Q values and good stability.
Digital Modulation and High-Efficiency Modulation Schemes
The signals received by radio astronomy and passive Earth remote sensing are random. The signals follow Gaussian statistics within a given bandwidth and
usually have a flat, featureless spectrum. Until recently, these characteristics distinguished natural signals from human-made signals, and this fact could be used as a tool to distinguish between the wanted natural signals and interference from human-made emissions.
The move to digital modulation, and in particular to high-efficiency digital modulation schemes, has the effect of making the human-made signals indistinguishable from the wanted natural signals. The statistical fluctuations with time, and the flat, featureless power spectrum displayed by such signals are nearly the same as the characteristics of the wanted natural signals that are the subject of the research. This situation has two detrimental effects:
-
One of the distinguishing characteristics of human-made interference, the presence of distinct and discrete carrier waves, has disappeared. The mitigation of interference is now made more difficult.
-
The higher spectral efficiency of modern modulation schemes is generally a very good thing. However, passive use-based research has often taken advantage of the inefficient modulation schemes by, for example, making use of small gaps between carriers in spectrum used by the active services. The greater efficiency of current spectrum use by the active services as enabled by higher-order digital modulations has unfortunately made passive use difficult or impossible.
Finding: The emergence of practices for the dynamic use of the spectrum will result in more devices with greater variability in active spectrum usage, and the EESS and RAS communities could be impacted with more unintentional radio interfering devices.
Finding: New cooperative spectrum management techniques that could be beneficial for enhanced interference management and increased spectral utilization have been investigated by regulators but have not been implemented.
Summary
The RAS and EESS have current spectrum allocations between 9 kHz and 3 GHz of approximately 62.12 MHz on a primary basis and 122.5 MHz on a secondary basis. However, the spectrum that the radio astronomy and Earth exploration radio science community currently use far exceeds these allocations. The use of new techniques requiring other spectral bands or additional spectrum is driven by the scientific requirements and made possible by continual technical developments, as discussed in Chapters 2 and 3. Since the RAS and EESS are passive services, they operate outside their allocations on a non-interference basis when the RFI is weak enough.
The strong increase in the number of devices and systems deployed for consumer, commercial, and industrial uses has fueled an interest in learning how the radio spectrum is actually used. While the various efforts of the active and passive user communities have been useful in confirming the sparse time-frequency utilization of the spectrum, most existing studies are of limited usefulness because of their limited sensitivity, time resolution, and frequency resolution. Useful spectral monitoring for RAS applications requires continuous time-frequency resolution on the order of 1 kHz and 1 microsecond, with sensitivity sufficient to detect signals approaching the levels already known to be potentially harmful to radio astronomy as determined in ITU-R Recommendation RA.769. For air- and spaceborne EESS applications, an adequate spatial resolution would be critical, as discussed in §4.1.
The major drivers for more intensive spectral use will come from newly deployed 3G and 4G cellular systems, new technologies for unlicensed devices (Wi-Fi, etc.), changes to the regulations, and the availability of advanced technologies such as cognitive radios. It should be expected that the use of the 700 MHz, 1710-1755 MHz, 2110-2180 MHz, and 2495-2690 MHz spectral bands will be greatly increased due to 3G and 4G cellular deployments. Unlicensed devices will continue to proliferate in the 5 GHz, 70-90 GHz, and 3.1-10.6 GHz (ultrawideband) spectral bands. The onset of agile, frequency-hopping radio technology will create challenges: the prediction of open spectral bands will become more difficult. Regulatory agencies determine the appropriate technical parameters for operation in each spectral band, but these rules are in constant flux. The agencies need to enhance their role with respect to the passive services to include interference metrics, an extension of enforcement technology, and the inclusion of passive systems in their databases (e.g., the FCC’s Universal Licensing System).
4.3
UNILATERAL MITIGATION TECHNIQUES
A variety of techniques have been developed to reduce the impact of RFI on EESS and RAS observations. This section presents a review of unilateral methods. These methods apply to situations in which the EESS or RAS operator has no ability to influence the behavior of the sources producing the interference. This is the most common situation, but at present the performance achieved by the majority of the unilateral methods has been documented only anecdotally and so remains to be completely quantified.25 Following the review of specific unilateral mitigation
technologies is a summary (in Table 4.2) of the successes that have been achieved as well as the inherent limitations of particular approaches.
Before proceeding further, it is important to distinguish among the various RFI environments and observational situations encountered by EESS and RAS systems. Both services are subject to variations in the RFI environment caused by changes in RFI source behaviors as well as by changes in the position of these sources (including the orbital motions of spaceborne RFI sources). However, EESS use is both ground- and space-based and needs access to areas on a global basis. Space-based radiometers operate in a conically scanning configuration in which the portion of Earth’s surface observed (and associated RFI sources) varies within the timescale of a few milliseconds—the duty factor for a given area observed. In contrast, RAS antennas typically operate at a fixed position on the ground and in a viewing configuration that is stable over timescales of several minutes to many hours in order to receive extremely weak signals.
The “downlooking” nature of EESS measurements makes the probability of ground-based RFI sources being within the main beam of the antenna a common occurrence, while the primary concern for main-beam corruption in RAS applications is spaceborne sources, which are encountered less frequently. The “uplooking” RAS systems are inherently more sensitive to RFI, owing both to the cold background sky (relative to the hot ground emission in EESS sensing) and to the typically long integration times. Main-beam corruption of EESS measurements, due to a reflection of space-based sources, has also been observed.26 Both systems are subject to the influence of ground- and space-based sources received through antenna sidelobes. RAS measurements are often interferometric, using antennas separated over distances that span continents and are millions of wavelengths in extent, whereas EESS radiometers typically use only a single antenna, and even interferometric systems in EESS are limited to maximum spatial separations on the order of meters (up to a few thousand wavelengths) due to the limited spatial extent available on a space- or airborne platform. Finally, systems operating in space are subject to restrictions on the output data rate not usually encountered by systems operating on the ground.
Technologies for Unilateral Mitigation
Unilateral mitigation methods involve two primary components: detection and suppression. The former involves the determination that a particular observation contains RFI, whereas the latter attempts to utilize information from the detection
stage in order to correct observed data by removing RFI contributions. The study of techniques both for detecting and suppressing RFI has been a topic of heightened interest in recent years, spurred by technological advances that enable real-time signal-processing approaches. Strong RFI sources that produce excessively high observed powers tend to be easily distinguished from astronomical or geophysical signals. In those cases, the detection problem is relatively straightforward. The detection of weak RFI sources that produce power levels comparable with those associated with geophysical or astronomical variability is much more difficult. This is problematic because, if not suppressed, weak RFI can still introduce significant errors into the scientific conclusions that are drawn from the measurements, often without warning.
It is very important to note that unilateral mitigation techniques do not and cannot solve the RFI problem. However, they can serve several important purposes. They can provide a means of limiting the introduction of corrupted observations into the scientific user community. They can provide significant relief from the laborintensive task of manually identifying the effects of RFI on science data products. And they can permit some limited scientific uses of very noisy, interference-laden portions of the spectrum that would otherwise not be possible. But in most scientific applications, RFI mitigation techniques cannot actually remove the interference from those portions of the spectrum where it is present. Thus it can be expected that as RFI becomes more prevalent, the need for interference mitigation in order to do useful science will increase, but at the same time the efficacy of mitigation efforts will decrease and the quality of the resulting science will suffer accordingly.
Detection Techniques
Various RFI detection techniques are available, with each typically oriented toward a particular class of RFI sources. A classical detection algorithm takes observed data as input and provides a binary “yes/no” output as to whether RFI is present. The input data can range from Nyquist sampled received voltages to final output powers integrated over millisecond or longer timescales. Detection algorithms involve a trade-off between the probability of detecting a specified type of RFI and the probability of obtaining a “false alarm” in which RFI-free data are erroneously classified as corrupted. An excessive false-alarm rate can lead to a reduction of measurement sensitivity; this can be addressed by modifying the detector, but typically at the cost of a reduced probability of detecting true RFI. Specific classes of detection techniques are described below.
Matched Filtering for Known Sources
The problem of detecting a specified signal in additive Gaussian noise (i.e., thermal noise) is well defined and has a long history of investigation in the signal-
processing literature. The best detection performance that can be achieved is obtained through a “matched filter” approach, in which the detector is a filter designed to have a frequency response conjugate to that of the signal of interest. This approach is the standard method for use in communications applications, but it has limited applicability in radio science applications because the RFI sources encountered are not always known a priori.
Tests for Gaussianity
Instead of attempting to detect particular RFI signals, it is possible to detect whether observed voltage appears to have originated from a thermal noise (i.e., Gaussian) field distribution. This is a classical problem in statistics, and numerous tests are available, with no particular test having been shown clearly superior for EESS and RAS systems. One example of this technique is a “kurtosis test,” which compares the normalized fourth moment of the observed voltage to that expected for thermal noise fields. This method has been shown to provide good performance in tests using ground-based EESS instruments, and the expected detection performance for pulsed-sinusoidal RFI interference has been analyzed in detail.27 However, the performance of this approach for other RFI source types remains to be quantified. An analog implementation of the kurtosis detector has also been described,28 as has a kurtosis method combined with multiple frequency channels for RAS applications.29 It should be expected that the modulation-insensitive nature of Gaussianity tests will result in a detection performance that is at best equal to that of detection algorithms designed for a priori known RFI source types. It is often the case that the nature of the RFI is not known beforehand. In these cases, tests for Gaussianity have been found to be a robust RFI detector.
Pulse Detectors
This is perhaps the oldest and best-known strategy for the detection of RFI, whether at timescales of the Nyquist sampled receiver bandwidth or at that of the final output data product. Typically, an “acceptable” range for the received data amplitude as a function of time is defined, and points outside this range are deemed
as corrupted. The acceptable range can be defined in either an absolute sense (i.e., fixed thresholds) or a relative sense (i.e., as a number of standard deviations around a local mean value). Pulse detectors operating at high sample rates are well suited for the detection of low-duty-cycle radar emissions; such sources typically transmit pulsed fixed-frequency or chirped sinusoidal waveforms with pulse lengths of 2-400 microseconds, 1-27 ms between transmitted pulses, and bandwidths on the order of 1 MHz. For low-duty-cycle pulsed interferers, the sensitivity of the detector depends on the relationship between the timescales of the pulsed RFI and the input data (i.e., the sample rate). Good detection performance can be achieved in cases where the individual pulses are resolved by the input data sample rate. A number of pulse detection techniques have been proposed and developed to various degrees. Pulse detection is, however, not at all appropriate for RFI sources that are continuous in nature.
Passive receiver blanking has been attempted using a special receiver and perhaps also a special antenna directed at the source of interference. This might, for example, mitigate interference from a pulsed radar transmitter. When the pulses from the radar are received, the radio astronomy receiver electronically triggers a data masking or data flagging process. The limitations of this method are primarily that it requires excellent sensitivity on the unwanted transmission, and secondly that it may be hard to accommodate transmissions arriving with different delays from different directions, such as multipath propagation with multiple reflections from surrounding mountains.30 In this case active receiver blanking using a beacon transmission on some carefully chosen frequency could be used at the radio astronomy site to blank the radio astronomy receiver. Note that the above scheme would not be effective for EESS due to the need for full global coverage.
Narrowband Source Detectors
Narrowband detectors are analogous to pulse detection methods but are better suited to signals that can be resolved in frequency—that is, searching for “outliers” among data in multiple frequency channels. Such approaches are designed to detect interference that is localized in frequency (i.e., narrowband), and performance is improved by matching the frequency resolution of the radiometer channels to that of expected RFI sources. Narrowband detectors record data in multiple frequency channels; these frequency channels can be achieved either by analog means (through use of a tuning receiver, a filter “bank,” or a spectroscopy method to create a set of channels) or digitally (using either an internal Fourier transform or a set of digital filters). Example algorithms for detecting narrowband interference in
a set of channel measurements have been described31 and “spectral differencing” techniques have also been applied to detect RFI with the Advanced Microwave Scanning Radiometer-Earth (AMSR-E)32 and WindSat radiometers33 currently in orbit. If narrowband detection strategies are applied in postprocessing (i.e., not performed in real time by the radiometer), their use implies that the data rate of the radiometer is multiplied by the number of channels used; the resulting data rate can easily become prohibitive for space-based systems.
Narrowband detection algorithms are best for narrowband sources of large amplitude; however, the contribution of these sources to the total observed noise power can remain small due to the small ratio of the source bandwidth to that of the total radiometer channel. Performance is degraded for lower-amplitude RFI sources occupying bandwidths that are appreciable compared to the total radiometer channel bandwidth. RAS science requires the narrowband detection of spectral line emissions from atoms and molecules with Doppler shifts owing to the relative motion of Earth and object as well as Doppler spreading owing to kinematics internal to the object. Weak narrowband RFI can preclude, or at least corrupt, such measurements. Combinations of pulse and narrowband detection strategies are also possible.34
Polarization-Based Algorithms
The polarization properties of received radio waves also provide an opportunity for RFI detection. Geophysical and astronomical sources have polarization properties that, in many cases, can be predicted a priori to within a reasonable uncertainty. RFI sources that are highly polarized can create power differences among polarizations that can be recognized as anthropogenic. The success of such approaches depends on the extent to which the RFI source emissions appear polarized to the radiometer (which depends on RFI source properties, the orienta-
tion of both the source and receiver antennas, and the influence of multipath and other propagation effects), as well as the level of natural variations in polarization signatures for the medium observed. A polarization detection strategy has been used to detect interference in data generated by the EESS satellite AMSR-E,35 but the strategy was found less sensitive to low-level interference than the spectral differencing method. An alternate polarization-based detection strategy based on the polarimetric channels in the radiometer of the EESS satellite WindSat was found to yield improved performance, because the small, geophysically expected polarized returns are readily exceeded by RFI sources.36 However, such detection strategies remain dependent on antenna orientation and observation geometry issues, as well as on RFI source polarization properties. To date, polarization-based methods have generally received less attention than that given to other detection strategies.
Multiple-Antenna Algorithms
For instruments using multiple antennas, RFI detection algorithms can be developed on the basis of the relationships among the waves received at the antennas. A useful concept in searches for astronomical transients is anticoincidence,37 in which the criterion for detection of astrophysical signals is that they appear in multiple, widely separated antennas, whereas terrestrial RFI should be relatively “local” and appear only in one or a subset of antennas. An inversion of this technique is used in an antenna with an array feed: the desired celestial signal is received in one of the many array feeds, but RFI is received in all of them. RAS synthesis imaging arrays such as the VLA and the Very Long Baseline Array have reduced sensitivity to RFI due to a lack of coherence of the RFI in the observed direction. However, RFI still has a deleterious effect, and strong RFI can ruin an observation even when it is received in only one of the array antennas. Other detection techniques for interferometric systems use the fact that interferometric radiometer observations produce a spatial covariance matrix whose elements consist of correlation products (“visibilities”) between all pairs of antennas in the interferometer. Estimates of the number of RFI sources and their locations can, under certain conditions,
be obtained from an eigenanalysis of this matrix. For example, strong RFI sources producing large eigenvalues can be detected in a manner analogous to the pulse detection process. Weaker RFI sources can be more difficult to detect, however. Interferometric detection strategies can be combined with the spatial excision suppression techniques discussed below.
Suppression Techniques
Suppression techniques can be divided into three categories: (1) Filtering is the simple process of designing receiver filters so that corruption from RFI sources outside a band of interest is minimized. (2) Excision is the removal of data in which RFI has been detected. A common property of all excision techniques is a partial loss of radiometry data as well as a possible distortion of non-excised radiometry data due to artifacts of the detection and excision process. (3) Cancellation is the subtraction of RFI from the radiometer output. Cancellation is potentially superior to excision in the sense that the RFI is ideally removed with no impact on radiometry, providing a “look through” capability that is nominally free of the artifacts associated with the simple “cutting out” of data. However, as discussed below, the trade-off with respect to excision is usually that suppression is limited. A further limitation of canceling techniques is that they tend to degrade into excision-type behavior when conditions are not optimal—for example, in low-interference-to-noise-ratio scenarios.
Filtering
While filtering is not necessarily a suppression strategy based on a detection process, its importance nevertheless motivates a brief discussion. All radiometry observations occur in a limited portion of the spectrum that is of interest for particular measurement purposes. Radiometer receivers are designed to include filter components to suppress the contributions of any emission sources outside the frequency range of interest. The performance of these filters can have a significant impact on the degree to which RFI corruption can occur. The bandpass filters used in radiometry ideally have a transfer function that is unity within the band of interest and zero outside this band, but such filters are not achievable in practice. Instead, the suppression of OOB power achieved by the filter “tails” must be traded against other filter performance properties. Strong RFI sources located outside the band of interest can make measurable contributions to radiometry measurements if filter performance is insufficient.
In terms of mitigation performance, it is desirable to place band-defining filter components as close to the antenna as possible, in order to reduce the tendency for strong out-of-band RFI to drive the receiver into nonlinear operation, resulting in compression or unacceptable intermodulation products. Unfortunately,
analog filters are inherently lossy, so using such a filter degrades the sensitivity of a radiometer, presenting a difficult trade-off between basic performance and the ability to tolerate nearby out-of-band RFI.
Excision
Excision refers to the deletion of data that are believed to be contaminated by RFI. The use of excision implies that a data set is available from which some data are removed through a detection process and the remainder are used in estimating astronomical or geophysical information. Excision algorithms that have been explored to date utilize data sets based on measurements as a function of time, frequency, or space.
Temporal excision is the most common process. It is based on removing detected observations from a time series of measurements (in EESS applications, time-domain excision leads unavoidably to the excision of data corresponding to distinct locations as well). Temporal excision can be performed in conjunction with any of the detection algorithms described previously, and at time resolutions ranging from the Nyquist sample rate (i.e., nano- or microseconds) to post-integration timescales of seconds or larger. Temporal excision ensures that detected RFI makes no contribution to scientific analysis but at the same time reduces the amount of data available for the same analysis and potentially introduces artifacts that can compromise the value of the remaining data. The best case is that a reduction in the amount of available data merely reduces the sensitivity of the radiometer observation. Thus, it is desirable to implement temporal excision at a timescale that is comparable to that of any pulsed interference sources in order to retain the maximum amount of data. Temporal excision is best suited for sources that are localized in time and is often used with a pulse detection strategy. Numerous examples of temporal excision exist in the literature, and recent works have demonstrated real-time onboard temporal detection and excision. The performance of temporal excision in suppressing RFI source contributions is limited solely by the performance of the associated detection algorithm, which determines the false-alarm probability and probability of detection for specific RFI types.
When measurements in multiple frequency subchannels are available, RFI contributions detected in a particular subchannel can be removed by discarding data from that subchannel in computations of average powers or other averages across frequency. Frequency excision is limited to narrowband RFI, but it has the advantage (with respect to temporal excision) of being effective against persistent interference. In total power radiometry (most EESS observations and “continuum” RAS measurements), discarding data in a particular subchannel again has the effect of decreasing the sensitivity of the radiometer measurement when total channel quantities are of interest. This method is typically not acceptable in high-sensitivity spectroscopy, which is a commonly used mode in the RAS, although it
is sometimes effective in imaging observations when the visibilities are computed on a narrowband basis. It is desirable to perform frequency excision at a frequency resolution that is comparable to that of observed RFI sources, so that a maximum portion of the noncorrupted spectrum can be retained. Given the fact that numerous RFI sources exist with bandwidths of 1 MHz or less, frequency resolutions below 1 MHz are desirable, but come at the cost of a greatly increased data rate if frequency excision is performed in postprocessing. Frequency excision has been demonstrated in combination with kurtosis, pulse, and narrowband detection strategies. Performance again is strongly dependent on the performance of the associated detection algorithm.
Spatial excision refers to the use of the beam-forming capabilities of compact antenna arrays—that is, arrays with maximum baselines on the order of wavelengths. One approach is based on synthesizing directly an antenna pattern null in the direction of a known RFI source; this is believed to be effective against RFI from satellites in RAS observations, although quite expensive and complex to implement. Sophisticated algorithms have been developed for this process in the RAS literature, and one of the key difficulties identified has been to minimize the impact of spatial excision on the main antenna lobe properties so as not to confound image calibration.38 Spatial excision is further limited by the degree to which the array geometry and individual antenna patterns are able to generate deep nulls, and the number of such nulls that can be formed without unacceptable mainlobe and sidelobe distortion. While this technique is used frequently in military antijamming applications, the problem is more challenging for RAS observations due to the low signal-to-noise ratios of the astronomical signals of interest.
Suppression methods other than simple excision of RFI-contaminated data are not widely used in the EESS and RAS, mainly because they are not easy to devise or implement and may require the development of extensive special hardware, software, or instrument modifications that potentially degrade performance. Furthermore, cancellation techniques typically lead to significant increases in the required computing power relative to that needed in interference-free conditions. However, recent studies have developed and demonstrated cancellation approaches for RFI mitigation in RAS applications. Cancellation requires a detailed knowledge of the RFI signal—for example, a priori information about the modulation type, or a copy of the signal obtained by other means—in order to estimate and subtract its contributions to the data. Obtaining a precise description of source properties is difficult when the corrupting sources are observed at low instantaneous interference-to-noise ratios, as is the case for ground-based sources in the sidelobes of an upward-looking RAS antenna. Two strategies for improving RFI
TABLE 4.2 Successes and Limitations of the Unilateral Mitigation Methods Employed to Date by the Earth Exploration-Satellite Service
|
Type of Radio Frequency Interference (RFI) |
Reference |
RFI Details |
Center Frequency (GHz)/Bandwidth (MHz) |
Detector Type |
Detector Time/Frequency Resolution |
|
Pulsed |
[1] |
Out-of-band emissions from an ARSR system observed at close range |
1.413/20 |
Kurtosis |
36 ms/3 MHz |
|
Pulsed |
[2] |
Out-of-band emissions from an ARSR system observed at close range |
1.413/20 |
Pulse detection |
10 ns/20 MHz |
|
Pulsed |
[3] |
Unknown source of presumably out-of-band pulses |
1.413/20 |
Analog pseudo-kurtosis |
0.5 s/20 MHz |
|
Pulsed |
[5] |
Airborne flight encountering many source types |
1.413/20 |
Kurtosis |
8 ms/20 MHz |
|
Narrowband |
[2] |
Airborne test flight encountering many narrowband source types |
5.5-7.7/100 |
Cross-frequency |
26 ms/0.1 MHz |
|
Wideband |
[2] [4] |
Airborne test flight encountering many wideband source types |
5.5-7.7/100 |
Cross-frequency |
26 ms/0.1 MHz |
|
Wideband |
[5] |
Airborne test flights encountering many wideband source types |
6, 6.4, 6.9, 7.3/400 |
Cross-frequency |
26 ms/400 MHz |
|
Gaussian-like |
|
None |
None |
None |
None |
|
[1] C.S. Ruf, S.M. Gross, and S. Misra, “RFI Detection and Mitigation for Microwave Radiometry with an Agile Digital Detector,” IEEE Transactions on Geoscience and Remote Sensing, 44(3): 694-706 (March 2006). [2] B. Guner, J.T. Johnson, and N. Niamswaun, “Time and Frequency Blanking for Radio Frequency Interference Mitigation in Microwave Radiometry,” IEEE Transactions on Geoscience and Remote Sensing, 45: 3672-3679 (2007). [3] Jeffrey Piepmeier, Priscilla Mohammed, and Joseph Knuble, “A Double Detector for RFI Mitigation in Microwave Radiometers,” IEEE Transactions on Geoscience and Remote Sensing, 46(2): 458-465 (2007). |
|||||
source knowledge are utilized. In the first, the upward-looking measurements of the RAS antenna are augmented with measurements from a “reference antenna” directed toward the source. This latter antenna observes RFI sources at a higher signal-to-noise ratio, which allows better estimation of RFI source properties in the cancellation process. A second approach is utilized for RFI sources with known modulations, for which a demodulation process can increase the signal-to-noise ratio. Given either a demodulation or second antenna measurement, cancellation then involves an estimation and subtraction of RFI source contributions to the data. The latter can be performed either “precorrelation” or “postcorrelation”—that is, either before or after the spatial covariance matrix is formed in an interferometric system. Cancellation performance is limited by the extent to which RFI sources can be detected and successfully estimated (a function of the signal-to-noise ratio at which the RFI sources are observed) as well as by the complexity and any temporal evolution of the RFI environment in which the observations occur.
Unilateral Mitigation Successes and Limitations
Table 4.2 above provides a short summary of the successes and limitations of the unilateral mitigation methods that have been employed to date by the EESS.
Finding: While unilateral radio frequency interference mitigation techniques are a potentially valuable means of facilitating spectrum sharing, they are not a substitute for primary allocated passive spectrum and the enforcement of regulations.
4.4
MITIGATION THROUGH COOPERATIVE SPECTRUM USAGE
The unilateral mitigation techniques described in §4.3 are at best a short-term solution to the RFI problem, which can be effective only when spectral occupancy is low and the RFI is easily distinguished from the background. This approach is otherwise inherently limited by the lack of coordination with the active services, and using only this approach, science users would perpetually be “guessing” how to work around RFI. This tactic will soon find its limits given the trends described in §4.1. A far more effective and efficient approach would be bilateral, or cooperative, mitigation.
Cooperative mitigation techniques would coordinate the timing and regional use of the radio spectrum in a far more dynamic manner than has existed with past technologies and regulatory structures. This is a new approach by which active services cooperate with passive (science) services within shared spectral bands by briefly interrupting or synchronizing radio transmissions to accommodate the science measurements. Such accommodations would occur only when and where those science observations are needed (e.g., during a satellite overpass), so the
impact on spectrum availability for active services would be very low. The intelligence of modern devices makes this approach attractive, and there will likely be many instances where the costs of this mitigation technology would be readily accepted by users eager to gain access to large portions of the spectrum. Indeed, many devices will need to possess the necessary technologies and standards to negotiate spectrum use automatically among competing users, so the extension of these standards to accommodate science users could, in principle, be accomplished with very low costs and with a very low impact on functionality.
Cellular telephones provide a familiar example and some insight as to how this technology could work: cell phone networks automatically coordinate spectrum use among large quantities of transmitting devices. These systems provide a very dynamic command-and-control authority to assign frequency, or to interrupt or deny service, or to give priority (e.g., when a user dials 911) for each device within and among cellular regions. Conceivably, these systems already represent most—if not all—of the needed infrastructure for cooperative mitigation. The only missing elements are the agreed-on standards and the software that would allow these systems to momentarily relinquish assigned spectral bands in response to science requests. These could be communicated either directly from EESS satellites, for example, or from a networked database.
Consider the following scenario for cooperative mitigation. For this example, it is assumed that 30 spaceborne microwave radiometers are engaged in Earth observations for operational and research-oriented scientific purposes. This fleet of EESS satellites passes over a specific area several times per day but for only very brief intervals during each satellite’s pass. The typical spot size of an EESS observation on Earth is about 30 km in diameter. Fixed or mobile transmitters operating within or near a receiving band used by the EESS could operate nearly full time if the transmitters were responsive to a blanking request signal or other preprogrammed transmitter time-off period that is coordinated with the overpass of each EESS sensor. Due to the brief time of footprint passage, this strategy would permit EESS receivers to measure microwave brightness temperatures while negligibly impacting active service performance. This would be especially helpful to EESS observations in bands that are not allocated to the service.
To determine the impact on active services, consider the fractional coverage of the fleet of EESS satellites. A “keep-out zone” of 10 times the footprint size, or 300 km in diameter, would generally ensure that the interfering source is well outside the near-sidelobes of the satellite instrument where it is most susceptible to interference. The total keep-out area on Earth for all spaceborne radiometers would then be of order 20π(150)2 = 1.4 million km2, or an area of approximately 0.3 percent of Earth’s total surface. If a random distribution of satellite locations is assumed, this fractional aerial coverage can, to first order, be equated with the fractional probability of occurrence of a satellite observation being made at a
particular location on Earth. Put another way, an active user could, on average, transmit 99.7 percent of the time within the detection band of a passive satellite sensor without causing any EESS interference.
Another cooperative arrangement is illustrated by a hypothetical situation in which all Air Route Surveillance Radars (ARSR), which operate at L-band, would be synchronized to a time standard that allows them to be blanked for the approximately 20 milliseconds for several times per day that the radar transmitter is located within the moving antenna footprint of an overhead EESS sensor operating in L-band. The loss of information to the radar service would be minuscule, and given the ubiquity of modern Global Positioning System (GPS)-based time synchronization and Internet-accessible ephemeris data, the cost of the hardware and software necessary to perform blanking would also be small. However, the value of interference-free data to environmental monitoring and forecasting services at several critical EESS bands, specifically L-band, would be immense. Similar synchronization signals could be made available from registered transmitters (both fixed and mobile) to fixed RAS and EESS users or to other users of the spectrum who could then use them to blank their own observations or raise data quality flags. Blanking regions, in certain cases of strong transmitters, could need to be extended to take into account reflections from geographical features.
The above arguments and statistics strongly suggest that better time management of the available spectrum could result in significantly more time-bandwidth product being made available to passive services without impacting active services to any appreciable degree. To simplify the implementation, cooperative strategies are best implemented in bands used by fixed, registered transmitters—rather than unlicensed devices—although most new Internet-connected and GPS, cellular, or Wi-Fi devices could readily be required to contain simple software for cooperative mitigation. Cooperative mitigation techniques have been proposed over the past decade for commercial and consumer devices such as commonly used cordless telephones and devices for use in TV white spaces.39 The extension of these techniques to the passive scientific community might provide many benefits. The committee anticipates that the active services could be viable partners in such an arrangement and could benefit from better usage of the active bands as well as from noteworthy public relations through their support of the EESS and RAS. It is conceivable, given appropriate management policy, that the passive spectrum could be “rented” to commercial interests when not needed, with revenues being used to support improved spectral usage studies and/or passive spectrum management needs.
Coordination between RAS ground stations and satellites containing trans-
mitters is critical for the present and future viability of the RAS, but it is much more difficult than ground-to-ground coordination, as is discussed in the next two paragraphs. For example, the coordination process between the RAS and Iridium, as discussed in §3.5, shows that coordination is not always successful at reducing RFI to needed levels.
As an example of successful collaboration, passive users of the spectrum and the Wireless Medical Telemetry Service (WMTS) were able to find a successful cooperative agreement in the 608-614 MHz in which both services still operate. In 1999, the U.S. Committee on Radio Frequencies (CORF) supported the FCC’s proposal for RAS and WMTS to share this band as long as the proposal was enacted in its entirety to include “service rules on eligibility, frequency coordination with RAS facilities, the necessity to protect RAS observations from interference, and technical standards (including field strength, separation distance from the radio observatory, and out-of-band emission limitations).”40 The proposal was enacted as supported by CORF, and the agreement between the services is seen by both parties as an excellent pairing of interests and one that has benefited them both substantially.
Similarly, a successful arrangement was made between the Arecibo Observatory and a nearby military radar station. The Puerto Rico Air National Guard operates a frequency-hopping radar with channels between 1220 and 1400 MHz at Punta Salinas, about 75 km from the telescope. Arecibo Observatory staff and the authorities at Punta Salinas devised a coexistence arrangement that involves blanking the transmitter when it is aimed at the observatory.
This is not meant to say that cooperative mitigation can replace the need for radio quiet areas or for restricted, passive-only bands. Indeed, since the development of passive techniques often occurs on unscheduled bases and in arbitrary regions, the need for emission restrictions within the small exclusively allocated spectrum and specific geographical zones remains. Many airborne and ground-based EESS experiments require continuous operation within a given zone and would not be able to yield effectively to active systems over time intervals exceeding even a few tens of percents. Such activity requires the use of restricted spectrum. Similarly, for the RAS, transmissions in geographical areas around radio telescopes must be avoided, and in order to maintain existing capabilities it should still be required that the RAS be given a chance to comment on all license applications for fixed and mobile transmitters within prescribed geographical zones around radio telescopes. However (and for example), in a shared time-of-day cooperative scheme, commercial traffic on certain shared bands of RAS frequencies might be
|
40 |
National Academy of Sciences, “Comments on Docket No. ET 99-255, Amendment of Parts 2 and 95 of the Commission’s Rules to Create a Wireless Medical Telemetry Service,” filed with the Federal Communications Commission on September 30, 1999. Available at http://sites.nationalacademies.org/BPA/BPA_048830; accessed January 14, 2010. |
acceptable in exchange for cooperative active access to other bands at suitable times, thus permitting effective radio astronomical observations to take place during transmission-free windows.
Finding: Nascent technologies exist for cooperative spectrum usage, but the standards and protocols do not.
The above finding is one of the key points of this section: the smart, inexpensive, portable, and highly networked electronics that are incorporated into many devices now have the capabilities needed for intelligent spectral sharing, but the organization of the manufacturing sector and the regulatory impetus needed to implement such sharing need to be developed jointly between the scientific and the industrial communities. It is likely that if such coordination can be developed, there will be additional spinoff benefits that will further facilitate spectral sharing within the purely active community as well.
4.5
MITIGATION COSTS, LIMITATIONS, AND BENEFITS
As the previous chapters and sections have illustrated, the nature of the costs of the interference problem for the EESS and RAS is wide ranging. The costs are manifested as impaired or even unusable data; costs are also incurred when the EESS and RAS programs must engineer technical or other fixes to mitigate the effects of interference on their operations.
Few of these costs can be monetized easily. The reason is that most of the value provided by the EESS and RAS is embodied in public goods—these include the host of environmental benefits and the improved ability to manage natural resources enabled by the EESS, and the enhanced or wholly new science understanding brought by the RAS. By definition, the societal benefit derived from public goods is difficult to express in dollar values. For example, even though improved forecasts are linked to reductions in weather-related loss of life and property, backing out the contribution of EEES data to this outcome is complex and difficult. It is even more complicated to back out from such a calculation the degradation associated with RFI.
This very problem is at the heart of spectrum allocation decisions when commercial services such as cellular telephones have an easily demonstrated market value, but scientific and other public uses of spectrum do not. As is well known from the literature on the value of public goods, however, simply because these goods are hard to monetize does not lessen their importance to society. Nor does this difficulty reduce the burden on decision makers to accord high importance
to public uses in making resource allocation decisions such as those involving spectrum. In this chapter the committee has sought to inform these decisions by highlighting the costs of the interference problem for the EESS and RAS.
Earth Exploration-Satellite Service (EESS)
The challenge to the EESS below about 10 GHz is from interference arising from high-speed electronics that incidentally radiate isotropically (e.g., electronic cameras and computers), and from short-range wireless services such as Wi-Fi, Bluetooth, and cellular telephones. Interference above about 10 GHz arises from poorly filtered or directed communications, radar, and related services in bands in or near passive bands, or in bands with harmonics in passive bands (see Tables 2.1 and 2.2 and Figure 3.10). Equipment radiating above 10 GHz is mostly sold to large entities at prices well above consumer levels, and mitigating filters or other RFI suppression devices could readily be added to that equipment. One exception is automobile anticollision radar being developed for large-scale consumer sales for use in the 23 GHz band, despite that band’s current worldwide exclusive ITU and FCC passive allocation (see also the discussion in §§2.5, 3.5, and 4.1). A potential future problem could arise if standards for widely used consumer equipment do not preclude incidental emissions above 10 GHz, which generally can be avoided with minor design changes at little cost.
Radio Astronomy Service (RAS)
The RAS is currently dominated by relatively few large radio observatories located in remote areas that nonetheless are beset by increasing levels of incidental interference from proliferating consumer-level electronics such as cellular telephones, Wi-Fi and Bluetooth systems, computers, and so on; from emissions from aircraft and satellites; and from over-the-horizon signals arising hundreds of miles away, well outside most protected areas but reflected by aircraft, the troposphere, and other means. Explicit expenditures for RAS mitigation research and implementation are modest because mitigation for the next generation of radio telescopes will be achieved primarily by the indirect costs of locating the observatories in extremely remote locations that are therefore more expensive to develop and operate (e.g., the Western Australian desert or the Chilean Andes). RAS costs are thus arguably already strongly affected by such remote-site mitigation costs, so little mitigation budget is left. Nonetheless, using horizon sensors to detect RFI of terrestrial origin is being pursued.
Nature of the Costs of Radio Frequency Interference to the EESS and the RAS
The discussion above illustrates that the costs of RFI to the EESS and RAS take several forms. One cost is the direct loss of information when RFI renders data and observations less useful or, in some cases, wholly unusable. This direct loss of information greatly reduces the societal value of the billions of dollars invested in the nation’s EESS and RAS physical infrastructure.
Another cost is that of actions that must taken to accommodate RFI, provided accommodation is even possible. As discussed in Chapters 2 and 3, these actions include alterations in sensor deployment and operations, changes in scheduling, and other technical and engineering adjustments.
Examples of lost information content include many examples in the cases of both the EESS and RAS. In the case of the EESS these include the following:
-
In some cases, despite extensive quality checking of EESS data, there are no good means of tracking the impact of a single observation that may be corrupted by noise. In the case of radiance assimilation for numerical weather prediction models, a single passive microwave satellite measurement that is contaminated with RFI at a level comparable to the satellite noise is unable to be distinguished from an uncorrupted measurement. The use of such a measurement can cause errors in an entire forecast.
-
The direct measurement of water vapor and cloud water can be provided only by microwave radiometers. These measurements are commonly made in the 22-24 GHz frequency range, but microwave point-to-point communications and automobile anticollision radars operating in this spectral band are a source of significant RFI that will increase as automotive radar becomes more common.
-
Another example is sea surface temperature, for which measurements are made at 10 GHz. Microwave brightness in littoral regions is impaired by contamination from the use of X-band spectrum adjacent to and within this spectrum allocation.
-
The 10.7 GHz channels of AMSR-E are RFI contaminated over parts of Europe and Japan and are not used in these locations. (On a research basis, it is still possible to use the 6.9 GHz band for soil moisture retrieval over large regions.)
-
RFI in bands below 10 GHz can compromise or even render unusable the unique soil moisture information obtained at 1.4 and 6 GHz.
In the case of the RAS, examples include the following:
-
The detection of deuterium formed during the Big Bang and now found in interstellar gas was for many decades impeded by RFI. Detection was possible only after extensive shielding and the use of RFI monitors.
-
To date, efforts to detect the redshifted (into the VHF-band) 1420 MHz emission of the epoch of reionization have been defeated by RFI; examples include experiments at Arecibo and at the VLA.41,42
-
1612 MHz imaging by the VLA was crippled by legal emissions from the Iridium satellite system until new filters were installed in the VLA. See Figures 3.10 and 3.11.
Characterizing these examples of lost information in financial terms is extremely difficult, given the public-good nature of the EESS and RAS. If a loss in the value of the information could be easily monetized, spectrum regulators would have some basis by which to compare the value of spectrum allocations to the EESS and RAS with allocations for consumer products that create many RFI problems. The methodological challenge posed by the comparison of public goods with consumer goods in deciding how best to allocate and manage spectrum among competing uses is well known.43
Another approach to characterizing the costs of RFI involves estimating the costs of the activities undertaken to mitigate or avoid RFI damage. In the case of the RAS, Box 4.1 describes some examples of mitigation costs. By asking what it costs to avoid or mitigate damage, regulators could compare the cost to the EESS and the RAS of avoiding damages with the cost to sources of RFI of mitigating their RFI (such as using filters or other means of RFI suppression). Whichever services face the least cost, either to avoid damage from RFI or to mitigate the creation of RFI, could be asked to bear the financial burden of taking the action. This approach of comparing costs can be useful to spectrum managers. However, because it only looks at costs, and not at benefits to society, of the information provided by the EESS and the RAS, the avoided-cost-based approach is inferior as a means of guiding spectrum management.
|
BOX 4.1 Illustrations of Radio Astronomy Actions and Costs for Radio Frequency Interference Mitigation
|
Summary
Increasing levels of incidental interference from proliferating consumer electronics and other sources threaten the EESS and RAS. The primary current EESS problem is active services in passively allocated bands where the atmosphere is sufficiently transparent that EESS instruments see Earth’s surface. The RAS is strongly affected by emissions from aircraft, satellites, and over-the-horizon signals, necessitating the siting of sensitive observatories in remote locations. All RFI poses the potential for loss of information in EESS and RAS observations and data, thus undermining realization of the full societal benefit of Earth and radio astronomy science.


