
3
The Radio Astronomy Service
Over the past 75 years, astronomical observations at radio frequencies have transformed the understanding of the universe. They have allowed fundamental scientific issues to be addressed—these include the creation and ultimate fate of the universe, the distribution of matter and primordial energy in the universe, and the environment and manner in which stars and planets form. Many astronomical discoveries that have captured the imagination of astronomers and the public alike were made accidentally with radio telescopes; a list of such discoveries would include that of the primordial cosmic microwave background (CMB), celestial masers, and pulsars—the latter being the dense, fast-rotating, radio-emitting remnants of massive stars. With powerful new facilities such as the Atacama Large Millimeter Array (ALMA), the potential for unexpected discoveries will grow substantially. As was fittingly said in this context years ago by two famous radio astronomy pioneers, “We cannot discuss plans to discover the unsuspected …,”1 but the parade of new, unexpected discoveries has been continuous since the beginning of radio astronomy in the 1930s. With the unprecedented regimes of sensitivity that will arrive with new and planned instruments, one can expect that further remarkable discoveries will be made.
Astronomical discoveries have been made possible by the steady and enormous improvement in sensitivity that is shown in Figure 3.1. In this graph the ordinate represents sensitivity and is on a logarithmic scale; there has been an improvement
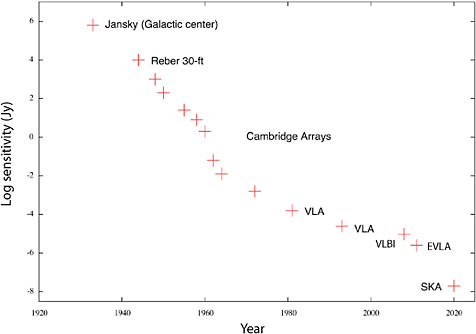
FIGURE 3.1 The minimum detected or detectable signal in flux density versus the year of measurement. The sensitivity is proportional to the temperature of the receiver system and inversely proportional to the collecting area and the square root of both bandwidth and integration time. For measurements after year 1990, an integration time of 12 hours is assumed. The rapid improvement over time is due to system improvements, including the decrease in system temperature (solid-state technology), the increase in collecting area (cost and construction efficiency), and the increase in bandwidth and integration time (electronic and digital technology). The improvement from 1933 to 1983 is about 10 orders of magnitude, a halving time of less than 2 years: a performance improvement similar to that described by Moore’s law. Acronyms in the figure are defined in Appendix F. Figure adapted and updated from J.M. Moran, “Peter Mezger and the Development of Radio Astronomy in the U.S. and Germany, and the Discovery of Radio Recombination Lines,” pp. 475-488 in The Nuclei of Normal Galaxies, Lessons from the Galactic Center, Proceedings of the NATO Advanced Research Workshop, NATO Advanced Science Institutes Series C, Vol. 445, A. Harris and R. Genzel, eds., Kluwer, Dordrecht (1994).
of 10 billion in 70 years, and there will be another improvement by a factor of 1,000 from the Very Large Array (VLA) to the Square Kilometer Array (SKA) when it is built. (See Table 3.1 in §3.2, “Radio Observatories and Radio Telescopes,” for the characteristics of the newer instruments.)
The current scientific questions that are motivating the construction of these new telescopes are no less exciting than those that were resolved in the past. Obvious
|
BOX 3.1 Nobel Prizes in Physics for Developments and Discoveries in Radio Astronomy Radio astronomy has been internationally recognized for its fundamental contributions to knowledge. The Nobel Prize in physics has been awarded to eight radio astronomers. The names of the scientists who led the teams to these discoveries, the year of award, and a brief description of the prize-winning science, are listed below.
|
examples include the exploration of planetary systems in formation around other stars, measurements of neutral hydrogen in the early universe, and the study of star formation in distant galaxies. Furthermore, it is through radio observations that the discovery of life-indicating molecules in other planetary systems might be made.
The scientific and technical advances of radio astronomy have been internationally recognized, as listed in Box 3.1. The Nobel Prize in physics has been awarded to eight radio astronomers in the past 40 years.
3.1
THE SCIENTIFIC IMPACT OF RADIO ASTRONOMY
What follows is a summary of the scientific advances made possible in a few areas by radio astronomy. A discussion of some advances expected in the near future is also provided.
Origin of Planets and the Solar System
Speculations concerning the origin of the solar system stretch far back in the science and philosophy of humans. During the coming decade, the capability of understanding the origins and evolution of other planetary systems and thereby coming to understand the origin of our own planetary system will exist: ALMA and the Expanded Very Large Array (EVLA), both coming online in a few years,
will make it possible to detect planets in formation around other stars. ALMA and EVLA will enable the study of the structure, dynamics, and temperature of the material from which planets are forming. The planned Square Kilometer Array will enable detailed studies of such disks. The key strengths of radio measurements that will enable these studies are their ability to trace the distribution of gas and dust throughout the disk, to study the dynamics and temperature of the material involved in planet formation, and to follow the accretion of material as it develops from the tiny, submicron dust particles characteristic of the interstellar medium to centimeter-sized clumps, the first critical step in the formation of terrestrial planets. These radio capabilities are unique in enabling scientists to learn about the physical and dynamical processes that govern the planet-formation process and its outcome—a planetary system. They will be able to “see” the formation of giant planets through the gravitational and thermal influence of these planets on the surrounding gas. Scientists will see disks with gaps and inner clearing zones that are caused by planets. They will be able to follow the orbits of the planets by how they sculpt the disk and to study characteristics of the planets by probing their interaction with the disk material.
At present, search techniques for extrasolar planets, or exoplanets, are strongly biased toward finding large planets close to their host star; and correspondingly, the 358 planetary systems known as of November 2009 are very different from our own solar system.2 They typically contain one or more Jupiter-like giant planets in orbits closer than that of Earth, and with eccentricities exceeding those of any planet in our solar system. There is no well-accepted theory for how such planets form or why they should be common. Prior to the discovery of exoplanets, our solar system was thought to be typical, and a template for all planetary systems. This is now known not to be true, and our understanding of the diverse outcomes of formation is significantly incomplete. So that this formation problem can be properly addressed, observations of many young stars are needed. These observations will lay the groundwork for an understanding of the many possible outcomes of the planet-formation process and how terrestrial planets fit into the general picture.
The new knowledge of the existence of other planetary systems gives rise to many intriguing questions. Does life exist elsewhere, or is it unique to the solar system? Could there be a common starting point for life? The abundant and complex chemistry of the interstellar medium and of protoplanetary systems possibly provides an answer. More than 140 molecules have been discovered in the interstellar medium. Those with more than four atoms are dominated by carbon, nitrogen, oxygen, and hydrogen. The 31 molecules with seven atoms or more are nearly all organic molecules. They include glycoaldehyde (a simple sugar), and urea and glycine (the latter being a simple amino acid common to life) may have
|
2 |
Data from http://exoplanets.org/, accessed November 24, 2009. |
been detected. Clearly, the carbon-nitrogen-oxygen chemistry that dominates life on Earth also dominates the complex chemistry of space.
The radio spectrum is the place to pursue a connection between astrochemistry and prebiotic terrestrial chemistry because it gives access to the wealth of spectral lines. With the sensitivity and resolution of the coming generation of radio telescopes, it will be possible to search for sugars and amino acids and to follow the flow of chemistry from molecular clouds into protoplanetary systems. Is there a strong interstellar heritage to the chemical compounds that comets and other bodies delivered to early Earth? What is the dominant chemistry of a protoplanetary nebula and how does that change the chemical composition of the planet? Was life on Earth seeded by interstellar molecules?
In addition to these questions, others arise because the molecular composition of interstellar and protoplanetary material is strongly impacted by the physical processes that act on the gas. Selected molecules can act as tracers to follow specific physical processes. For example, silicon monoxide (SiO) is commonly used as a tracer for strong shock waves associated with outflow activity, because silicon is heavily depleted onto dust grains, which are readily destroyed by shocks. That destruction liberates silicon into the gas phase, and this silicon is quickly incorporated into SiO. Methanol is a similar tracer for weak shocks, which evaporate ices. These tracers, and others presumably yet to be discovered, will provide important insights into the processes that shaped our solar system and that shape other planetary systems.
Now that many planetary systems are being discovered, the search for signs of extraterrestrial life is becoming more compelling. The many planets that will be discovered in the “habitable zone” in the coming years are obvious targets. Searching in the radio band is thought to be the optimum strategy, and some limited searches have already been made with the telescope at the Arecibo Observatory and with other smaller telescopes, but no results have yet been achieved. The Allen Telescope Array (ATA), a dedicated instrument for searching for extraterrestrial signals, is completing its first stage of construction as of this writing and will begin work soon. It will be a multibeam telescope, able to look at many stars simultaneously. This search for an extraterrestrial civilization, while a “long shot,” is seeking an answer to a basic and profound question: Are we alone in the Galaxy?
Origin and Evolution of the Universe
In the past few decades, cosmology, the study of the origin and evolution of the universe, has been revolutionized. Whereas 30 years ago only a few broad facts in this field were known, today cosmology is a quantitative science with specific, testable hypotheses. This revolution stemmed from advances in astronomical techniques that broadened astronomy from its origin in the optical wave band to the entire electromagnetic spectrum. This expansion across the spectrum was
|
BOX 3.2 Redshift The continual expansion of the universe stretches electromagnetic waves so that they are received on Earth at a frequency lower than the frequency that they had when emitted. This effect is known as redshift, because light is shifted toward the red end of the spectrum as the distance is increased. Also, because the velocity of light is finite, more-distant galaxies are seen as they had been at earlier times. Looking at distant galaxies, one sees the universe at an early epoch. |
pioneered by radio astronomy, which has been essential to the study of cosmology because radio astronomy alone can detect the bulk of the coldest matter in the universe, and can detect it at enormous distances and early times (see Box 3.2). We now know that the observable universe has expanded from its origin in a Big Bang some 14 billion years ago. It cooled as it expanded, and nuclei of hydrogen and helium were formed in dense opaque plasma. With further cooling, nuclei and electrons combined into atoms, and the universe became transparent but now dark, since as yet there were no stars. In subsequent evolution, the higher-density regions were able to collapse under their own gravity, giving rise to the first stars and galaxies (see Figure 3.2).
Fifty years ago the space density of bright radio galaxies was found to increase with distance faster than expected from the expansion, demonstrating the evolution of the universe and revealing a remarkable epoch of galaxy formation some 10 billion years ago. It was through this simple observation that radio astronomy ruled out the rival, steady-state theory of a non-evolving universe and favored evolutionary models in which the universe has expanded from a compact, hot origin.
Radio astronomy also provides the strongest evidence for the Big Bang through the discovery of the cosmic microwave background (CMB) radiation in 1965. This background radiation fills space and has an accurately measured blackbody spectrum with a temperature of 2.725 K and a broad peak at about 100 GHz. This radiation was emitted some 400,000 years after the Big Bang, at a time when the universe had a temperature of about 3000 K and was becoming transparent. Since that time, the radiation has been stretched by a factor of about 1,000 through the expansion of the universe, and the temperature has decreased by the same factor. Because this radiation is so weak and so highly isotropic, it is difficult to distinguish from local sources of noise. Only very careful observations have been able to demonstrate its existence.
The CMB has proved to be a gold mine of information about the early universe. The radiation comes from early times when the universe was nearly homogeneous,
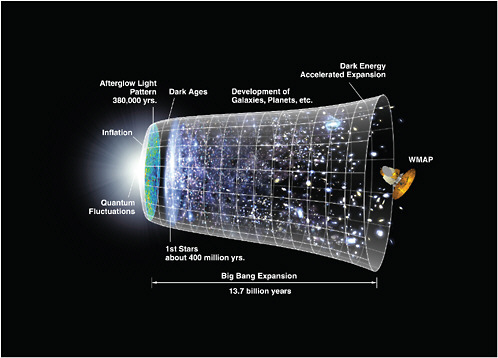
FIGURE 3.2 Artist’s conception of the history of the universe. Time runs from left to right. The universe was born in an explosion popularly called the “Big Bang,” which perhaps came from a “quantum fluctuation,” a phenomenon well known in physics. After a period of hyper-expansion (“inflation”), the universe settled to a nearly steady expansion rate. As the plasma became neutral, the afterglow died out, and the universe became dark. After hundreds of millions of years, gravitational contraction of the material in the original density fluctuations produced the first stars, which gave off light, and so the “Dark Ages” ended. Further generations of stars formed, and galaxies and black holes coalesced from the stars. The universe became more complex and now is evolving rapidly, with many varieties of stars and galaxies and exotic objects, including a planet containing sentient beings who are able to contemplate this vast universe. Results from the Wilkinson Microwave Anisotropy Probe (WMAP) satellite (shown in the figure) were used to make the afterglow pattern. Image courtesy of NASA/WMAP Science Team.
but even then there were small density and temperature fluctuations that became the seeds of stars and galaxies. After extensive searches, the Cosmic Background Explorer (COBE) satellite found these fluctuations in 1992, at a level of 1 part in 100,000 of the background temperature. The fluctuations appear to be random on the sky, but they have a characteristic angular scale of approximately 1 degree, which reveals properties of the plasma from which they were emitted. Measurements of the angular power spectrum of the fluctuations have fixed the conditions of the universe at the emission time, when the plasma changed to a neutral
gas of hydrogen and helium. Along with observations in other wave bands, radio observations of the CMB have revealed that most of the material in the universe cannot be “normal matter”; it must be something that does not emit or absorb electromagnetic radiation: “dark matter.” In addition, 70 percent of the density is made up of “dark energy,” which has a repulsive antigravity effect, causing the expansion of the universe to accelerate.3
The fluctuations of the CMB have immense cosmological significance, and they are being studied with many instruments. The emission is broadband but peaks at a few hundred gigahertz, where atmospheric emission is a serious contaminant. Hence, the instruments are located on high mountain sites, on balloons, or on satellites. Very wide bandwidths are needed to detect the tiny signals. The CMB fluctuations are linearly polarized at about the 10 percent level, and this provides further insights into the early universe. CMB studies provide a testing ground for theories of fundamental physics and theories on the nature of space and matter, at energies that cannot be reached by experiments on Earth.
Between the epoch of recombination, when the universe became transparent and the CMB was emitted, and the epoch of galaxy formation, when stars first began to light up the universe, lies the “Dark Ages” of the universe (see Figure 3.2). This period cannot be studied by optical astronomy, but radio provides a window by way of emission from neutral hydrogen. Over the next decade this study will be one of the major thrusts in radio astronomy. The emission, redshifted from 1.4 GHz, will be detected at much lower frequencies, 200 MHz and below. It will be very faint, and radio interference will be a serious concern. Such observations will have to be made from remote sites and will require careful attention to the mitigation of radio frequency interference (RFI).
Pulsars and General Relativity
Pulsars are ultradense collapsed cores of heavy stars in the form of neutron stars that have completed their nuclear burning and exploded. Pulsars have a very strong magnetic field and generate a radio beam that, because the neutron star is spinning, produces radio flashes in the same manner that a lighthouse generates optical flashes. In some cases, the pulsar, remarkably, is spinning at about a thousand times a second, leading to the term millisecond pulsars.
Because a pulsar is ultradense, its gravity is ultrastrong, and it provides a natural laboratory for the testing of Einstein’s theory of general relativity (GR). One predic-
tion of GR is that the orbit of a pulsar in a binary stellar system slowly decays due to the emission of gravitational waves (Figure 3.3). The measurements accurately fit the prediction and prove that gravitational waves do exist. For this demonstration, Hulse and Taylor were awarded the Nobel Prize in physics in 1993 (see Box 3.1).
However, this orbital decay is a “weak-field” effect, and GR has not yet been tested in the “strong-field” case. This leaves a fundamental question in physics: Is Einstein’s theory the final word in our understanding of gravity? Important questions are unanswered: Can GR correctly describe the ultrastrong field? Are its predictions for black holes correct? Is the cosmos filled with a stochastic gravitational-wave background? Radio observations of pulsars now approach these questions, and the largest radio telescopes, including the Green Bank Telescope (GBT) and the Arecibo Observatory, and especially the SKA, should give some answers. These telescopes offer the possibility of probing the strong-field realm of gravitational physics by finding and timing many pulsars. The ultimate goal is to obtain extremely tight limits on deviations from GR, to a level a thousand times better than present solar-system limits.
In the coming years, radio observations will identify hundreds of millisecond pulsars across the sky. Timed to high precision (~100 ns, the time that it takes light to travel 100 feet), these pulsars will act as multiple arms of a cosmic gravitational-wave detector. This “telescope” will be sensitive to gravity waves at frequencies of nanohertz and will complement the much higher frequencies accessible to direct gravitational-wave detectors such as the Advanced Laser Interferometer Gravitational Wave Observatory (LIGO, ~100 Hz) and the Laser Interferometer Space Antenna (LISA, 1 mHz). The largest radio telescopes will be crucial for these observations.
Galactic Nuclei and Black Holes
The first stars and galaxies formed out of the fluctuations in the early universe. A detailed understanding of how these processes unfolded will probably be one of the major achievements of astronomy in the coming decades. Astronomers have concluded that most galaxies have a giant black hole in their nuclei, with mass between a million and a billion times the mass of the Sun (see Box 3.3). It is not known whether the black holes formed first and galaxies of stars formed around them or the galaxies formed first and the black holes later condensed from the inner core. A remarkable correlation, however, has been found between the mass of black holes in galaxies and the mass of the halo of stars that surrounds them.4 This relation implies the existence of some regulatory or feedback process linking the black hole and its halo of stars. Over cosmic time, a galaxy grows through mergers
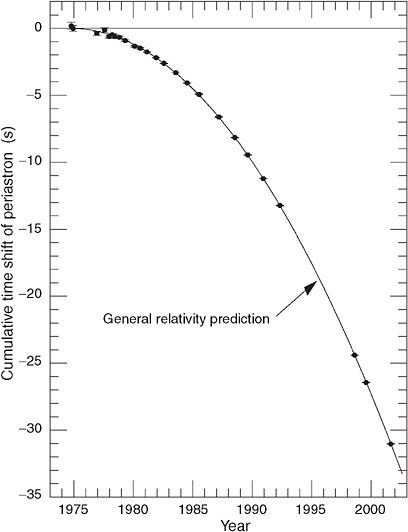
FIGURE 3.3 The results of 30 years of observations at the Arecibo Observatory of the radio-emitting pulsar B1913+16. The pulsar is in orbit around a companion neutron star. General relativity (GR) predicts that the orbits of the two stars will shrink as orbital energy is lost to gravitational radiation. This figure shows the first detection of this effect: measurements of the orbital phase (the data points) exactly match the prediction (solid line) calculated with GR. SOURCE: J.M. Weisberg and J.H. Taylor, “The Relativistic Binary Pulsar B1913+16: Thirty Years of Observations and Analysis,” Astronomical Society of the Pacific Conference Series, Vol. 328, F.A. Rasio and I.H. Stairs, eds., 2005.
|
BOX 3.3 Black Holes Einstein’s theory of gravity (general relativity) predicts that when matter is compressed sufficiently, it contracts into a region of space where gravity is so strong that nothing, not even light waves, can escape. Hence, this ultimate compression forms a dark region that is called a black hole. However, matter falling into a black hole must release some of its energy before it goes “inside.” Thus there can be a bright region near the black hole. Further, the mass of the black hole still produces a gravitational effect. Radiation from infalling material and gravitational effects on the motions of nearby bodies can reveal the presence of a black hole and can give a measure of the mass that the black hole contains. In this way, black holes have been found with masses from a few times to a billion times the mass of the Sun. It has been shown that the center of the Milky Way contains a black hole with a mass of about 4 million solar masses.1 |
with nearby galaxies, and the disruptive forces of these events trigger episodes of star formation. Meanwhile, the central black hole grows episodically by accreting material from the inner parts of the galaxy. The accretion disk that forms during such periods can sometimes produce more radiant energy than all the billions of stars in the galaxy combined—the black hole and disk in this condition is called an active galactic nucleus, or AGN.
An early result from radio astronomy was the realization that most of the bright sources of radio radiation lie outside our own Galaxy, the Milky Way, and have high redshifts, so they must be at “cosmological” distances. These objects lie in the nuclei of galaxies and are created as material swirls into giant black holes at the centers of the galaxies. Much of the radiation is emitted anisotropically in two narrow jets along the rotation axis of the black hole (Figure 3.4). The brightest objects—quasars—are those in which the jets are pointed almost directly toward Earth. The discovery and study of these powerful “radio galaxies” in the 1960s provided the first evidence for the existence of supermassive black holes—evidence that was based on the energy conversion required. A major discovery from radio astronomy, made by the technique of very long baseline interferometry (VLBI), was that the jets are flowing at relativistic speeds—close to the speed of light—and that the radiation is beamed by the effects of special relativity.
The best-studied supermassive black hole is the one in the center of the Milky Way; it has a mass of about 4 million times the mass of the Sun. Attention was first drawn to it as an important astronomical object in 1974, when radio emission from its envelope was seen. This radiation comes from relativistically excited gas that is
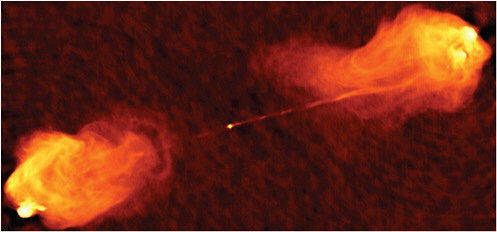
FIGURE 3.4 The remarkable nucleus, jets, and outer lobes of the radio galaxy Cygnus A. The nucleus contains a massive black hole that is accreting gas and dust, and some of the gravitational energy that is released is channeled into opposing jets. The jets contain a flow of relativistic plasma that, when stopped by the extragalactic material far outside the galaxy, generates the huge lobes. This image was made with the Very Large Array at a frequency of 5 GHz and with an angular resolution of 0.5 arcsecond. Image courtesy of NRAO/AUI/NSF.
spiraling into the black hole. It cannot be seen with an optical telescope because the central region is so dusty, but the radio waves readily penetrate dust.
The rate at which the black hole at the center of the Milky Way is growing has been measured by radio techniques. It currently is in a quiescent period, undergoing low accretion. In more active galaxies, the central black holes are accreting mass thousands of times faster.
Spectral line emission from water vapor at 22 GHz has turned out to be an unexpectedly important probe of the environments of supermassive black holes in the nuclei of galaxies. Water vapor appears as a trace constituent in the accretion disks that surround these black holes, and it emits radiation by the maser (microwave amplification by stimulated emission of radiation) process. This causes the emitting condensations, called spots, to appear as spectacularly bright but very compact sources of radiation whose positions and velocities can be measured precisely with a continental-scale radio telescope, called a VLBI array. In a stunning series of measurements, the orbital motions in the disk of one such galaxy, NGC4258, have been traced in detail (Figure 3.5). From these observations the mass of the black hole can be determined from Kepler’s laws of motion, and also the distance of the black hole from Earth can be determined by the comparison of the angular and linear velocities of the maser spots. The measurement of distance by this direct trigono-
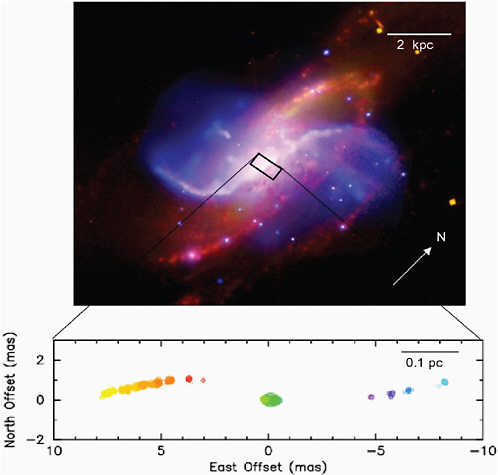
FIGURE 3.5 The galaxy NGC4258, shown in the top panel, is a relatively normal looking spiral galaxy, lying about 23,500 light-years from Earth. However, observations of the water line at 22 GHz show bright maser emission, as seen in the lower plot, whose scale is enlarged by a factor of 10,000 with respect to the upper plot. Each "spot" in the lower portion represents a separate maser whose velocity, derived from the Doppler shift, is color-coded: red = −500 km/s; blue = 1,500 km/s. The thin curved distribution of masers with the observed velocity distribution traces a thin disk of material in orbit around an unseen black hole with a mass of about 40 millions times that of our Sun. (Note: 1 pc = 3.3 light-years.) Adapted from T. Yang, B. Li, A.S. Wilson, and C.S. Reynolds, “Spatially Resolved X-Ray Spectra of NGC4258,” Astrophysical Journal, 660: 1106 (2007); and A.L. Argon, L.J. Greenhill, M.J. Reid, J.M. Moran, and E.M.L. Humphreys, “Towards a New Geometric Distance to the Active Galaxy NGC4258: I. VLBI Monitoring of Water Maser Emission,” Astrophysical Journal, 659: 1040 (2007).
metric technique has important implications for establishing the “cosmic distance scale,” that is, calibrating the relation between redshift and distance.5
As interesting as the active black holes themselves are the kinds of galaxies that give rise to such activity. Studies of the “host galaxies” in which active black holes reside have been made over the past few decades. Radio telescopes have been and will continue to be a major contributor to such studies, through their ability to detect star-forming gas and feedback from supernovae in host galaxies and other objects (see the subsection on “Galaxies,” below). Both ALMA and EVLA, with their high resolution and sensitivity, will push the studies of star formation in host galaxies closer to the nuclear region in which the active black hole resides, thus allowing for the interplay between the black hole and nuclear star formation to be assessed.
Galaxies
The study of star formation in our Galaxy and in others is one of the primary areas of science done at millimeter wavelengths (68-115 GHz). Stars form in giant molecular clouds composed primarily of diatomic hydrogen (H2); however, H2 is particularly difficult to detect because it has no permanent dipole moment. As a result, astronomers use carbon monoxide (CO) as a proxy for H2. CO is collisionally excited by H2, and the resultant emission from CO is observable at radio wavelengths. Hence the properties of star-forming gas are commonly measured with radio telescopes. An example of CO emission from a nearby galaxy is shown in Figure 3.6.
CO emission has been detected in many varieties of galaxies, including some with redshifts up to 6.4, so that the photons now observed were emitted when the universe was only a few percent of its present age. With radio telescopes, it is thus possible to study the properties of star formation in normal galaxies such as our own, in exotic galaxies with vigorous star formation accompanied by accretion onto black holes (e.g., radio galaxies and quasar host), and in distant galaxies likely undergoing their first burst of star formation. An important fact about these observations is that, owing to the motions of nearby galaxies and the redshifts of more distant ones, CO emission is rarely observed at or even near the rest frequency. The 115 GHz line is observed in “local” galaxies (redshift <0.3) down to frequencies of 88 GHz. Observations at high redshift (z > 2) are becoming routine; this requires either looking at higher-level transitions of CO redshifted into the 3 mm (68-115 GHz) window or observing the ground-state (115 GHz) transition at much lower frequencies (22-50 GHz).
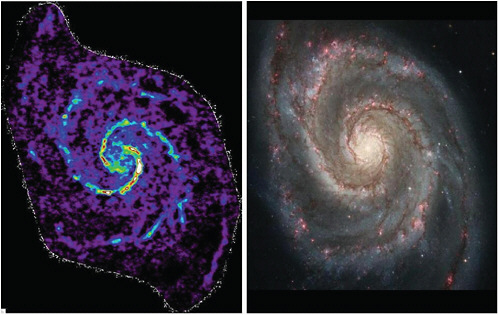
FIGURE 3.6 (Left) An aperture synthesis map at 115 GHz of carbon monoxide (CO) spectral line emission from the Spiral Galaxy Messier 51 (the “Whirlpool” Galaxy). The CO, which is tracing star-forming molecular gas, is observed to follow the spiral arms shown in the Hubble Space Telescope optical image of the galaxy (right). The image is approximately 40,000 light-years across. The CO image was made by combining 200 hours of observations at the Combined Array for Research in Millimeter-wave Astronomy with 40 hours of observations at the Nobeyama Radio Telescope in Japan. Image courtesy of Space Telescope Science Institute.
Solar Physics and Space Weather
The nearby Sun is the only star that there is a chance of studying in detail. Knowledge of the Sun illuminates the understanding of other stars and generally helps place the Sun and its attendant suite of planets into the context of stellar physics and the evolution of stars and planets. In addition, the Sun’s atmosphere is a remarkably active, even violent region, and it regularly impacts Earth with disturbances that can have technical and economic consequences. There currently is a proposal to build a powerful new instrument, the Frequency Agile Solar Radiotelescope (FASR), that would greatly increase the capability of measuring the solar atmosphere over a wide frequency range, at high time and angular resolution.
The Sun’s atmosphere emits strongly at all radio frequencies by a variety of emission mechanisms, allowing observers to probe the physical processes that are active on the Sun. Flares on the surface are explosions connected with the disappearance or reconnection of magnetic fields (Figure 3.7). Strong bursts of
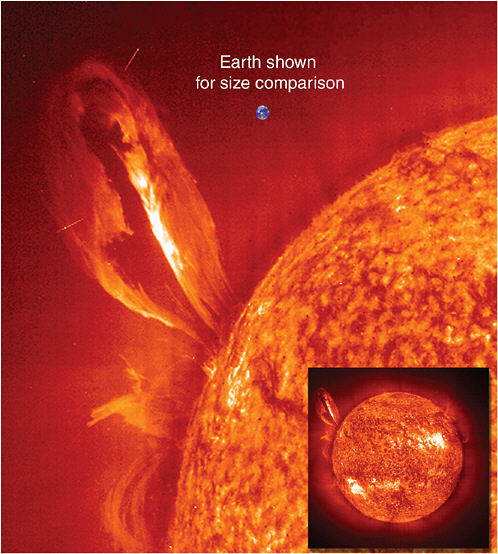
FIGURE 3.7 A large eruptive prominence above a solar flare, seen in the ultraviolet light of ionized helium, with the Solar and Heliospheric Observatory (SOHO) satellite, July 24, 1999. For size comparison, Earth is shown as the small blue circle. The flare started with an eruption of twisted magnetic field through the surface. The magnetic field loop is rising rapidly through the corona and will separate from the Sun to form a coronal mass ejection (CME). This particular CME did not hit Earth, however, as it started in a direction perpendicular to Earth. The inset shows other active regions on the face of the Sun. Image courtesy of SOHO (ESA and NASA).
radio noise are often associated with a flare, and indeed on December 6, 2006, the radio bursts were so intense that for 10 minutes they disrupted the Global Positioning System (GPS) reception on essentially the entire sunlit side of Earth.6 An associated phenomenon, coronal mass ejections (CMEs), involves the eruption of mass and magnetic flux from the Sun into interplanetary space. These can strongly disturb the near-Earth environment. There is general agreement that flares and CMEs are magnetic phenomena, but the details are unclear.
Space weather refers to the highly variable condition of the plasma that surrounds Earth and extends from the Sun throughout the solar system. The solar wind is a continuous stream of plasma that blows out from the Sun, and it controls the shape of the outer regions of Earth’s magnetic field. Flares sometimes produce energetic particles that propagate to Earth in a matter of minutes.7 Similarly, a CME can also produce energetic particles. These energetic particles can be a danger to the personnel and equipment in space vehicles. The CME itself takes 1 or 2 days to travel to 1 AU (astronomical unit; the Sun-Earth distance). If it hits Earth, it can cause serious communication disturbances and adversely affect satellites and long-distance high-voltage transmission lines.8 Because of these disruptive consequences, it is important that as much as possible be learned about flares and CMEs and that the capability of predicting them be developed. Much of this study must be done at radio wavelengths, although the radio information is supplemented with data from other wave bands—for example, x-rays measured from a satellite.
Serendipity and the Transient Universe
Throughout astronomy, in optical and other bands as well as radio, we are entering an era of intense surveillance, variously called transient source astronomy, time domain astronomy, and, more broadly, a new frontier in high energy astrophysics. The objective is to capture transient phenomena, which currently are enjoying wide attention. Long-known transient phenomena include novae and supernovae, pulses from pulsars, and motions in quasars and galactic nuclei, in addition to solar system phenomena such as eclipses and solar flares.
New radio telescopes, such as the ATA, will be used in a repetitive survey mode to search for transient and variable events. These phenomena are of broad significance and will contribute to the understanding of the life and death cycle of stars; the nature of exotic compact objects such as neutron stars, white dwarfs,
|
6 |
R. Cowen, “Big Broadcast,” Science News, 171(23): 360 (June 9, 2007). |
|
7 |
See http://www.nasa.gov/home/hqnews/2005/may/HQ_05132_solar_fireworks.html, accessed May 21, 2008; R.A. Mewaldt, “Solar Energetic Particle Composition, Energy Spectra and Space Weather,” Space Science Reviews, 124: 303-316 (2006). |
|
8 |
See http://ds9.ssl.berkeley.edu/solarweek/WEDNESDAY/spaceweather.html; accessed May 21, 2008. |
and black holes; and the physics of magnetized, relativistic plasmas. Transient and variable phenomena are typically broadband, occurring at all radio frequencies and on timescales from nanoseconds to years. Multifrequency, repetitive observations are necessary to characterize the physics of these targets.
Among the projected science targets are phenomena connected with explosions of massive stars, which might produce short bursts of powerful radio emission. The discovery of such events could confirm the fundamental picture of what is called the gamma-ray burst phenomenon and provide an independent method for the discovery of distant star-forming galaxies. Radio studies of the propagation effects that these waves encounter will probe the very tenuous intergalactic medium that constitutes a significant fraction of the baryonic content of the universe.
Neutron stars that emit sporadic pulses have been found very recently, and estimates have been made that such stars are abundant in the Galaxy. These objects are likely providing new insights into physical conditions in neutron star magnetospheres.
Magnetic activity on the surfaces of stellar and compact objects belongs to a continuum of activity that includes solar flares. A comprehensive census of this activity and the detection of true solar-like events on other stars will provide important insights into the physics of solar flares as well as identifying conditions suitable for life on extrasolar planets.
Repetitive surveying at high time and frequency resolution is a new regime in astronomical phase space—that is, the parameter space representing all possible observations. In the past, opening such a new regime generally has led to dramatic new, often unexpected, discoveries. Scientists cannot predict what will be found, but on the basis of past experience, they do expect to see new phenomena. The ability to distinguish between transients of cosmic origin and sporadic radio frequency interference will be a challenging enterprise.
Summary
Radio astronomy has provided astronomers a unique way to observe and analyze cosmological objects of interest, from Earth’s Sun, to galaxies, to the very beginning of the universe itself. The field has thus been responsible for some of the most important astronomical findings to date. As capabilities increase and new observatories come online, radio astronomy is poised to allow scientists to understand the universe in unprecedented ways.
Finding: Radio astronomy has great potential for further fundamental discoveries, including the origins and evolution of the universe, the nature of matter, and life in other solar systems, which will have an enormous impact on our understanding of fundamental physics and the place of humanity in the universe.
3.2
RADIO OBSERVATORIES AND RADIO TELESCOPES
Radio observatories contain a diverse group of scientific instruments carefully designed and built to observe with the highest sensitivity selected aspects of the radio emission from the many varieties of objects in the universe. No single instrument, observatory, or even observing technique can encompass the broad frequency range (tens of MHz to hundreds of GHz), the wide range of angular scales (tens of micro-arcseconds to degrees), and the broad range of temporal variations (nanoseconds to many years) that are seen in the emission. Hence, radio observatories have a variety of telescopes and instruments with unique technical capabilities. Box 3.4 describes several current and future radio astronomy observatories (three are in operation and one is under construction).
At the lowest frequencies, telescopes consist of dipoles (simple lengths of wire or metal) or arrays of dipoles linked together. These structures are simple, cheap, and efficient. Above 100 MHz, telescopes take on the classic parabolic shape but can be surfaced with wire mesh. The mesh saves money and weight in the telescope; the radiation is efficiently collected because the wavelength is much larger than the holes in the mesh. At about 1 GHz and higher, the telescopes need highly precise solid surfaces and stable guiding structures. Two telescope systems currently being designed—FASR and SKA—are examples of the design being matched to the frequency. The plan for both FASR and SKA is to use dipole arrays to cover frequencies below 300 MHz, low-precision parabolic reflectors to cover from 300 MHz to 3 GHz, and high-precision parabolic reflectors from 3 to 30 GHz.
Techniques are different at the highest frequencies, 30-1,000 GHz, where quasioptical techniques are often used: that is, signals are directed through mirrors to the detectors rather than through waveguides. At the extreme high frequency end, the required surface accuracy of reflectors is about 15 microns, one-fifth the diameter of a human hair.
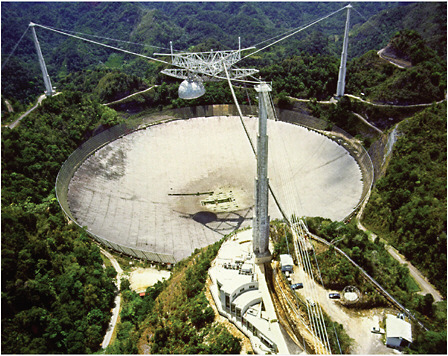
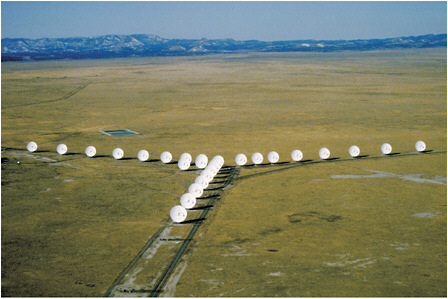
Angular resolution, the ability to image fine structure, is a second factor driving telescope design. The resolution is determined by the ratio of the wavelength of observation to the diameter of the telescope. Depending on the science objectives, it may be desirable to have arcminute or even sub-milli-arcsecond resolution; however, getting very high resolution by building an extremely large dish is impractical. For example, the Arecibo telescope, at 305 meters in diameter, is the largest dish-type telescope in the world (see Figure 3.4.3 in Box 3.4). Its highest operating frequency is 10 GHz, where it has a resolution of about 30 arcseconds. Getting more resolution at this frequency by building a larger dish would be much more expensive than building a linked array of smaller telescopes in which the resolution is controlled by the overall size of the array. The VLA in New Mexico has 27 telescopes that can form a baseline up to 35 kilometers, giving the VLA a resolution of 0.3 arcsecond at 10 GHz (see Figure 3.4.4 in Box 3.4). The Very Long
|
BOX 3.4 Radio Astronomy Observatories 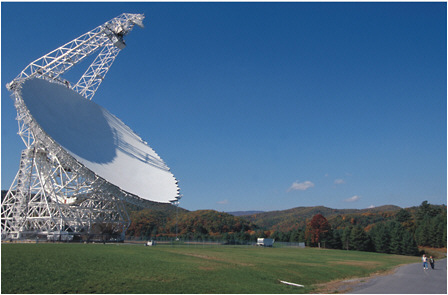 FIGURE 3.4.1 The Robert C. Byrd Green Bank Telescope (GBT) at the National Radio Astronomy Observatory in Green Bank, West Virginia. With a diameter of 100 meters, the GBT is the world s largest fully steerable telescope. It operates from 300 MHz to 90 GHz and is predominantly used for radio spectroscopy and for studies of pulsars. It has an offset feed support system to eliminate radio shadows on the dish, which can be troublesome when sensitive measurements are being made. The GBT and Green Bank, West Virginia, are in the National Radio Quiet Zone (NRQZ); see §3.6 in this report. Image courtesy of NRAO/AUI/NSF. |
Baseline Array (VLBA), with maximum baselines of 6,000 to 8,000 km, has an angular resolution of roughly 0.1 milli-arcsecond at 43 GHz.
In practice, angular resolution, operating frequency, and total collecting area are considered jointly in optimizing the design of a telescope. Different possible solutions to the structure usually exist, and one is chosen according to the primary science goals for the observatory. Increasing the angular resolution can assist in reducing the potential for interference. However, the design process is quite complex if the angular resolution is to be maximized while the sidelobes that capture interfering signals are to be minimized.
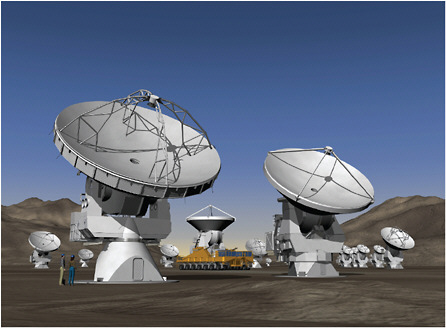
Another key factor in optimizing the capability of an observatory is its location, and the broad spread of the radio spectrum results in a number of factors that can be important. At frequencies below 30 GHz, radio frequency interference (RFI) is an important cause of noise and signal degradation. The National Radio Quiet Zone in West Virginia, where the GBT is located, is important because there is a legal and effective means of minimizing RFI there (see Figure 3.4.1 in Box 3.4). At high frequencies, water vapor in the atmosphere is an important source of noise and attenuation. ALMA and other telescopes are being built at an elevation of 5,000 m in the Atacama Desert in Chile to optimize their performance up to 1000 GHz (see Figure 3.4.2 in Box 3.4).
A highly sensitive receiver, or radiometer, is coupled to the radio telescope. At frequencies below about 50 GHz this is a low-noise amplifier, usually containing a cooled transistor. Transistor technology continues to improve, however, and the upper frequency limit for transistors’ use has been rising steadily. Above 50 GHz, more complicated devices are used, including superconductor-insulator-superconductor (SIS) junctions. In addition, above 100 GHz, bolometers are commonly used, especially for broadband continuum measurements. Focal plane arrays, both of bolometers and coherent devices, are coming into regular use. An array of detectors is essentially a radio camera, with from a few pixels to hundreds of pixels—far fewer than a modern digital camera has but still, such a radio camera will operate 100 times faster than a conventional system with a single point feed. An interferometer system is automatically such an array, and its ability to form an image with many pixels is limited only by its computing power (and the primary beam of the antenna elements).
The signal that comes from the radiometer can be used in various ways. It can be directly detected as a broadband signal to maximize sensitivity to thermal or synchrotron emission. It can be closely sampled in time to search for pulses from neutron stars or used to construct a spectrum for the study of molecular or atomic spectral lines. The astronomy signals are almost always a very small fraction of the internal noise in the receiver and can only be measured by using a long integration time, sometimes of many hours (see §3.4).
Table 3.1 highlights selected major radio observatories currently operating,
TABLE 3.1 Selected Major U.S. Radio Observatories Around the World: Operating, Under Construction, Being Planned
|
Observatory |
Location |
Frequency (GHz) |
Collecting Areaa (m2) |
|
Selected Operating Facilities |
|
|
|
|
Allen Telescope Array (42 dishes) |
Hat Creek, California |
0.5-11.2 |
1,230 |
|
Arecibo Observatory |
Arecibo, Puerto Rico |
0.3-10 |
73,000 |
|
Arizona Radio Observatory |
Tucson, Arizona |
68-500 |
78 and 113b |
|
Atacama Cosmology Telescope |
Chile |
150-270 |
28 |
|
Caltech Submillimeter Observatory |
Mauna Kea, Hawaii |
200-950 |
85 |
|
Combined Array for Research in Millimeter-Wave Astronomy |
Owens Valley, California |
70-260 |
770 |
|
Green Bank Telescope |
Green Bank, West Virginia |
0.3-100 |
7,850 |
|
Large Millimeter Telescope |
Mexico |
85-275 |
1,960 |
|
South Pole Telescope |
South Pole |
95-275 |
78 |
|
Submillimeter Array |
Mauna Kea, Hawaii |
180-900 |
226 |
|
Very Large Array |
Socorro, New Mexico |
0.07-50 |
13,250 |
|
Very Long Baseline Array |
10 sites in United States |
0.3-90 |
4,900 |
|
Selected Facilities Under Construction |
|
|
|
|
Allen Telescope Array (350 dishes) |
Hat Creek, California |
0.5-11.2 |
10,220 |
|
Atacama Large Millimeter Array |
Chile |
30-960 |
6,000 |
|
Long Wavelength Array 1+ |
New Mexico |
0.015-0.09 |
20,000 @ 15 MHz |
|
Murchison Widefield Array |
Murchison, Australia |
0.08-0.3 |
8,000 |
|
Selected Facilities in Planning |
|
|
|
|
Cornell Caltech Atacama Telescope |
Chile |
200-900 |
490 |
|
Square Kilometer Array |
To be determined |
To be determined |
1,000,000 |
|
aThe collecting area listed in column 4 is the geometric area of the aperture for the dish-type telescopes. bTwo telescopes of 10 and 12 m diameter. |
|||
facilities under construction, and facilities being planned within the U.S. community. The operating observatories represent an investment of roughly $1 billion. Some of the newest observatories will be built in collaboration with other countries, a trend that will increase in the future. ALMA, a $1 billion observatory under construction in northern Chile, is a collaboration among institutions in North America, Europe, East Asia, and Chile. The Square Kilometer Array, a project currently being designed and prototype tested, is a world collaboration that is also expected to cost more than $1 billion to build.
Note that a third of the facilities listed in Table 3.1 are not located in the United States, although they are supported and operated in part or completely by U.S. public and private institutions. The Atacama Cosmology Telescope (ACT), Large Millimeter Telescope (LMT), Submillimeter Array (SMA), South Pole Telescope
(SPT), ALMA, and Cornell Caltech Atacama Telescope (CCAT) are at high altitude to minimize the difficulties produced by atmospheric water vapor. The Murchison Widefield Array (MWA) is in Western Australia, where currently the RFI is exceptionally low. The Australian and South African governments have established a level of protection against RFI for the SKA in the event that it is built in their respective countries. The Chilean government has done this for ALMA, which is now under construction.
Finding: Scientific advances have required increasing measurement precision by passive radio and microwave facilities in order to obtain more accurate and thus more useful data sets. This need for precision will continue to increase.
Finding: Large investments have been made in satellite sensors and sensor networks and in major radio observatories. New facilities costing billions of dollars are under construction or are being designed.
3.3
SPECTRUM REQUIREMENTS AND USE
The spectral windows used to observe cosmic objects of interest are determined by the physics of the objects and the atmosphere through which the incoming radiation must pass. Using current spectrum allocations as well as many windows of opportunity, radio astronomers are able to learn fascinating information about the cosmos in which we live.
Continuum and Line Observations
Most radio astronomy observations fall into one of two categories: continuum observations and line observations. With respect to continuum observations, continuous spectrum from a radio source covers a wide frequency range, often a factor of about 1,000 in frequency, and the intensity commonly changes slowly with frequency. The spectrum often shows a maximum in some band, but some sources show a steady change, either increasing or decreasing, with frequency, over the entire available radio range. The sensitivity of continuum observations is proportional to the square root of the receiver’s bandwidth (see §3.4), so often the bandwidth is made as wide as is practical, limited by the technology of the receiver and by external interference. As an example of technology-limited bandwidth, consider very long baseline interferometry. In this case, signals from multiple, separated antennas are recorded for later processing. In 1967 the first VLBI system used a 330 kHz band because that was all that was available with computer tape drives. The bandwidth steadily increased as better recording systems became available, and now recordings at more than 1 GHz are made, on hard disks, at frequencies
above 10 GHz. The objective has been increased sensitivity. Increased sensitivity translates into a larger portion of the universe that can be studied, because of the squared (r2) distance effect. Improving the sensitivity will be a strong driver for radio astronomy equipment for a long time to come.
Modern continuum observations cannot be restricted to the bands allocated to the Radio Astronomy Service (RAS); wider bands are needed for sensitivity. Meeting this need has another effect, however; it increases the exposure to RFI. This problem will worsen with time as transmissions increase and the sensitivity of radio systems continues to be improved.
Line observations refer to the radiation in spectral lines from quantum transitions of atoms or molecules. Different transitions give different linewidths, but they are well under 1 percent of the frequency. Hence specialized, narrowband receivers are used. The observations, however, must be made at the transition frequency regardless of what RFI is present there. The most famous spectral line, arguably the most important one for radio astronomy, is the atomic hydrogen line at 1420 MHz. This line is protected, with the 1400-1427 MHz band allocated to the RAS on an exclusive primary basis. Even so, RFI has been seen in this band. At high frequencies, especially above 100 GHz, broad bandwidths are often used in this application to encompass many spectral lines simultaneously.
While broad bandwidths are often used at millimeter-wave frequencies to encompass many spectral lines simultaneously, recently there has also been renewed interest in making wide-bandwidth spectral scans at lower frequencies.9 Most of the frequency spectrum observed in these surveys has no protection against RFI. Of course, observations of spectral lines in external galaxies rarely fall in protected bands due to the redshift of the target, even when the rest frequency of the line is protected.
Pulsar observations are in a different category because they emit short pulses that can only be seen with a short integration time. These short pulses can be co-added with appropriate time shifts, like radar pulses, to enhance sensitivity. In addition, the pulses drift in frequency owing to intervening dispersive plasma. Multichannel observations are required to limit dispersive smearing, and voltage-based signal processing is implemented to remove dispersion effects.
Atmospheric Windows and Absorption Features
The allocation of spectral bands for radio astronomy is based partly on the available atmospheric transmission windows, as shown in Figure 1.3 in Chapter 1. Ground-based telescopes can observe only in bands where the atmosphere does not absorb the radiation. Starting at the ionospheric cutoff near 15 MHz and extending to about 50 GHz is a relatively clear band. Above 50 GHz, radio windows occur approximately at 65-115 GHz, 125-180 GHz, and 200-300 GHz. At still higher frequencies the windows are less distinct, but they do exist at 330-370 GHz, 460-500 GHz, 600-700 GHz, and 800-900 GHz, as well as in other, narrower windows.
Current Radio Astronomy Service Allocations
Figure 3.8 shows the frequency bands that currently are allocated to the RAS. The U.S. and international spectrum allocation table and footnotes are available in the National Telecommunications and Information Administration’s (NTIA’s) Manual of Regulations and Procedures for Federal Radio Frequency Management (Redbook)10 and in the Federal Communications Commission’s (FCC’s) Frequency Allocation Table.11
RAS has a narrow band approximately every octave across the radio spectrum, which allows the investigation of both the broadband and the spectral line emissions of celestial sources. Band allocations start at 13.4 MHz and extend to 275 GHz, as shown in Figure 3.8.
Spectrum Use
The following subsections discuss the spectrum divided into five broad ranges: below 100 MHz, 100-1420 MHz, 1.4-30 GHz, 30-275 GHz, and 275-3000 GHz. A brief description of some of the current major scientific investigations in each range is presented, and new uses expected in the coming decade are mentioned.
Below 100 MHz
In general, continuum sources will come under study in the spectrum range below 100 MHz. These sources include the Sun and Jupiter, as well as other stars and, possibly, Jupiter-like planets around other stars. Many extragalactic
|
10 |
Available at http://www.ntia.doc.gov/osmhome/redbook/redbook.html; accessed January 13, 2010. |
|
11 |
Available at http://www.fcc.gov/oet/spectrum/table/; accessed January 13, 2010. |
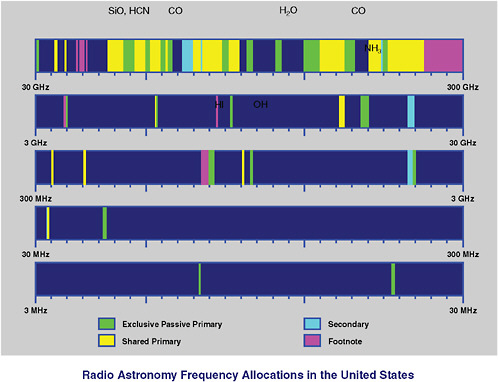
FIGURE 3.8 Spectrum allocations to the Radio Astronomy Service (RAS) covering the range 3 MHz to 300 GHz. Exclusive primary bands are in green, and shared primary bands are in yellow. The spectral region above 75 GHz is widely used by the passive services but little used by the active services for lack of suitable technology. That will change in the future. Some of the bands at lower frequencies are more threatened by radio frequency interference than others. For example, the band 23.6-24.0 GHz, along with several bands between 22.0 and 23.6 GHz (not shown), are used by the RAS and the Earth Exploration-Satellite Service because they contain the important water vapor and ammonia spectral lines. Automotive collision-avoidance radar, which will come into wide use in the next few years, will be in the band 22-27 GHz. The potential for interference is high. Image courtesy of Andrew Clegg, National Science Foundation.
sources have steep synchrotron spectra such that they are most powerful at low frequencies.
A new radio telescope, the Long Wavelength Array (LWA), is now under construction in New Mexico. LWA observations will complement those at higher frequencies. The observatory is planned to consist ultimately of 53 stations spread over 400 km; each station will contain 256 broadband dipoles operating from 10 to 88 MHz. The angular resolution of the LWA will be a few seconds of arc, and the instantaneous field of view will be a few degrees. The high-resolution,
low-frequency possibilities that these capabilities open up represent a new regime in radio astronomy. Some plasma regions, including pulsar atmospheres, radiate coherently at low frequencies, and discovering these or other transient objects may give the most significant results from the early use of this instrument.
Interference is particularly severe at frequencies below 100 MHz, where there are many commercial and government services, both fixed and mobile. Although the beam-forming nature of the system will automatically reject some interfering signals, there remains the strong potential for RFI. The LWA design will implement a variety of RFI mitigation procedures.
100-1420 MHz
Studies of hydrogen, the most abundant element in the universe, are particularly important in the 100-1420 MHz range. Pioneering efforts are underway using the 1420 MHz spectral line of hydrogen, to detect material that is heated by the first generation of stars in the early universe. That radiation now must be observed at much lower frequencies, owing to the large redshift. The radiation will be spread over a very broad band, and the signals will be particularly weak. Months of integration at remote sites, such as Western Australia and/or the back side of the Moon, will be required for reliable detections. A major instrument, the MWA, is now under construction in Western Australia for this purpose.
The hydrogen line at 1420 MHz is used to study the motions and dynamics in the Milky Way and in external galaxies out to great distances. “Dark galaxies” with much hydrogen but few stars are also expected to exist. They will form a new frontier for observation, at frequencies from 1420 MHz down to about 300 MHz.
The heavy isotope of hydrogen, deuterium, has an analog of the 1420 MHz line at 327 MHz. This line, first detected only a few years ago, will be an important subject of study in the coming decade. It will provide information related to the origin of the universe and the cosmological synthesis of the elements.
One of the most interesting and significant discoveries in radio astronomy was the detection of pulsars. Their huge magnetic, electric, and gravitational fields, impossible to reproduce in laboratories on Earth, allow observations of matter and radiation under extreme conditions. Pulsars generally emit most strongly at frequencies in the range from 50 to 600 MHz, but they are often observed up to a few gigahertz and, for a few objects, to 100 GHz.
1.4-30 GHz
The study of the nuclei of galaxies, including that of the Milky Way, is an important and fundamental topic in astronomy; it is done to a large extent between 1.4 and 30 GHz. Problems that can be studied in this range include the properties
of massive black holes, explosive activities and the production of intense double radio sources from galactic nuclei, the collimation and acceleration of relativistic jets of plasma, the influence of galactic nuclei on the morphological structure of galaxies, and the formation of galaxies and quasars.
The study of hydroxyl (OH) with primary bands at 1.6-1.7 GHz and also at 4.7 GHz, 6.0 GHz, and other frequencies is of interest for investigating phenomena associated with the formation of protostars and the initial stages of star formation. OH is often seen in the form of masers in the atmospheres around stars. Exceedingly strong emission from OH “megamasers” is seen in some galaxies. It can be a million or more times stronger than the emission from masers in the Milky Way and so can be seen to great distances. These observations give information on magnetic fields in other galaxies and on their evolution over cosmic time.
30-275 GHz
The spectral region above 30 GHz is crucial for the identification and study of interstellar molecules. Some astronomers and biologists think that interstellar chemistry may have supplied Earth with prebiotic compounds essential for terrestrial life. Consequently, establishing the inventory of molecules in interstellar gas is central to astrobiology and astrochemistry. In addition, molecules in the 30-275 GHz frequency range provide essential diagnostics for star formation.
The band from 65 to 115 GHz has relatively little absorption from the atmosphere and is one of the best for both continuum and spectral observations. More than 100 molecules, as well as 25 different isotopic species, have been detected here. These include complex molecules such as CH3 CH2 OH and CH3 OCH3. Some molecules have several isotopic species in this range, so that isotopic abundance ratios can be studied. As an example, the basic molecule HCN has the isotopic species H12 C14 N, H14 CN, and H12 C15 N in the 86-92 GHz range, and all have been observed in the interstellar gas. The most important transitions in this frequency range, however, are generated by the CO molecule at 115 and 230 GHz. Emission from these lines is pervasive throughout our entire Galaxy and in other galaxies. Indeed, the bulk of the literature here is based on CO observations. CO’s millimeter transitions are widely used to trace star-forming molecular gas, and this is crucial for assessing star formation in the Milky Way and other galaxies. As the sensitivity of telescopes continues to improve, studies of star formation using the weaker lines of HCN and HCO+ are also becoming important.
The band near 43 GHz is regularly used to study quasars and galactic nuclei with the VLBA. At this high frequency, extreme angular resolution is obtained, 0.1 milliarcsecond. This corresponds to a footprint on the Moon, as seen from Earth.
The frequency band 217-231 GHz provides a window near the peak of the CMB spectrum. Because of its low intensity and the strong variable contaminating
emission from the atmosphere, accurate measurement of the CMB must be made in extreme environments, with high-altitude radio telescopes, at the South Pole, or with high-altitude aircraft, balloons, and spacecraft.
This region of the spectrum has become increasingly important in the past two decades, and the emphasis placed on this band will continue to increase as new telescopes and new instrumentation proliferate.
275-3000 GHz
Exploration of the electromagnetic spectrum between 275 and 3000 GHz has only begun in earnest in the past decade, as a consequence of the great strides made in the development of quantum heterodyne mixers and high-precision large-aperture antennas and the ability to make large arrays from them. Because the water vapor in the atmosphere is only partially transparent in selected portions of this band (see Figure 1.3), observations must be done at extraordinarily dry sites, most of which are at elevations greater than 4,000 m. The peak of the entire electromagnetic spectrum of the universe occurs in the middle of this band, at about 1 THz.
Extraordinary opportunities exist to study the universe in the early stages of its development, especially around redshifts of about 6-10 when the first stars reionized the universe at the end of the so-called Dark Ages. An important concept is that the intensity of thermal radiation from galaxies, which follows the Rayleigh-Jeans law, is proportional to the square of the frequency, so that galaxies’ measured flux densities are essentially independent of distance, because the increasing redshift of the radiation due to the expansion of the universe exactly compensates for the inverse-square law loss suffered in propagation. The first deep images from the ALMA array (see Table 3.1), now under construction, are expected to be dominated by galaxies at great redshift that are not seen at all in the deep field images of the Hubble Space Telescope at optical wavelengths.
The 275-3000 GHz band will be very important in the field of astrochemistry, which seeks to understand how various molecules form and build up in complexity in regions of the interstellar medium where dense molecular clouds form and spawn new generations of stars. The importance of this band is due to the fact that the intrinsic strength of spectral lines from molecules and atoms increases as the fourth power of frequency. Hence the spectrum in this region is almost a “forest” of spectral lines in the direction of star-forming molecular clouds. Instruments such as ALMA will be able to image these regions with high angular resolution that will only be surpassed by infrared arrays in space, which are many decades from feasibility.
A critical astronomical problem of our age is the question of how planets form from the debris disks left over after a star forms from it host molecular cloud. The
emission strength of the dust in such disks increases as the square of the frequency and is most readily imaged at the highest radio frequencies, which are afforded in the 275-3000 GHz band.
In addition, the radio source associated with the supermassive black hole in the center of the Milky Way has a peak in its emission spectrum at about 600 GHz. This source is obscured by plasma scattering at frequencies below 200 GHz, and it can only be studied directly at higher frequencies. The size of the source has recently been determined to be 37 micro-arcseconds from VLBI observations.12 Observations at higher frequencies with larger VLBI arrays will provide images that show how light is bent in the strong gravity regime close to the event horizon of a black hole, thereby providing greater understanding of the general theory of relativity and the behavior of matter in this environment.
Finding: Radio wave bands (10 MHz to 3 THz) are indispensable for collecting information associated with specific astronomical phenomena. Often the same bands are similarly indispensable for passive Earth remote sensing, and the passive nature of both services enables them to productively share the spectrum.
3.4
SENSITIVITY REQUIREMENTS
Just as do Earth remote sensing researchers (see Chapter 2), radio astronomers use microwave radiometers to measure the total noise power received when an RAS telescope is pointed in a particular direction. The power received from an astronomical source is usually much less than that generated in the amplifiers and electronics or than stray radiation picked up from the ground (which emits at about 300 K). Radiometers and telescopes are carefully designed to minimize this contaminating signal and to keep it stable so that it can be subtracted to find the signal of interest. Radiometers may be broadband (with bandwidths from 10s of megahertz to several gigahertz) to maximize sensitivity to continuum sources, or they may be optimized for spectral-line observations, using a spectrometer that divides the radiation received over a broadband into many thousands of narrow channels. Radiometers may also be designed to be sensitive to the linear or circular polarization of the received radiation, which carries additional important information such as the direction of the magnetic field in a synchrotron-emitting plasma: radio astronomy is a very versatile and powerful probe of astronomical magnetic fields.
The power radiated by an extended source at frequency f is usually expressed as a “brightness temperature” Tb, which is the temperature of a blackbody that would emit the same amount of radiation, at that frequency. Brightness tempera-
tures range from 2.7 K for the CMB to more than 1012 K for energetic nonthermal sources (pulsars, masers, and quasars). Astronomers, however, are often interested in much smaller differences of brightness temperature: for example, the tiny variations in the CMB temperature from one direction to another, which are only a few microkelvin.
The radio power incident on the antenna is called the flux density and is usually denoted by Sf; it is also called the spectral power flux density or spectral pfd. Flux density is measured in janskys (Jy, named after the pioneer radio astronomer Karl Jansky), where 1 Jy = 10−22 W m−2 Hz–1. To bring the small magnitude of a jansky “down to Earth,” consider that a garage-door opener on the Moon would produce about 5 Jy on Earth. A television transmitter on the planet Jupiter, more than 600 million kilometers away, would produce about 1 Jy on Earth. As another example, the Sun is a nearly ideal blackbody with temperature T ≈ 5,800 K. On Earth, its flux density at 10 GHz is about 1.2 × 10⁶ Jy. By the inverse-square law, flux density decreases with distance as r–2. Currently, the weakest detectable cosmic radio sources have flux densities about 1 microjansky, so a star like the Sun could be detected out to a million AU, or about one-tenth of a light-year. This is substantially less than the distance to the nearest star. Although the thermal radio emission from stars like the Sun cannot be detected at great distances, the thermal radio emission from other types of stars can be detected. More importantly, the more luminous sources in the universe, including quasars and gamma-ray bursts, can be detected at redshifts of 5 or more, corresponding to 90 percent of the way across the universe, or to the time when galaxies were first condensing from the primordial universe.
The signal-to-noise ratio (SNR) with which a source can be detected is approximately given by
where k is Boltzmann’s constant (1.38 × 10⁻²³ W Hz−1 K−1), B is the bandwidth of the radiometer, τ is the integration time, and Tsys is the system temperature, a measure of the radiometer noise. The SNR generally must be 3 or greater for a positive detection, but a statistically sound result usually requires SNR = 5 or more.
The system temperature Tsys expresses the total unwanted noise power entering the receiver or generated in it as an equivalent temperature and is measured in degrees kelvin; it includes contributions from the sky (including the CMB and emission from the Milky Way), from the atmosphere, from the ground around the telescope, from interference (RFI), and from the telescope and amplifiers. The relative strength of these components and their absolute magnitude vary widely with frequency. Except for solar bursts, the signal from the source under study is usually much smaller than the system noise.
Sensitivity Limits
Radio astronomers maximize the SNR in their studies by using antennas with large collecting areas, such as the 100 m Green Bank Telescope or the 305 m Arecibo dish. They now have a project, the Square Kilometer Array, that will have a collecting area of about 1 km2, or 106 m2. The SKA is in the study and prototype phase; an optimum location for it should be selected within a few years’ time.
Using the widest possible bandwidth also maximizes the SNR for a continuum source. Some modern radiometers have fractional bandwidths as wide as Δf/f = 20% or more. Broadband observations are essential for detecting the most distant known galaxies and the tiny fluctuations in the brightness of the CMB. The usable bandwidth is often limited by RFI.
Radio astronomers generally use very long integration times (hours or days) to maximize the SNR, but for some observations (pulsars and other transients), the integration time is limited by the duration of the signal itself. This can be a millisecond or less. The SNR can also be increased by reducing the system temperature, but current technology is close to the minimum possible Tsys for frequencies less than 100 GHz. The sensitivity of existing and proposed telescopes is shown in Figure 3.9.
A simple example will illustrate these ideas. Let the GBT look at a 10 microjansky source. Then the received spectral power is 4 × 10⁻²⁸ watts per hertz, or, in common engineering units, −244 dBm Hz–1. If the receiver has a system temperature of 30 K, then the noise spectral power is 4 × 10⁻²² W Hz−1, or −184 dBm Hz−1, a million times larger than the signal power. To make a positive detection by smoothing the receiver output to SNR = 3 requires that the product Bτ be 1012. This could be obtained, for example, with B = 100 MHz and τ = 104 seconds. If a measurement of the flux density to 10 percent accuracy is wanted on this source, then the product Bτ must be increased by a factor of 100, requiring a bandwidth of 1,000 MHz and an integration time of 105 seconds, longer than a day.
Observations like this are already being done at gigahertz frequencies, and they will become more common as new broadband instrumentation spreads throughout the radio community (Figure 3.9). Such observations are passive and cause no interference, but they use much more spectrum than is allocated to the RAS. The RAS bands, however, still are important for many narrowband observations that also are routinely done—for example, on spectral lines—and they are vital for the EESS. Note, however, that some extremely important astrophysical problems, such as studying redshifted HI with the 1420 MHz spectral line of HI, will need the entire range from 1420 MHz down to about 100 MHz. This broadband passive use by the RAS means that RFI outside the protected bands is of serious concern. It drives the observatory locations to remote sites such as Western Australia and will force consideration of the back side of the Moon as a possible radio observatory
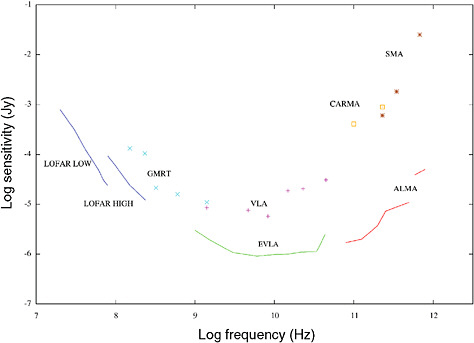
FIGURE 3.9 The root-mean-square sensitivity of various high-angular-resolution arrays in radio astronomy as a function of frequency. The discrete symbols refer to instruments that are in operation now. They are generally tunable by about +/−20 percent of their indicated frequencies. The solid lines refer to instruments that are under construction and will be operational by 2012. Note that the instruments under construction are between one and three orders of magnitude more sensitive than the existing ones. The sensitivity is proportional to the system temperature of the receivers and inversely proportional to the collecting area and the square root of the bandwidth and integration time, which in all cases is taken as 12 hours. The sensitivities were calculated from the array specifications on the Web sites of each instrument. LOFAR = Low Frequency Array (Netherlands); GMRT = Giant Metrewave Radio Telescope (India); EVLA = Expanded Very Large Array (New Mexico); VLA = Very Large Array (New Mexico); ALMA = Atacama Large Millimeter Array (Chile); CARMA = Combined Array for Research in Millimeterwave Astronomy (California); SMA = Submillimeter Array (Hawaii). See Table 3.1 in this chapter for more information. Image courtesy of James Moran, Harvard-Smithsonian Center for Astrophysics.
site. This RFI is also a strong driver for the development of mitigation studies and technologies within the RAS community.
3.5
INTERFERENCE AND ITS MITIGATION
Radio astronomy deals with exceedingly weak signals. As described in §3.4, they can be a million times smaller than the internal receiver noise, and their measure-
ment, or even just their detection, can require bandwidths of many gigahertz and integration times of a day or more. This requirement puts a premium on operating in a very low noise environment. It should be emphasized that serious interference can result from weak transmitters even when they are situated in the sidelobes of a radio astronomy antenna. This state of affairs has been recognized by the International Telecommunication Union (ITU) internationally and by the FCC in the United States, and various spectral bands have been allocated to the RAS for “exclusive” or “shared” use of these bands. However, “exclusive” does not mean that there must be zero emission in the protected bands. It is a fundamental fact that any information-carrying signal must contain out-of-band emission, which spreads across a wide radio spectrum. The regulation of this necessary out-of-band emission from a licensed transmitter involves controlling the intensity of the emission, and the FCC definition leads to an allowable level that, unfortunately, can cause serious interference with radio astronomy observations. It is likely that this situation will become worse in the future, as the RAS requirements become stricter with the study of weaker sources, and at the same time the active services are proliferating.
ITU-R Recommendation RA.769 discusses interference protection criteria for the Radio Astronomy Service and defines threshold levels of emissions that cause interference detrimental to radio astronomy. However, for modern measurements these levels are unrealistic, because they are not based on the current state of the art. The levels are calculated as 10 percent of the noise fluctuations, but the noise is calculated with a bandwidth of the allocated channel. However, bandwidths hundreds of times wider than this are routinely used. In fact, much of radio astronomy would no longer be possible if observations were restricted to the allocated channels. The other factor in the noise calculation, the integration time, is assumed to be 2,000 seconds, whereas in modern practice the integration times often are 10 or 50 times longer. Again, if observations were limited to 2,000 seconds, much of radio astronomy, especially the new realms projected for the coming decade, would be impossible. Hence, the limits set by ITU-R Recommendation RA.769 are inadequate today, and they will become more so in the future. This means that unwanted emissions that are legal can be damaging to the RAS measurements.
Another facet of the interference problem comes from emissions that essentially are unregulated. Cordless telephones, garage-door openers, and other unlicensed devices are allowed to have some low level of emissions, and at radio observatories an attempt is made to restrict the use of such consumer devices. But in fact they are powerful by RAS standards, as seen by the example of the garage-door opener on the Moon in §3.4, and will cause serious RFI if they are in the near sidelobes of a large antenna, even if they are far away. This problem also is worsening with the availability of new devices and their more widespread use. The incipient wide-spread use of automotive anticollision radar, operating at K-band, is a cause for concern in this regard.
A further cause of harmful RFI comes from transmitters that are operating illegally, either by producing excessive spurious or out-of-band transmissions or by operating at an unassigned frequency. The 1400-1427 MHz band is allocated to the RAS on an exclusive primary basis, but strong RFI has been seen in this band at many radio observatories around the world. Better monitoring of the radio spectrum and allocations would provide a better understanding of actual interference levels.
Radio observatories are located in remote sites, often behind mountains, to reduce human-made noise, which is roughly proportional to the local population density. But the problem is particularly severe with aircraft and satellite transmissions, from which there is no escape. Observations of transient phenomena are especially vulnerable to RFI because of the highly variable nature of both the phenomenon and the RFI.
Finding: The rules for out-of-band and spurious emissions in the primary allocated Radio Astronomy Service (RAS) bands (e.g., 1400-1427 MHz) do not provide adequate interference protection for RAS purposes.
The FCC rules that pertain to the above finding are given in Appendix D.
Finding: Geographical separation of radio telescopes from transmitters (e.g., through the establishment of radio quiet zones and the remote siting of observatories) is currently effective in avoiding much radio frequency interference, but the proliferation of airborne and satellite transmissions and the widespread deployment of mobile, low-power personal devices threaten even the most remote sites.
Examples of Interference in a Protected Band
Figure 3.10 shows interference in the band 1610.6-1613.8 MHz, which is allocated to the RAS on a shared primary basis—the interference was received in a 12 m antenna when an Iridium satellite passed through the beam. The satellite operates in the Mobile Satellite Service (MSS) band 1618.25-1626.5 MHz and, as seen in the figure, emits spurious radiation at 1612 MHz. During the measurement for Figure 3.10, careful attention was paid to ensure that the radiation was from the Iridium satellite itself and not from a GLONASS satellite, and that the RFI was not due to intermodulation in the receiver. Figure 3.11 shows the effect of similar satellite interference on an image made with the VLA in the same protected band, 1610.6-1613.8 MHz. The image made in the presence of the RFI is useless.
The 1610.6-1613.8 MHz band is most commonly used by radio astronomers for studying the OH radical that exists in stellar atmospheres and in clouds in the Milky Way; the studies are conducted in a spectroscopic mode in which many
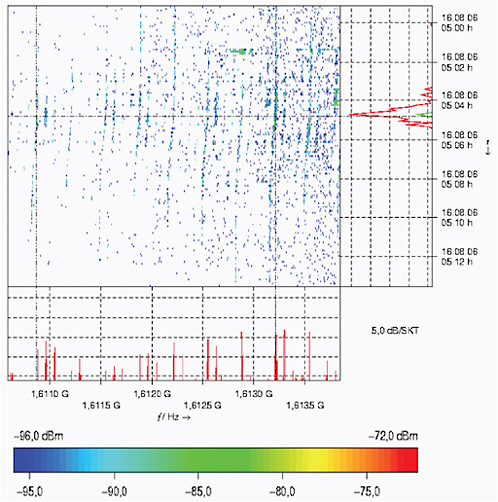
FIGURE 3.10 Showing radio frequency interference due to spurious emission from an Iridium satellite in the band 1610.6-1613.8 MHz, which is allocated to the Radio Astronomy Service on a primary basis. This measurement was made in Leeheim, Germany, in November 2006, with a 12 meter parabolic antenna. Careful attention was paid to eliminating the possibility of unwanted interference from intermodulation products in the receiver. Time runs down in the graph, over a total of 14 minutes, and frequency is horizontal. The motion of the satellite can be seen in the changing Doppler shift of the signals as the satellite passes through the beam of the antenna. The peak is about −85 dBm, substantially higher than the value recommended by the International Telecommunication Union, when it is converted to the standard model using an isotropic antenna. When converted to standard radio astronomy units, the flux density during the short bursts is about 2,500 Jy. Image courtesy of CEPT and BNetzA.
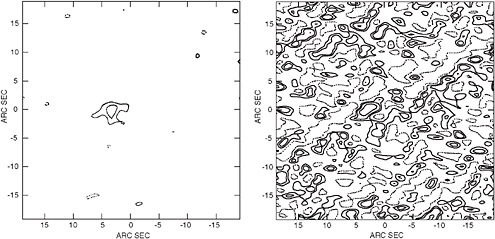
FIGURE 3.11 The effect of radio frequency interference (RFI) on an astronomical image made at the Very Large Array. (Left) Image of a faint “OH/IR star” made in a narrow band at 1612.22 MHz, within the band 1610.6-1613.8 MHz that is allocated to the Radio Astronomy Service on a primary basis. (Right) The same field of observation of the image made when an Iridium satellite was 22 degrees from the star. This image is made useless by the RFI. Images courtesy of G.B. Taylor, University of New Mexico.
narrow bands are measured simultaneously. The RFI depicted in Figure 3.10 could adversely affect OH observations made when the satellite is well outside the main beam of the antenna, even for a large antenna like the GBT that has a forward gain of 63 dBi at 1612 MHz. The potential for harmful RFI is high, especially considering that the Iridium constellation contains 66 satellites.
Mitigation
“Unwanted” emission is of two kinds: “out-of-band” and “spurious.” Out-of-band emission is unwanted emission on a frequency or frequencies immediately outside the transmitter’s necessary bandwidth; it results from the modulation process. This type of emission is different from spurious emission, which results from harmonics or intermodulation products generated in the transmitter. When considering the regulation of signals that may spill into science service bands, account should be taken of how such signals will affect the scientific instruments in question.
Simple excision techniques, in both time and frequency, have long been used to mitigate the effects of interference. More sophisticated procedures using statistical methods are currently under investigation, as described in Chapter 4. The present period is one of increasing sensitivity in the radio astronomy systems and increas-
ing use of the spectrum by other users, particularly the low-power wireless applications. These needs are conflicting, and the interference problem will undoubtedly increase. Focusing more attention on mitigation possibilities is important. At the same time, the radio astronomy enterprise must be protected by increased vigilance over its protected bands.
The approach to reducing the impact of RFI at radio observatories occurs at several different levels, depending on the resources at each observatory. These approaches are briefly described in the following subsections. See Chapter 4 for additional discussion on this topic.
Regulatory and International Meetings
Only the largest observatories (e.g., the National Astronomy and Ionosphere Center [NAIC] and the National Radio Astronomy Observatory [NRAO]) are normally able to provide continuous staff attendance at international meetings, such as regular ITU Working Party 7D (WP7D) meetings and the World Radio-communication Conference (WRC). However, smaller, university observatories are kept informed of events in the international arena by regular teleconferences among the observatories, and by attendance at the U.S. WP7D teleconferences. The NRAO has a spectrum manager, an astronomer who pursues his own astronomical research but who spends a significant fraction of his time on spectrum management activities, including responding to the FCC on NRAO’s behalf and contributing to and attending international ITU meetings.
Quiet Zones Around Observatories
Only two observatories on U.S. soil benefit from Quiet Zone protection: NRAO (Green Bank, West Virginia) and NAIC (Arecibo, Puerto Rico). In addition, the United States is a major partner in the ALMA project being built in northern Chile. The Chilean authorities, through the Subsecretaría de Telecomunicaciones (SUBTEL), have agreed to a considerable level of protection from interference from other services around the ALMA site.
The administration of these Quiet Zones requires resources. For example, in the case of the National Radio Quiet Zone (NRQZ) at Green Bank, West Virginia, all applications for fixed transmitters within the NRQZ are examined by NRAO staff, who make comments to the FCC on the basis of a technical analysis, usually including propagation predictions over the specific path. Often, some compromise as to power, frequency, and, in particular, precise location of the new transmitter, is agreed to between the parties concerned.
The administration of an NRQZ by a radio observatory requires a significant, continuing effort. However, this effort is usually very well rewarded. For example,
at the Green Bank observatory in West Virginia during 2007, 538 requests for coordination within the Quiet Zone were processed. They involved 850 sites within the Quiet Zone and 872 transmission frequencies. In 13 cases, a site inspection was carried out. For about a dozen of the requests, a power restriction was eventually placed on the applicant’s FCC transmitter license. However, in a far greater number of cases, a solution agreeable to both parties, one that did not necessarily restrict the transmitter power, was negotiated. The negotiations usually resulted in alternative transmitter sites and/or directional antennas pointed away from the observatory, with a compromise in capability for the transmitter operator, while still providing adequate protection for the observatory.
Local Radio Frequency Interference
The NRAO engineering staff at Green Bank includes a team that tracks down instances of RFI that appear at the observatory. The team’s equipment includes a portable interference system, which can trace interference originating within a few miles of the observatory. If it is possible technically to suppress the interfering source, by simple technical means or perhaps by negotiation with the relevant party, this is done. In very rare cases, where the aforementioned methods fail, the FCC may be called on to intercede.
Local Engineering
The observatories themselves take all practical engineering precautions in the design and construction of equipment in order to provide adequate filtering and dynamic range so as to make equipment as immune as possible to interference from out-of-band signals. Special techniques are sometimes used, such as a dedicated antenna to monitor a particular source of interference; the data gathered by such monitoring can then be subtracted from the astronomical data by some means. This is more a research than an operational area at present, with few such systems currently in use. NRAO, for example, is investigating several mitigation possibilities, including active RFI cancellation, ways of extending dynamic range, and high-performance filtering using the latest technology.
Data Processing
RFI mitigation using software processing techniques is in routine use at most observatories. This approach includes data excision based on time or frequency; it is often carried out automatically, with some manual input. Other techniques are active research areas at a number of observatories, as described elsewhere in this report. See Chapter 4, in particular.
Finding: While unilateral radio frequency interference mitigation techniques are a potentially valuable means of facilitating spectrum sharing, they are not a substitute for primary allocated passive spectrum and the enforcement of regulations.
Finding: Important scientific inquiry and applications enabled by the Radio Astronomy Service (RAS) are significantly impeded or precluded by radio frequency interference (RFI). Such RFI has reduced the societal and scientific return of RAS observatories and necessitates costly interference mitigation, which is often insufficient to prevent RFI damage.
3.6
IMPORTANCE OF RADIO ASTRONOMY TO THE NATION
The science of radio astronomy started in 1932, with the accidental discovery of radio waves from the Milky Way by Karl Jansky. Little happened in this field during the 1930s, but during World War II the United States mobilized a huge development effort in radar technology. The instrumentation and techniques resulting from this work fueled modern research in radio astronomy.13 Since then radio astronomy has continuously benefited from new technological developments; many of these have come from government and commercial sources, but some have been forthcoming from the development laboratories within radio astronomy itself. This section outlines some of the important benefits to the nation provided by radio astronomy.
Radio Interferometry
The development of interferometry has had widespread applications in fields in addition to radio astronomy and provides attendant benefits to society. The underlying principle of interferometry is the measurement of the relative time of arrival of signals from a radio source, among a group of antennas called an array. Triangulation then gives the direction of arrival of the radiation, meaning that the angular position of the radio source can be measured precisely. Furthermore, comparison of the arriving signals provides a method of imaging the source—that is, of determining the angular structure of the emission, which reveals the structure and dynamics of the source. These two applications—precise positioning and imaging—are important, as noted above, in fields beyond radio astronomy. For example, the radio technique of combining observations from different configurations of an array of antennas has formed the underlying principle of back projections, which is mathematically very closely related to all the techniques of medical imaging, such at computed axial tomography (CAT) and magnetic reso-
nance imaging (MRI). There has been much cross-fertilization in the development of these techniques.14
The highest angular precision by radio interferometers has been achieved through the use of networks of telescopes distributed around the world and linked through a technique called very long baseline interferometry. To provide the time-of-arrival information, receiving stations must be equipped with precise clocks. The best technology for this purpose is the hydrogen maser frequency standard, developed originally at Harvard University and since perfected primarily for VLBI, radar astronomy, and space tracking needs. The positions of a set of very distant radio sources have been determined with VLBI networks, providing a stable, precise reference frame for a wide variety of applications. For example, with this established reference frame the relative motions of antennas on Earth can be tracked to an accuracy of a few millimeters per year. This capability led to the first measurement of the contemporary motions of tectonic plates. Fluctuations in the rotation rate of Earth and the orientation of its spin axis are continuously monitored this way and provide information useful to the understanding of the composition and motions of Earth’s molten core and the annual changes in polar-ice loading.
These techniques of radio surveying based on triangulation formed the intellectual and technical basis for the development of the GPS and other terrestrial navigation systems. In the radio astronomy case, a distant radio source acts as a transmitter whose signal is received by a number of antennas, so that its position can be determined by relative time-of-arrival methods. In the GPS case, a user at an unknown location on Earth receives signals from an array of satellites, from which the user finds his or her position through triangulation based on a similar time-of-arrival analysis. GPS thus is highly analogous to the earlier VLBI, even to their both using atomic frequency standards as clocks.
Communications Disruptions
Energetic particles from the Sun, released in bursts called coronal mass ejections, arrive at Earth and can cause a disruption in radio communications, interference with GPS operation, surges on power grids, damage to Earth-orbiting satellites, and hazards to astronauts. The prediction of such events is important so that measures can be taken to ameliorate their effects. Amelioration, for example, might be achieved by shifting communications to less-affected frequencies and by placing satellites in standby mode. Hence the advance knowledge of the onset of these disruptive events is beneficial, just as the prediction of the arrival of meteorological events is important to the reduction of property damage and loss of life.
Coronal mass ejections originate from disturbances on the Sun, generally in the form of prominences and flares. Because CMEs consist of charged particles, they continuously emit radio emission as they travel outward from the Sun, and they can be tracked by radio telescopes, allowing 1 to 2 days of warning. Flares often are associated with huge bursts of radio emission, which have been known to seriously interfere with GPS operations, as described in §3.1. One of the goals of solar physics is to make long-term predictions of flares and CMEs by studying the emissions from the Sun (see Figure 3.7).
Fundamental Physics
The recent discovery, based on astronomical observations, that normal matter (baryonic matter) constitutes only 4 percent of the mass of the universe, while the rest is in the form of dark matter and dark energy, is transforming the understanding of physics. Radio astronomical observations of the rotation of galaxies have proved to be an excellent way to trace the distribution of dark matter. Meanwhile, laboratory experiments are underway in an attempt to identify the particle nature of dark matter. This combined effort in astronomy and laboratory physics can be expected to lead to a major step forward in the understanding of the universe.
The measurement by radio astronomers of the timing of the rotations of pulsars in tight binary orbits about companion neutron stars, with exquisite precision, has been providing physicists with the strongest affirmative answer yet to the century-long question, “Was Einstein right?” (see Figure 3.3).
Technology Development
Radio astronomy has advanced the limits of technology as it has opened up spectral bands at progressively higher frequencies. For example, the best technology for low-noise receivers at frequencies above 100 GHz and into the terahertz range is based on quantum devices known as superconductor-insulator-superconductor (SIS) mixers. These devices were first developed by radio astronomers at the University of California in the 1980s and independently at AT&T Bell Laboratories. They have now been perfected, primarily for use in radio astronomy, to operate with noise levels at a few times the quantum limit. As military and telecommunications applications move into this band, they will undoubtedly make use of this technology.
Precision Antennas
The need for high sensitivity has led radio astronomers to develop the technology of building highly efficient, large, parabolic antennas, which have extensive
application in the telecommunications and military communities. Radio astronomers first developed the theory of how to design large, fully steerable antennas that maintain high surface accuracy in the presence of gravitational deformations. They invented an electronic surveying technique, known colloquially as radio holography, which enables reflector surfaces to be set to an accuracy of a few microns. Methods that they developed for measuring antenna efficiency from observations of standard radio sources and solar system bodies are in wide use.
Distributed Network Computing
The Search for Extraterrestrial Intelligence (SETI) project, a search carried out in radio bands, was faced with an enormous computational problem in analyzing its voluminous data to find nonrandom signals that might be of extraterrestrial origin. The computing resources needed to sort through the collected data were far beyond those available to the SETI researchers. The solution was to enlist the aid of interested people, who would download an analysis program and a section of data and would do the analysis in their computer’s background. More than 5 million people in 226 countries responded and are part of the SETI@home project. The SETI@home researchers went on to develop the Berkeley Open Infrastructure for Network Computing (BOINC). BOINC’s open-source volunteer computing platform currently engages the public in 42 scientific supercomputing projects, including climate modeling and global warming studies (ClimatePrediction.net); drug research for HIV, malaria and cancer, and protein folding (Predictor@home); gravity waves (Einstein@home); particle physics (LHC@home); as well as SETI@home. BOINC volunteers provide about 2 petaflops of computing power to the various projects, more than the world’s most powerful supercomputer.
Education and Public Outreach
Radio astronomy requires a broad spectrum of technically trained people, from theorists and observers with doctoral degrees to technicians with much less education, perhaps even trained primarily on the job. Theory, observations, and analysis are usually done by small teams consisting of one person or several senior people along with junior people, students, and postdoctoral researchers. Only a small fraction of the people trained for this field actually stay in radio astronomy; the majority go into other fields, usually still in a technical capacity. They form a valuable pool of people with a wide range of skills who readily find technical jobs in industry or government laboratories.
The general public is greatly interested in astronomy, perhaps more than in other sciences. There is a steady stream of astronomy stories and images in the press. At the nation’s colleges and universities, it is the most common subject taken
as a science requirement, with thousands of students per year in elementary astronomy classes at the larger universities. All the major radio observatories have well-attended visitor programs, with the Arecibo Observatory in Puerto Rico drawing 120,000 visitors annually, of whom 30 percent are children. This interest translates into an appreciation of science and technology, and draws students into technical subjects, helping to provide the personnel resources needed in today’s world.
Finding: In addition to the intellectual benefits that they provide, radio astronomy studies provide many technological benefits to American society.
Finding: Radio astronomy provides a diverse and valuable set of educational opportunities.


