
9
Multiple Paths to Sustainability
The nation’s long-term fiscal situation requires action soon. The choices required are difficult. Given competing pressures for higher spending and lower taxes, consensus on forceful action will be difficult to achieve. A major objective of this report is to indicate spending and revenue policy choices that, in the right combinations, could put the federal government on a fiscally sustainable course.
This chapter shows how the policy options described in the previous chapters can be combined to create four illustrative spending-and-revenue paths, each meeting the tests of fiscal sustainability presented in Chapter 3 (see Figure 9-1). One would sharply reduce spending growth (relative to the baseline) to keep revenue requirements close to the recent historical level. Another path—with substantially higher revenue requirements—would expand spending for defense and other domestic programs, allow Social Security spending to grow as it would under current policies, and require a more modest slowing in the growth of Medicare and Medicaid. Two intermediate paths illustrate a possible tradeoff between new spending on public investments and spending for elderly oriented entitlement programs.
These four paths do not by any means exhaust the panoply of potential policy solutions to the fiscal challenge, but they do provide some sense of the lower and upper bounds of the available choices and embody a range of philosophical values and views on government. The paths also illustrate the difficulty of the decisions facing the nation: each requires decisive changes in federal spending, and three of the four require higher revenues. To allow time for a national discussion on these difficult decisions, and recognizing the risk of introducing major changes too early in the expected economic
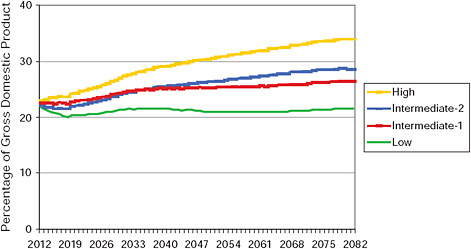
FIGURE 9-1 Projected federal spending under the committee’s four scenarios.
recovery, the committee’s four scenarios are designed to begin in fiscal 2012. The process of making painful choices, however, must begin now.
In the study baseline, the ratio of the debt to the gross domestic product (GDP) is projected to reach about 65 percent in 2011 and continue rising (see Chapter 1 for a description of the study baseline; see details in Table F-2 in Appendix F). In contrast, in all four of the committee’s paths, revenues are adjusted so the debt-to-GDP ratio declines to 60 percent by 2022 and stays at that level thereafter; see Figures 9-2 and 9-3 (also see Tables F-3 and F-4 in Appendix F). The next four sections provide the substantive details of each of the four paths; technical details on their construction are in Appendix F.
LOW SPENDING AND REVENUES PATH
The low path illustrates how revenue needs could be held close to their historic levels by adopting the low spending options for each of the three policy areas: see Figure 9-4 and (for the difference in spending and revenue levels between the low scenario and the study baseline) Figure 9-5. (For details; see Tables F-5 and F-6 in Appendix F.) Medicare and Medicaid spending growth would be allowed to exceed the economy’s growth rate only to accommodate the increasing number of people eligible for these programs due to changes in the age and gender composition of the population. Achieving this zero percent excess cost growth rate would require “strong medicine.” In the near term, it likely would entail direct reductions in the
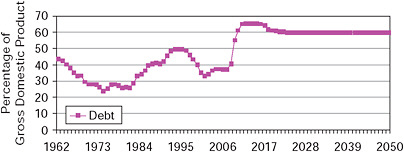
FIGURE 9-2 Projected federal debt under the committee’s four scenarios.
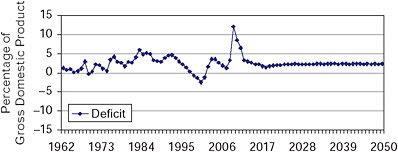
FIGURE 9-3 Projected federal deficits under the committee’s four scenarios.
growth of federal health spending, although systemic reforms that improve incentives, information, and efficiency might allow these painful and distortionary restrictions to be loosened eventually. Social Security growth would be reduced to a level that would allow payroll taxes to be maintained at current rates while putting the program on a course to solvency; benefit changes would be designed to have least effect on people with lowest earnings. Merely to allow these health and retirement programs to grow with the size of eligible populations and the economy while keeping revenues near the current level, the proportion of the economy’s resources devoted to all other federal responsibilities would have to be sharply reduced.
Federal revenues could remain at approximately 18.5 percent of GDP through 2025, but would have to increase to 19.2 percent by 2035 and fluctuate around that level through 2083. (For comparison, in the study baseline federal revenues are projected to reach 18.3 percent of GDP in 2019, 18.9 percent in 2035, and 21.8 percent in 2083.) On this path, the combined revenues of all U.S. governments—including those of the state and local levels at about the same proportion of federal revenues as now—
FIGURE 9-4 Federal spending and revenues under the committee’s low scenario.
FIGURE 9-5 Deviation from the study baseline for revenues and noninterest outlays under the low committee’s scenario.
would stay below the current average of advanced economies belonging to the Organisation for Economic Co-operation and Development.
HIGH SPENDING AND REVENUES PATH
At the other end of the spectrum, the substantial revenue increases assumed in the high path allow a smaller (though, in the longer term, still
substantial) reduction in the growth of health spending, Social Security spending sufficient to provide currently scheduled benefits, and higher spending on other domestic and defense programs; see Figures 9-6 and 9-7 (for details see Tables F-11 and Table F-12 in Appendix F). Medicare and Medicaid spending would increase at a decreasing rate, eventually achieving zero percent excess cost growth. Current benefit levels would be maintained for future Social Security recipients. The share of resources allocated to all
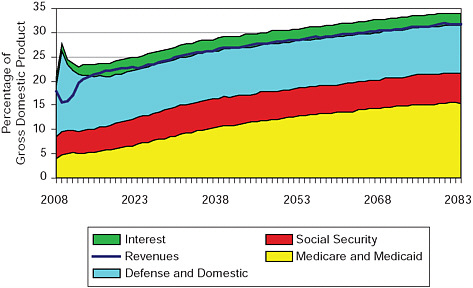
FIGURE 9-6 Federal spending and revenues under the committee’s high scenario.
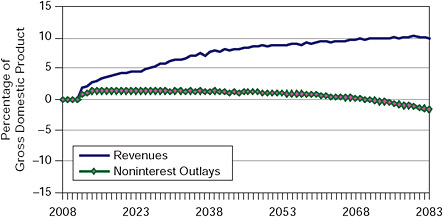
FIGURE 9-7 Deviation from the study baseline for revenues and noninterest outlays under the committee’s high scenario.
other federal responsibilities would be slightly below the level as a percentage of GDP in 2008, but still a significant expansion relative to the study baseline.
To support the spending policies under this scenario, revenues would have to reach 22.4 percent of GDP in 2019, 25.9 percent in 2035, and 31.7 percent in 2083—the last being an approximately 45 percent increase over the study baseline revenue share of 21.8 percent for that year. There is little doubt that the current tax structure could not be used to collect revenues at these levels, making extensive structural reforms and new revenue sources (such as a value-added tax) necessary. If state and local revenues grow proportionately, by the end of the projection period the U.S. public sector would account for about one-half of the U.S. economy—a share about as large as that in the Scandinavian countries or France today.1 Such comparisons are subject to the caveat that other countries may find themselves on a higher future spending trajectory as well, given that they are subject to similar pressures both from an aging population and the pressures of excess cost growth in the health care sector. The high revenues and spending path will appeal to those who want to preserve current program benefits wherever possible, and those who do not believe that it is possible to curtail health spending growth substantially without harm to health outcomes. This scenario also may appeal to those who anticipate that the nation will need major new public investments to maintain robust growth or to address international or environmental crises.
TWO INTERMEDIATE SPENDING AND REVENUES PATHS
Two intermediate scenarios illustrate ways of making tradeoffs among different spending priorities. The intermediate-1 path can be characterized as focused more on public-sector investments, while the intermediate-2 path dedicates more resources to elderly oriented entitlement programs; see Figures 9-8, 9-9, 9-10, and 9-11 (for details, see Tables F-7, F-8, F-9, and F-10 in Appendix F). Relative to the high spending path, both scenarios would curtail the growth of Medicare and Medicaid through a combination of direct spending reductions and systemwide reforms. Similarly, the intermediate-2 path would curtail the inflation-adjusted growth of Social Security benefits. The intermediate-1 path would place tighter limits on the growth of these elderly oriented programs than the intermediate-2 path—although not to the same extent as the low spending path. (Although the intermediate-1 path would reduce Social Security benefit growth for most, those with higher earnings would experience slight real cuts relative to the benefits scheduled under current law.) Compared to the baseline, the intermediate-1 path also expands the resources dedicated to other federal functions (though not to the same extent as the high path), while the
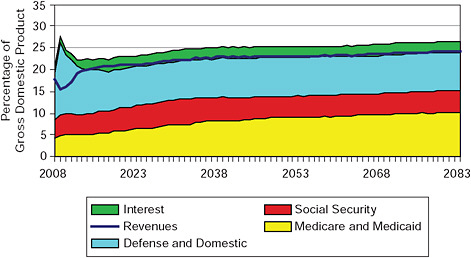
FIGURE 9-8 Federal spending and revenues under the committee’s intermediate-1 scenario.
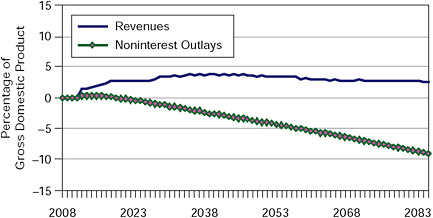
FIGURE 9-9 Deviation from the study baseline for revenues and noninterest outlays under the committee’s intermediate-1 scenario.
intermediate-2 path cuts back on commitments in these areas (though not to the same extent as the low path). The intermediate-1 scenario, in other words, does more to constrain spending on the elderly to allow the federal government to take on some new responsibilities, make selective public investments for the future, and maintain defense spending at the baseline level. The intermediate-2 scenario, in contrast, gives priority to protecting the health and benefits of the elderly at the expense of reductions in defense and other domestic spending.
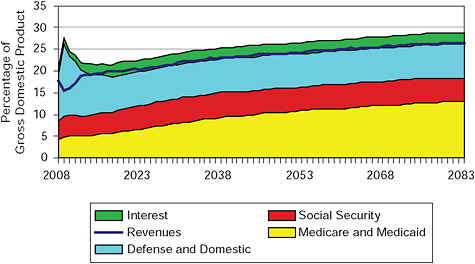
FIGURE 9-10 Federal spending and revenues under the committee’s intermediate-2 scenario.
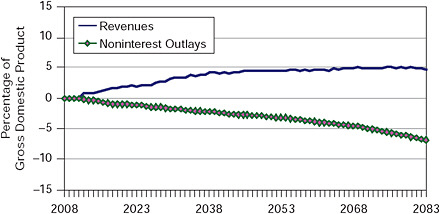
FIGURE 9-11 Deviation from the study baseline for revenues and noninterest outlays under the committee’s intermediate-2 scenario.
Revenue requirements would initially be slightly higher for the intermediate-1 than the intermediate-2 scenario. However, as the costs of Social Security and (especially) Medicare and Medicaid begin to escalate, this gap becomes progressively smaller and disappears by 2035. Thereafter, the revenue requirements for the intermediate-2 path are higher than those for intermediate-1. Revenue levels for the intermediate-1 and intermediate-2 scenarios are at 21 and 20.1 percent of GDP in 2019, 22.6 percent (for both) in 2035, and 24.2 and 26.4 percent in 2083. If state and local rev-
enues grew at the same rate as federal revenues over the 75-year projection period, the share of the economy accounted for by the entire public sector in both scenarios would eventually equal or surpass the current average of the countries in the Organisation for Economic Co-operation and Development.2
SUMMARY OF THE PATHS
All four paths presented in this chapter would put the federal budget on a sustainable course. Medicare and Medicaid spending as a share of GDP is reduced relative to the baseline in all four; the range of variation, however, is quite large. Social Security spending as a share of GDP is lower than the baseline in three scenarios and unchanged in a fourth. Spending on other federal programs as a share of GDP is higher than the baseline in two scenarios and lower than the baseline in two others. Revenues as a share of GDP are higher than the baseline in three scenarios and remain near or slightly above their recent historical average in a fourth.
The committee recognizes that it is not wise to introduce major deficit reduction during a downturn or early in a recovery. Therefore, our illustrative scenarios introduce the first policy changes in 2012. As one benchmark for assessing the realism and potential economic impacts of such changes, we have compared the magnitude of the changes, as percentages of GDP, with those that were enacted in 1993 as part of the Clinton Administration’s economic plan. For the paths presented in this study, savings from policy changes would be about twice as large in the first year as those that were estimated when the 1993 plan was enacted (1.1 percent and 0.5 percent, respectively), but much closer in magnitude by the fifth year (1.9 percent and 1.5 percent, respectively).3 The past is at best an imperfect guide to the future. Still, it is noteworthy that passage of the 1993 fiscal plan was followed by sustained economic growth, which most people believe was aided by an accommodative monetary policy. The lesson may be that a responsible fiscal policy can reassure financial markets and create room for the Federal Reserve to lower interest rates, helping to offset the contractionary effect of tighter fiscal policy.
It is important to note, as mentioned in Chapter 2, that in estimating these scenarios we have made no effort to estimate how different mixes of spending and tax policies could alter future economic growth. The absence of clear evidence about the relationships between policy choices (even those that substantially change levels of spending and revenues) and economic growth makes it impractical to model those effects (Kobes and Rohaly, 2002), even though some understanding of these relationships would be part of the ideal development of budget policy. Therefore, readers will need to form their own judgments about whether certain policy mixes (e.g.,
those that include prudent public investments) will be more likely to yield higher future growth than others (e.g., those that promote the formation of private capital).
The committee’s scenarios illustrate that it is possible to construct any number of plausible spending and revenue paths over a wide range of ideological orientations and policy preferences, each consistent with long-term fiscal sustainability. The scenarios demonstrate that a person who is seeking to protect specific values and interests can find a preferred approach, although not one that is pain-free. The scenarios demonstrate that any path to sustainability will require difficult choices in most policy areas. For example, even the least constrained spending scenario (with high revenue requirements unprecedented in U.S. history) will ultimately require a nontrivial change in the growth trajectory for federal health spending. The illustrative scenarios also suggest that it may not always be easy to label paths to sustainability as “conservative” or “liberal.” For example, the intermediate-1 and intermediate-2 paths have the same revenue requirements in 2035, but they allocate federal resources quite differently.
Putting the federal budget on a fiscally sustainable path is not just an accounting exercise; distributional implications are also important. Although it would be useful to estimate how the four illustrative scenarios vary in their impact on people at different income levels, options for health, defense, and other domestic programs do not lend themselves to distributive analysis: the Medicare and Medicaid spending trajectories are not tied to fixed combinations of specific reforms; defense is a public good whose distributive implications are all but impossible to estimate; and the components of the aggregate-level options for other domestic programs are explicitly illustrative and, by definition, incomplete. Therefore, although the committee estimated in Chapter 8 the effects of different revenue levels and tax structures by income level, it was unable to perform such an analysis on the spending side (with the exception of Social Security in Chapter 6)—let alone quantify the joint impact of revenue and spending choices. The one thing that can be said with certainty, however, is that by moving away from the unrestrained practice of borrowing to pay for current spending, all four scenarios leave future generations better off than they would be otherwise.
Consequences of Delayed Action
The committee’s analysis and projections are based on an assumed “starting date”—that is, the year when policy changes will begin to affect spending and revenues—of 2012. Policy makers will have to judge, based on the condition of the economy and other factors, whether to make changes of the proposed magnitude beginning in 2012. They might choose,
for example, to postpone some of the first-year changes by a year or more. Delay would mean, however, that the risks of carrying a larger debt would be extended and the eventual cost to the budget of a policy adjustment would be larger. To estimate the consequences of delayed action, we have modeled 5- and 10-year delays (see Appendix F for additional details).
Delayed action would result in higher near-term deficits, which would result in a higher debt. This higher debt, in turn, would require more interest to service, adding further to deficits and debt.
If action is delayed until 2017, the debt-to-GDP ratio will have risen to 72.1 percent by 2016, rather than 64.9 percent had remedial action begun in 2012. Using the intermediate-2 scenario as the basis for estimating the cost of a 5-year delay (other scenarios yield very similar results), revenues would peak at 22.3 percent of GDP rather than 21.2 percent (see Table F-13 in Appendix F; for comparison with revenues, see Table F-9 in Appendix F). In other words, revenues would have to be about 5 percent higher at their peak if budget reforms are delayed just 5 years.
The estimated consequences of a 10-year delay in addressing the fiscal challenge—to 2022—are more than twice as severe as those for a 5-year delay. Again using the intermediate-2 scenario as a basis, a 10-year delay in remedial action would allow debt to rise to nearly 83 percent of GDP before remediation begins (see Table F-14 in Appendix F; for comparison with revenues, see Table F-9 in Appendix F). Because of the additional revenue needed to reach the target debt-to-GDP ratio thereafter, revenues would have to be about 12 percent higher at their peak than in the intermediate-2 scenario.
The consequences of a delay of 10 years are more than twice as severe as those for a delay of 5 years for two reasons. First, because of compound interest on the additional debt, doubling the years of delay more than doubles the addition of debt. A doubled delay to attain a sustainable debt-to-GDP ratio would thus require more than twice as large an increase in revenue, even with everything else unchanged. Second, during those 10 years the number of Social Security, Medicare, and elderly Medicaid beneficiaries would have been increased by retirement of additional baby boomers. Thus, such a delay would put program spending on a permanently higher trajectory even when the same specific policy reforms are eventually introduced. Although even a 5-year delay would add greatly to the difficulty of reaching sustainability, a 10-year delay would more than double the difficulty of putting the nation’s budget on a sustainable path.4
How delay makes it more difficult to achieve sustainability can also be assessed in a second way, as requiring a bigger reduction from projected spending (compared with the baseline), rather than as a further increase in revenue. To stay within the revenue bounds of the intermediate-2 scenario (i.e., which assumes policy changes are introduced in 2012), a 5-
year delay would require steeper spending reductions. For instance, Social Security, Medicaid, and Medicare would have to be cut to the level of the intermediate-1 scenario, and domestic and discretionary spending would have to be cut even further—to that of the low scenario (see Table F-15 in Appendix F; for comparison with revenues, see Table F-9 in Appendix F). The combination of delayed—but more deeply cut—spending paths requires a revenue path that is close to that of the intermediate-2 scenario without a delay, but a delay means lower levels of public services.
However, if spending reductions were delayed by 10 years, no combination of the reduced spending paths we have modeled could be sustained and hold needed revenue within the bounds of the intermediate-2 scenario (see Table F-16 in Appendix F; for comparison with revenues, see Table F-9 in Appendix F). Despite the lowest spending paths the committee has estimated (as part of the low revenue and spending scenario), with a 10-year delay the revenues required are markedly higher than with the intermediate-2 scenario. In contrast, the intermediate-2 scenario without delay leads to lower taxes and more public services. This projected outcome is another indication that a 10-year delay is far worse than one of 5 years.
As noted in Chapter 6, the illustrative Social Security reforms were designed both to achieve a financially stable program and to contribute to the sustainability of the federal budget as a whole, and to do so without raising payroll taxes or reducing benefit growth more than required to ensure the program’s long-term solvency. Having already considered consequences for the whole federal budget if these specific, detailed changes to Social Security are delayed 5 or 10 years, what is the consequence for that program’s solvency? As shown in Tables F-17 and F-18 (in Appendix F), none of the illustrative reforms if delayed comes close to achieving solvency (see Tables C-1 and C-2 and the accompanying text in Appendix C). Relative to reform undertaken starting in 2012 (i.e., not delayed), delayed Social Security reform helps the program’s finances much less for two reasons. First, on-time reforms affect more baby boomers than delayed reforms, which is important because the illustrative benefit-growth reductions are restricted to new retirees. Second, delaying increases in payroll taxation raises less revenue than needed for program solvency, particularly because of the slower growth of the labor force that is projected. Overall, our analysis shows that to achieve budget sustainability with delay, reforms would have to be tougher—deeper spending reductions or higher tax increases or both—which would make delayed reform more politically difficult than more immediate reform.
Another consequence of delay cannot be modeled. That is the heightened risk that the nation’s creditors—especially, those abroad—will recognize that the United States has no credible plan to restore fiscal stability and so demand higher interest rates on their loans or even broader economic
changes. With higher interest rates, and thus more of the budget devoted to debt service, the available revenues for programs would shrink, and the options for corrective action on the spending side would become still more difficult.
The Political Challenge
Given the magnitude of the fiscal challenge facing the nation and the costs of delay in meeting it, action would seem to be urgent. Yet the difficulty of the choices required, the nature of the U.S. political system, the record of most recent efforts to address the nation’s fiscal health, and continuing pressures for higher spending and lower taxes all suggest that early and decisive action will be difficult.
One way to increase the likelihood of appropriate and timely action would be to adopt budget process reforms such as those described in the next chapter. Budget reforms, while not sufficient in themselves to cause leaders to address the long-term fiscal challenge, can encourage and support those willing to make tough choices. The final chapter of the report addresses the kinds of actions needed by the nation’s people and leaders to avoid a fiscal catastrophe.


