
Appendix F
Constructing Multiple Paths to Sustainability
The committee constructed the sustainable scenarios in three steps. First, unique spending trajectories for Medicare and Medicaid, Social Security, and defense and domestic programs were specified for each of the scenarios. Details of the spending trajectories for Social Security and defense and domestic programs are discussed in Appendixes C and D, respectively. The health trajectories, which are by their very nature more speculative, are discussed in the first section below.
Second, a target debt-to-GDP (gross domestic product) ratio of 60 percent was uniformly applied across the scenarios so that the target ratio was gradually reached by 2022. Payments of interest on the debt (an amount derived by multiplying the debt level in a year by the projected interest rate on debt in that year) are the same for all scenarios.
Third, revenue levels were adjusted annually to a level that, given the spending amount specified for that year, produced deficits that were arithmetically consistent with the debt-to-GDP ratio specified for that year.
MEDICARE AND MEDICAID TRAJECTORIES
Low Spending Trajectory
The Congressional Budget Office (CBO) (2009) recently laid out a zero percent excess cost growth (ECG) trajectory for Medicare and Medicaid spending in its update of the long-term budget outlook. However, it did so using the assumptions of the “extended-baseline scenario” for Medicare and Medicaid, rather than the “alternative fiscal scenario” (which abandons
TABLE F-1 Basis of the Low Spending Trajectory for Medicare and Medicaid
|
2008 (Percentage of GDP) |
2025 Percentages of GDP |
|||
|
Actual |
CBO Extended-Baseline Scenario |
CBO: 0% Excess Cost Growth |
CBO Alternative Fiscal Scenario/Study Baseline |
0% Excess Cost Growth: For Use in Committee’s Scenarios |
|
4.1 |
7.3 |
5.9 |
7.4 |
(5.9/7.3)*7.4 = 6.0 |
the assumption that Medicare’s payment rates for physicians will grow with inflation) that is the basis of the committee’s study baseline for Medicare and Medicaid.
The committee adopted a simple approach to reconcile CBO’s zero percent ECG trajectory with the study’s baseline assumptions. In 2025, for example, CBO’s path puts Medicare and Medicaid spending at 7.3 percent of GDP and program spending at 5.9 percent of GDP—that is, 19.2 percent below the extended baseline. Although the study baseline puts Medicare and Medicaid at 7.4 percent of GDP in 2025, which is slightly higher than CBO’s extended baseline, the committee still assumed that the zero percent ECG trajectory would put Medicare and Medicaid at 19.2 percent below the study baseline—that is, at 6 percent of GDP; see Table F-1.
High Spending Trajectory
The high spending path uses CBO data to broadly mimic the long-term cost-growth path of the Medicare Trustees. The formula used in the extrapolation does two things:
-
It causes spending in 2083 to be at the same level as that achieved by the 1 percent ECG path laid out by CBO in its most recent update of the long-term budget outlook. The same adjustments the committee made to the zero percent ECG path (as described above) were made to the 1 percent ECG path.
-
It causes the spending curve to flatten out to zero percent ECG by 2083.
The formula that accomplishes that is as follows:
where MM is Medicare and Medicaid spending, t is any year after 2018, Zero Percent ECG is Medicare and Medicaid spending under a zero percent excess cost growth assumption, and Xt is a functional form that captures the gradual diminishment of excess cost growth, where
The spending path that results fluctuates around the study baseline for Medicare and Medicaid until around 2050, sometimes falling slightly below it, sometimes slightly above it. The high spending trajectory, for the sake of conceptual tidiness, is constrained to never exceed the study baseline. As a result, the high spending trajectory follows the study baseline until 2030.
Intermediate Trajectories
For every year from 2012 to 2083, the intermediate-1 spending trajectory is exactly equidistant from the low and intermediate-2 spending trajectories, while the intermediate-2 spending trajectory is exactly equidistant from the intermediate-1 and high spending trajectories. The formulas are as follows:
where high represents Medicare and Medicaid expenditures under the high spending trajectory, and low represents program expenditures under the low spending trajectory.
SETTING THE DEBT-TO-GDP TARGET
To set the debt-to-GDP target, assume that g is the growth rate of nominal GDP and that OMF (other means for financing) represents transactions that affect federal borrowing but that are not included in revenues and outlays (and which are generally small relative to the deficit).1 Then:
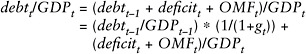
and
If the debt-to-GDP ratio is held constant, then:
If the debt-to-GDP ratio needs to be reduced—for example, by 1 percent a year—then:
Revenue levels can be specified once the target deficit is known:
All four scenarios allow the federal debt to grow as a percentage of GDP by 0.9 percent from 2011 to 2012; roughly stabilize it from 2012 to 2014; and then reduce it by 0.3 percent from 2014 to 2015, 0.4 percent from 2015 to 2016, 1 percent from 2016 to 2017, 4.3 percent from 2017 to 2018 (a large decrease made possible by a large projected repayment of Troubled Asset Relief Program (TARP) funds in 2018, which the scenarios apply toward debt reduction), 0.9 percent from 2018 to 2019, 0.6 percent from 2019 to 2020, 0.3 percent from 2020 to 2021, 0.5 percent from 2021 to 2022, 0.1 percent from 2022 to 2023, and maintains it at a stable level from then on.
The transitional decline in the debt-to-GDP ratio from 2012 to 2023 is designed to produce a low scenario with a near-term revenue trajectory that is as smooth as possible and with revenue levels that are as close to the historical average of 18.5 percent as possible.
Table F-2 presents information about projected revenues, outlays, deficits, and debt in the study baseline. Table F-3 presents information about projected deficits, debt, and interest payments under the committee’s four scenarios. Table F-4 presents information about the differences in deficits, debt, and interest payments between the committee’s four scenarios and the study baseline. Tables F-5, F-7, F-9, and F-11, respectively, present information about revenues and outlays in the low, intermediate-1, intermediate-2, and high scenarios. Tables F-6, F-8, F-10, and F-12, respectively, present information about the differences in revenues and outlays between the low, intermediate-1, intermediate-2, and high scenarios and the study baseline.
DELAY SCENARIOS
General
The delay scenarios indicate, as simply as possible, the consequences of delaying changes. The same debt-to-GDP target is applied, and the same
TABLE F-2 Projected Revenues, Outlays, Deficits, and Debt in the Study Baseline, as Percentages of GDP
|
Selected Years |
Revenues |
Outlays |
M and Ma |
Soc Secb |
Def and Domc |
Interest |
Deficit |
Debt |
|||
|
Total |
Defense |
Dom Discd |
Dom Mande |
||||||||
|
2008f |
17.7 |
21.0 |
4.1 |
4.3 |
10.8 |
4.3 |
3.7 |
2.8 |
1.8 |
3.2 |
40.8 |
|
2009 |
15.5 |
27.6 |
4.8 |
4.8 |
16.8 |
4.8 |
4.1 |
7.9 |
1.2 |
12.1 |
55.0 |
|
2010 |
16.0 |
24.5 |
5.1 |
4.8 |
13.5 |
5.1 |
4.4 |
3.9 |
1.2 |
8.5 |
60.9 |
|
2011 |
17.1 |
23.7 |
5.1 |
4.8 |
12.4 |
5.0 |
4.1 |
3.2 |
1.4 |
6.6 |
64.8 |
|
2012 |
17.9 |
22.2 |
4.9 |
4.7 |
10.8 |
4.5 |
3.7 |
2.5 |
1.7 |
4.3 |
66.5 |
|
2013 |
18.1 |
22.2 |
5.1 |
4.7 |
10.2 |
4.1 |
3.5 |
2.5 |
2.1 |
4.0 |
67.6 |
|
2014 |
18.1 |
22.2 |
5.3 |
4.8 |
9.6 |
3.9 |
3.4 |
2.3 |
2.5 |
4.1 |
69.0 |
|
2015 |
18.3 |
22.3 |
5.4 |
4.8 |
9.3 |
3.7 |
3.3 |
2.2 |
2.8 |
4.0 |
70.4 |
|
2016 |
18.3 |
22.6 |
5.6 |
4.9 |
9.1 |
3.7 |
3.3 |
2.2 |
3.0 |
4.3 |
72.1 |
|
2017 |
18.3 |
22.7 |
5.7 |
5.0 |
8.9 |
3.6 |
3.2 |
2.1 |
3.1 |
4.3 |
73.8 |
|
2018 |
18.3 |
22.8 |
5.7 |
5.1 |
8.7 |
3.5 |
3.1 |
2.0 |
3.4 |
4.5 |
73.8 |
|
2019 |
18.3 |
23.4 |
6.1 |
5.2 |
8.6 |
3.4 |
3.0 |
2.1 |
3.6 |
5.1 |
76.1 |
|
2020 |
18.3 |
23.8 |
6.4 |
5.3 |
8.5 |
3.4 |
3.0 |
2.1 |
3.6 |
5.5 |
78.8 |
|
2021 |
18.4 |
24.1 |
6.6 |
5.4 |
8.5 |
3.4 |
3.0 |
2.1 |
3.7 |
5.7 |
81.7 |
|
2022 |
18.4 |
24.5 |
6.8 |
5.4 |
8.6 |
3.4 |
3.0 |
2.1 |
3.7 |
6.0 |
84.7 |
|
2023 |
18.4 |
24.8 |
7.0 |
5.5 |
8.5 |
3.4 |
3.0 |
2.1 |
3.8 |
6.4 |
87.8 |
|
2024 |
18.5 |
25.1 |
7.2 |
5.5 |
8.5 |
3.4 |
3.0 |
2.1 |
3.9 |
6.6 |
91.3 |
|
2025 |
18.5 |
25.6 |
7.4 |
5.6 |
8.6 |
3.4 |
3.0 |
2.1 |
3.9 |
7.1 |
95.0 |
|
2030 |
18.7 |
28.1 |
8.7 |
6.0 |
8.5 |
3.4 |
3.0 |
2.1 |
4.8 |
9.4 |
117.6 |
|
2035 |
18.9 |
30.4 |
9.9 |
6.0 |
8.5 |
3.4 |
3.0 |
2.1 |
6.0 |
11.5 |
146.5 |
|
2040 |
19.1 |
32.8 |
10.9 |
5.9 |
8.5 |
3.4 |
3.0 |
2.1 |
7.4 |
13.7 |
180.2 |
|
2045 |
19.3 |
35.1 |
11.8 |
5.8 |
8.4 |
3.4 |
3.0 |
2.1 |
9.1 |
15.8 |
218.2 |
|
2050 |
19.6 |
37.5 |
12.6 |
5.7 |
8.4 |
3.4 |
3.0 |
2.1 |
10.8 |
17.9 |
259.2 |
|
2055 |
19.9 |
40.2 |
13.4 |
5.8 |
8.4 |
3.3 |
3.0 |
2.1 |
12.7 |
20.4 |
303.8 |
|
2060 |
20.3 |
43.1 |
14.2 |
5.8 |
8.4 |
3.4 |
3.0 |
2.1 |
14.7 |
22.9 |
351.7 |
|
2065 |
20.6 |
46.3 |
15.1 |
5.9 |
8.4 |
3.3 |
3.0 |
2.1 |
17.0 |
25.7 |
403.4 |
|
2070 |
20.9 |
49.7 |
16.0 |
6.0 |
8.4 |
3.3 |
3.0 |
2.1 |
19.4 |
28.8 |
460.4 |
|
2075 |
21.2 |
53.4 |
17.0 |
6.1 |
8.4 |
3.3 |
3.0 |
2.1 |
21.9 |
32.2 |
521.5 |
|
2080 |
21.6 |
57.4 |
17.9 |
6.2 |
8.4 |
3.4 |
3.0 |
2.1 |
24.9 |
35.9 |
590.5 |
|
2083 |
21.8 |
59.7 |
18.4 |
6.2 |
8.4 |
3.4 |
3.0 |
2.1 |
26.7 |
38.0 |
633.8 |
|
aMedicare and Medicaid. bSocial Security. cDefense and domestic. dDomestic discretionary. eDomestic mandatory. fActual spending. |
|||||||||||
TABLE F-3 Projected Federal Deficits, Debt, and Interest Payments Under the Committee’s Four Scenarios, as Percentages of GDP
|
Selected Years |
Deficit |
Debt |
Interest Payments |
|
2008a |
3.2 |
40.8 |
1.8 |
|
2009 |
12.1 |
55.0 |
1.2 |
|
2010 |
8.5 |
60.9 |
1.2 |
|
2011 |
6.5 |
64.8 |
1.4 |
|
2012 |
3.2 |
65.4 |
1.7 |
|
2013 |
2.9 |
65.4 |
2.1 |
|
2014 |
2.6 |
65.4 |
2.4 |
|
2015 |
2.2 |
65.2 |
2.6 |
|
2016 |
2.1 |
64.9 |
2.7 |
|
2017 |
1.7 |
64.2 |
2.8 |
|
2018 |
1.4 |
61.5 |
2.9 |
|
2019 |
1.8 |
61.0 |
2.9 |
|
2020 |
1.9 |
60.6 |
2.9 |
|
2021 |
2.0 |
60.4 |
2.8 |
|
2022 |
1.9 |
60.0 |
2.7 |
|
2023 |
2.2 |
60.0 |
2.6 |
|
2024 |
2.2 |
60.0 |
2.6 |
|
2025 |
2.2 |
60.0 |
2.5 |
|
2030 |
2.2 |
60.0 |
2.5 |
|
2035 |
2.3 |
60.0 |
2.5 |
|
2040 |
2.3 |
60.0 |
2.5 |
|
2045 |
2.2 |
60.0 |
2.5 |
|
2050 |
2.3 |
60.0 |
2.5 |
|
2055 |
2.3 |
60.0 |
2.5 |
|
2060 |
2.2 |
60.0 |
2.5 |
|
2065 |
2.3 |
60.0 |
2.6 |
|
2070 |
2.3 |
60.0 |
2.6 |
|
2075 |
2.3 |
60.0 |
2.6 |
|
2080 |
2.2 |
60.0 |
2.6 |
|
2083 |
2.3 |
60.0 |
2.6 |
|
aActual spending. |
|||
nonbaseline trajectories are used. The difference is that the changes start 5 or 10 years later, that is, in 2017 or 2022. The nonbaseline revenue paths are similarly delayed 5 or 10 years. There are two ways these elements can be combined; for example, for 5-year delays (also see Chapter 9):
-
the revenue path necessary to attain the debt-to-GDP target for a 5-year delay of each spending trajectory, and
-
to stay within a given delayed revenue trajectory and attain the debt-to-GDP target, combinations of delayed spending paths.
TABLE F-4 Percentage Point Differences for Deficits, Debt, and Interest Payments Between the Committee’s Four Scenarios and the Study Baseline, as Shares of GDP
|
Selected Years |
Deficit |
Debt |
Interest Payments |
|
2008a |
0.0 |
0.0 |
0.0 |
|
2009 |
0.0 |
0.0 |
0.0 |
|
2010 |
0.0 |
0.0 |
0.0 |
|
2011 |
0.0 |
0.0 |
0.0 |
|
2012 |
−1.1 |
−1.1 |
0.0 |
|
2013 |
−1.2 |
−2.2 |
−0.1 |
|
2014 |
−1.5 |
−3.6 |
−0.1 |
|
2015 |
−1.8 |
−5.3 |
−0.2 |
|
2016 |
−2.2 |
−7.2 |
−0.3 |
|
2017 |
−2.6 |
−9.5 |
−0.4 |
|
2018 |
−3.1 |
−12.3 |
−0.5 |
|
2019 |
−3.4 |
−15.2 |
−0.7 |
|
2020 |
−3.6 |
−18.2 |
−0.8 |
|
2021 |
−3.8 |
−21.3 |
−0.9 |
|
2022 |
−4.1 |
−24.6 |
−1.0 |
|
2023 |
−4.2 |
−27.9 |
−1.1 |
|
2024 |
−4.5 |
−31.3 |
−1.3 |
|
2025 |
−4.9 |
−35.0 |
−1.4 |
|
2030 |
−7.2 |
−57.6 |
−2.3 |
|
2035 |
−9.2 |
−86.5 |
−3.5 |
|
2040 |
−16.7 |
−120.2 |
−4.9 |
|
2045 |
−13.6 |
−158.2 |
−6.5 |
|
2050 |
−17.3 |
−199.3 |
−8.3 |
|
2055 |
−18.1 |
−243.8 |
−10.2 |
|
2060 |
−20.6 |
−291.7 |
−12.2 |
|
2065 |
−23.4 |
−343.4 |
−14.4 |
|
2070 |
−26.5 |
−400.5 |
−16.8 |
|
2075 |
−29.9 |
−461.5 |
−19.4 |
|
2080 |
−33.6 |
−530.5 |
−22.4 |
|
2083 |
−35.7 |
−573.9 |
−24.2 |
|
aActual spending. |
|||
Delayed Medicare and Medicaid Trajectories
Low Spending Trajectory
For the low spending path, for the 5-year delay, this path follows the study baseline until 2017, after which it grows at the same proportional rate as the zero percent ECG trajectory that is implemented in 2012. For the 10-year delay, this path follows the study baseline until 2022, after which it grows at the same proportional rate as the zero percent ECG spending trajectory.
TABLE F-5 Federal Spending and Revenues Under the Committee’s Low Scenario, as Percentages of GDP
|
Selected Years |
Revenues |
Outlays |
M and Ma |
Soc Secb |
Def and Domc |
|||
|
Total |
Defense |
Dom Discd |
Dom Mande |
|||||
|
2008f |
17.7 |
21.0 |
4.1 |
4.3 |
10.8 |
4.3 |
3.7 |
2.8 |
|
2009 |
15.5 |
27.6 |
4.8 |
4.8 |
16.8 |
4.8 |
4.1 |
7.9 |
|
2010 |
16.0 |
24.5 |
5.1 |
4.8 |
13.5 |
5.1 |
4.4 |
3.9 |
|
2011 |
17.1 |
23.7 |
5.1 |
4.8 |
12.4 |
5.0 |
4.1 |
3.2 |
|
2012 |
18.5 |
21.8 |
4.8 |
4.7 |
10.5 |
4.4 |
3.6 |
2.5 |
|
2013 |
18.5 |
21.4 |
5.0 |
4.7 |
9.6 |
3.9 |
3.3 |
2.5 |
|
2014 |
18.5 |
21.1 |
5.2 |
4.7 |
8.8 |
3.5 |
3.1 |
2.3 |
|
2015 |
18.5 |
20.7 |
5.2 |
4.7 |
8.2 |
3.2 |
2.9 |
2.1 |
|
2016 |
18.5 |
20.7 |
5.4 |
4.8 |
7.8 |
3.0 |
2.7 |
2.1 |
|
2017 |
18.5 |
20.3 |
5.4 |
4.8 |
7.4 |
2.8 |
2.5 |
2.0 |
|
2018 |
18.5 |
20.0 |
5.3 |
4.9 |
6.9 |
2.7 |
2.4 |
1.9 |
|
2019 |
18.5 |
20.3 |
5.5 |
4.9 |
6.9 |
2.6 |
2.3 |
2.0 |
|
2020 |
18.5 |
20.4 |
5.7 |
5.0 |
6.8 |
2.6 |
2.3 |
2.0 |
|
2021 |
18.5 |
20.5 |
5.8 |
5.1 |
6.8 |
2.6 |
2.3 |
2.0 |
|
2022 |
18.5 |
20.5 |
5.8 |
5.1 |
6.9 |
2.6 |
2.3 |
2.0 |
|
2023 |
18.4 |
20.6 |
6.0 |
5.1 |
6.8 |
2.6 |
2.3 |
2.0 |
|
2024 |
18.5 |
20.7 |
6.1 |
5.1 |
6.8 |
2.6 |
2.3 |
2.0 |
|
2025 |
18.5 |
20.6 |
6.0 |
5.2 |
6.9 |
2.6 |
2.3 |
2.0 |
|
2030 |
19.1 |
21.3 |
6.5 |
5.5 |
6.8 |
2.6 |
2.3 |
2.0 |
|
2035 |
19.2 |
21.5 |
6.8 |
5.4 |
6.8 |
2.6 |
2.3 |
2.0 |
|
2040 |
19.1 |
21.5 |
7.0 |
5.1 |
6.8 |
2.6 |
2.3 |
2.0 |
|
2045 |
19.1 |
21.3 |
7.1 |
4.9 |
6.8 |
2.6 |
2.3 |
2.0 |
|
2050 |
18.9 |
21.1 |
7.1 |
4.7 |
6.8 |
2.6 |
2.3 |
2.0 |
|
2055 |
18.8 |
21.1 |
7.2 |
4.7 |
6.7 |
2.5 |
2.2 |
1.9 |
|
2060 |
18.8 |
21.0 |
7.2 |
4.6 |
6.8 |
2.6 |
2.3 |
2.0 |
|
2065 |
18.7 |
21.0 |
7.2 |
4.6 |
6.7 |
2.5 |
2.2 |
1.9 |
|
2070 |
18.8 |
21.2 |
7.3 |
4.6 |
6.7 |
2.5 |
2.2 |
1.9 |
|
2075 |
19.0 |
21.3 |
7.5 |
4.6 |
6.7 |
2.5 |
2.2 |
1.9 |
|
2080 |
19.3 |
21.5 |
7.5 |
4.7 |
6.8 |
2.6 |
2.3 |
2.0 |
|
2083 |
19.2 |
21.5 |
7.5 |
4.6 |
6.8 |
2.6 |
2.3 |
2.0 |
|
aMedicare and Medicaid. bSocial Security. cDefense and domestic. dDomestic discretionary. eDomestic mandatory. fActual spending. |
||||||||
TABLE F-6 Percentage Point Differences for Revenues and Outlays Between the Committee’s Low Scenario and the Study Baseline, as Percentages of GDP
|
Selected Years |
Revenues |
Outlays (total) |
Outlays (noninterest) |
M and Ma |
Soc Secb |
Def and Domc |
|||
|
Total |
Defense |
Dom Discd |
Dom Mande |
||||||
|
2008f |
0.0 |
0.0 |
0.0 |
0.0 |
0.0 |
0.0 |
0.0 |
0.0 |
0.0 |
|
2009 |
0.0 |
0.0 |
0.0 |
0.0 |
0.0 |
0.0 |
0.0 |
0.0 |
0.0 |
|
2010 |
0.0 |
0.0 |
0.0 |
0.0 |
0.0 |
0.0 |
0.0 |
0.0 |
0.0 |
|
2011 |
0.0 |
0.0 |
0.0 |
0.0 |
0.0 |
0.0 |
0.0 |
0.0 |
0.0 |
|
2012 |
0.7 |
−0.4 |
−0.4 |
−0.1 |
0.0 |
−0.3 |
−0.2 |
−0.1 |
0.0 |
|
2013 |
0.4 |
−0.8 |
−0.7 |
−0.1 |
0.0 |
−0.6 |
−0.3 |
−0.2 |
0.0 |
|
2014 |
0.4 |
−1.1 |
−1.0 |
−0.1 |
0.0 |
−0.8 |
−0.4 |
−0.4 |
−0.1 |
|
2015 |
0.3 |
−1.5 |
−1.4 |
−0.2 |
−0.1 |
−1.1 |
−0.5 |
−0.5 |
−0.1 |
|
2016 |
0.3 |
−1.9 |
−1.6 |
−0.2 |
−0.1 |
−1.3 |
−0.6 |
−0.6 |
−0.1 |
|
2017 |
0.2 |
−2.4 |
−2.0 |
−0.3 |
−0.2 |
−1.5 |
−0.7 |
−0.7 |
−0.1 |
|
2018 |
0.2 |
−2.9 |
−2.4 |
−0.4 |
−0.2 |
−1.7 |
−0.8 |
−0.8 |
−0.1 |
|
2019 |
0.2 |
−3.1 |
−2.5 |
−0.5 |
−0.2 |
−1.7 |
−0.8 |
−0.7 |
−0.1 |
|
2020 |
0.2 |
−3.4 |
−2.6 |
−0.6 |
−0.3 |
−1.7 |
−0.8 |
−0.7 |
−0.1 |
|
2021 |
0.1 |
−3.6 |
−2.7 |
−0.7 |
−0.3 |
−1.7 |
−0.8 |
−0.7 |
−0.1 |
|
2022 |
0.1 |
−4.0 |
−3.0 |
−0.9 |
−0.3 |
−1.7 |
−0.8 |
−0.7 |
−0.1 |
|
2023 |
0.0 |
−4.2 |
−3.1 |
−1.0 |
−0.3 |
−1.7 |
−0.8 |
−0.7 |
−0.1 |
|
2024 |
0.0 |
−4.5 |
−3.2 |
−1.1 |
−0.4 |
−1.7 |
−0.8 |
−0.7 |
−0.1 |
|
2025 |
0.0 |
−4.9 |
−3.5 |
−1.4 |
−0.4 |
−1.7 |
−0.8 |
−0.7 |
−0.1 |
|
2030 |
0.4 |
−6.8 |
−4.5 |
−2.3 |
−0.5 |
−1.7 |
−0.8 |
−0.7 |
−0.1 |
|
2035 |
0.3 |
−8.9 |
−5.4 |
−3.1 |
−0.6 |
−1.7 |
−0.8 |
−0.7 |
−0.1 |
|
2040 |
0.0 |
−11.3 |
−6.4 |
−3.9 |
−0.7 |
−1.7 |
−0.8 |
−0.7 |
−0.1 |
|
2045 |
−0.2 |
−13.8 |
−7.3 |
−4.7 |
−0.9 |
−1.7 |
−0.8 |
−0.7 |
−0.1 |
|
2050 |
−0.7 |
−16.4 |
−8.1 |
−5.5 |
−1.0 |
−1.7 |
−0.8 |
−0.7 |
−0.1 |
|
2055 |
−1.1 |
−19.2 |
−9.0 |
−6.2 |
−1.1 |
−1.7 |
−0.8 |
−0.7 |
−0.1 |
|
2060 |
−1.5 |
−22.1 |
−10.0 |
−7.0 |
−1.2 |
−1.7 |
−0.8 |
−0.7 |
−0.1 |
|
2065 |
−1.8 |
−25.3 |
−10.8 |
−7.9 |
−1.3 |
−1.7 |
−0.8 |
−0.7 |
−0.1 |
|
2070 |
−2.0 |
−28.5 |
−11.7 |
−8.7 |
−1.4 |
−1.7 |
−0.8 |
−0.7 |
−0.1 |
|
2075 |
−2.1 |
−32.0 |
−12.6 |
−9.5 |
−1.4 |
−1.7 |
−0.8 |
−0.7 |
−0.1 |
|
2080 |
−2.2 |
−35.9 |
−13.5 |
−10.3 |
−1.5 |
−1.7 |
−0.8 |
−0.7 |
−0.1 |
|
2083 |
−2.5 |
−38.2 |
−14.1 |
−10.8 |
−1.5 |
−1.7 |
−0.8 |
−0.7 |
−0.1 |
|
aMedicare and Medicaid. bSocial Security. cDefense and domestic. dDomestic discretionary. eDomestic mandatory. fActual spending. |
|||||||||
TABLE F-7 Federal Spending and Revenues Under the Committee’s Intermediate-1 Scenario, as Percentages of GDP
|
Selected Years |
Revenues |
Outlays |
M and Ma |
Soc Secb |
Def and Domc |
|||
|
Total |
Defense |
Dom Discd |
Dom Mande |
|||||
|
2008f |
17.7 |
21.0 |
4.1 |
4.3 |
10.8 |
4.3 |
3.7 |
2.8 |
|
2009 |
15.5 |
27.6 |
4.8 |
4.8 |
16.8 |
4.8 |
4.1 |
7.9 |
|
2010 |
16.0 |
24.5 |
5.1 |
4.8 |
13.5 |
5.1 |
4.4 |
3.9 |
|
2011 |
17.1 |
23.7 |
5.1 |
4.8 |
12.4 |
5.0 |
4.1 |
3.2 |
|
2012 |
19.2 |
22.5 |
4.9 |
4.7 |
11.1 |
4.5 |
4.1 |
2.5 |
|
2013 |
19.6 |
22.5 |
5.0 |
4.7 |
10.6 |
4.1 |
4.0 |
2.5 |
|
2014 |
19.9 |
22.5 |
5.2 |
4.8 |
10.1 |
3.9 |
3.9 |
2.3 |
|
2015 |
20.2 |
22.4 |
5.2 |
4.8 |
9.8 |
3.7 |
3.8 |
2.2 |
|
2016 |
20.5 |
22.6 |
5.5 |
4.9 |
9.6 |
3.7 |
3.7 |
2.2 |
|
2017 |
20.7 |
22.5 |
5.5 |
4.9 |
9.3 |
3.6 |
3.7 |
2.1 |
|
2018 |
21.0 |
22.4 |
5.5 |
5.0 |
9.0 |
3.5 |
3.6 |
2.0 |
|
2019 |
21.0 |
22.8 |
5.7 |
5.1 |
9.0 |
3.4 |
3.5 |
2.1 |
|
2020 |
21.0 |
22.9 |
5.9 |
5.2 |
8.9 |
3.4 |
3.5 |
2.1 |
|
2021 |
21.1 |
23.1 |
6.1 |
5.3 |
8.9 |
3.4 |
3.5 |
2.1 |
|
2022 |
21.2 |
23.1 |
6.1 |
5.3 |
9.0 |
3.4 |
3.5 |
2.1 |
|
2023 |
21.1 |
23.3 |
6.4 |
5.4 |
8.9 |
3.4 |
3.5 |
2.1 |
|
2024 |
21.2 |
23.4 |
6.5 |
5.4 |
8.9 |
3.4 |
3.5 |
2.1 |
|
2025 |
21.3 |
23.5 |
6.5 |
5.4 |
9.0 |
3.4 |
3.5 |
2.1 |
|
2030 |
22.2 |
24.4 |
7.2 |
5.7 |
8.9 |
3.4 |
3.5 |
2.1 |
|
2035 |
22.6 |
24.9 |
7.8 |
5.6 |
8.9 |
3.4 |
3.5 |
2.1 |
|
2040 |
22.8 |
25.2 |
8.3 |
5.4 |
8.9 |
3.4 |
3.5 |
2.1 |
|
2045 |
23.0 |
25.2 |
8.6 |
5.2 |
8.8 |
3.4 |
3.4 |
2.1 |
|
2050 |
23.0 |
25.3 |
8.9 |
5.0 |
8.8 |
3.4 |
3.4 |
2.1 |
|
2055 |
23.2 |
25.4 |
9.1 |
5.0 |
8.7 |
3.3 |
3.4 |
2.1 |
|
2060 |
23.3 |
25.6 |
9.3 |
4.9 |
8.8 |
3.4 |
3.4 |
2.1 |
|
2065 |
23.4 |
25.7 |
9.5 |
4.9 |
8.7 |
3.3 |
3.4 |
2.1 |
|
2070 |
23.6 |
25.9 |
9.8 |
4.9 |
8.7 |
3.3 |
3.4 |
2.1 |
|
2075 |
23.9 |
26.2 |
10.0 |
4.9 |
8.7 |
3.3 |
3.4 |
2.1 |
|
2080 |
24.3 |
26.5 |
10.2 |
4.9 |
8.8 |
3.4 |
3.4 |
2.1 |
|
2083 |
24.2 |
26.5 |
10.2 |
4.9 |
8.8 |
3.4 |
3.4 |
2.1 |
|
aMedicare and Medicaid. bSocial Security. cDefense and domestic. dDomestic discretionary. eDomestic mandatory. fActual spending. |
||||||||
TABLE F-8 Percentage Point Differences for Revenues and Outlays Between the Committee’s Intermediate-1 Scenario and the Study Baseline, as Percentages of GDP
|
Selected Years |
Revenues |
Outlays (total) |
Outlays (noninterest) |
M and Ma |
Soc Secb |
Def and Domc |
|||
|
Total |
Defense |
Dom Discd |
Dom Mande |
||||||
|
2008f |
0.0 |
0.0 |
0.0 |
0.0 |
0.0 |
0.0 |
0.0 |
0.0 |
0.0 |
|
2009 |
0.0 |
0.0 |
0.0 |
0.0 |
0.0 |
0.0 |
0.0 |
0.0 |
0.0 |
|
2010 |
0.0 |
0.0 |
0.0 |
0.0 |
0.0 |
0.0 |
0.0 |
0.0 |
0.0 |
|
2011 |
0.0 |
0.0 |
0.0 |
0.0 |
0.0 |
0.0 |
0.0 |
0.0 |
0.0 |
|
2012 |
1.4 |
0.3 |
0.3 |
−0.1 |
0.0 |
0.3 |
0.0 |
0.4 |
0.0 |
|
2013 |
1.5 |
0.3 |
0.4 |
−0.1 |
0.0 |
0.4 |
0.0 |
0.4 |
0.0 |
|
2014 |
1.8 |
0.3 |
0.4 |
−0.1 |
0.0 |
0.5 |
0.0 |
0.5 |
0.0 |
|
2015 |
1.9 |
0.1 |
0.3 |
−0.1 |
0.0 |
0.5 |
0.0 |
0.5 |
0.0 |
|
2016 |
2.2 |
0.0 |
0.3 |
−0.1 |
0.0 |
0.4 |
0.0 |
0.5 |
0.0 |
|
2017 |
2.4 |
−0.2 |
0.2 |
−0.2 |
0.0 |
0.4 |
0.0 |
0.5 |
0.0 |
|
2018 |
2.7 |
−0.4 |
0.1 |
−0.3 |
0.0 |
0.4 |
0.0 |
0.4 |
0.0 |
|
2019 |
2.7 |
−0.7 |
0.0 |
−0.3 |
0.0 |
0.4 |
0.0 |
0.5 |
0.0 |
|
2020 |
2.7 |
−0.9 |
−0.1 |
−0.4 |
−0.1 |
0.4 |
0.0 |
0.5 |
0.0 |
|
2021 |
2.7 |
−1.1 |
−0.2 |
−0.5 |
−0.1 |
0.4 |
0.0 |
0.5 |
0.0 |
|
2022 |
2.8 |
−1.3 |
−0.3 |
−0.6 |
−0.1 |
0.4 |
0.0 |
0.5 |
0.0 |
|
2023 |
2.7 |
−1.6 |
−0.4 |
−0.7 |
−0.1 |
0.4 |
0.0 |
0.5 |
0.0 |
|
2024 |
2.7 |
−1.8 |
−0.5 |
−0.8 |
−0.1 |
0.4 |
0.0 |
0.5 |
0.0 |
|
2025 |
2.8 |
−2.1 |
−0.7 |
−1.0 |
−0.1 |
0.4 |
0.0 |
0.5 |
0.0 |
|
2030 |
3.5 |
−3.7 |
−1.4 |
−1.5 |
−0.2 |
0.4 |
0.0 |
0.5 |
0.0 |
|
2035 |
3.7 |
−5.5 |
−2.1 |
−2.1 |
−0.3 |
0.4 |
0.0 |
0.5 |
0.0 |
|
2040 |
3.7 |
−7.6 |
−2.7 |
−2.6 |
−0.5 |
0.4 |
0.0 |
0.5 |
0.0 |
|
2045 |
3.7 |
−9.9 |
−3.4 |
−3.2 |
−0.6 |
0.4 |
0.0 |
0.4 |
0.0 |
|
2050 |
3.4 |
−12.3 |
−4.0 |
−3.7 |
−0.7 |
0.4 |
0.0 |
0.4 |
0.0 |
|
2055 |
3.3 |
−14.8 |
−4.7 |
−4.3 |
−0.8 |
0.4 |
0.0 |
0.4 |
0.0 |
|
2060 |
3.1 |
−17.6 |
−5.4 |
−4.9 |
−0.9 |
0.4 |
0.0 |
0.4 |
0.0 |
|
2065 |
2.8 |
−20.6 |
−6.2 |
−5.6 |
−1.0 |
0.4 |
0.0 |
0.4 |
0.0 |
|
2070 |
2.8 |
−23.7 |
−6.9 |
−6.2 |
−1.1 |
0.4 |
0.0 |
0.4 |
0.0 |
|
2075 |
2.7 |
−27.1 |
−7.7 |
−7.0 |
−1.2 |
0.4 |
0.0 |
0.4 |
0.0 |
|
2080 |
2.7 |
−30.9 |
−8.5 |
−7.7 |
−1.2 |
0.4 |
0.0 |
0.4 |
0.0 |
|
2083 |
2.5 |
−33.2 |
−9.1 |
−8.2 |
−1.2 |
0.4 |
0.0 |
0.4 |
0.0 |
|
aMedicare and Medicaid. bSocial Security. cDefense and domestic. dDomestic discretionary. eDomestic mandatory. fActual spending. |
|||||||||
TABLE F-9 Federal Spending and Revenues Under the Committee’s Intermediate-2 Scenario, as Percentages of GDP
|
Selected Years |
Revenues |
Outlays |
M and Ma |
Soc Secb |
Def and Domc |
|||
|
Total |
Defense |
Dom Discd |
Dom Mande |
|||||
|
2008f |
17.7 |
21.0 |
4.1 |
4.3 |
10.8 |
4.3 |
3.7 |
2.8 |
|
2009 |
15.5 |
27.6 |
4.8 |
4.8 |
16.8 |
4.8 |
4.1 |
7.9 |
|
2010 |
16.0 |
24.5 |
5.1 |
4.8 |
13.5 |
5.1 |
4.4 |
3.9 |
|
2011 |
17.1 |
23.7 |
5.1 |
4.8 |
12.4 |
5.0 |
4.1 |
3.2 |
|
2012 |
18.8 |
22.0 |
4.9 |
4.7 |
10.7 |
4.5 |
3.7 |
2.5 |
|
2013 |
19.0 |
21.8 |
5.0 |
4.7 |
10.0 |
4.0 |
3.5 |
2.5 |
|
2014 |
19.1 |
21.7 |
5.3 |
4.8 |
9.3 |
3.7 |
3.3 |
2.3 |
|
2015 |
19.4 |
21.6 |
5.3 |
4.8 |
8.9 |
3.5 |
3.2 |
2.1 |
|
2016 |
19.6 |
21.7 |
5.5 |
4.9 |
8.6 |
3.4 |
3.1 |
2.1 |
|
2017 |
19.8 |
21.5 |
5.6 |
4.9 |
8.3 |
3.3 |
3.0 |
2.0 |
|
2018 |
20.0 |
21.4 |
5.6 |
5.0 |
7.9 |
3.2 |
2.9 |
1.9 |
|
2019 |
20.1 |
21.9 |
5.9 |
5.1 |
7.9 |
3.1 |
2.8 |
2.0 |
|
2020 |
20.2 |
22.1 |
6.1 |
5.2 |
7.8 |
3.1 |
2.8 |
2.0 |
|
2021 |
20.3 |
22.2 |
6.3 |
5.3 |
7.8 |
3.1 |
2.8 |
2.0 |
|
2022 |
20.4 |
22.3 |
6.4 |
5.3 |
7.9 |
3.1 |
2.8 |
2.0 |
|
2023 |
20.3 |
22.5 |
6.7 |
5.4 |
7.8 |
3.1 |
2.8 |
2.0 |
|
2024 |
20.5 |
22.7 |
6.9 |
5.4 |
7.8 |
3.1 |
2.8 |
2.0 |
|
2025 |
20.7 |
22.9 |
7.0 |
5.4 |
7.9 |
3.1 |
2.8 |
2.0 |
|
2030 |
21.9 |
24.1 |
7.9 |
5.8 |
7.8 |
3.1 |
2.8 |
2.0 |
|
2035 |
22.6 |
24.9 |
8.8 |
5.7 |
7.8 |
3.1 |
2.8 |
2.0 |
|
2040 |
23.2 |
25.5 |
9.6 |
5.6 |
7.8 |
3.1 |
2.8 |
2.0 |
|
2045 |
23.7 |
25.9 |
10.2 |
5.5 |
7.8 |
3.0 |
2.7 |
2.0 |
|
2050 |
24.1 |
26.3 |
10.6 |
5.4 |
7.8 |
3.0 |
2.7 |
2.0 |
|
2055 |
24.5 |
26.8 |
11.1 |
5.5 |
7.7 |
3.0 |
2.7 |
1.9 |
|
2060 |
25.0 |
27.2 |
11.4 |
5.5 |
7.8 |
3.0 |
2.7 |
2.0 |
|
2065 |
25.3 |
27.6 |
11.8 |
5.6 |
7.7 |
3.0 |
2.7 |
1.9 |
|
2070 |
25.7 |
28.1 |
12.2 |
5.6 |
7.7 |
3.0 |
2.7 |
1.9 |
|
2075 |
26.2 |
28.5 |
12.6 |
5.6 |
7.7 |
3.0 |
2.7 |
1.9 |
|
2080 |
26.6 |
28.8 |
12.8 |
5.6 |
7.8 |
3.0 |
2.7 |
2.0 |
|
2083 |
26.4 |
28.7 |
12.8 |
5.6 |
7.8 |
3.0 |
2.7 |
2.0 |
|
aMedicare and Medicaid. bSocial Security. cDefense and domestic. dDomestic discretionary. eDomestic mandatory. fActual spending. |
||||||||
TABLE F-10 Percentage Point Differences for Revenues and Outlays Between the Committee’s Intermediate-2 Scenario and the Study Baseline, as Percentages of GDP
|
Selected Years |
Revenues |
Outlays (total) |
Outlays (noninterest) |
M and Ma |
Soc Secb |
Def and Domc |
|||
|
Total |
Defense |
Dom Discd |
Dom Mande |
||||||
|
2008f |
0.0 |
0.0 |
0.0 |
0.0 |
0.0 |
0.0 |
0.0 |
0.0 |
0.0 |
|
2009 |
0.0 |
0.0 |
0.0 |
0.0 |
0.0 |
0.0 |
0.0 |
0.0 |
0.0 |
|
2010 |
0.0 |
0.0 |
0.0 |
0.0 |
0.0 |
0.0 |
0.0 |
0.0 |
0.0 |
|
2011 |
0.0 |
0.0 |
0.0 |
0.0 |
0.0 |
0.0 |
0.0 |
0.0 |
0.0 |
|
2012 |
0.9 |
−0.2 |
−0.2 |
0.0 |
0.0 |
−0.1 |
−0.1 |
0.0 |
0.0 |
|
2013 |
0.8 |
−0.3 |
−0.3 |
0.0 |
0.0 |
−0.2 |
−0.1 |
−0.1 |
0.0 |
|
2014 |
1.0 |
−0.5 |
−0.4 |
0.0 |
0.0 |
−0.3 |
−0.2 |
−0.1 |
−0.1 |
|
2015 |
1.1 |
−0.7 |
−0.5 |
−0.1 |
0.0 |
−0.5 |
−0.2 |
−0.1 |
−0.1 |
|
2016 |
1.3 |
−0.9 |
−0.6 |
−0.1 |
0.0 |
−0.5 |
−0.2 |
−0.2 |
−0.1 |
|
2017 |
1.5 |
−1.1 |
−0.8 |
−0.1 |
0.0 |
−0.6 |
−0.3 |
−0.2 |
−0.1 |
|
2018 |
1.7 |
−1.4 |
−0.9 |
−0.1 |
0.0 |
−0.7 |
−0.3 |
−0.2 |
−0.1 |
|
2019 |
1.8 |
−1.6 |
−0.9 |
−0.2 |
0.0 |
−0.7 |
−0.3 |
−0.2 |
−0.1 |
|
2020 |
1.9 |
−1.7 |
−1.0 |
−0.2 |
−0.1 |
−0.7 |
−0.3 |
−0.2 |
−0.1 |
|
2021 |
1.9 |
−1.9 |
−1.0 |
−0.2 |
−0.1 |
−0.7 |
−0.3 |
−0.2 |
−0.1 |
|
2022 |
2.0 |
−2.1 |
−1.1 |
−0.3 |
−0.1 |
−0.7 |
−0.3 |
−0.2 |
−0.1 |
|
2023 |
1.9 |
−2.3 |
−1.1 |
−0.3 |
−0.1 |
−0.7 |
−0.3 |
−0.2 |
−0.1 |
|
2024 |
2.0 |
−2.5 |
−1.2 |
−0.4 |
−0.1 |
−0.7 |
−0.3 |
−0.2 |
−0.1 |
|
2025 |
2.2 |
−2.7 |
−1.3 |
−0.5 |
−0.1 |
−0.7 |
−0.3 |
−0.2 |
−0.1 |
|
2030 |
3.2 |
−4.0 |
−1.7 |
−0.8 |
−0.2 |
−0.7 |
−0.3 |
−0.2 |
−0.1 |
|
2035 |
3.7 |
−5.5 |
−2.0 |
−1.1 |
−0.3 |
−0.7 |
−0.3 |
−0.2 |
−0.1 |
|
2040 |
4.1 |
−7.2 |
−2.3 |
−1.4 |
−0.3 |
−0.7 |
−0.3 |
−0.2 |
−0.1 |
|
2045 |
4.5 |
−9.2 |
−2.6 |
−1.7 |
−0.3 |
−0.7 |
−0.3 |
−0.2 |
−0.1 |
|
2050 |
4.5 |
−11.2 |
−2.9 |
−2.0 |
−0.3 |
−0.7 |
−0.3 |
−0.2 |
−0.1 |
|
2055 |
4.7 |
−13.4 |
−3.3 |
−2.3 |
−0.3 |
−0.7 |
−0.3 |
−0.2 |
−0.1 |
|
2060 |
4.7 |
−15.9 |
−3.8 |
−2.8 |
−0.3 |
−0.7 |
−0.3 |
−0.2 |
−0.1 |
|
2065 |
4.8 |
−18.7 |
−4.2 |
−3.3 |
−0.3 |
−0.7 |
−0.3 |
−0.2 |
−0.1 |
|
2070 |
4.9 |
−21.6 |
−4.8 |
−3.8 |
−0.4 |
−0.7 |
−0.3 |
−0.2 |
−0.1 |
|
2075 |
5.0 |
−24.9 |
−5.5 |
−4.4 |
−0.4 |
−0.7 |
−0.3 |
−0.2 |
−0.1 |
|
2080 |
5.0 |
−28.6 |
−6.3 |
−5.1 |
−0.5 |
−0.7 |
−0.3 |
−0.2 |
−0.1 |
|
2083 |
4.7 |
−31.0 |
−6.8 |
−5.6 |
−0.6 |
−0.7 |
−0.3 |
−0.2 |
−0.1 |
|
aMedicare and Medicaid. bSocial Security. cDefense and domestic. dDomestic discretionary. eDomestic mandatory. fActual spending. |
|||||||||
TABLE F-11 Federal Spending and Revenues Under the Committee’s High Scenario, as Percentages of GDP
|
Selected Years |
Revenues |
Outlays |
M and Ma |
Soc Secb |
Def and Domc |
|||
|
Total |
Defense |
Dom Discd |
Dom Mande |
|||||
|
2008f |
17.7 |
21.0 |
4.1 |
4.3 |
10.8 |
4.3 |
3.7 |
2.8 |
|
2009 |
15.5 |
27.6 |
4.8 |
4.8 |
16.8 |
4.8 |
4.1 |
7.9 |
|
2010 |
16.0 |
24.5 |
5.1 |
4.8 |
13.5 |
5.1 |
4.4 |
3.9 |
|
2011 |
17.1 |
23.7 |
5.1 |
4.8 |
12.4 |
5.0 |
4.1 |
3.2 |
|
2012 |
19.7 |
22.9 |
4.9 |
4.7 |
11.5 |
4.9 |
4.1 |
2.5 |
|
2013 |
20.4 |
23.2 |
5.1 |
4.7 |
11.4 |
4.8 |
4.0 |
2.5 |
|
2014 |
20.9 |
23.5 |
5.3 |
4.8 |
11.0 |
4.7 |
4.0 |
2.3 |
|
2015 |
21.3 |
23.5 |
5.4 |
4.8 |
10.7 |
4.6 |
3.9 |
2.2 |
|
2016 |
21.6 |
23.7 |
5.6 |
4.9 |
10.5 |
4.5 |
3.9 |
2.2 |
|
2017 |
21.9 |
23.7 |
5.7 |
5.0 |
10.3 |
4.4 |
3.8 |
2.1 |
|
2018 |
22.3 |
23.7 |
5.7 |
5.1 |
10.0 |
4.3 |
3.8 |
2.0 |
|
2019 |
22.4 |
24.2 |
6.1 |
5.2 |
10.0 |
4.2 |
3.7 |
2.1 |
|
2020 |
22.5 |
24.4 |
6.4 |
5.3 |
9.9 |
4.2 |
3.7 |
2.1 |
|
2021 |
22.6 |
24.6 |
6.6 |
5.4 |
9.9 |
4.2 |
3.7 |
2.1 |
|
2022 |
22.9 |
24.8 |
6.8 |
5.4 |
10.0 |
4.2 |
3.7 |
2.1 |
|
2023 |
22.8 |
25.0 |
7.0 |
5.5 |
9.9 |
4.2 |
3.7 |
2.1 |
|
2024 |
23.0 |
25.2 |
7.2 |
5.5 |
9.9 |
4.2 |
3.7 |
2.1 |
|
2025 |
23.4 |
25.6 |
7.4 |
5.6 |
10.0 |
4.2 |
3.7 |
2.1 |
|
2030 |
24.9 |
27.1 |
8.7 |
6.0 |
9.9 |
4.2 |
3.7 |
2.1 |
|
2035 |
25.9 |
28.2 |
9.9 |
6.0 |
9.9 |
4.2 |
3.7 |
2.1 |
|
2040 |
26.8 |
29.2 |
10.9 |
5.9 |
9.9 |
4.2 |
3.7 |
2.1 |
|
2045 |
27.6 |
29.8 |
11.7 |
5.8 |
9.8 |
4.1 |
3.6 |
2.1 |
|
2050 |
28.2 |
30.4 |
12.4 |
5.7 |
9.8 |
4.1 |
3.6 |
2.1 |
|
2055 |
28.8 |
31.1 |
13.1 |
5.8 |
9.7 |
4.1 |
3.6 |
2.1 |
|
2060 |
29.5 |
31.7 |
13.5 |
5.8 |
9.8 |
4.1 |
3.6 |
2.1 |
|
2065 |
30.0 |
32.3 |
14.1 |
5.9 |
9.7 |
4.1 |
3.6 |
2.1 |
|
2070 |
30.6 |
32.9 |
14.6 |
6.0 |
9.7 |
4.1 |
3.6 |
2.1 |
|
2075 |
31.2 |
33.5 |
15.1 |
6.1 |
9.7 |
4.1 |
3.6 |
2.1 |
|
2080 |
31.8 |
34.0 |
15.4 |
6.2 |
9.8 |
4.1 |
3.6 |
2.1 |
|
2083 |
31.7 |
34.0 |
15.4 |
6.2 |
9.8 |
4.1 |
3.6 |
2.1 |
|
aMedicare and Medicaid. bSocial Security. cDefense and domestic. dDomestic discretionary. eDomestic mandatory. fActual spending. |
||||||||
TABLE F-12 Percentage Point Differences for Revenues and Outlays Between the Committee’s High Scenario and the Study Baseline, as Percentages of GDP
|
Selected Years |
Revenues |
Outlays (total) |
Outlays (noninterest) |
M and Ma |
Soc Secb |
Def and Domc |
|||
|
Total |
Defense |
Dom Discd |
Dom Mande |
||||||
|
2008f |
0.0 |
0.0 |
0.0 |
0.0 |
0.0 |
0.0 |
0.0 |
0.0 |
0.0 |
|
2009 |
0.0 |
0.0 |
0.0 |
0.0 |
0.0 |
0.0 |
0.0 |
0.0 |
0.0 |
|
2010 |
0.0 |
0.0 |
0.0 |
0.0 |
0.0 |
0.0 |
0.0 |
0.0 |
0.0 |
|
2011 |
0.0 |
0.0 |
0.0 |
0.0 |
0.0 |
0.0 |
0.0 |
0.0 |
0.0 |
|
2012 |
1.8 |
0.7 |
0.7 |
0.0 |
0.0 |
0.7 |
0.4 |
0.4 |
0.0 |
|
2013 |
2.2 |
1.1 |
1.1 |
0.0 |
0.0 |
1.1 |
0.7 |
0.5 |
0.0 |
|
2014 |
2.7 |
1.2 |
1.4 |
0.0 |
0.0 |
1.4 |
0.8 |
0.6 |
0.0 |
|
2015 |
3.0 |
1.2 |
1.4 |
0.0 |
0.0 |
1.4 |
0.9 |
0.6 |
0.0 |
|
2016 |
3.3 |
1.1 |
1.4 |
0.0 |
0.0 |
1.4 |
0.9 |
0.6 |
0.0 |
|
2017 |
3.6 |
1.0 |
1.4 |
0.0 |
0.0 |
1.4 |
0.8 |
0.6 |
0.0 |
|
2018 |
4.0 |
0.9 |
1.4 |
0.0 |
0.0 |
1.4 |
0.8 |
0.6 |
0.0 |
|
2019 |
4.1 |
0.7 |
1.4 |
0.0 |
0.0 |
1.4 |
0.8 |
0.7 |
0.0 |
|
2020 |
4.2 |
0.6 |
1.4 |
0.0 |
0.0 |
1.4 |
0.8 |
0.6 |
0.0 |
|
2021 |
4.2 |
0.5 |
1.4 |
0.0 |
0.0 |
1.4 |
0.8 |
0.6 |
0.0 |
|
2022 |
4.5 |
0.4 |
1.4 |
0.0 |
0.0 |
1.4 |
0.8 |
0.7 |
0.0 |
|
2023 |
4.4 |
0.2 |
1.4 |
0.0 |
0.0 |
1.4 |
0.8 |
0.6 |
0.0 |
|
2024 |
4.5 |
0.1 |
1.4 |
0.0 |
0.0 |
1.4 |
0.8 |
0.6 |
0.0 |
|
2025 |
4.9 |
0.0 |
1.4 |
0.0 |
0.0 |
1.4 |
0.8 |
0.7 |
0.0 |
|
2030 |
6.2 |
−1.0 |
1.3 |
−0.1 |
0.0 |
1.4 |
0.8 |
0.6 |
0.0 |
|
2035 |
7.0 |
−2.2 |
1.3 |
−0.1 |
0.0 |
1.4 |
0.8 |
0.6 |
0.0 |
|
2040 |
7.7 |
−3.6 |
1.3 |
−0.1 |
0.0 |
1.4 |
0.8 |
0.6 |
0.0 |
|
2045 |
8.3 |
−5.3 |
1.2 |
−0.1 |
0.0 |
1.4 |
0.7 |
0.6 |
0.0 |
|
2050 |
8.6 |
−7.1 |
1.2 |
−0.2 |
0.0 |
1.4 |
0.7 |
0.6 |
0.0 |
|
2055 |
9.0 |
−9.1 |
1.0 |
−0.3 |
0.0 |
1.3 |
0.7 |
0.6 |
0.0 |
|
2060 |
9.2 |
−11.5 |
0.7 |
−0.6 |
0.0 |
1.4 |
0.7 |
0.6 |
0.0 |
|
2065 |
9.4 |
−14.0 |
0.4 |
−1.0 |
0.0 |
1.3 |
0.7 |
0.6 |
0.0 |
|
2070 |
9.7 |
−16.8 |
0.0 |
−1.3 |
0.0 |
1.3 |
0.7 |
0.6 |
0.0 |
|
2075 |
10.0 |
−19.9 |
−0.5 |
−1.8 |
0.0 |
1.3 |
0.7 |
0.6 |
0.0 |
|
2080 |
10.2 |
−23.4 |
−1.1 |
−2.4 |
0.0 |
1.4 |
0.7 |
0.6 |
0.0 |
|
2083 |
9.9 |
−25.7 |
−1.6 |
−2.9 |
0.0 |
1.4 |
0.7 |
0.6 |
0.0 |
|
aMedicare and Medicaid. bSocial Security. cDefense and domestic. dDomestic discretionary. eDomestic mandatory. fActual spending. |
|||||||||
High Spending Trajectory
Since the high spending path that is implemented in 2012 does not deviate from the study baseline until 2030, 5- and 10-year delays leave it unaffected.
Intermediate Spending Paths
For both 5- and 10-year delays, the delayed intermediate-1 spending trajectories are exactly equidistant from the delayed low and delayed intermediate-2 spending trajectories. Similarly, the delayed intermediate-2 spending trajectories are exactly equidistant from the delayed intermediate-1 and high spending trajectories.
Delayed Social Security Trajectories
A different approach is taken for the delayed Social Security trajectories, consistent with the committee’s analysis of this program (see Chapter 6 and Appendix C). In these trajectories, the execution of each of the specific, detailed policies is delayed 5 or 10 years, and the fiscal consequences are then estimated. For example, in the 5-year delay of Option 2 (two-third benefit-growth reductions; one-third payroll tax increases; see Table 6-1), the first increase of the payroll tax would be delayed 5 years to 2017, instead of occurring in 2012.
Each of the Social Security options that is implemented in 2012 achieves solvency for the program. However, as discussed in Chapter 9 (see also Tables F-17 and F-18 below), none of the delayed scenarios achieves solvency for the Social Security program.2
Delayed Defense and Other Domestic Spending Trajectories
With a 5-year delay, for all four scenarios, defense and other domestic spending follows the baseline until 2017. Mimicking the 7-year phase-in (from 2012 to 2019) for the scenarios implemented in 2012, policy changes take effect in 2017, and by 2024 spending levels are where they would have been with 2012 implementation. In other words, the delayed defense and other domestic spending paths look different from the 2012 ones until 2024, but are the same thereafter.
With a 10-year delay, for all four scenarios, defense and other domestic spending follows the baseline until 2022. Mimicking the 7-year phase-in (from 2012 to 2019) for the scenarios with 2012 implementation, policy changes take effect in 2022, and by 2029 spending levels are where they would have been with 2012 implementation. In other words, the delayed
TABLE F-13 Revenues and Outlays Under a 5-Year Delay of the Intermediate-2 Scenario, as Percentages of GDP
|
Selected Years |
Revenues |
Outlays |
M and Ma |
Soc Secb |
Def and Domc |
Interest |
Deficit |
Debt |
|
2012 |
17.9 |
22.2 |
4.9 |
4.7 |
10.8 |
1.7 |
4.3 |
66.4 |
|
2013 |
18.1 |
22.2 |
5.1 |
4.7 |
10.2 |
2.1 |
4.0 |
67.6 |
|
2014 |
18.1 |
22.2 |
5.3 |
4.8 |
9.6 |
2.5 |
4.1 |
69.0 |
|
2015 |
18.3 |
22.3 |
5.4 |
4.8 |
9.3 |
2.8 |
4.0 |
70.4 |
|
2016 |
18.3 |
22.6 |
5.6 |
4.9 |
9.1 |
3.0 |
4.3 |
72.1 |
|
2017 |
20.1 |
22.6 |
5.6 |
5.0 |
8.9 |
3.1 |
2.5 |
72.0 |
|
2018 |
20.4 |
22.7 |
5.7 |
5.1 |
8.7 |
3.2 |
2.3 |
69.8 |
|
2019 |
21.1 |
23.0 |
6.0 |
5.2 |
8.6 |
3.3 |
1.9 |
69.1 |
|
2020 |
21.5 |
23.1 |
6.2 |
5.3 |
8.4 |
3.2 |
1.6 |
68.1 |
|
2021 |
21.7 |
23.1 |
6.4 |
5.4 |
8.3 |
3.1 |
1.4 |
67.1 |
|
2022 |
21.8 |
22.9 |
6.5 |
5.3 |
8.1 |
3.0 |
1.1 |
65.7 |
|
2023 |
22.0 |
23.0 |
6.8 |
5.4 |
8.0 |
2.8 |
1.0 |
64.2 |
|
2024 |
21.9 |
23.0 |
6.9 |
5.4 |
7.8 |
2.8 |
1.1 |
63.0 |
|
2025 |
21.9 |
23.1 |
7.0 |
5.5 |
7.9 |
2.6 |
1.2 |
61.9 |
|
2026 |
21.9 |
23.3 |
7.3 |
5.6 |
7.8 |
2.6 |
1.5 |
61.0 |
|
2027 |
22.3 |
23.5 |
7.5 |
5.6 |
7.9 |
2.5 |
1.2 |
60.0 |
|
2028 |
21.6 |
23.8 |
7.7 |
5.7 |
7.8 |
2.5 |
2.2 |
60.0 |
|
2029 |
21.8 |
24.0 |
8.0 |
5.7 |
7.8 |
2.5 |
2.2 |
60.0 |
|
2030 |
22.0 |
24.2 |
8.0 |
5.8 |
7.8 |
2.5 |
2.2 |
60.0 |
|
2031 |
22.2 |
24.4 |
8.3 |
5.8 |
7.8 |
2.5 |
2.2 |
60.0 |
|
2032 |
22.3 |
24.6 |
8.4 |
5.8 |
7.8 |
2.5 |
2.3 |
60.0 |
|
2033 |
22.4 |
24.7 |
8.5 |
5.8 |
7.8 |
2.5 |
2.3 |
60.0 |
|
2034 |
22.8 |
25.0 |
8.8 |
5.8 |
7.8 |
2.5 |
2.2 |
60.0 |
|
2035 |
22.7 |
25.1 |
8.9 |
5.8 |
7.8 |
2.5 |
2.3 |
60.0 |
|
aMedicare and Medicaid. bSocial Security. cDefense and domestic, total. |
||||||||
defense and other domestic spending paths look different from the 2012 ones until 2029, but are the same thereafter.
Tables F-13 through F-18 present details of the delay scenarios. Whole-budget estimates appear in Tables F-13 to F-16, while financial estimates pertaining to the Social Security trust fund appear in Tables F-17 and F-18.
TABLE F-14 Revenues and Outlays Under a 10-Year Delay of the Intermediate-2 Scenario, as Percentages of GDP
|
Selected Years |
Revenues |
Outlays |
M and Ma |
Soc Secb |
Def and Domc |
Interest |
Deficit |
Debt |
|
2012 |
17.9 |
22.2 |
4.9 |
4.7 |
10.8 |
1.7 |
4.3 |
66.4 |
|
2013 |
18.1 |
22.2 |
5.1 |
4.7 |
10.2 |
2.1 |
4.0 |
67.6 |
|
2014 |
18.1 |
22.2 |
5.3 |
4.8 |
9.6 |
2.5 |
4.1 |
69.0 |
|
2015 |
18.3 |
22.3 |
5.4 |
4.8 |
9.3 |
2.8 |
4.0 |
70.4 |
|
2016 |
18.3 |
22.6 |
5.6 |
4.9 |
9.1 |
3.0 |
4.3 |
72.1 |
|
2017 |
18.3 |
22.7 |
5.7 |
5.0 |
8.9 |
3.1 |
4.3 |
73.8 |
|
2018 |
18.3 |
22.8 |
5.7 |
5.1 |
8.7 |
3.4 |
4.5 |
73.8 |
|
2019 |
18.3 |
23.4 |
6.1 |
5.2 |
8.6 |
3.6 |
5.1 |
76.1 |
|
2020 |
18.3 |
23.8 |
6.4 |
5.3 |
8.5 |
3.6 |
5.5 |
78.8 |
|
2021 |
18.4 |
24.1 |
6.6 |
5.4 |
8.5 |
3.7 |
5.7 |
81.7 |
|
2022 |
20.9 |
24.1 |
6.7 |
5.4 |
8.4 |
3.6 |
3.2 |
81.8 |
|
2023 |
22.9 |
24.2 |
7.0 |
5.5 |
8.3 |
3.5 |
1.3 |
79.9 |
|
2024 |
23.4 |
24.2 |
7.1 |
5.5 |
8.2 |
3.4 |
0.8 |
77.8 |
|
2025 |
23.6 |
24.1 |
7.2 |
5.6 |
8.1 |
3.2 |
0.4 |
75.4 |
|
2026 |
23.8 |
24.2 |
7.5 |
5.7 |
8.0 |
3.1 |
0.5 |
73.0 |
|
2027 |
23.9 |
24.2 |
7.7 |
5.6 |
7.9 |
3.0 |
0.3 |
70.7 |
|
2028 |
23.8 |
24.4 |
7.9 |
5.7 |
7.8 |
2.9 |
0.6 |
68.7 |
|
2029 |
24.1 |
24.6 |
8.2 |
5.8 |
7.8 |
2.8 |
0.4 |
66.5 |
|
2030 |
24.2 |
24.7 |
8.2 |
5.9 |
7.8 |
2.8 |
0.5 |
64.6 |
|
2031 |
24.8 |
24.8 |
8.5 |
5.9 |
7.8 |
2.7 |
0.1 |
62.3 |
|
2032 |
24.9 |
24.9 |
8.6 |
5.9 |
7.8 |
2.6 |
0.0 |
60.0 |
|
2033 |
22.7 |
25.0 |
8.7 |
5.9 |
7.8 |
2.5 |
2.3 |
60.0 |
|
2034 |
23.1 |
25.3 |
9.0 |
5.8 |
7.8 |
2.5 |
2.2 |
60.0 |
|
2035 |
23.0 |
25.3 |
9.1 |
5.8 |
7.8 |
2.5 |
2.3 |
60.0 |
|
aMedicare and Medicaid. bSocial Security. cDefense and domestic, total. |
||||||||
TABLE F-15 Budget Totals Resulting from 5-Year Delays of the Intermediate-1 (for Medicare and Medicaid and Social Security) and Low (for Defense and Other Domestic Spending) Scenarios, as Percentages of GDP
|
Selected Years |
Revenues |
Outlays |
M and Ma |
Soc Secb |
Def and Domc |
Interest |
Deficit |
Debt |
|
2012 |
17.9 |
22.2 |
4.9 |
4.7 |
10.8 |
1.7 |
4.3 |
66.4 |
|
2013 |
18.1 |
22.2 |
5.1 |
4.7 |
10.2 |
2.1 |
4.0 |
67.6 |
|
2014 |
18.1 |
22.2 |
5.3 |
4.8 |
9.6 |
2.5 |
4.1 |
69.0 |
|
2015 |
18.3 |
22.3 |
5.4 |
4.8 |
9.3 |
2.8 |
4.0 |
70.4 |
|
2016 |
18.3 |
22.6 |
5.6 |
4.9 |
9.1 |
3.0 |
4.3 |
72.1 |
|
2017 |
19.9 |
22.4 |
5.6 |
5.0 |
8.8 |
3.1 |
2.5 |
72.0 |
|
2018 |
20.1 |
22.4 |
5.6 |
5.1 |
8.5 |
3.2 |
2.3 |
69.8 |
|
2019 |
20.6 |
22.5 |
5.9 |
5.2 |
8.2 |
3.3 |
1.9 |
69.1 |
|
2020 |
20.8 |
22.4 |
6.1 |
5.3 |
7.9 |
3.2 |
1.6 |
68.1 |
|
2021 |
20.9 |
22.3 |
6.2 |
5.3 |
7.6 |
3.1 |
1.4 |
67.1 |
|
2022 |
20.8 |
21.9 |
6.3 |
5.3 |
7.3 |
3.0 |
1.1 |
65.7 |
|
2023 |
20.8 |
21.8 |
6.5 |
5.4 |
7.1 |
2.8 |
1.0 |
64.2 |
|
2024 |
20.5 |
21.6 |
6.6 |
5.4 |
6.8 |
2.8 |
1.1 |
63.0 |
|
2025 |
20.5 |
21.7 |
6.6 |
5.5 |
6.9 |
2.6 |
1.2 |
61.9 |
|
2026 |
20.4 |
21.9 |
6.9 |
5.6 |
6.8 |
2.6 |
1.5 |
61.0 |
|
2027 |
20.8 |
22.0 |
7.0 |
5.6 |
6.9 |
2.5 |
1.2 |
60.0 |
|
2028 |
20.0 |
22.2 |
7.2 |
5.6 |
6.8 |
2.5 |
2.2 |
60.0 |
|
2029 |
20.1 |
22.4 |
7.4 |
5.7 |
6.8 |
2.5 |
2.2 |
60.0 |
|
2030 |
20.3 |
22.5 |
7.4 |
5.8 |
6.8 |
2.5 |
2.2 |
60.0 |
|
2031 |
20.5 |
22.7 |
7.6 |
5.8 |
6.8 |
2.5 |
2.2 |
60.0 |
|
2032 |
20.5 |
22.8 |
7.7 |
5.8 |
6.8 |
2.5 |
2.3 |
60.0 |
|
2033 |
20.6 |
22.8 |
7.7 |
5.7 |
6.8 |
2.5 |
2.3 |
60.0 |
|
2034 |
20.8 |
23.0 |
8.0 |
5.7 |
6.8 |
2.5 |
2.2 |
60.0 |
|
2035 |
20.7 |
23.1 |
8.0 |
5.7 |
6.8 |
2.5 |
2.3 |
60.0 |
|
aMedicare and Medicaid. bSocial Security. cDefense and domestic, total. |
||||||||
TABLE F-16 Revenues and Outlays Under a 10-Year Delay of the Low Scenario, as Percentages of GDP
|
Selected Years |
Revenues |
Outlays |
M and Ma |
Soc Secb |
Def and Domc |
Interest |
Deficit |
Debt |
|
2012 |
17.9 |
22.2 |
4.9 |
4.7 |
10.8 |
1.7 |
4.3 |
66.4 |
|
2013 |
18.1 |
22.2 |
5.1 |
4.7 |
10.2 |
2.1 |
4.0 |
67.6 |
|
2014 |
18.1 |
22.2 |
5.3 |
4.8 |
9.6 |
2.5 |
4.1 |
69.0 |
|
2015 |
18.3 |
22.3 |
5.4 |
4.8 |
9.3 |
2.8 |
4.0 |
70.4 |
|
2016 |
18.3 |
22.6 |
5.6 |
4.9 |
9.1 |
3.0 |
4.3 |
72.1 |
|
2017 |
18.3 |
22.7 |
5.7 |
5.0 |
8.9 |
3.1 |
4.3 |
73.8 |
|
2018 |
18.3 |
22.8 |
5.7 |
5.1 |
8.7 |
3.4 |
4.5 |
73.8 |
|
2019 |
18.3 |
23.4 |
6.1 |
5.2 |
8.6 |
3.6 |
5.1 |
76.1 |
|
2020 |
18.3 |
23.8 |
6.4 |
5.3 |
8.5 |
3.6 |
5.5 |
78.8 |
|
2021 |
18.4 |
24.1 |
6.6 |
5.4 |
8.5 |
3.7 |
5.7 |
81.7 |
|
2022 |
20.7 |
23.8 |
6.6 |
5.4 |
8.3 |
3.6 |
3.2 |
81.8 |
|
2023 |
22.4 |
23.7 |
6.8 |
5.5 |
8.0 |
3.5 |
1.3 |
79.9 |
|
2024 |
22.7 |
23.5 |
6.9 |
5.4 |
7.8 |
3.4 |
0.8 |
77.8 |
|
2025 |
22.6 |
23.0 |
6.8 |
5.5 |
7.6 |
3.2 |
0.4 |
75.4 |
|
2026 |
22.5 |
22.9 |
7.0 |
5.5 |
7.3 |
3.1 |
0.5 |
73.0 |
|
2027 |
22.4 |
22.7 |
7.1 |
5.5 |
7.1 |
3.0 |
0.3 |
70.7 |
|
2028 |
22.0 |
22.6 |
7.2 |
5.5 |
6.9 |
2.9 |
0.6 |
68.7 |
|
2029 |
22.1 |
22.5 |
7.4 |
5.6 |
6.8 |
2.8 |
0.4 |
66.5 |
|
2030 |
22.0 |
22.5 |
7.3 |
5.6 |
6.8 |
2.8 |
0.5 |
64.6 |
|
2031 |
22.4 |
22.5 |
7.5 |
5.6 |
6.8 |
2.7 |
0.1 |
62.3 |
|
2032 |
22.4 |
22.5 |
7.5 |
5.6 |
6.8 |
2.6 |
0.0 |
60.0 |
|
2033 |
20.2 |
22.4 |
7.5 |
5.6 |
6.8 |
2.5 |
2.3 |
60.0 |
|
2034 |
20.4 |
22.6 |
7.7 |
5.6 |
6.8 |
2.5 |
2.2 |
60.0 |
|
2035 |
20.2 |
22.6 |
7.7 |
5.5 |
6.8 |
2.5 |
2.3 |
60.0 |
|
aMedicare and Medicaid. bSocial Security. cDefense and domestic, total. |
||||||||
TABLE F-17 Projected Social Security Cash Flow as Percentages of GDP: Current Law Compared with Four Committee Scenarios
TABLE F-18 Projected Social Security Trust Fund Ratios: Current Law Compared with Four Committee Scenarios
|
Current Law and Four Scenarios |
2020 |
2035 |
2050 |
2084 |
|
Current Law |
315 |
50 |
0 |
0 |
|
Low (Option 1) |
351 |
202 |
100 |
114 |
|
Delayed 5 yrs |
322 |
136 |
0 |
0 |
|
Delayed 10 yrs |
315 |
107 |
0 |
0 |
|
Intermediate-1 (Option 2) |
334 |
178 |
113 |
157 |
|
Delayed 5 yrs |
320 |
126 |
0 |
0 |
|
Delayed 10 yrs |
315 |
91 |
0 |
0 |
|
Intermediate-2 (Option 3) |
353 |
227 |
151 |
135 |
|
Delayed 5 yrs |
327 |
164 |
47 |
0 |
|
Delayed 10 yrs |
315 |
118 |
0 |
0 |
|
High (Option 4) |
359 |
229 |
131 |
100 |
|
Delayed 5 yrs |
329 |
172 |
42 |
0 |
|
Delayed 10 yrs |
315 |
121 |
0 |
0 |
NOTES
|
|
1. As an accounting concept, OMF provides the exact relationship between the annual deficit and change in the end-of-year debt. It is unusually large and positive in 2008-2009, thus increasing the change in the debt above the deficit. The 2008-2009 OMF figures are largely swelled by financing for repayable advances to financial institutions, made to help stabilize financial markets, such as in the Troubled Asset Relief Program (TARP). As TARP payments are repaid, they appear in the OMF accounting as negative entries, thus reducing federal borrowing needs, as well as reducing increases in the debt. CBO projects that many TARP advances will be repaid in 2010-2013 and all of them by 2018, especially in the single years 2011, 2013, and 2018. In 2019, CBO projects OMF to be $18 billion, roughly the same order of magnitude as has occurred for most recent years. |
|
|
2. Appendix C explains the indicators of program solvency. Because Tables F-17 and F-18 are to be compared with Tables C-1 and C-2 for the “on-time” scenarios, the same conventions and assumptions apply. Specifically, all four tables rely on assumptions of the 2009 Social Security Trustees’ Report, rather than the CBO-based study assumptions that are applied in the report other than Chapter 6 and Appendix C. |
REFERENCE
Congressional Budget Office. (2009). The Long-Term Budget Outlook. Washington, DC: U.S. Government Printing Office.


