
2
TRICARE Beneficiaries and Mental Health Issues in Military Families
This chapter addresses the characteristics of the TRICARE beneficiary population and the mental health issues that they face. It begins with a brief summary of the demographics of the population and a discussion of their special exposures, risk factors, and protective factors. Information on mental health disorders follows, focusing on the conditions identified in the committee’s statement of task and on psychosocial issues for US military families. The chapter concludes with a presentation of data on patients under the care of counselors.
The intent of the chapter is to provide background information on patients that might be seen by mental health professionals who deliver diagnostic and treatment services to TRICARE beneficiaries.
DEMOGRAPHICS OF THE TRICARE POPULATION
TRICARE submits yearly reports of its operations to Congress that include details on the demographics of its beneficiary population. That information is summarized below.
In 2008, TRICARE served a population of 9.4 million beneficiaries (TRICARE, 2009). The 8.8 million who reside or are stationed in the United States are divided into three regions—North, South, and West—that provide care to roughly equal proportions of that population (HealthNet Federal Services, 2009; Humana Military Healthcare
Services, 2009; TriWest, 2009). The remaining beneficiaries—about 0.6 million—are covered in overseas regions.
Only about 20% of beneficiaries are active-duty members of the armed forces or activated members of the National Guard or Reserves; 26% are family members (including children) of active-duty or activated personnel, and 54% are retirees and their families (TRICARE, 2009). Almost half the beneficiaries are female (48.5%). Figure 2.1 shows the beneficiary population’s age diversity.
Appendix B contains additional demographic and socioeconomic information about the general military population (including families) and the Operation Iraqi Freedom (OIF) and Operation Enduring Freedom (OEF) warfighters. The data there are intended to provide more background on the similarities and differences between the TRICARE population and other managed–health-care populations.
SPECIAL EXPOSURES AND RISK FACTORS IN THE TRICARE POPULATION
Military life presents a number of exposures and risk factors that may influence the likelihood of experiencing a mental health problem. Different factors affect different segments of the beneficiary population. They are discussed below to highlight some of the issues that must be considered in evaluating the readiness of practitioners to provide diagnoses to and treat the population.
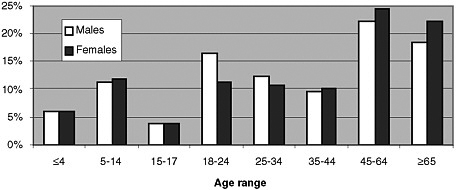
FIGURE 2.1 Age distribution of the TRICARE beneficiary population.
NOTE: Percentages shown are percentages for each sex, not the whole beneficiary population.
SOURCE: TRICARE (2009).
Combat Exposure and Traumatic Stressors
Combat exposure is one of the greatest stressors that a person can experience. In theater, combat veterans report frequent encounters with roadside improvised explosive devices (IEDs), suicide bombers, snipers, and an omnipresent insurgence characterized by an inability to differentiate combatants from noncombatants. Patrol operations may entail attacking, being attacked, killing, and witnessing mutilations and other carnage. OIF and OEF troops report distress over ethical violations to be a central problem (MHAT, 2006). Although most soldiers and marines reported receiving adequate battlefield-ethics training, over one-fourth reported encountering situations in which they did not know how to respond (MHAT, 2006). Feelings of helplessness and guilt may fuel the experience of emotional turmoil and depression. Multiple deployments, longer deployments, and the constancy of a 24/7 threatening living environment characterize tours of duty. A state of anxiety interferes with sleep (a major protective factor in survival) and erodes resilience.
A sample of service members who had been deployed to OIF or OEF reported exposure to a wide array of traumatic events; 50% noted that they had a friend who was killed or seriously wounded, and 45% saw people who were dead or seriously wounded (Tanielian and Jaycox, 2008). In a study conducted by Hoge et al. (2004), 2,586 Army and 815 Marine Corps combat infantry troops were interviewed and completed postdeployment surveys. During their tours of duty in Iraq, 92% were attacked or ambushed; 95% received small arms fire; 94% saw dead bodies or human remains; 89% received artillery, rocket, or mortar fire; 86% knew someone who was killed or seriously injured; and 56% reported being responsible for the death of an enemy combatant.
Research indicates that TRICARE may experience a relatively high volume of OIF and OEF veterans seeking treatment for posttraumatic stress disorder (PTSD) in the coming years. A team of researchers with the San Francisco Department of Veterans Affairs (VA) Medical Center discovered a time lag in reporting of mental health problems among OIF and OEF veterans—up to 2 years postservice (Seal et al., 2009). The data point to a need for providers, not only in the VA system but in TRICARE, to be prepared for waves of OIF and OEF veterans and their family members seeking mental health and psychosocial services. Research findings generated by Charles Hoge and his team at the Walter Reed Army Medical Center Research Center suggest that spouses
manifest rates of mental health problems similar to those in soldiers; TRICARE probably also needs to be prepared to respond to mental health issues presented by family members (Eaton et al., 2008).
Active-duty servicewomen face some unique experiences during their deployments. They participate in a wide array of duties and have experienced comparable exposure to combat (IOM, 2008). Female service members face issues related specifically to physical violence, sexual harassment, and assault. Over the last 2 decades, there has been increasing attention to violence and sexist harassment against female service members. The emphasis on strong masculine traits, the war culture, the devaluing of feminine traits, and sexual slurs increase the risk of victimization of women (Donohoe, 2005). In a convenience sample of 270 female veterans, 33% reported experiencing a sexual assault during their service in the military (Surís et al., 2004). Women who reported rape or dual victimization (both rape and other forms of violence) were more likely also to report chronic health problems, prescription drug use for emotional problems, failure to complete college, and annual income less than $25,000. Women who reported dual traumas also reported the most severe impairment (Sadler et al., 2000). In a more recent study conducted by Street et al. (2008), the coinvestigators discovered a high prevalence of sexual harassment and assault and rates higher among female service members. Such victimization was associated with not only more immediate physical and mental health effects but long-term health-care needs. Higher rates of PTSD in women are statistically associated with increasing rates of military sexual assault. In a meta-analysis of 21 papers, Goldzweig et al. (2006) reported rates of sexual harassment of 55–99% and rates of sexual assault of 4.2–7.3% in active-duty women compared with 11–48% in female veterans. The noteworthy disparity in reported rates can be partially explained by victimized active-duty soldiers’ fear of retaliation, especially if the offenders were superior officers or if allegations had been countered with censure.
Issues for Military Families and Retirees
Demographic data compiled by the Department of Defense (DOD, 2007a) show that 57.7% of active-duty service members have family responsibilities; that is, they have spouses, one or more children, or other
dependents. The demographic profile of Reserve and National Guard families is similar.
As in society at large, the health of a military family is influenced by the health of the service member, and the health and productivity of the service member are integrally related to and enhanced by the health and welfare of the family. Military occupation and duties involve a variety of stressors. They include a mobile lifestyle, isolation from the civilian community and extended family, adjustment to the rules and regulations of military life, and frequent family separations due to frequent deployments. In addition, stressors for female spouses are complicated by worries about jobs, child rearing, and household duties while male service members are deployed. Along similar lines, the male partner of a deployed female service member may encounter difficulties in adjusting to new roles in caretaking and management of the home. For single mothers, added stress is related to the enlisting of family members, friends, or hired child-care workers to provide care for their children during deployment. In general, if the nondeployed civilian partner of a service member finds military life stressful or unsatisfactory, the service member also becomes dissatisfied and more likely to leave the military (Eaton et al., 2008). Eaton and colleagues found, in their study of 940 spouses of service members deployed to Iraq or Afghanistan, that spouses reported types and magnitudes of mental health problems similar to those of the service members and that spouses were more likely to seek mental health services for those problems. Spouses did not seem to be as concerned about the stigma of mental health care as service members. Spouses most often sought and received care from their primary-care physicians; this may be related to the lack of mental health services for spouses on military installations. A DOD Task Force on Mental Health report indicated that mental health services for spouses are not adequately provided through the TRICARE insurance network (DOD, 2007b).
Much attention has been given to the needs of service members and spouses, but many military families are concerned about having adequate mental health resources for their children, especially school-age and adolescent youth. Parental concerns expressed, in addition to facilitating typical childhood development, include parenting skills to manage frequent deployments, reintegration and reentry programs when the service member returns to the family, addressing anxiety and fears experienced by children with regard to the deployed parent, managing multiple moves, and bereavement support (National Military Family Association, 2006).
Retirees make up a substantial portion of the TRICARE beneficiary population. Many of them are also veterans. Among the veterans seeking care, depression is one of the most common chronic conditions treated in VA Medical Centers (Cully et al., 2008). That may be the result of untreated mental health conditions incurred during military service or independent of military service. Retirees may be coping with the loss of a spouse or managing chronic or long-term illness other than mental health problems. Other studies have shown that veterans have higher rates of alcohol misuse, which is often associated with depression (IOM, 2008).
Risk Factors
The greatest risk factors for mental health problems during deployment include higher intensity of exposure to combat stressors; greater length of deployment; female sex; lower socioeconomic status; lower rank; absence of peer, social, and family supports; and a history of childhood trauma1 (IOM, 2008).
One major risk factor associated with the onset of PTSD is physical injury. In a study of returning OIF veterans conducted by Hoge et al. (2007), those who were physically injured had 3 times as great a risk of developing PTSD, regardless of the severity of the injury, as the noninjured. The incidence of PTSD increases significantly with the number of injuries suffered.
Rates of PTSD and major depression were highest among Army soldiers, Marines, and those who were no longer on active duty (people in the Reserves and those discharged or retired from the military). Women, Hispanics, and enlisted personnel were more likely to report symptoms of PTSD and major depression; the best predictor of these conditions was exposure to combat (Tanielian and Jaycox, 2008).
Protective Factors
Many service members arrive home fortified by their resilience and reintegrate into their communities without adverse mental health effects. Pride and a sense of accomplishment often prevail. In consid-
ering resilience, it is important to recognize the important influences of protective factors that mediate the effects of adverse events. First, constitutional hardiness often refers to the “healthy-soldier effect” based on physical fitness and psychological readiness to assume an assertive, active, coping style. Second, during all phases of the deployment cycle, service members who have experienced the most comprehensive training, strong leadership, unit cohesion, and an esprit de corps are buffered against adverse health effects. In reservists and members of the National Guard, in particular, navigating assignments to a new unit and establishing new connections may undermine resilience. Third, a validating and supportive homecoming is also important. Research points to the centrality of family and social supports as major protective factors (Friedman, 2006). The social supports include loved ones; immediate-family and extended-family members; work colleagues; members of a church, mosque, or temple; support networks for military partners and families; and a wide array of health-care and mental health–care providers. Such positive social supports serve as vital buffers against the emergence of mental health problems.
“Signature” Mental Health and Psychosocial Issues
Unlike Vietnam-era veterans, for whom PTSD was the prominent adverse mental health outcome, veterans of recent conflicts report high rates of various distinct yet interrelated syndromes, including PTSD, depression with suicidal ideation and behavior, substance misuse and abuse, and traumatic brain injury (TBI). Milliken and colleagues (2009) found that when service members who had returned from Iraq were rescreened about 6 months after an initial assessment, they reported more adverse mental health concerns and were referred for care at significantly higher rates; this suggests that some problems take time to manifest after deployment.
A 2008 Institute of Medicine (IOM) report focused on the physiological, psychological, and psychosocial effects of deployment-related stress. Findings revealed “sufficient evidence” of a positive association between deployment to a war zone and a number of specific health outcomes in studies in which chance and bias, including confounding, could be ruled out with reasonable confidence. The outcomes included psychiatric disorders, including PTSD, other anxiety disorders and depression; alcohol abuse; accidental death in the years after deployment;
suicide in the early years after deployment; and heightened marital and family conflict, such as intimate-partner violence (IOM, 2008).
Thus, military personnel returning from deployment in Iraq and Afghanistan—a part of the TRICARE beneficiary population that may have high demand for services—may present with a complex array of mental health and substance-use problems and psychosocial difficulties. Because many syndromes involve symptoms that mirror other mental and physical health diagnoses, advanced skills in differential clinical diagnosis are required to work with this client population.
Box 2.1 contains a fictitious vignette2 featuring a returning OIF veteran viewed in the context of his partnership, family, and social environment. The diagnosis and course of treatment presented are intended to highlight the complexity and acuteness of the physical, psychological, and psychosocial issues confronted by clinicians who deliver services through TRICARE. This case is delineated in greater detail in Appendix F.
MENTAL HEALTH CONDITIONS IDENTIFIED FOR ATTENTION BY THE TRICARE MANAGEMENT ACTIVITY
The committee’s statement of task—spelled out in Chapter 1—lists several health outcomes that were identified for special attention by the TRICARE Management Activity. The sections below provide background information on them and briefly summarize their signs and symptoms, incidence, and recognized treatments. They are intended to provide context for understanding issues related to the diagnosis of and treatment for disorders that may be found in the TRICARE beneficiary population. In reviewing this text, it is important to consider that these conditions can co-occur in a person and make treatment needs complex.
More complete descriptions of the diagnostic criteria and etiology of these conditions are contained in the Diagnostic and Statistical Manual of Mental Disorders (DSM). A table in Chapter 5 (Table 5.3) lists examples of evidence-based psychosocial interventions for many of these disorders.
|
BOX 2.1 Case Vignette—Sergeant Arrozo Kathryn Basham, PhD, LICSW (Member of the Committee) Sergeant Carlos Arrozo, a 30-year-old Army OIF veteran of Puerto Rican descent, returned home after a 12-month tour of duty with second- and third-degree burns to his arms and face and a broken pelvis as a result of an IED blast. After his homecoming, he reunited with his 29-year-old wife of 10 years and his three young children, all under the age of 10 years. Although the reunion brought great relief and pride to the family, within 6 weeks Sgt. Arrozo started to experience pervasive anxiety, insomnia, and nightmares. Flashbacks of horrific combat experiences of violent actions were often triggered by smells of burning rubber, sights of men and women cloaked in heavily layered garments, sounds of cars backfiring, and visions of a vast expanse of sand blowing on the beach. Such events stimulated an intense traumatic stress response that activated arousal that alternated with numbness and detachment; this was consistent with posttraumatic stress and/or PTSD. Sgt. Arrozo’s affect was totally dysregulated. When his wife, Maria, and children experienced terror during these episodes, they would retreat to safety as quickly as possible by hiding in distant rooms throughout the house or garage. Fighting ensued between the marital partners, with Sgt. Arrozo yelling at his children when they failed to follow his directives quickly enough. He sought refuge by drinking eight beers four or five times each week with his buddies and did not view this level of alcohol intake as a problem. His home environment was characterized by fear, uncertainty, and detachment combined with pervasive anxiety in everyone involved. After receiving a medical discharge based on his physical injuries, PTSD, and depression, Sgt. Arrozo felt plagued by the impending threat of divorce, joblessness, and obsessional thoughts related to his “accidental killing” of a young child during combat. Sadness and unrelenting guilt overwhelmed him as he battled traumatic grief and depression, and they reactivated unresolved mourning surrounding his mother’s death from cancer when he was 8 years old. In his words, Sgt. Arrozo felt “tense, |
|
distractible, agitated, irritable, enraged and numb” most of the time. Those symptoms not only are compatible with a diagnosis of PTSD but suggested syndromes of depression, substance abuse, or TBI. For example, sleeping poorly and suffering nightmares and headaches and then grogginess in the morning may be related to PTSD, or they could be related to depression, substance abuse, or TBI. The differential diagnosis of Sgt. Arrozo’s distress leads to a complex nexus of PTSD, depression, TBI, substance abuse, and family conflict. When Sgt. Arrozo agreed to seek mental health assistance, his wife telephoned to get access to a mental health provider authorized by TRICARE. After receiving the name of a nonmedical licensed mental health clinician, Sgt. Arrozo was invited to attend an individual session to embark on an assessment. After a 1-hour meeting, a preliminary diagnosis of PTSD and depression was established on the basis of a patient self-report. To help Sgt. Arrozo to find rapid relief from his combat-related psychological injuries, the clinician referred him to a colleague for prolonged exposure therapy and recommended meeting for 1 hour each week to address his symptoms of depression. The latter treatment plan included psychoeducation related to PTSD and depression and the use of cognitive-behavioral skills to track his depressed mood through journaling. Sgt. Arrozo could not concentrate on his daily writing assignments and felt ashamed of his incapacity to improve. After 3 weeks of the combined treatment plan, flooding of emotions from the exposure therapy overwhelmed him, and he decompensated, reporting many suicidal thoughts. He terminated the therapy. |
Major Depressive Disorder
Major depressive episodes are characterized by symptoms (Table 2.1) that are persistent and interfere with a person’s daily living, functioning, and interactions with others (NIMH, 2009b). The episodes are not the result of normal bereavement due, for example, to the death of a loved one. Major depressive disorder (also known as major depression) is diagnosed when a person experiences one or more major depressive episodes
|
Was Sgt. Arrozo a failure, or were there unintended iatrogenic effects that were based on the absence of a thorough biopsychosocial assessment and differential diagnosis? Did the clinician fail to attend to the totality of this veteran’s struggles and to explore areas in his social context (a faith-based community or cultural traditions, for example)? Were Sgt. Arrozo’s competences, resilience at work and school, and military leadership skills explored and affirmed? Apparently, his undiagnosed mild TBI interfered with his benefiting from a cognitive-behavioral method that requires reasonably sound functioning. Finally, the absence of attunement to the volatile relationship between the marital partners and between the parents and children set the stage for increasing decompensation and further destabilization. Was a risk assessment completed to determine the safety or lack of safety in this home? Are there aspects of intimate-partner violence that are concealed? Are the children expressing symptoms of secondary trauma evidenced by heightened insecurity? The treatment provided to Sgt. Arrozo and his family revealed various problems. They included an incomplete biopsychosocial assessment, inattention to safety risks, an inadequate treatment plan, the absence of collaboration with other providers, and lack of attunement to sociocultural influences. The complexity of the issues facing Sgt. Arrozo and his family requires strong clinical expertise that would permit a complex and detailed biopsychosocial assessment, including structured clinical interviews; the use of standardized clinical measures; and collaboration with other health professionals followed by a phase-oriented, relational, culturally responsive, and evidence-based practice plan. A complete case summary of Sgt. Arrozo and his family is available in Appendix F. |
with no history of manic symptoms. It is often an episodic illness, but persons with major depression can also experience chronic depressive symptoms (Judd et al., 1998).
The lifetime prevalence of major depression in the United States is nearly 17% (Kessler et al., 2005). In a study by Lapierre et al. (2007) of Iraq and Afghanistan war veterans, 37 and 38%, respectively, reported symptoms of depression. Hoge et al. (2004) found that 7.1–7.9% of troops returning from Iraq met criteria for depression and were
TABLE 2.1 Criteria for Diagnosing Major Depressive Episodes
functionally impaired because of depressive symptoms, compared with 5.3% of troops who were about to be deployed.3 Compounding the problem of depression in military veterans is the high prevalence of PTSD in this population. Campbell et al. (2007) report a study in which 36% of depressed patients in 10 VA primary-care practices screened positive for PTSD; these patients experienced more severe depressive symptoms, reported greater levels of anxiety and suicidal ideation, and were more likely to suffer a panic attack than patients who had depression without PTSD.
Because more soldiers now survive blasts that would previously have been fatal, TBI has become a serious concern for the military (Warden, 2006). Depression has been reported to follow TBI in 10–77% of cases (Alderfer et al., 2005).
The psychological effects of war are not limited to veterans themselves. Partners of veterans who have chronic PTSD have reported high levels of depression symptoms; 15% indicated recent suicidal ideation in one small study (Manguno-Mire et al., 2007).
The VA/DOD (2009b) clinical practice guideline for major depressive disorder notes that co-occurring bipolar disorder, PTSD, substance-use disorder (SUD), suicidality/homicidality, and psychosis may complicate treatment or put the patient at increased risk for adverse outcomes. It also lists a number of pathobiologies associated with depression, including cardiovascular diseases, chronic pain syndromes, degenerative diseases, immune disorders, metabolic and endocrine conditions, neoplasms, and traumas such as TBI, amputation, and burn injuries. The guideline indicates that “[s]imultaneous treatment is often required for both the medical problem and psychiatric symptoms and can lead to overall improvement in function.”
Schizophrenia
Schizophrenia is a chronic illness in which patients experience episodes of psychosis (delusions or hallucinations) or disordered thought processes (Table 2.2). They often experience chronic negative symptoms characterized by a “flattening” of normal emotions or behavior. For example, a patient may exhibit an abnormally flat affect by speaking in a monotone or making few facial expressions. A person with schizophrenia may also demonstrate avolition, an inability to initiate and complete tasks, or alogia, a paucity of speech (APA, 2000; Moore and Jefferson, 2004e).
TABLE 2.2 Summary of Major Diagnostic Criteria for Schizophreniaa
The lifetime prevalence of schizophrenia in the general population is estimated at 0.2% (Kendler et al., 1996). The epidemiology of schizophrenia is different, however, in the military because current or past psychotic disorders disqualify applicants (NRC, 2006). In service members who develop schizophrenia, the average age at onset is later than that in the general population (Niebuhr et al., 2008).
Posttraumatic Stress Disorder
Many people who have experienced a catastrophic event involving possible or actual injury, destruction, or death can be distressed, be fearful, or feel helpless. However, most people will recover from the experience. In cases of PTSD, recovery is incomplete. Patients exhibit symptoms that fall into three general categories: re-experiencing, avoidance, and hyperarousal (Table 2.3). Flashbacks and vivid nightmares of the traumatic experience are classic examples of re-experiencing symptoms. Re-experiencing symptoms may also be accompanied by panic attacks. Avoidance symptoms are characterized by the patient’s taking steps to avoid stimuli that remind him or her of the original trauma. The stimuli might include conversations about the trauma and particular activities or locations. Examples of hyperarousal symptoms are difficulty in sleeping, irritability, and being easily startled. The Diagnostic and Statistical Manual of Mental Disorders, Fourth Edition, Text Revision (DSM-IV-TR) code for PTSD is 309.81 (APA, 2000).
In the general population, the lifetime prevalence of PTSD is nearly 7% (Kessler et al., 2005). Hoge et al. (2004) found symptoms of PTSD
TABLE 2.3 General Diagnostic Criteria for PTSDa
in 18% and 19.9% of survey respondents in two combat units returning from Iraq; members of the two units were over twice as likely to meet criteria for PTSD and to be functionally impaired by the symptoms as were survey participants in a predeployment unit (12.9% and 12.2% versus 5%). Co-occurrence of major depression and PTSD is common and requires more complex treatment (Campbell et al., 2007). A service member’s PTSD can affect home and family dynamics; evidence suggests that the angry outbursts and emotional withdrawal associated with PTSD are the most damaging to family relationships (Galovski and Lyons, 2004). Family members are also at risk for PTSD themselves even though they did not directly experience the traumatic events. There have been cases in which children experienced many of the same PTSD symptoms as their Vietnam-veteran parents (Rosenheck and Nathan, 1985). In a small study of female spouses of returning Utah Army National Guard troops, 10.4% met the diagnostic criteria for PTSD (Renshaw et al., 2008).
There is abundant scientific evidence that PTSD can develop at any time after exposure to a traumatic stressor, including cases in which there is a long interval between the stressor and the recognition of symptoms. Some of the cases involve the initial onset of symptoms after many years of symptom-free life; others involve the manifestation of florid symptoms in persons with previously undiagnosed subclinical or subsyndromal PTSD (IOM, 2007).
The overlap of TBI and PTSD symptoms makes it challenging to differentiate the two conditions. Both diseases can cause irritability, difficulty in sleeping, and impairment of concentration. In general, the distinction is made by observing other symptoms: TBI tends to cause headaches, balance and visual disturbances, and hearing loss, whereas PTSD symptoms generally are restricted to the three categories mentioned above. But mild TBI can be particularly difficult to distinguish from PTSD (Labutta, 2009).
VA/DOD’s (2004) clinical practice guideline lists a number of potential differential diagnoses or comorbidities associated with PTSD including dementia, depression, substance abuse/withdrawal, bereavement, psychosis, bipolar disease, seizure disorder, thyroid disease, neoplasms, somatization disorder, anxiety disorder, toxicosis, rheumatoid-collagen vascular disease, hypoxia, sleep apnea, closed-head injury, congestive heart failure, and delirium. It recommends that the existence
of co-occurring disorders be considered when deciding whether to treat a patient in a primary care versus a specialty mental health care setting.
Bipolar Disorder
Persons with bipolar disorder experience increased mood symptoms that are characterized as manic, hypomanic, or mixed (Tables 2.4–2.6). Manic episodes can include psychotic symptoms, such as hallucinations or delusions. Persons with bipolar disorder typically also experience periods of significant depression (Goodwin and Jamison, 2007).
The lifetime prevalence of bipolar I and II disorder in the general population is estimated to be nearly 4% (Kessler et al., 2005). Current bipolar disorder disqualifies someone for enlistment in the US military (NRC, 2006), but it is important to remember that bipolar disorder, although often episodic, is a chronic condition that requires continuing maintenance treatment.
Mental Disorders Due to a General Medical Condition
Some general medical conditions can cause psychiatric symptoms or conditions. All those conditions share three diagnostic criteria (Table 2.7), the most prominent of which is a physical examination, history, or laboratory evidence pointing to a physiological cause. Examples
TABLE 2.4 Major Diagnostic Criteria for a Manic Episode
|
1. At least three of the following: |
|
a. Inflated self-esteem or grandiosity |
|
b. Decreased need for sleep |
|
c. Increased talkativeness |
|
d. Feeling of racing thoughts |
|
e. Distractibility |
|
f. Increase in goal-directed activity |
|
g. Excessive involvement in potentially harmful activities (such as risky sexual activity, shopping sprees) |
|
2. Symptoms last at least 1 week |
|
3. Mood disturbance causes impairment of personal or social functioning or requires hospitalization |
|
SOURCE: Adapted and abbreviated from APA (2000). |
TABLE 2.5 Major Diagnostic Criteria for a Mixed Episode
|
1. Criteria for both manic and major depressive episodes, except the duration criterion, are met nearly every day for 1 week |
|
2. Social and occupational disruption results from the symptoms |
|
SOURCE: Adapted and abbreviated from APA (2000). |
TABLE 2.6 Major Diagnostic Criteria for a Hypomanic Episode
|
1. A period of at least 4 days during which the patient’s mood is persistently elevated, expansive, or irritable |
|
2. At least three of the symptoms of a manic episode (four if the mood is only irritable) |
|
3. Mood must be clearly different from the person’s nonsymptomatic state |
|
4. Mood change is observable by others |
|
5. Episode is not severe enough to require hospitalization or impair social or occupational function |
|
SOURCE: Adapted and abbreviated from APA (2000). |
TABLE 2.7 Common Diagnostic Criteria for All Mental Disorders Due to a General Medical Condition
|
1. History, physical examination, or laboratory evidence suggests a physiological cause |
|
2. Another mental disorder does not account for the symptoms better |
|
3. Symptoms are not restricted to periods of delirium |
|
SOURCE: Adapted and abbreviated from APA (2000). |
of possible physiologic causes are vitamin B12 deficiency, heavy-metal poisoning, multiple sclerosis, and AIDS (Moore and Jefferson, 2004d). Biological causes should be distinguished from emotional triggers (Moore and Jefferson, 2004f ). A patient might, for example, experience major depression after a heart attack when young. Unless a physiological link can be established between the heart damage and the depression, major depression is the appropriate diagnosis.
Treatment for a mental disorder that results from a general medical condition rests on resolving the underlying physical problem. In some cases, such as in hypoglycemia that results in delirium, the mental symptoms are easily resolved. In others, such as a stroke, complete reversal of the symptoms may not be achieved (Moore and Jefferson, 2004b).
Somatoform Disorders
Somatoform disorders are manifested by physical symptoms that cannot be explained by the presence of a general medical condition. The symptoms may occur in the absence of any medical condition, or they may be in excess of what an existing medical condition would be expected to cause. Diagnostic criteria for two somatoform disorders—somatization disorder and pain disorder—are listed in Tables 2.8 and 2.9. The major distinction between somatoform disorders and such other conditions as malingering or factitious disorder is that the physical symptoms are not voluntarily created by a patient with a somatoform disorder (APA, 2000; Jacobson, 2001).
Estimates of the prevalence of somatoform disorder in primary-care populations range from 16% to 30% (De Waal et al., 2004; Fink et al., 1999). McCarroll et al. (2002) demonstrated an increase in somatic symptoms in mortuary workers during the Persian Gulf War. The subjects who had close contact with dead bodies (either by handling or by proximity to large numbers of bodies) at the Dover mortuary reported approximately twofold increases in scores on the Brief Symptom Inventory self-assessment of somatic symptoms. In another study of combat deployment, troops who had combat experience reported more severe somatic symptoms than troops who lacked combat experience; this
TABLE 2.8 Major Diagnostic Criteria for Somatization Disorder (DSM-IV-TR code 300.81)
|
1. History of persistent physical complaints beginning before the age of 30 years; They result in treatment or substantial functional impairment |
|
2. All the following must have been met at any point during the illness: |
|
a. Four pain symptoms |
|
b. Two gastrointestinal symptoms (not pain-related) |
|
c. One sexual symptom (not pain-related) |
|
d. One pseudoneurological symptom (not pain-related) |
|
3. Either of the following: |
|
a. The symptoms above occur in the absence of a general medical condition or substance-related cause |
|
b. The symptoms above are in excess of what history and physical and laboratory findings would suggest |
|
4. Symptoms are not intentionally produced or feigned |
|
SOURCE: Adapted and abbreviated from APA (2000). |
TABLE 2.9 Major Diagnostic Criteria for Pain Disorder (DSM-IV-TR code 307.80)
|
1. Pain severe enough to justify clinical attention is the focus of the clinical visit |
|
2. Pain causes substantial impairment in daily functioning |
|
3. Onset, severity, exacerbation, or maintenance of pain has a substantial psychological component |
|
4. Symptoms are not intentionally produced or feigned |
|
5. Mood, anxiety, or psychotic disorders do not account for the pain better, nor does the pain satisfy the criteria for dyspareunia |
|
SOURCE: Adapted and abbreviated from APA (2000). |
relationship held even though the rates of PTSD in the two groups did not differ (Killgore et al., 2006).
In the general population, PTSD has been linked with more severe abridged somatization, defined by researchers as the presence of at least four somatization symptoms in men or at least six in women. A trend toward linking PTSD with increased risk of abridged somatization was found, but it was not statistically significant (Andreski et al., 1998).
Delirium Associated with Head Trauma
Delirium is a medical emergency in which an underlying physiological condition causes acute or subacute global changes in cognitive functioning (Table 2.10). Patients are confused and have difficulty in focusing. Sleep–wake cycles may be altered, and the patient might be agitated. A hallmark of delirium is that it can “wax and wane” (i.e., a person with delirium can appear confused one moment but cogent later). Possible causes of delirium include extreme hypoglycemia, syphilis, substance abuse or withdrawal, severe body-temperature disturbances (hypothermia or hyperthermia), and brain infarct (Smith and Seirafi, 2006). In contrast with psychiatric conditions that might have similar symptoms, physical examination, patient history, and laboratory findings are suggestive of a physiological disturbance.
Delirium is a possible sequela of TBI. Nakase-Thompson et al. (2004) examined 85 consecutive TBI survivors admitted to a neurore-habilitation hospital. Of those patients, 59 (69%) met the DSM-IV-TR criteria for delirium due to a general medical condition at the time of admission. Not surprisingly, patients who had delirium had worse
TABLE 2.10 Major Diagnostic Criteria for Delirium
|
1. Disturbance in ability to focus and direct attention |
|
2. Change in cognition or development of perceptual disturbance that is not part of dementia |
|
3. Acute onset (hours to days) and fluctuation throughout the day |
|
4. History or physical examination or laboratory findings suggest a disturbance due to |
|
a. A general medical condition (DSM-IV-TR 293.0) |
|
b. Substance intoxication (DSM-IV-TR 291.0 for alcohol, DSM-IV-TR 292.81 for others) |
|
c. Substance withdrawal (DSM-IV-TR 291.0 for alcohol, DSM-IV-TR 292.81 for others) |
|
SOURCE: Adapted and abbreviated from APA (2000). |
scores on the Cognitive Test for Delirium and the Delirium Rating Scale than nondelirious patients. Diagnoses of delirium corresponded with more severe brain injury as measured by the number of contusions on a computed-tomography image. The increased severity of the patients’ injuries was borne out by their worse scores on the Galveston Orientation and Amnesia Test, which measures orientation and memory of events surrounding a TBI, and the Agitated Behavior Scale (ABS), which measures agitation and distractibility of TBI patients. However, when other symptoms of delirium were controlled for, the ABS results became statistically nonsignificant.
Resolution of delirium requires proper diagnosis and treatment of the underlying medical condition. For example, some prescription drugs can impair cognitive function, so attention should be paid to identifying and eliminating or reducing the dosages of these drugs (Rudolph and Marcantonio, 2007). Delirium also must be properly differentiated from psychiatric conditions, such as depression, mania, and schizophrenia (Smith and Seirafi, 2006).
About 10% of patients hospitalized in general medical wards have delirium, although this rate increases to 16–24% in patients over 70 years old. In neurology services, the delirium prevalence increases to 40% (Smith and Seirafi, 2006), which is not surprising given the variety of neurological causes of delirium. No studies of delirium rates in veteran or military populations were found.
Dementia Associated with Head Trauma
It is common for the elderly to experience mild memory loss and to have difficulty in recalling memories while still being able to form new memories. As long as the memory loss does not interfere with daily living, it is considered a normal part of the aging process (Richardson, 2001). Patients with dementia exhibit both short-term and long-term memory impairments and deficiencies in judgment, abstract thinking, and problem-solving skills. Hallucinations and delusions may also be present (Moore and Jefferson, 2004c). Patients commonly experience anxiety as part of the condition. Caretakers can be affected by the patients’ progressive loss of independence (Kraus et al., 2008). Like delirium and amnesia, dementia is probably best characterized as a collection of symptoms caused by an underlying disease. Table 2.11 lists some of the possible causes of dementia. The specific DSM-IV-TR code for dementia depends on the etiology of the condition (APA, 2000).
Dementia is generally a chronic condition, and symptoms may or may not remain stable. There is no known cure for dementia of the Alzheimer type, and the symptoms worsen with time. However, a brain injury that results in dementia may leave symptoms that are relatively unchanging (Moore and Jefferson, 2004c). In some cases (3–29%), dementia may be at least partially reversed—for example, if it is caused by a vitamin deficiency (Reichman and Cummings, 2007).
There is debate about the relationship between TBI and dementia. A report from the Rotterdam Study found no significant correlation between head trauma and the risk of dementia of the Alzheimer type or other dementia (Mehta et al., 1999). But a study (Plassman et al., 2000) of US military veterans who had a confirmed past diagnosis of head trauma found that moderate and severe head injuries led to a higher risk
TABLE 2.11 Examples of Possible Causes of Dementia
|
1. Huntington’s disease |
|
2. Vascular dementias |
|
3. Vitamin B12 deficiency |
|
4. Folic acid deficiency |
|
5. Neurosyphilis |
|
6. Subdural hematoma |
|
SOURCE: Adapted and abbreviated from APA (2000). |
of dementia of Alzheimer type than that in patients who had no history of head injury (odds ratio [OR], 1.04–5.17 for moderate injuries; OR, 1.77–11.47 for severe injuries). Similar results were found when dementia of all types was considered (OR, 1.24–4.58 for moderate injuries; OR, 2.09–9.63 for severe injuries). In neither case did mild head injury lead to significant increases in the risk of dementia of Alzheimer type or other dementia.
A strong relationship is seen between age and dementia prevalence. Harvey et al. (2003) found that, starting at the age of 35 years, dementia prevalence roughly doubles with every 5 additional years of age. Of people 45–65 years old, 0.07–0.12 % have dementia, according to various studies (Harvey et al., 2003; Sampson et al., 2004). Of people over 65 years old, 5–10% have dementia. The prevalence increases to at least 30% in people over 80 years old (Moore and Jefferson, 2004c).
Amnestic Disorders Associated with Head Trauma
Amnesia can be anterograde, characterized by the inability to form new memories, or retrograde, characterized by the inability to recall memories (Table 2.12). It is typically caused by an underlying general medical condition or a substance-related condition that involves a disturbance of the central nervous system. The typical amnesic episode has both anterograde and retrograde features, and episodes may be transient or chronic.
The time course of amnesia depends on the underlying cause. For example, an alcohol-induced blackout would produce transient amnesia, whereas damage to the temporal lobes would be more likely to produce
TABLE 2.12 Major Diagnostic Criteria for Amnesia Due to a General Medical Condition (DSM-IV-TR 294.0)
|
1. An impairment in the ability to form new memories or recall previously acquired information |
|
2. Impairment results in substantial loss of social or work functioning |
|
3. Memory loss is not better accounted for by delirium or dementia |
|
4. History or physical examination or laboratory findings suggest a physiological link to a general medical condition |
|
SOURCE: Adapted and abbreviated from APA (2000). |
chronic amnesia. Treatment for amnesia focuses on resolving the underlying cause (APA, 2000; Moore and Jefferson, 2004a).
For a diagnosis of amnesia, the symptoms must not be better accounted for by delirium or dementia. Delirium, although it includes elements of forgetfulness, also includes such symptoms as confusion and difficulty in focusing. Similarly, dementia features not only memory problems but deficiencies of executive functioning, abstract thinking, and problem solving (APA, 2000).
It has been well reported in the literature that TBI often results in memory loss involving events shortly before and after the injury. However, in considering the amnestic effects of TBI, it is important not to overlook the possible presence of delirium. Stuss et al. (1999) have argued that posttraumatic amnesia is better characterized as a confused state with symptoms akin to delirium. In fact, a review of the relationship between memory and moderate to severe TBI suggests that the memory loss that follows such injuries does not strictly meet the definition of pure amnesia (Vakil, 2005).
Substance-Use Disorders
In the Diagnostic and Statistical Manual of Mental Disorders, SUDs are defined as substance abuse and dependence. A diagnosis of substance abuse (Table 2.13) requires a pattern of substance use that impairs a person’s ability to meet personal, work, or social obligations; creates the risk of physical harm; or causes repeated legal problems. In contrast, substance dependence (Table 2.14) is characterized by an increasing preoccupation with getting, using, or recovering from use of a substance
TABLE 2.13 Major Diagnostic Criteria for Substance Abuse
|
1. A pattern of substance use characterized by one or more of the following in a 12-month period: |
|
a. Recurrent substance use leading to failure to fulfill major work, school, or home obligations |
|
b. Recurrent substance use in situations where it is physically hazardous |
|
c. Recurrent legal problems resulting from substance use |
|
d. Continued substance use despite recurring social disturbances resulting from it |
|
2. Symptoms have never met criteria for substance dependence |
|
SOURCE: Adapted and abbreviated from APA (2000). |
TABLE 2.14 Major Diagnostic Criteria for Substance Dependence
|
A pattern of substance use characterized by three or more of the following in a 12-month period: |
|
1. Tolerance to the substance |
|
2. Withdrawal signs |
|
3. Substance is taken in larger quantities or for longer periods than intended |
|
4. A persistent desire or unsuccessful efforts to reduce substance use |
|
5. Much time is spent on efforts to obtain the substance or to recover from its effects |
|
6. Substance use interferes with major social, occupational, or recreational activities |
|
7. Substance use continues despite knowledge that it is causing or exacerbating a recurrent physical or psychological disturbance |
|
SOURCE: Adapted and abbreviated from APA (2000). |
to the extent that a person experiences impaired functioning and an inability to decrease or discontinue substance use. Tolerance (needing to take increasing amounts of a substance to become intoxicated or a failure of a given amount of the substance to create the same level of intoxication) and the occurrence of withdrawal symptoms on discontinuation of use of a substance can indicate dependence, but they are not necessary for the diagnosis (APA, 2000).
Persons with SUDs are at higher risk for a co-occurring mental illness. The reverse is also true: mental illness is a risk factor for SUD (Kessler, 2004). Patients who have co-occurring SUD and other psychiatric illnesses tend to have a more complicated and chronic course of illness (Greenfield et al., 1998; Kessler, 2004). Treating a person for a co-occurring psychiatric disorder (Cornelius et al., 1997; Greenfield et al., 1998) and remission of its symptoms (Hasin et al., 1996) can improve SUD outcomes. The VA/DOD (2009c) clinical practice guideline for management of SUDs recommends that the management of co-occurring medical and psychiatric conditions be prioritized and singles out cessation treatment for patients with nicotine dependence. The guideline also recommends that patients should be assessed for unmet psychosocial needs or situational stressors, including inadequate housing or homelessness, poor social supports, and problematic family relationships or situations.
The prevalence of SUDs in the general population is nearly 15% (Kessler et al., 2005). Research in military populations shows that combat deployment to Iraq and Afghanistan is associated with increased rates of alcohol misuse. Hoge et al. (2004) found that members of Army
and Marine Corps units returning from deployment were more likely than members of units before deployment to use alcohol more than intended or to experience desires to reduce their drinking.4 SUD has also been linked with PTSD in various studies of veterans’ health. A study by Bremner et al. (1996) of Vietnam veterans found that as their PTSD symptoms worsened, so did their abuse of alcohol and other drugs. Patients who have PTSD experience more hospitalizations than patients who do not; this suggests that comorbid PTSD worsens outcomes of treatment for substance abuse (Brown et al., 1995). Support for that idea comes from Brown and Stout (1997), who reported that in patients who had both alcohol-use disorders and PTSD, remitted PTSD was associated with consumption of fewer drinks. However, they also reported that in patients who had active PTSD, remission of alcoholism was not associated with a difference in PTSD symptoms.
It is generally well recognized that SUD, with resulting motor and decision-making impairment during intoxication, is a risk factor for TBI (Graham and Cardon, 2008). However, relatively little research has been done on substance abuse following TBI. Horner et al. (2005) conducted a study to understand post-TBI alcohol consumption, a clinically relevant concern because excessive drinking after TBI can lead to seizures, further TBI, and less successful rehabilitation. Among their findings was that few patients increased their drinking 1 year after a TBI: 58% drank the same amount, and 36% drank less. Even among study participants who described themselves as moderate or heavy drinkers, almost half said that they drank less than before their TBI. Risk factors for increased alcohol consumption included depression after TBI and a pre-TBI history of substance abuse. TBI severity did not correlate with the quantity of alcohol consumed.
Other Disorders Regularly Associated with Head Trauma
TBI and intracranial hemorrhage are commonly associated with head trauma and can result in behavioral changes or impairment of mental status. Their incidence is not mutually exclusive: hemorrhage
can easily accompany a TBI. Epilepsy, through its association with severe TBI, is also linked to head trauma. TBI commonly accompanies skull fractures, although skull fracture itself does not necessarily lead to behavioral changes.
Traumatic Brain Injury
TBI is typically described as mild, moderate, or severe; the distinctions vary among authors and organizations. Lowenstein (2009) identifies the criteria in Table 2.15 as commonly accepted for the three categories of TBI. Injuries may be open (e.g., from a missile wound to the head) or closed (e.g., from falling and striking the head). In the OIF and OEF conflicts in Iraq and Afghanistan, the classic cause of TBI is blast, which may lead to either open or closed injuries. From January 2003 to April 2006, 28% of the Iraq and Afghanistan combat casualties treated at Walter Reed Army Medical Center had a TBI (Labutta, 2009). One of the most prominent theories of the mechanism of blast-related closed-head injuries suggests that the overpressure and underpressure waves created by an explosion can damage the brain (Jaffee, 2009).
The symptoms of TBI include several that overlap with PTSD, including irritability, difficulty in concentrating, and insomnia. It can therefore be challenging, especially in mild cases of TBI, to differentiate it from PTSD. As a general principle, TBI includes additional physical symptoms, such as headache, vision and balance disturbances, and hearing loss. Such symptoms are not usually associated with PTSD (Labutta, 2009). VA/DOD (2009a) clinical practice guideline lists chronic pain, mood disorders, stress disorder, and personality disorder among the
TABLE 2.15 Common Criteria for Judging the Severity of Traumatic Brain Injury
|
Severity |
Ctiteria |
|
Mild |
Loss of consciousness for under 30 minutes without skull fracture |
|
Moderate |
Loss of consciousness for over 30 minutes and under 24 hours with or without skull fracture |
|
Severe |
Loss of consciousness for over 24 hours with contusion, hematoma, or skull fracture |
|
SOURCE: Lowenstein (2009). |
|
common co-occurring conditions for mild TBI. It also notes that SUDs may exacerbate or maintain the presentation of mild TBI symptoms and must be screened for.
Epilepsy Following Traumatic Brain Injury
Epileptic seizures are alterations in behavior caused by hyperactive neural discharges in the brain. They are time-limited and occur suddenly. The signs and symptoms depend on the kind of seizure. Although the stereotypical seizures involve losing consciousness, collapsing to the ground, and convulsing (generalized tonic–clonic seizures), other seizures might appear as brief inattentiveness (absence seizures) or cause symptoms localized to specific organ systems or regions (partial seizures) (Spencer, 2007). Epileptic seizures can be due to disturbances intrinsic to the brain itself, or they can be provoked by extrinsic factors, such as a fever. Some 10% of people who reach the age of 70 years will have experienced an epileptic seizure. A single epileptic seizure, however, is not generally sufficient to justify a diagnosis of epilepsy. A formal diagnosis of epilepsy requires the occurrence of repeated, unprovoked seizures. Medication can be helpful in reducing the incidence of epileptic seizures (St. Louis and Granner, 2008).
Seizures are not uncommon after a TBI, although, as in the general population, the diagnosis of epilepsy requires recurrent seizures. One approach to characterizing seizures after TBI is to group them temporally. Immediate seizures occur less than 24 hours after the injury, early seizures occur within a week, and late seizures occur more than a week after the injury; it is the occurrence of multiple late seizures that warrants a diagnosis of epilepsy (Lowenstein, 2009). The risk of experiencing an unprovoked seizure is tied to the severity of the TBI. One study reported that the relative risk, compared with that in the general population, of a seizure was 1.5 (95% confidence interval [CI], 1.0–2.2) in patients with mild TBI, 2.9 (95% CI, 1.9–4.1) in patients with moderate TBI, and 17 (95% CI, 12.3–23.6) in patients with severe TBI. Furthermore, in patients with severe TBI, the risk of a first-time unprovoked seizure remained increased for over 10 years after the injury (Annegers et al., 1998). Given the high incidence of severe TBI in returning Iraq and Afghanistan veterans, this population is probably at much higher risk of epilepsy in the years to come.
Intracranial Hemorrhage
There are four types of intracranial hemorrhage, each of which presents in a different manner. As blood leaks from damaged vessels, it forms a hematoma and can clot. Death may result from uncontrolled bleeding or from a clot that becomes too large. An epidural hematoma typically occurs when an artery is damaged and allows blood to leak into the space between the dura mater (the outermost of three membranes surrounding the brain) and the inside of the skull. The brain itself is not usually injured. Symptoms, including loss of consciousness, are typically observed within 2 hours of the initial injury.
Subdural hematomas classically result from leakage of blood from a vein underneath the dura mater. Direct damage to the brain is a common feature. When a subdural hematoma is present with a TBI, the patient is at increased risk for epilepsy (Annegers et al., 1998). Subdural hematomas can also develop insidiously from slow bleeding; in such cases, subtle physical and mental symptoms resulting from the hematoma’s presence may develop over the course of days and may be difficult to notice. Intracranial hemorrhage is the loss of blood directly into the brain and can result in extremely rapid death. Finally, subarachnoid hemorrhage usually results from leakage from small blood vessels into the cerebrospinal fluid that fills the space between the surface of the brain and the arachnoid mater (the innermost membrane surrounding the brain) (Cantu, 2003).
Co-occurring (Polytrauma) Disorders
VA defines polytrauma as “two or more injuries to physical regions or organ systems, one of which may be life threatening, resulting in physical, cognitive, psychological, or psychosocial impairments and functional disability” (Department of Veterans Affairs, 2009). TBI due to blast may be the signature injury in veterans of the wars in Iraq and Afghanistan. Explosions, by their nature, are likely to damage several regions or functional systems of the body and therefore are major causes of polytrauma in the military. In contrast, the most common cause of polytrauma in a civilian setting is automobile accidents (Friedemann-Sánchez et al., 2008).
A chart review (Sayer et al., 2008) of 188 patients admitted to the four VA polytrauma rehabilitation centers (PRCs) found that polytrauma patients injured by blast were more disabled than polytrauma patients
whose injuries were caused by other means. Blast survivors had a greater number of total injuries to their bodies, were more likely to have suffered limb amputation, and had more skin and soft-tissue burns or wounds. They were also more likely than nonblast-polytrauma patients to experience PTSD symptoms (42% versus 24%). Rates of depressive, non-PTSD anxiety, and psychotic symptoms did not differ between the two groups.
The complicated nature of polytrauma patients makes it difficult to create effective treatment plans for them. One PRC staff member recounted, in an interview with researchers (Friedemann-Sánchez et al., 2008), a patient who had attention and memory deficits with PTSD. Ordinarily, the staff member would treat the attention and memory deficits with a stimulant medication, but the PTSD and associated agitation and anxiety made this approach unworkable. Another staff member quoted by the researchers noted that pain can be an important barrier to effective treatment, saying “when you have such tremendous pain you can’t concentrate. How do you put cognition in front of somebody who is in excruciating pain? Then you give them medication, they don’t hurt, but they can’t think.”
To care more effectively for service members who have experienced polytrauma, VA established the Polytrauma System of Care (PSC). It consists of four PRCs to handle acute rehabilitation, 21 polytrauma network sites to provide postacute inpatient and outpatient rehabilitation, and teams of polytrauma specialists at over 70 smaller VA facilities. Contact people are available at VA facilities that lack specialized polytrauma support. The PSC also includes a telehealth network to help to provide follow-up care to veterans in rural or underserved areas and in-theater consultations (Jaffee, 2009). Rehabilitation is an interdisciplinary process, involving specialists in physical medicine and rehabilitation, nursing, social work, physical therapy, rehabilitation psychology, and other fields. Because rehabilitation takes an emotional toll on both patients and families, the interdisciplinary teams consider the needs not only of the patients but of family members (Collins and Kennedy, 2008).
PSYCHOSOCIAL ISSUES IN US MILITARY FAMILIES
In addition to the disorders discussed above, TRICARE beneficiaries are at special risk for some psychosocial problems. These problems are addressed below.
Increased Marital Conflict
Multiple deployments and longer deployments are directly associated with increased mental health problems in service members and increased marital conflict (MHAT, 2006). A 2008 IOM report contains a review of two primary and three secondary studies of Vietnam veterans who had combat-related PTSD; they showed a direct association between combat exposure and an increase in marital conflict that persisted for many years after the war (IOM, 2008). Studies have reported that service members often return with heightened tendencies toward interpersonal conflicts and more interpersonal aggressive ideation, characteristics that increase the potential for marital conflict (Milliken et al., 2009).
Increased Divorce Rates
Couples that experience increased marital and family conflict at any phase of the deployment cycle often move toward separation and divorce. The decision to divorce commonly comes while the service member is deployed, and this adds to the marital and family conflict and the potential for mental health distress. Not only are both partners affected by the stress of marital dissolution but children and extended family are distressed. Families may experience financial difficulties and estrangement from friends and family, which may contribute to adverse effects on mental health.
Increased Intimate-Partner Violence
The literature on the effects of deployment on the perpetration of intimate-partner violence (IPV) by veterans against spouses and partners is extensive. One large primary study conducted in the early 1990s revealed an association between deployment and increased IPV perpetrated by active-duty soldiers (Jordan et al., 1992), and aggression increased with the length of deployment. Campbell and colleagues (2003) report a lifetime IPV prevalence of 30% in a sample of 616 active-duty military women; the prevalence during military service was 21.6%. Three other studies that used data from the National Vietnam Veterans Readjustment Survey (NVVRS) on spouses and partners of Vietnam veterans found an association between combat-related PTSD
and increased IPV. A more recent study conducted by Fonseca et al. (2006) confirmed that lower age, more stress, and alcohol use are important individual predictors, in addition to combat exposure, of IPV. Other studies focused on an association of deployment and an increased incidence of interpersonal violence outside the family.
Recent studies suggest that male service members and unemployed male spouses of service members are also victims of IPV, indicating that male victims suffer long-term effects similar to those in females but may be reluctant to seek care (Bell, 2009; Newby et al., 2003). When there are power shifts or status inconsistencies in the marital relationships, there is an increased risk of IPV.
Newspaper and magazine articles have reported an increase in intimate-partner femicide, the most severe form of IPV, among male service members who returned from Iraq and Afghanistan (Alvarez, 2008; Alvarez and Sontag, 2008). It is speculated that depression, PTSD, and the focus on military combat behaviors—as well as access to weapons—is related to the increased femicide of spouses. Many women are reluctant to disclose IPV because of the military’s mandatory reporting policy, loss of confidentiality, and fear of an effect of reporting on the careers of the service members and on their families. For that reason, routine screening of all women for IPV is thought to be important for the military health-care setting. Screening may increase referrals to other services, such as those for alcohol or drug treatment, and parenting classes that might reduce or prevent further victimization and its consequences (Chapin and Mackie, 2007).
A 2008 IOM report concluded that there is “sufficient evidence” of an association between deployment to a war zone and later marital and family conflict, including IPV. The association is especially strong when a service member has a diagnosis of PTSD. Not only is combat exposure associated with increased IPV, but soldiers and marines who had mental health problems were more likely to mistreat noncombatants, demonstrating heightened aggression. A meta-analysis of 64 published reports in 2005 revealed increased rates of IPV in military populations. For both military veterans and active-duty service members, IPV results in substantial victim injury (Marshall et al., 2005). Interventions for IPV include the so-called Duluth model—a treatment that focuses on power and control issues—and cognitive-behavior treatment. However, empirical support for their efficacy is lacking (Stover et al., 2009).
Suicide
In recent years, suicide rates among warfighters and veterans have increased, raising concerns among mental health professionals who need to determine the most effective prevention and clinical practice models to help patients struggling with suicidal ideation and behavior. Suicide rates among service members have spiked since 2001, coincident with the initiation of Operation Iraqi Freedom operations. Army data released in December 2009 indicate that rates rose every year between 2005 and 2009 (DOD, 2009a). The 2008 Department of Defense Survey of Health-Related Behaviors Among Active-Duty Military Personnel reported attempted suicide rates of 2.8% in the US Navy, 2.3% in the Marines, 2.0% in the Army, 1.7% in the Coast Guard, and 1.6% in the Air Force (DOD, 2009b). These represent a doubling of the rates observed in 2005. Accurate accounting is difficult, though, because of the reluctance to report suicidal ideation and gestures, and the fact that some deaths reported as accidents involve suicidal intent.
In response to these events, the US Army and the National Institute of Mental Health initiated the Army Study to Assess Risk and Resilience in Servicemembers in 2008. This study, the largest of suicide and mental health among military personnel ever undertaken, is intended to identify risk and protective factors to help the Army develop effective strategies for mitigating suicide risk (NIMH, 2009a).
Mental Health Issues in Children
A landmark study codirected by Rosenheck and Fontana (1998) analyzed NVVRS data on family violence, child behavior, and family cohesion and found that behavior problems in the children of veterans were associated with their veteran parents’ participation in abusive violence. It also reported more depression in children of deployed veterans. Intergenerational transmission of trauma was demonstrated: abusive violence during the Vietnam era was associated with behavioral and mental health disturbances in the veterans’ children 10–15 years later. A study by Samper et al. (2004) explored relationships between PTSD and parenting satisfaction. Findings suggest that higher levels of PTSD symptoms, particularly numbness and avoidance, may have a deleterious effect on parent–child relationships. A primary study by Jensen et al. (1996) found that children who had one parent deployed to the Gulf War had more
behavioral dysfunction; boys were at greater risk than girls for depression associated with the parent’s deployment.
A cross-sectional study of 169 consenting families aimed at describing the effect of wartime military deployments on the behavior of young children in military families found that children who were at least 3 years old and had a deployed parent exhibited more behavioral symptoms than their peers who did not have a deployed parent when caregivers’ stress and depressive symptoms were controlled for (Chartrand et al., 2008). In a study of the effects of deployment on the maltreatment of children, Rentz et al. (2007) conducted a time-series analysis of Texas child-maltreatment data for 2000–2003 to examine changes in the occurrence of child maltreatment in military and nonmilitary families. The rate of substantiated child maltreatment in military families was twice as high in the period after October 2002 as before. Nonmilitary caretakers perpetrated the largest proportion of maltreatment of children, and this suggests that the transitions and separations related to deployment imposed great stressors on the families. In FY 1998–2007, cases of child abuse reported to the DOD Family Advocacy Program (2008) varied from 11.4 to 14.9 per 1,000 children; the substantiated rate of abuse was 4.9–7.3 per 1,000.5
Incarceration
An IOM committee (2008) concluded that there was limited but suggestive evidence of an association between deployment and incarceration. Recent studies have pointed to the distinctly higher rates of suicide in incarcerated veterans than in nonveteran prisoners. A veteran in jail has a suicide risk beyond that conferred by either veteran status or incarceration alone (Wortzel et al., 2009). There is clearly a need to offer specialized assessment and clinical practice interventions in the incarcerated veteran population.
Employment, Finances, and Homelessness
A previous IOM (2008) research effort concluded that there was inadequate evidence to determine whether an association exists between deployment and homelessness and adverse employment outcomes. That conclusion may have been driven by the dearth of methodologically rigorous studies available at the time. More recent anecdotal reports of the transitions of OEF and OIF veterans suggest increasing difficulty with financial stability, employment, and housing (MHAT, 2006). Because social supports remain the major protective factors in mediating adverse mental health outcomes while also promoting healing, attention should be focused on the social contexts of service members and their families during any phase of clinical intervention.
DATA ON PATIENTS UNDER THE CARE OF COUNSELORS
In the statement of task, TRICARE requested that the committee review and synthesize available data on the proportions of all patients who had a series of specified disorders and were under the care of licensed mental health counselors. The committee requested those data from the TRICARE Management Activity; the information listed in Table 2.16 is derived from its response to the request. It is important to note several limitations of the information. The table provides estimates of the numbers of cases treated in the TRICARE population, but for several reasons it probably does not reflect the true prevalences of the disorders. The gold standard for determining diagnoses is the structured clinical interview or chart review. The information in Table 2.16 was obtained from administrative data based on usual care practice, which often does not include structured diagnostic interviews by clinicians and therefore can be less accurate. Research shows that accuracy of claims data can vary by diagnosis. For example, administrative data have demonstrated relatively high accuracy for bipolar disorder (Unutzer et al., 1998, 2000) and schizophrenia (Lurie et al., 1992) but lower accuracy for depression (Spettel et al., 2003). In addition, this information reflects only the primary (or first) diagnosis entered in an insurance claim; if a patient presented for treatment and the mental and substance-use (M/SU) condition was not listed first (e.g., depression and SUD or hypertension and generalized anxiety), the condition would not be included in the table. Therefore, the table likely underrepresents the prevalence of these
TABLE 2.16 Patients in the Care of Mental Health Counselors in the Military Health System
disorders in the treatment-seeking TRICARE population. Finally, the table does not capture the complexity of co-occurring medical, M/SU, and psychosocial problems that are often seen in this population.
Information provided to the committee indicates there were 9,197,927 TRICARE beneficiaries in FY 2008 (TMA, 2009). However, the data in Table 2.16 excludes TRICARE for Life participants because TRICARE is not their primary payer. Enrollees in the six designated provider plans are also excluded. This reduces the overall number of beneficiaries for whom outcomes are reported in the table to 7,217,566.
The committee attempted to identify and obtain other available data on the proportions of patients who had various diagnoses and were under the care of licensed mental health counselors. However, such data are not present in the scientific literature and are not routinely compiled
by care providers.6 Even if they were, the weaknesses in the TRICARE data identified above suggest that they would be of little utility in evaluating the ability of counselors to provide services to the TRICARE beneficiary population as independent practitioners.
REFERENCES
Alderfer BS, Arciniegas DB, Silver JM. 2005. Treatment of depression following traumatic brain injury. Journal of Head Trauma Rehabilitation 20(6):544-562.
Alvarez L. 2008. Despite Army assurances: Violence at home. New York Times, November 23, 2008, 24.
Andreski P, Chilcoat H, Breslau N. 1998. Post-traumatic stress disorder and somatization symptoms: A prospective study. Psychiatry Research 79(2):131-138.
Annegers JF, Hauser WA, Coan SP, Rocca WA. 1998. A population-based study of seizures after traumatic brain injuries. New England Journal of Medicine 338(1):20-24.
APA (American Psychiatric Association). 2000. Diagnostic and statistical manual of mental disorders, 4th ed., text revision. Washington, DC: American Psychiatric Association.
Basham K. 2009. “Commentary on the keynote lecture presented by Dr. Jonathan Shay, Friday, June 27, 2008, titled ‘The trials of homecoming: Odysseus returns from Iraq/Afghanistan, and additional reflections.’” Smith College Studies in Social Work 79(3&4):299-309.
Bell N. 2009. Health and occupational consequences of spouse abuse victimization among male U.S. Army soldiers. Journal of Interpersonal Violence 24(5):751-769.
Bremner JD, Southwick SM, Darnell A, Charney DS. 1996. Chronic PTSD in Vietnam combat veterans: Course of illness and substance abuse. American Journal of Psychiatry 153(3):369-375.
Brown PJ, Stout RL. 1997. Six-month posttreatment outcomes of substance use disordered patients with and without comorbid PTSD. Paper presented at the annual meeting of the International Society for Traumatic Stress Studies, Montreal, Ontario, Canada.
Brown PJ, Recupero PR, Stout R. 1995. PTSD substance abuse comorbidity and treatment utilization. Addictive Behavior 20(2):251-254.
Campbell DG, Felker BL, Liu CF, Yano EM, Kirchner JE, Chan D, Rubenstein LV, Chaney EF. 2007. Prevalence of depression-PTSD comorbidity: Implications for clinical practice guidelines and primary care-based interventions. Journal of General Internal Medicine 22(6):711-718.
Campbell JC, Garza MA, Gielen AC, O’Campo P, Kub J, Dienemann J, Jones AS, Jafar E. 2003. Intimate partner violence and abuse among active duty military women. Violence Against Women 9(9):1072-1092.
Cantu RC. 2003. Head injuries. In Delee and Drez’s orthopaedic sports medicine, 2nd ed., edited by DeLee JC, Drez DJ, Miller MD. Philadelphia: Saunders Elsevier.
Chapin MG, Mackie CF. 2007. Research evidence to update practice guidelines for domestic violence screening in military settings. Military Medicine 172(7):ii-iv.
Chartrand MM, Frank DA, White LF, Shope TR. 2008. Effect of parents’ wartime deployment on the behavior of young children in military families. Archives of Pediatrics and Adolescent Medicine 162(11):1009-1014.
Collins RC, Kennedy MC. 2008. Serving families who have served: Providing family therapy and support in interdisciplinary polytrauma rehabilitation. Journal of Clinical Psychology 64(8):993-1003.
Cornelius JR, Salloum IM, Ehler JG, Jarrett PJ, Cornelius MD, Perel JM, Thase ME, Black A. 1997. Fluoxetine in depressed alcoholics: A double-blind, placebo-controlled trial. Archives of General Psychiatry 54(8):700-705.
Cully JA, Zimmer M, Khan MM, Petersen LA. 2008. Quality of depression care and its impact on health service use and mortality among veterans. Psychiatric Services 59(12):1399-1405.
de Waal MW, Arnold IA, Eekhof JA, van Hemert AM. 2004. Somatoform disorders in general practice: Prevalence, functional impairment and comorbidity with anxiety and depressive disorders. British Journal of Psychiatry 184(6):470-476.
Department of Veterans Affairs. 2009. Definitions—VA polytrauma system of care. http://www.polytrauma.va.gov/definitions.asp#polytrauma. (Accessed July 16, 2009).
DOD (Department of Defense). 2007a. Demographics 2007: Profile of the military community. http://cs.mhf.dod.mil/content/dav/mhf/QOL-Library/Project%20Documents/MilitaryHOMEFRONT/Reports/2007%20Demographics.pdf. (Accessed July 28, 2009).
DOD. 2007b. An achievable vision: Report of the Department of Defense Task Force on Mental Health. Falls Church, VA: Defense Health Board.
DOD. 2009a. Army suicide rate increases five straight years. American Forces Press Service release, December 11. http://www.defense.gov/news/newsarticle.aspx?id=57086. (Accessed January 1, 2010).
DOD. 2009b. 2008 Department of Defense survey of health related behaviors among active duty military personnel. A component of the Defense lifestyle assessment program (DLAP). Prepared by RTI International, September. http://www.tricare.mil/2008HealthBehaviors.pdf. (Accessed January 1, 2010).
DOD Family Advocacy Program. 2008. Child Abuse and Domestic Abuse Data Trends from FY 1998 to 2007. Information Paper. http://cs.mhf.dod.mil/content/dav/mhf/QOL-Library/Project%20Documents/MilitaryHOMEFRONT/Homepage/CADA%20trends98-07%20no%20contact%20info.pdf. (Accessed November 7, 2009).
Donohoe M. 2005. Violence against women in the military. Medscape Ob/Gyn & Women’s Health 10(2). http://www.medscape.com/viewarticle/512380. (Accessed January 8, 2010).
Eaton KM, Hoge CW, Messer SC, Whitt AA, Cabrera MS, McGurk D, Cox A, Castro CA. 2008. Prevalence of mental health problems, treatment, need, and barriers to care among primary care-seeking spouses of military service members involved in Iraq and Afghanistan deployments. Military Medicine 173(11):1051-1056.
Fink P, Sørensen L, Engberg M, Holm M, Munk-Jørgensen P. 1999. Somatization in primary care: Prevalence, health care utilization, and general practitioner recognition. Psychosomatics 40(4):330-338.
Fonseca CA, Schmaling KB, Stoever C, Gutierrez C, Blume AW, Russell ML. 2006. Variables associated with intimate partner violence in a deploying military sample. Military Medicine 171(7):627-631.
Friedemann-Sánchez G, Sayer NA, Pickett T. 2008. Provider perspectives on rehabilitation of patients with polytrauma. Archives of Physical Medicine and Rehabilitation 89(1):171-178.
Friedman MJ. 2006. Posttraumatic stress disorder among military returnees from Afghanistan and Iraq. American Journal of Psychiatry 163(4):586-593.
Galovski T, Lyons JA. 2004. Psychological sequelae of combat violence: A review of the impact of PTSD on the veteran’s family and possible interventions. Aggression and Violent Behavior 9(5):477-501.
Goldzweig CL, Balekian TM, Rolon C, Yano EM, Shekelle PG. 2006. The state of women veterans’ health research: Results of a systematic literature review. Journal of General Internal Medicine 21(Suppl. 3):S82-S92.
Goodwin FK, Jamison KR. 2007. Manic-depressive illness. New York: Oxford University Press.
Graham DP, Cardon AL. 2008. An update on substance use and treatment following traumatic brain injury. Annals of the New York Academy of Sciences 1141:148-162.
Greenfield SF, Weiss RD, Muenz LR, Vagge LM, Kelly JF, Bello LR, Michael J. 1998. The effect of depression on return to drinking: A prospective study. Archives of General Psychiatry 55(3):259-265.
Harvey RJ, Skelton-Robinson M, Rossor MN. 2003. The prevalence and causes of dementia in people under the age of 65 years. Journal of Neurology, Neurosurgery & Psychiatry 74(9):1206-1209.
Hasin DS, Tsai W-Y, Endicott J, Mueller TI, Coryell W, Keller M. 1996. The effects of major depression on alcoholism: Five-year course. American Journal on Addictions 5(2):144-155.
HealthNet Federal Services. 2009. The TRICARE North region. https://www.hnfs.net/common/companyInfo/TRICARE_North_Region_Health_Net.htm. (Accessed July 28, 2009).
Hoge CW, Castro CA, Messer SC, McGurk D, Cotting DI, Koffman RL. 2004. Combat duty in Iraq and Afghanistan, mental health problems, and barriers to care. New England Journal of Medicine 351(1):13-22.
Hoge CW, Terhakopian A, Castro CA, Messer SC, Engel CC. 2007. Association of posttraumatic stress disorder with somatic symptoms, health care visits, and absenteeism among Iraq war veterans. American Journal of Psychiatry 164(1):150-153.
Horner MD, Ferguson PL, Selassie AW, Labbate LA, Kniele K, Corrigan JD. 2005. Patterns of alcohol use 1 year after traumatic brain injury: A population-based, epidemiological study. Journal of the International Neuropsychological Society 11(3):322-330.
Humana Military Healthcare Services. 2009. About Humana military. http://www.humana-military.com/AboutHMHS/about-us.asp. (Accessed July 28, 2009).
IOM (Institute of Medicine). 2007. PTSD compensation and military service. Washington, DC: The National Academies Press.
IOM. 2008. Gulf War and health, Volume 6: Physiologic, psychologic and psychosocial effects of deployment-related stress. Washington, DC: The National Academies Press.
Jacobson AM. 2001. Medically unexplained symptoms. In Psychiatric secrets, edited by Jacobson JL, Jacobson AM. Philadelphia: Hanley and Belfus.
Jaffee MS. 2009. Traumatic brain injury and the military health system. In Systems engineering to improve traumatic brain injury care in the military health system: Workshop summary, edited by Butler D, Buono J, Erdtmann F, and Reid P. Washington, DC: The National Academies Press.
Jensen PS, Martin D, Watanabe H. 1996. Children’s response to parental separation during Operation Desert Storm. Journal of the American Academy of Child & Adolescent Psychiatry 35(4):433-441.
Jordan BK, Marmar CR, Fairbank JA, Schlenger WE, Kulka RA, Weiss DS. 1992. Problems in families of male Vietnam veterans with posttraumatic stress. Journal of Consulting and Clinical Psychology 60(6):916-926.
Judd LL, Akiskal HS, Maser JD, Zeller PJ, Endicott J, Coryell W, Paulus MP, Kunovac JL, Leon AC, Mueller TI, Rice JA, Keller MB. 1998. A prospective 12-year study of subsyndromal and syndromal depressive symptoms in unipolar major depressive disorders. Archives of General Psychiatry 55(8):694-700.
Kendler KS, Gallagher TJ, Abelson JM, Kessler RC. 1996. Lifetime prevalence, demographic risk factors, and diagnostic validity of nonaffective psychosis as assessed in a US community sample. The National Comorbidity Survey. Archives of General Psychiatry 53(11):1022-1031.
Kessler RC. 2004. The epidemiology of dual diagnosis. Biological Psychiatry 56(10): 730-737.
Kessler RC, Berglund P, Demler O, Jin R, Merikangas KR, Walters EE. 2005. Lifetime prevalence and age-of-onset distributions of DSM-IV disorders in the National Comorbidity Survey replication. Archives of General Psychiatry 62(6):593-603.
Killgore W, Melba DS, Stetz C, Castro CA, Hoge CW. 2006. The effects of prior combat experience on the expression of somatic and affective symptoms in deploying soldiers. Journal of Psychosomatic Research 60(4):379-385.
Kraus CA, Seignourel P, Balasubramanyam V, Snow AL, Wilson NL, Kunik ME, Schulz PE, Stanley MA. 2008. Cognitive-behavioral treatment for anxiety in patients with dementia: Two case studies. Journal of Psychiatric Practice 14(3):186-192.
Labutta R. 2009. Medical aspects of traumatic brain injury. In Systems engineering to improve traumatic brain injury care in the military health system: Workshop summary, edited by Butler D, Buono J, Erdtmann F, Reid P. Washington, DC: The National Academies Press.
Lapierre CB, Schwegler AF, Labauve BJ. 2007. Posttraumatic stress and depression symptoms in soldiers returning from combat operations in Iraq and Afghanistan. Journal Trauma Stress 20(6):933-943.
Lowenstein DH. 2009. Epilepsy after head injury: An overview. Epilepsia 50(s2):4-9.
Lurie N, Popkin M, Dysken M, Moscovice I, Finch M. 1992. Accuracy of diagnoses of schizophrenia in Medicaid claims. Hospital and Community Psychiatry 43(1):69-71.
Manguno-Mire G, Sautter F, Lyons J, Myers L, Perry D, Sherman M, Glynn S, Sullivan G. 2007. Psychological distress and burden among female partners of combat veterans with PTSD. Journal of Nervous and Mental Disease 195(2):144-151.
Marshall AD, Panuzio J, Taft CT. 2005. Intimate partner violence among military veterans and active duty service men. Clinical Psychology Review 25(7):862-876.
McCarroll JE, Ursano RJ, Fullerton CS, Liu X, Lundy A. 2002. Somatic symptoms in Gulf War mortuary workers. Psychosomatic Medicine 64(1):29-33.
Mehta KM, Ott A, Kalmijn S, Slooter AJ, van Duijn CM, Hofman A, Breteler MM. 1999. Head trauma and risk of dementia and Alzheimer’s disease: The Rotterdam Study. Neurology 53(9):1959-1962.
MHAT (Mental Health Advisory Team-IV). 2006. Operation Iraqi Freedom 05–07 final report. November 17. Office of the Surgeon, Mutli-National Force Iraq and U.S. Army
Surgeon General. http://www.armymedicine.army.mil/reports/mhat/mhat_iv/MHAT_IV_Report_17NOV06.pdf. (Accessed September 27, 2009).
Milliken CS, Auchterlonie JL, Hoge CW. 2009. Longitudinal assessment of mental health problems among active duty and reserve component soldiers returning from the Iraq War. Journal of the American Medical Association 298(18):2141-2148.
Moore DP, Jefferson JW. 2004a. Amnesia. In Handbook of medical psychiatry, 2nd ed. Philadelphia: Mosby.
Moore DP, Jefferson JW. 2004b. Delirium. In Handbook of medical psychiatry, 2nd ed. Philadelphia: Mosby.
Moore DP, Jefferson JW. 2004c. Dementia. In Handbook of medical psychiatry, 2nd ed. Philadelphia: Mosby.
Moore DP, Jefferson JW. 2004d. Personality change Handbook of medical psychiatry, 2nd ed. Philadelphia: Mosby.
Moore DP, Jefferson JW. 2004e. Schizophrenia. In Handbook of medical psychiatry, 2nd ed. Philadelphia: Mosby.
Moore DP, Jefferson JW. 2004f. Secondary depression. In Handbook of medical psychiatry, 2nd ed. Philadelphia: Mosby.
Nakase-Thompson R, Sherer M, Yablon SA, Nick TG, Trzepacz PT. 2004. Acute confusion following traumatic brain injury. Brain Injury 18(2):131-142.
National Military Family Association. 2006. Statement of the National Military Family Association before the Department of Defense Task Force on Mental Health, December 20. http://www.nmfa.org/site/DocServer/NMFA_DoD_Mental_health_Task_Force__12-20-06.pdf?docID=7701. (Accessed September 27, 2009).
Neighbors HW, Caldwell C, Williams DR, Nesse R, Taylor RJ, Bullard KM, Torres M, Jackson JS. 2007. Race, ethnicity, and the use of services for mental disorders: Results from the National Survey of American Life. Archives of General Psychiatry 64(4):485-494.
Newby JH, Ursano RJ, McCarroll JE, Martin LT, Norwood AE, Fullerton CS. 2003. Spousal aggression by U.S. Army female soldiers toward employed and unemployed civilian husbands. American Journal of Orthopsychiatry 73(3):288-293.
Niebuhr DW, Millikan AM, Cowan DN, Yolken R, Li Y, Weber NS. 2008. Selected infectious agents and risk of schizophrenia among U.S. military personnel. American Journal of Psychiatry 165(1):99-106.
NIMH (National Institute of Mental Health). 2009a. Army study to assess risk and resilience in service members (Army STARRS). http://www.nimh.nih.gov/health/topics/suicide-prevention/suicide-prevention-studies/army-study-to-assess-risk-and-resilience-in-service-members-army-starrs.shtml. (Accessed January 1, 2010).
NIMH. 2009b. Depression. http://www.nimh.nih.gov/health/publications/depression/complete-index.shtml. (Accessed June 22, 2009).
NRC (National Research Council). 2006. Assessing fitness for military enlistment: Physical, medical, and mental health standards, edited by Sackett PR, Mavor AS. Washington, DC: The National Academies Press.
Plassman BL, Havlik RJ, Steffens DC, Helms MJ, Newman TN, Drosdick D, Phillips C, Gau BA, Welsh-Bohmer KA, Burke JR, Guralnik JM, Breitner JC. 2000. Documented head injury in early adulthood and risk of Alzheimer’s disease and other dementias. Neurology 55(8):1158-1166.
Reichman WE, Cummings JL. 2007. Dementia. In Practice of geriatrics, edited by Duthie EH Jr., Katz PR, Malone ML. Philadelphia: Saunders Elsevier.
Renshaw KD, Rodrigues CS, Jones DH. 2008. Psychological symptoms and marital satisfaction in spouses of Operation Iraqi Freedom veterans: Relationships with spouses’ perceptions of veterans’ experiences and symptoms. Journal of Family Psychology 22(4):586-594.
Rentz ED, Marshall SW, Loomis D, Casteel C, Martin SL, Gibbs D. 2007. Effect of deployment on the occurrence of child maltreatment in military and nonmilitary families. American Journal of Epidemiology 165(10):1199-1206.
Richardson RM. 2001. Dementia. In Psychiatric secrets, 2nd ed., edited by Jacobson JL, Jacobson AM. Philadelphia: Hanley and Belfus.
Rosenheck R, Fontana A. 1998. Warrior fathers and warrior sons: Intergenerational aspects of trauma. In International handbook of multigenerational legacies of trauma, edited by Danieli Y. New York: Plenum Press. Pp. 225-242.
Rosenheck R, Nathan P. 1985. Secondary traumatization in children of Vietnam veterans. Hospital & Community Psychiatry 36(5):538-539.
Rudolph JL, Marcantonio ER. 2007. Delirium. In Practice of geriatrics, edited by Duthie JEH, Katz PR, Malone ML. Philadelphia: Saunders Elsevier.
Sadler AG, Booth B, Nielson D, Doebbeling B. 2000. Health-related consequences of physical and sexual violence: Women in the military. Obstetrics & Gynecology 96(3):473-480.
Samper RE, Taft CT, King DW, King LA. 2004. Posttraumatic stress disorder symptoms and parenting satisfaction among a national sample of male Vietnam veterans. Journal of Traumatic Stress 11(4):311-315.
Sampson EL, Warren JD, Rossor MN. 2004. Young onset dementia. Postgraduate Medical Journal 80(941):125-139.
Sayer NA, Chiros CE, Sigford B, Scott S, Clothier B, Pickett T, Lew HL. 2008. Characteristics and rehabilitation outcomes among patients with blast and other injuries sustained during the global war on terror. Archives of Physical Medicine and Rehabilitation 89(1):163-170.
Seal KH, Metzler TJ, Gima, KS, Bertenthal D, Maguen S, Marmar CR. 2009. Trends and risk factors for mental health diagnoses among Iraq and Afghanistan veterans using Department of Veterans Affairs health care, 2002-2008. American Journal of Public Health 99(9):1651-1658.
Smith J, Seirafi J. 2006. Delirium and dementia. In Rosen’s emergency medicine: Concepts and clinical practice, 6th ed., edited by Marx JA, Hockberger RS, Walls RM, Adams JG, Barsan WG, Biros MH, Danzl DF, Gausche-Hill M, Hamilton GC, Ling LJ, Newton EJ. Philadelphia: Mosby Elsevier.
Spencer SS. 2007. Seizures and epilepsy. In Cecil medicine. 23rd ed., edited by Goldman L, Ausiello D. Philadelphia: Saunders Elsevier.
Spettel CM, Wall TC, Allison J, Calhoun J, Kobylinski R, Fargason R, Kiefe CI. 2003. Identifying physician-recognized depression from administrative data: Consequences for quality measurement. Health Services Research 38(4):1081-1102.
St. Louis EK, Granner MA. 2008. Seizures and epilepsy in adolescents and adults. In Conn’s current therapy 2008, 60th ed., edited by Rakel RE, Bope ET. Philadelphia: Saunders Elsevier.
Stover CS, Meadows AL, Kaufman J. 2009. Interventions for intimate partner violence: Review and implications for evidence-based practice. Professional Psychology: Research and Practice 40(3):223-233.
Street AE, Stafford J, Mahan CM, Hendricks A. 2008. Sexual harassment and assault experienced by reservists during military service: Prevalence and health correlates. Journal of Rehabilitation Research & Development 745(2):409-420.
Stuss DT, Binns MA, Carruth FG, Levine B, Brandys CE, Moulton RJ, Snow WG, Schwartz ML. 1999. The acute period of recovery from traumatic brain injury: Posttraumatic amnesia or posttraumatic confusional state? Journal of Neurosurgery 90(4):635-643.
Surís A, Lind L, Kashner M, Borman PD, Petty F. 2004. Sexual assault in women veterans: An examination of PTSD risk, health care utilization, and cost of care. Psychosomatic Medicine 66(5):749-756.
Tanielian T, Jaycox LH (Eds.). 2008. Invisible wounds of war: Psychological and cognitive injuries, their consequences, and services to assist recovery. Santa Monica, CA: RAND Corporation. http://www.rand.org/pubs/monographs/2008/RAND_MG720.pdf. (Accessed January 15, 2010).
TMA (TRICARE Management Activity). 2009. Data provided via e-mail from LCDR Richard Schobitz, OASD(HA)/TMA, in response to a request by the Committee on the Qualifications of Professionals Providing Mental Health Care Services Under TRICARE, July 27.
TriWest. 2009. TriWest fast facts. http://www.triwest.com/corporate/frames.aspx?page=/unauth/newContent/newAboutTriWest/default.asp. (Accessed July 28, 2009).
Unutzer J, Simon G, Pabiniak C, Bond K, Katon W. 1998. The treated prevalence of bipolar disorder in a large staff-model HMO. Psychiatric Services 49(8):1072-1078.
Unutzer J, Simon G, Pabiniak C, Bond K, Katon W. 2000. The use of administrative data to assess quality of care for bipolar disorder in a large staff model HMO. General Hospital Psychiatry 22(1):1-10.
VA/DOD (Department of Veterans Affairs/Department of Defense). 2004. VA/DoD clinical practice guideline for management of post-traumatic stress, version 1.0. Washington, DC: VA/DOD.
VA/DOD. 2009a. VA/DoD clinical practice guideline for management of concussion/mild traumatic brain injury. Washington, DC: VA/DOD.
VA/DOD. 2009b. VA/DoD clinical practice guideline for management of major depressive disorder (MDD), version 2.0. Washington, DC: VA/DOD.
VA/DOD. 2009c. VA/DoD clinical practice guideline for management of substance use disorders (SUD), version 2.0. Washington, DC: VA/DOD.
Vakil E. 2005. The effect of moderate to severe traumatic brain injury (TBI) on different aspects of memory: A selective review. Journal of Clinical and Experimental Neuropsychology 27(8):977-1021.
Wang PS, Lane M, Olfson M, Pincus HA, Wells KB, Kessler RC. 2005. Twelve-month use of mental health services in the United States: Results from the National Comorbidity Survey replication. Archives of General Psychiatry 62(6):629-640.
Wang PS, Demler O, Olfson M, Pincus HA, Wells KB, Kessler RC. 2006. Changing profiles of service sectors used for mental health care in the United States. American Journal of Psychiatry 163(7):1187-1198.
Warden D. 2006. Military TBI during the Iraq and Afghanistan wars. Journal of Head Trauma Rehabilitation 21(5):398-402.
Wortzel HS, Binswanger I, Anderson A, Adler L. 2009. Suicide among incarcerated veterans. Journal of American Academy Psychiatry Law 37(1):82-91.
Yehuda R, Flory JD, Southwick S, Charney D. 2006. Developing an agenda for translational studies of resilience and vulnerability following trauma exposure. Annals of New York Academy of Science 1071:379-396.


