
1
Introduction to Value-Added Modeling
In the context of education, value-added methodology refers to efforts to measure the effects on the achievement of students of their current teachers, schools, or educational programs,1 taking account of the differences in prior achievement and (perhaps) other measured characteristics that students bring with them to school. In this report, we use the term “value-added models” to refer to a variety of sophisticated statistical techniques that use one or more years of prior student test scores, as well as other data, to adjust for preexisting differences among students when calculating contributions to student test performance.
Value-added models have attracted considerable attention in recent years. They have obvious appeal to those interested in teacher and school accountability, instructional improvement, program evaluation, or education research. The No Child Left Behind Act of 2001 (NCLB) requires all states to test students annually in grades 3-8 and in one grade in high school, and this growing availability of student achievement data has led to greater opportunities to implement these models. At the same time, however, many researchers have questioned the validity of the inferences drawn from value-added models in view of the many technical challenges that exist. It is also difficult for most people to understand how value-added estimates are generated because they are often derived from complex statistical models.
In an effort to help policy makers understand the current strengths and limitations of value-added models, as well as to make decisions about whether to implement them in their jurisdictions, the National Research Council and the National Academy of Education jointly held a workshop on the topic on November 13 and 14, 2008, in Washington, DC. The workshop was funded by the Carnegie Corporation.
A committee chaired by Henry Braun of Boston College planned and facilitated the workshop. The event was designed to cover several topics related to value-added models: goals and uses, measurement issues, analytic issues, and possible consequences. The committee identified experts in each of these areas to write papers for presentation at the workshop and to serve as discussants. The workshop agenda and a list of participants appear in Appendix A. Biographical sketches of committee members and staff appear in Appendix B. The background papers and workshop transcript are posted on the National Research Council website at http://www7.nationalacademies.org/bota/VAM_Workshop_Agenda.html.
This report documents the information provided in the workshop presentations and discussions. Its purpose is to lay out the key ideas that emerged from the two-day workshop and should be viewed as an initial step in examining the research and applying it in specific policy circumstances. The statements in the report are confined to the material presented by the workshop speakers and participants. Neither the workshop nor this summary is intended as a comprehensive review of what is known about value-added methodology, although it is a general reflection of the literature. The presentations and discussions were limited by the time available for the workshop.
Although this report was prepared by the committee, it does not represent findings or recommendations that can be attributed to the committee members. The report summarizes views expressed by workshop participants, and the committee is responsible only for its overall quality and accuracy as a record of what transpired at a two-day event. The workshop was also not designed to generate consensus conclusions or recommendations but focused instead on the identification of ideas, themes, and considerations that contribute to understanding the current role of value-added models in educational settings.
GOALS OF VALUE-ADDED MODELING
The term “value-added” is used in manufacturing to refer to the difference between the value of the output and the cost of the raw materials. In education, the term is used more loosely because value-added in terms of changes in test scores is less tangible than value-added in terms of some
real currency.2 McCaffrey and Lockwood (2008) explain that while the origins of using value-added methods to estimate teacher effects date back over 30 years (Hanushek, 1972; Murnane, 1975), interest in these methods grew precipitously following the publication of a technical report by Sanders and Rivers in 1996. They found that teacher effects, estimated using student test score trajectories, predict student outcomes at least two years into the future. This finding suggested that teachers have persistent effects on their students’ achievement and that the accumulation of these effects could be substantial. The following year, Sanders and his colleagues published another paper claiming that teachers are the most important source of variation in student achievement (Wright, Horn, and Sanders, 1997). Interest in value-added modeling was further stoked by other research findings indicating that the variability among teachers was large and that value-added estimates of teacher effects predict students’ future test outcomes.
The number of jurisdictions that are using (or are interested in using) value-added models is increasing rapidly as many district, state, and federal education leaders look for new and better ways to measure school and teacher effectiveness. Tennessee has the best known value-added system; the results are used for school and teacher improvement. The Dallas school system also uses a value-added model for teacher evaluation. In 2008, Ohio began using a value-added model as one component of its state accountability system, to show how much schools and districts are adding to their students’ learning over the course of one or more school years (Public Impact, 2008).
HOW VALUE-ADDED MODELS ARE DIFFERENT FROM OTHER EVALUATION MODELS
Several types of test-based evaluation models are currently used for education decision making. These include status models, cohort-to-cohort change models, growth models, and value-added models. Each type of model is designed to answer a different set of policy-relevant questions.
-
Status models give a snapshot of student performance3 at a point in time, which is often compared with an established target. For example, the mean test score for a subgroup of students or a
-
school can be compared with the state’s annual target to determine if the school has met the state goal. A status model is useful if one wants to answer such questions as “What percentage of students in the state is performing at the proficient level this year?” “Has school X met the state proficiency target this year?”
-
Cohort-to-cohort change models can be used to measure the change in test results for a teacher, school, or state by comparing status at two points in time—but not for the same students. For example, the percentage proficient for this year’s fourth graders in reading can be compared with that of last year’s fourth graders. A cohort-to-cohort change model answers the question, “Are students at a certain grade level doing better this year in comparison to the students who were in the same grade last year?”
-
Growth models measure student achievement by tracking the test scores of the same students from one year to the next to determine the extent of their progress. Gain scores can be computed to compare the performance of the current year’s fourth graders with that of the same group of students last year, when they were in third grade. This type of model is preferable if one wants to know “how much, on average, did students’ performance change between grade X and grade Y?” There might also be a state-wide growth target that subgroups or school systems must meet. Accountability systems built on growth models give teachers and schools credit if their students show improvement, regardless of whether they were high-performing or low-performing to begin with. However, growth models usually do not control for student or school background factors, and therefore they do not attempt to address which factors are responsible for student growth.
-
Value-added models, the focus of this report, are statistical models, often complex, that attempt to attribute some fraction of student achievement growth over time to certain schools, teachers, or programs. These models address such questions as “How did the contribution of school X (or teacher X) to student improvement compare with that of the average school (or teacher)?” Or equivalently, “How much of the change in student performance can be attributed to students attending one school (or one teacher’s class) rather than another?” To isolate school, teacher, or program effects, at least two years of students’ test scores are taken into account, sometimes along with other student and school-level variables, such as poverty, family background, or quality of school leadership. With some models, the value-added estimate for a school or a teacher is the difference between the observed improvement of the students and the expected improvement
-
(after taking account of differences among students that might be related to their academic achievement). For other models, as we shall see, the interpretation is not quite so straightforward; nonetheless, a value-added estimate is meant to approximate the contribution of the school, teacher, or program to student performance.4
In this report, we use the general term “evaluation system” to refer to any of the models (alone or in combination) described above, that are used to evaluate student achievement for the purposes of research, program evaluation, school or teacher improvement, or accountability. The design of an evaluation system and the decision as to whether a value-added model is appropriate will be shaped both by technical and political constraints, as well as by the resources available. It is important that the values (or goals) of education decision makers and their constituents be made explicit. In some instances, the schools, teachers, or programs identified as “best” based on a value-added analysis may not be regarded as “best” with respect to other criteria, because the value-added model gives greater weight to certain test score patterns than to others.
For example, if the designers of an accountability system are particularly concerned with all students reaching a certain level of proficiency, then a status model, such as that mandated by the No Child Left Behind legislation, might be an appropriate basis for determining rewards. However, the trade-off will be that some schools starting out with high-achieving students but having low value-added scores will be rewarded (or not sanctioned) by the system, while some schools starting out with low-achieving students but having high value-added scores will be identified as needing improvement (and sanctioned). The latter schools may be generally regarded as effective in helping their students make greater-than-average progress, although many will not have reached the proficient level. Thus, there would be a disjuncture between success-
ful schools using the value-added criterion and those that are accorded rewards.
If, however, the designers of the evaluation system are most concerned about identifying which teachers and schools are most effective, relative to other teachers and schools, in contributing to their students’ growth in achievement over the course of the school year, then estimates of a value-added model might be a good basis for determining rewards. Note, however, that growth can be defined in many ways: it can be average gains along a conventional test score scale, the change in the fraction of students who meet or exceed a predetermined standard, or the difference between actual and expected average growth. The choice of the growth criterion is critical to achieving the desired impact, and each choice leads to different trade-offs.5
If the criterion is the average gain (or something akin to it), then the trade-off will be that teachers will not be held to the same absolute standard of achievement for all students. In other words, a teacher who raises her low performers’ achievement more than other teachers with similar students will be considered more effective, but those students still may not be reaching the desired levels of achievement. If values and trade-offs are made explicit when the evaluation system is first conceived, then the system is more likely to be designed coherently, with a better chance of achieving the desired goals. In practice, policy makers’ goals are usually more ambitious than statistical methodology and data quality can support.
THE PROBLEM THAT VALUE-ADDED METHODS AIM TO ADDRESS: NONRANDOM ASSIGNMENT OF STUDENTS
Currently, the most common way of reporting school test results is simply in terms of the percentage of students who score at the proficient level or above. However, it is widely recognized among education researchers and practitioners that school rankings based on unadjusted test scores are highly correlated with students’ socioeconomic status (SES). Even students’ rates of growth in achievement are statistically related to SES, with those who start out with higher scores typically gaining at faster rates (Willms, 2008). School achievement is cumulative in nature, in that it is the result of the input of past teachers, classroom peers, actions taken by
administrators, and so on (Harris and Sass, 2005). Furthermore, students’ current achievement is very much a function of out-of-school experiences, including inputs from families and communities. Under the most widely used evaluation models (status and cohort-to-cohort change), teachers and school administrators often argue that they are being unfairly judged since students’ current test scores are greatly influenced by factors beyond their control and, moreover, that these factors are unevenly distributed across schools and between classrooms within a school.
Status models can be appropriate for making judgments about the achievement level of students at a particular school for a given year, whereas cohort-to-cohort models are better at tracking whether a school is improving, but both are less useful for comparing the effectiveness of teachers or instructional practices, either within or across schools. They do not disentangle the effects of status and progress. As Derek Briggs explained at the workshop, it could be that some schools or teachers whose students attain a high percentage proficient are actually making little progress. Such schools or teachers may be considered adequate simply because they happen to have the good fortune of enrolling students who were performing well to start with. There are also some schools or teachers who attain a low percentage proficient but whose students are making good progress, and such schools are not given credit under a status model. Likewise, cohort-to-cohort models do not take into account changes in the school population from year to year. Thus, changes in this criterion can be due to both actual changes in the school’s effectiveness and differences in the student populations on relevant characteristics. The goal of value-added modeling is to make the sorts of distinctions illustrated in Figure 1-1.
It is interesting to note that, in past years, many states have presented
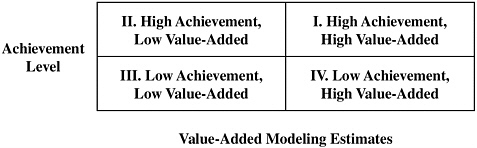
FIGURE 1-1 Possible use of value-added results to classify schools in an accountability system.
SOURCE: Briggs (2008).
test results in league tables, which rank schools in order of average achievement. Schools are sometimes organized into strata that are determined by the SES profiles of their students. The intention is to remind the public that all schools are not directly comparable because they serve very different populations of students and to forestall complaints by schools that broad comparisons are unfair. At the workshop, Doug Willms referred to such stratified league tables as a sort of simplified version of statistical matching. Value-added models offer the promise of more sophisticated and rigorous approaches for leveling the playing field—that is, for taking into account students’ background characteristics when comparing achievement across schools or teachers. But even here, there is need for caution; value-added modeling can make the playing field more level, but it can also reverse the tilt.6
A related way of thinking about value-added models is that they are “an attempt to capture the virtues of a randomized experiment when one has not been conducted” (Organisation for Economic Co-operation and Development, 2008, p. 108). Ideally, causal inferences are best drawn from randomized experiments that include large numbers of subjects, such as those typically conducted in agriculture or medicine. In the simplest version, there are two groups: an experimental group that receives the treatment and a control group that does not. Individuals are first randomly selected and then randomly assigned to one of the two groups. The difference in average outcomes for the two groups is a measure of the relative effectiveness of the treatment. To compare the effectiveness of two schools using an experimental design, students would need to be randomly assigned to the two schools, and achievement outcomes would be compared. However, in educational settings, random assignment is generally not feasible. As workshop presenter Dale Ballou noted, nonrandom assignment is pervasive in education, resulting from decisions by parents and school administrators: residential location decisions (often influenced by the perceived quality of local schools); parental requests for particular teachers or other efforts to influence teacher assignment; administrative decisions to place particular students with particular teachers—sometimes to improve the quality of the teacher-student match, sometimes as a form of favoritism shown to teachers or parents. Discussion leader Judith Singer summed up by saying that, with value-added methods, one is trying to develop “analytic fixes or measurement fixes, for
what is basically a design problem: students are not randomly assigned to teachers [or schools].”
VALUE-ADDED MODELING AND THE NO CHILD LEFT BEHIND ACT
Under NCLB, the key objective for a school or district is to make “adequate yearly progress.” This requires meeting state-set targets for the percentage of students who score at or above the proficient level on the state’s reading and mathematics tests. (The targets must increase over time to reach the ultimate goal of 100 percent proficiency in 2014.) This is a status model because it employs a snapshot of student performance at a certain point in time compared with a given target. The law’s “safe harbor” provision provides an alternative, allowing schools to make adequate yearly progress even if they do not meet proficiency targets, under the condition that they reduce the percentage of students below the proficient level by at least 10 percent.
A number of problems with status models discussed at the workshop have already been mentioned. Another difficulty is that the percentage proficient, the focus of NCLB, gives an incomplete view of student achievement. It does not provide information about the progress of students who are above or below that level. By contrast, value-added models take into account test score trajectories at all achievement levels. Furthermore, the percentage proficient is a problematic way to measure achievement gaps among subgroups of students. The location of the proficiency cut score in relation to the score distributions of the subgroups makes a difference in the size of achievement gaps as measured by the percentage proficient. The problem is exacerbated when looking at trends in achievement gaps (Holland, 2002).
Since the 2006-2007 school year, under the Growth Model Pilot Program, some states have been allowed by the U.S. Department of Education to experiment with using certain types of growth models in the determination of adequate yearly progress. Sometimes referred to as growth-to-a-standard models, they track individual students’ growth in test scores, but with important caveats that make such models consistent with the intent of NCLB. First, showing growth in test scores alone does not excuse states from the goal of 100 percent proficiency in 2014 or from having to meet intermediate targets along the way. Guidance issued by the U.S. Department of Education indicates that states must use growth targets that are still oriented toward meeting specific annual proficiency targets (hence “growth to a standard”), rather than measures that determine whether schools or individual students meet or exceed “projected” or “expected” growth targets, as these “denote an empirically derived
student performance score not necessarily related to the NCLB policy goals of universal proficiency” (U.S. Department of Education, 2009, p. 12). Second, making any adjustments for student background characteristics, such as race or income, in determining growth targets is not allowed; the concern is that lower targets may be assigned to specific groups of students. Not adjusting for student background is seen by some as one way of implementing a policy of high expectations for all, in contrast to most value-added models, which do control for background factors. For these reasons, value-added modeling cannot be used as a chief means to determine adequate yearly progress under NCLB, unless the model somehow incorporates these limitations. However, many participants argued that adjusting for background factors is a more appropriate approach to developing indicators of school effectiveness.
Workshop participant Adam Gamoran suggested that using imperfect value-added models would be better than retaining NCLB in its current form. He viewed value-added indicators as more informative than simple status comparisons and worried about the coming “train wreck” that might occur as more and more schools fail to meet the goal of 100 percent proficiency in 2014. However, other participants—Derek Briggs, Robert Gordon, John Easton, and others—favored using some combination of status and value-added (or simpler growth) indicators for accountability, perhaps with other metrics of school performance, rather than abandoning status indicators altogether. They argued for multiple measures that provide different perspectives on student achievement; status indicators provide information with respect to students’ locations on the achievement continuum and have the advantage of being easy to understand.7
KEY CONCERNS
During the workshop, most of the participants expressed support for trying value-added models for various evaluation purposes but urged caution in using the results as the sole basis for making important decisions. Individuals’ concerns ranged over a number of areas for which further development and analysis are needed. Some focused, for example, on problems with the tests that provide the raw data for value-added analyses; others were concerned with technical aspects of different value-added approaches, especially with sources of bias and imprecision; and still others focused on issues of transparency and public understanding of the results. Some of the concerns, such as the fact that tests are incomplete measures of student achievement, are general problems that arise
with all types of test-based evaluation models (including value-added ones), whereas others, such as the need for interval scales, are specific to particular classes of value-added models.8
Box 1-1 summarizes areas of concern that were discussed at the workshop, which are explained more fully in subsequent chapters of this report. The final chapter summarizes a number of questions that policy makers should consider if they are thinking about using value-added indicators for decision making.
|
BOX 1-1 Participants’ Concerns About Implementation of Value-Added Models The workshop presentations and discussions raised a number of concerns about value-added methodology, which are dealt with at greater length in the chapters of the report. Uses and Possible Consequences (Chapters 1 and 2)
Measurement Issues (Chapter 3)
|
Analytic Issues (Chapter 4)
|
|


