
Appendix C
Scenarios
Chapter 4 of this report compares scenarios for light-duty vehicles between 2010 and 2050. This appendix provides details of how that analysis was performed. It also analyzes the transition costs to achieve cost-effectiveness. Finally, it provides more detail on the decarbonized grid discussed in Chapter 4.
SCENARIO ANALYSIS
The first three cases, which do not include plug-in hybrid electric vehicles (PHEVs), are taken directly from the 2008 Hydrogen Report. They provide a point of comparison for the PHEV cases. They also allow us to analyze portfolio cases, where a strategy of introducing PHEVs is combined with improving efficiency in the gasoline ICEVs and HEVs and with the introduction of biofuels.
Hydrogen Report Cases
-
Reference Case (same as the 2008 Hydrogen Report Reference Case). Gasoline internal combustion engine vehicles (ICEVs) continue to dominate the light-duty sector (Figure C.1). Gasoline HEVs gain about 10 percent fleet share by 2050. The fuel consumption of ICEV and HEV vehicles follows projections from the EIA Annual Energy Outlook 2008, meeting CAFE standards by 2020, with only modest improvements in fuel economy beyond this time (Figure C.2).
-
ICEV Efficiency Case (2008 Hydrogen Report Case 2). Improvements in internal combustion engine technology are implemented, and HEVs comprise 60 percent of the fleet by 2050 (Figure C.3). Fuel economy increases for both ICEVs and HEVs (Figure C.4).
-
Biofuels Intensive Case (2008 Hydrogen Report Case 3). Biofuels are introduced at a rapid rate. Over time, lower carbon biofuel supply is implemented (Figure C.5).
PHEV Cases
-
PHEV Case 1. PHEVs introduced according to Figure 4.1 (Chapter 4 in this report); total vehicles remain at Reference Case levels.
-
PHEV + ICEV Efficiency (PHEV Case 2). Same as PHEV Case 1, but gasoline ICEVs and HEVs improve according to ICEV Efficiency Case (Hydrogen Report Case 2). Vehicle mix is shown in Figure C.6.
-
PHEV + ICEV Efficiency + Biofuels (PHEV Case 3). Same as PHEV Case 2, but biofuels are rapidly introduced, replacing some of the fuel used by ICEVs and HEVs. Vehicle mix is shown in Figure C.6.
ESTIMATING PHEV PERFORMANCE
As illustrated in Figure C.7, while the battery is above a minimum state of charge (SOC), the PHEV operates in a charge-depleting (CD) mode, in which it draws down the onboard battery to meet vehicle power demands. Once it reaches this minimum SOC, the vehicle switches to charge-sustaining (CS) mode, which is functionally equivalent to conventional HEV operation. During this mode, the vehicle maintains the SOC within a limited operating envelope, using stored battery energy and capturing regenerative braking energy to optimize ICE operation.
For vehicles with a single source of stored energy, such as gasoline, hydrogen, or electric battery, modeling the energy consumption is fairly straightforward once the influencing factors (vehicle weight, frontal area, aerodynamic drag, rolling resistance, engine and drive-train component performance and efficiency, and drive cycle) are specified.
For plug-in hybrid vehicles, however, there are two sources of stored energy onboard, gasoline and electricity, adding complexity to the energy-modeling task. The model must include estimates of the fraction of vehicle miles traveled (VMT) on electricity and the VMT on gasoline and how
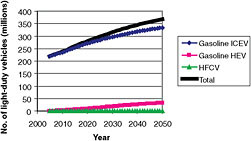
FIGURE C.1 Number of vehicles in the Hydrogen Report Reference Case. SOURCE: NRC, 2008.
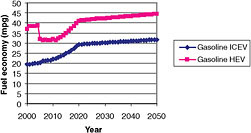
FIGURE C.2 Fuel economy for vehicles in the Hydrogen Report Reference Case. SOURCE: NRC, 2008.
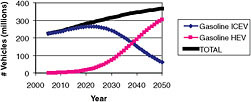
FIGURE C.3 Number of vehicles in the ICEV Efficiency Case (Hydrogen Report Case 2). SOURCE: NRC, 2008.
much electricity and fuel are consumed over a drive cycle, both of which are influenced by three factors:
-
The size of the battery. The larger the PHEV battery, the greater the fraction of the car’s energy use that can be provided by electricity. Battery size is sometimes expressed as all-electric range (AER), the distance that could be traveled on just the battery if the car is operated in CD mode without using the engine.
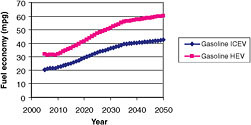
FIGURE C.4 Fuel economy for the ICEV Efficiency Case (Hydrogen Report Case 2). SOURCE: NRC, 2008.
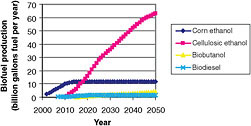
FIGURE C.5 Biofuel supply for the Biofuels-Intensive Case (Hydrogen Report Case 3). SOURCE: NRC, 2008.
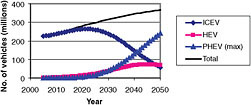
FIGURE C.6 Numbers of light-duty vehicles for portfolio approach, where PHEVs are combined with efficient ICEVs and HEVs.
-
Pattern of driving. The fraction of miles traveled on electricity can also vary, depending on the driver’s pattern of trips. If the driver takes only short trips (less than the all-electric range of the battery), all the miles could all be traveled on electricity. For longer trips, the driver will deplete the battery and will have to use the engine.
-
Control strategy of the PHEV when driven in CD mode. Some PHEVs (the PHEV-40 in this report) use an all-electric strategy, where the battery is depleted to a minimum SOC.
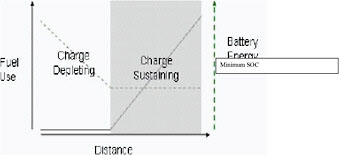
FIGURE C.7 PHEV operating modes. SOURCE: Kromer and Heywood, 2007.
-
At this point, the engine is turned on and the vehicle operates in CS mode, similar to a gasoline hybrid. Other PHEVs (the PHEV-10) use a “blended” strategy, where the engine is engaged when additional power is needed for acceleration or hill climbing as well as when the battery is discharged.
Vehicle simulation models were not used in this study. However, several recent studies have simulated a range of vehicles on a self-consistent basis, including gasoline ICEVs, HEVs, PHEVs, EVS, and HFCVs (Kromer and Heywood, 2007; Elgowainy et al., 2009; Simpson, 2006; Plotkin and Singh, 2009). These studies employ varying assumptions about PHEV design and control strategies.
To span the range of control strategies, the committee modeled a PHEV-40 with an all-electric drive strategy and a PHEV-10 with a blended strategy. Both PHEVs are midsize sedans with 100 kW power output. The committee drew on the results of the referenced studies to approximate the performance of the PHEVs modeled. This was accomplished in four steps.
Step 1.
Estimate Fraction of Miles Driven in CD and CS Mode
The committee used a chart similar to Figure C.8 which estimates the utility factor—the fraction of miles that could be traveled on electricity in the United States—as a function of the PHEV’s all-electric range, or battery size. For a PHEV-10, 23 percent of the nation’s miles traveled could be on electricity. For a PHEV-40, the utility factor is 63 percent.
Step 2.
Estimate PHEV Gasoline and Electricity Use over Drive Cycle
The committee took the energy-use values for PHEVs in CD and CS modes from the referenced reports. The energy-use values were then combined with the estimated fraction of miles spent in CD and CS modes from Step 1 to estimate electricity and fuel use over the whole drive cycle.
Figure C.9 illustrates the energy consumption of gasoline and electricity over the combined FTP/HWFET drive cycle for various types of advanced hybrid and plug-in hybrid vehicles. As battery size increases, gasoline consumption falls and electricity increases. The overall energy efficiency of the vehicle is higher with larger batteries.
Step 3.
Estimate Energy Consumption for All-Electric and Blended Vehicles
PHEV energy use over a drive cycle depends on the degree of blending assumed during CD mode. For an all-electric strategy, petroleum consumption over a drive cycle is lower than for a blended strategy. This is illustrated in Figure C.10.
Electricity use is about the same for various degrees of blending, but gasoline use increases at higher blending ratios. Blended-26 percent represents the maximum possible blending. Blended-55 percent represents all-electric operation.
Only one study (Kromer and Heywood, 2007) evaluated both blended and all-electric-range operation, and the committee used that study for estimating PHEV energy use. Although a PHEV-40 was not specifically evaluated in the study, linear interpolation between PHEV-30 and PHEV-60 results provided estimated energy use for PHEV-40s.
PHEV gasoline and electricity energy use are expressed as fractions of the gasoline energy used in an HEV, as shown in Table C.1. These ratios put PHEV energy use on the same basis as the 2008 Hydrogen Report.
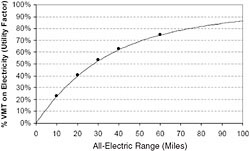
FIGURE C.8 National VMT fraction available for substitution by a PHEV using 100 percent electric charge-depleting mode. SOURCE: Elgowainy et al., 2009.
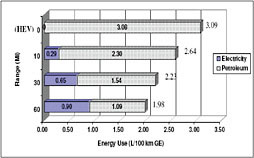
FIGURE C.9 Tank-to-wheels energy use in advanced vehicles, assuming 44 percent blending during charge-depleting operation. SOURCE: Kromer and Heywood, 2007.
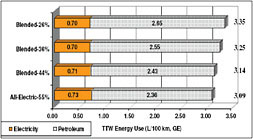
FIGURE C.10 Energy consumption in a PHEV-30 as electricity and gasoline for different blending strategies in CD mode. SOURCE: Kromer and Heywood, 2007.
Step 4.
Estimate PHEV Gasoline and Electricity Use over Time
The committee reasoned that PHEV engine and vehicle technologies (e.g., aerodynamics and rolling resistance) would improve at the same rate as fuel economy technologies in the ICEV Efficiency Case: 2.7 percent per year from 2010 to 2025; 1.5 percent per year from 2026 to 2035; and 0.5 percent per year from 2036 to 2050. Combining these improvement rates and the derived energy-use ratios in Table C.1, the committee then developed assumed values for gasoline and electricity use vs. time for the PHEV-10 and PHEV-40 from 2010 to 2050.
Figure C.11 shows the resulting gasoline use for PHEV-10 and PHEV-40 vehicles for the Optimistic technology case. Gasoline ICEV and HEV gasoline use in the Reference Case and high-efficiency cases are shown for comparison. Figure C.12 shows the estimated electricity use for both the PHEV-10 and the PHEV-40.
TABLE C.1 Ratio of Energy Use in PHEVs Compared to Energy Use in Gasoline HEVs
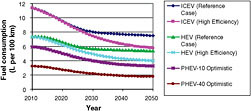
FIGURE C.11 Estimated on-road, fleet-average gasoline consumption for ICEVs, HEVs, and PHEVs in this study. Electricity use in PHEVs not included.
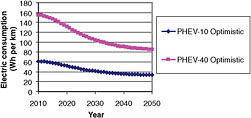
FIGURE C.12 Estimated fleet-average electricity use over drive cycle for PHEVs in this study.
TRANSITION COST ANALYSIS
A transition cash flow analysis was conducted to determine the investment costs required for PHEVs to reach cost competitiveness with Reference Case gasoline vehicles. For each year, the committee estimated the incremental cost of buying PHEVs instead of gasoline reference vehicles. The incremental investment for vehicles is (Reference vehicle price − PHEV price) times the number of PHEVs sold each year. Then the committee estimated the annual cost of fuel for all the PHEVs in the fleet and the cost of fuel for an equal number of gasoline reference vehicles. The breakeven is the year when annual fuel cost savings balance annual purchase cost differences. All cases assume that charging electricity costs 8 cents per kWh and that gasoline prices, as in the hydrogen study, increase from $2.70 per gallon in 2010 to $4.00 per gallon in 2050 (see Figure 4.9).
Results are shown in Figures C.13 through C.16 for PHEV-10s and PHEV-40s. “Maximum Practical” is the market penetration rate with Optimistic technical progress and “Probable” is the market penetration rate with Probable technical progress. In addition, a mixed case, where 30 percent of the market is captured by PHEV-40s and 70 percent by PHEV-10s, is also included (Figures C.17 and C.18). These figures supplement the results presented in Chapter 4 (Table 4.3).
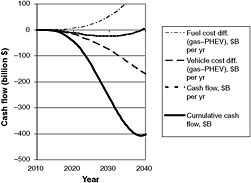
FIGURE C.13 Cash flow analysis for PHEV-40, Maximum Practical case, Optimistic technical assumptions. The break-even year is 2040, and the buydown cost is $408 billion.
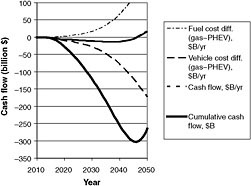
FIGURE C.14 Cash flow analysis for PHEV-40, Probable case, Probable technical assumptions. The break-even year is 2047, and the buydown cost is $303 billion.
SENSITIVITY STUDIES
The sensitivity of the transition analysis was explored for four key parameters: the price of electricity, the price of gasoline, and the incremental costs of the PHEV-10 and the PHEV-40 relative to those of a reference vehicle. Base case values are shown in Table C.2. Each variable is normalized to the base case value in Table C.3, which allows the sensitivity results to be plotted on the same graph. Results for the break-even year and buydown cost for the two PHEVs are shown in Figures C.19 through C.22.
The buydown cost and break-even year for the PHEV-10 are not very sensitive to electricity prices, because most of
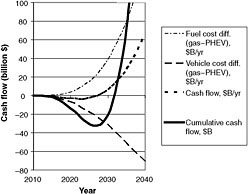
FIGURE C.15 Cash flow analysis for PHEV-10, Maximum Practical case, Optimistic technical assumptions. The break-even year is 2028, and the buydown cost is $33 billion.
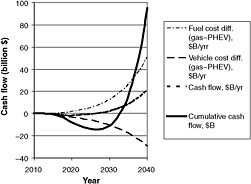
FIGURE C.16 Cash flow analysis for PHEV-10, Probable case, Probable technical assumptions. The break-even year is 2028, and the buydown cost is $15 billion.
the fuel used by the PHEV-10 is gasoline. The PHEV-40 results show a higher sensitivity to electricity price, as these vehicles travel over half their miles on electricity. Even if the electricity price was 12 cents per kWh instead of the base case (8 cents per kWh), breakeven for the PHEV-40 would be delayed only about 2 years.
The results for both PHEV-10 and PHEV-40 are sensitive to the assumed oil price. If oil prices rose 50 percent compared to our base case (price of $120-$180/bbl or $4-$6/gallon gasoline in the timeframe 2010-2030), the PHEV-40 would break even in 2029 (instead of 2040), and buydown costs would be reduced to about $100 billion (from $400 billion).
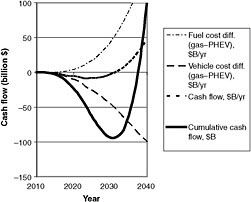
FIGURE C.17 Cash flow analysis for mixed case (70 percent PHEV-10s and 30 percent PHEV-40s), Maximum Practical case, Optimistic technical assumptions. The break-even year is 2032, and the buydown cost is $94 billion.
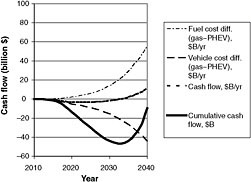
FIGURE C.18 Cash flow analysis for mixed case (70 percent PHEV-10s and 30 percent PHEV-40s), Probable Case, Probable technical assumptions. The break-even year is 2034, and the buy-down cost is $47 billion.
Finally, the break-even year and the buydown cost are sensitive to the assumed vehicle price and the rate of learning. In the low-cost case, the committee assumes that DOE goals are met by 2020. This implies an earlier break-even year and a much lower buydown cost for both the PHEV-10
TABLE C.2 Input Variables for Sensitivity Study
|
Parameter |
Low |
Base |
High |
|
Electricity price, $ per kWh |
0.06 |
0.08 |
0.15 |
|
Gasoline Price $ per gala |
0.5 × Base |
1.0 × Base |
2.0 × Base |
|
Vehicle Incremental retail price, $b |
DOE Goal (2020) |
Optimistic |
Probable |
|
PHEV-10c |
4,500 |
7,700 (2010) 5,100 (2030) |
8,800 (2010) 5,700 (2030) |
|
PHEV-40d |
7,600 |
19,800 (2010) 12,300 (2030) |
25,500 (2010) 15,500 (2030) |
|
aDOE’s High Price Case (EIA, 2008, Annual Energy Outlook). See Figure 4.9, which shows gasoline prices ranging from $2.75 to $4.00 per gallon from 2010 to 2050. Corresponds to oil at $80 to $120 per barrel (2010-2030). bSee Table 4.2. cOEM cost of battery, $ per usable kWh: 2020, $500 (DOE goal); 2030, base, $720; 2030, high, $950. dOEM cost of battery, $ per usable kWh: 2020, $300 (DOE goal); 2030, base, $720; 2030, high, $1000. |
|||
TABLE C.3 Range of Inputs Normalized to Base Value (divide values in Table C.2 by base value)
|
Variable |
Low |
Base |
High |
|
Electricity Price $ per kWh |
0.75 |
1 |
1.875 |
|
Gasoline Price $ per gala |
0.5 × Base |
1.0 × Base |
2.0 × Base |
|
Vehicle Incremental retail price, $b |
DOE Goal |
Optimistic |
Probable |
|
PHEV-10c |
Base 0.87 |
1 |
Base 1.13 |
|
PHEV-40d |
Base 0.62 |
|
Base 1.25 |
|
aBase is DOE’s High Price Case (EIA, 2008, Annual Energy Outlook). See Figure 4.9, which shows gasoline prices ranging from $2.75 to $4.00 per gallon from 2010 to 2050, corresponding to oil at $80 to $120 per barrel (2010-2030). bSee Table 4.2. cOEM cost of battery, $ per usable kWh: 2020, $500 (DOE goal); 2030, base, $720; 2030, high, $950. dOEM cost of battery, $ per usable kWh: 2020, $300 (DOE goal); 2030, base, $720; 2030, high, $1000. |
|||
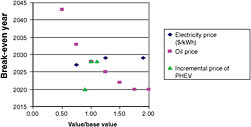
FIGURE C.19 PHEV-10: Sensitivity of break-even year to changes in input variables.
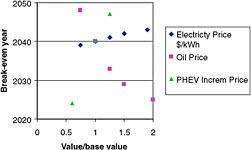
FIGURE C.20 PHEV-40: Sensitivity of break-even year to changes in input variables.
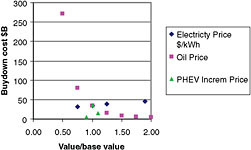
FIGURE C.21 PHEV-10: Sensitivity of buydown cost to changes in input variables.
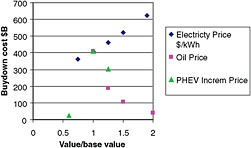
FIGURE C.22 PHEV-40: Sensitivity of buydown cost to changes in input variables.
and, especially, the PHEV-40. The PHEV-40 would reach breakeven in 2024 at a total buydown cost of about $25 billion instead of $400 billion. In the high case, the committee used both the probable cost values and the probable market penetration rate. This delays the break-even year for both PHEVs but can result in a lower buydown cost (because of the delay in buying PHEVs until costs have dropped).
With high oil prices or rapid success in meeting DOE’s battery goals, break-even years for PHEV-40s could occur 10 to 15 years sooner and the buydown costs would be much lower than in the base case.
LOW-CARBON GRID
The Electric Power Research Institute (EPRI)/Natural Resources Defense Council (NRDC) scenario used to estimate GHG emissions for a future low-carbon grid assumes wide adoption of advanced low-carbon technologies. The cost for charging electricity is assumed to be 8 cents/kWh for nighttime electricity.
Figure C.23 compares the GHG emissions from two future electric grids: the low-carbon EPRI/NRDC case and the EIA business-as-usual Annual Energy Outlook high-price case. For the latter case, GHG emissions were extrapolated beyond 2030, assuming that electricity demand and GHG emissions for electric generation continue to grow at the same rate as between 2006 and 2030.
Figure C.24 shows the hydrogen GHG emissions per unit of fuel energy assumed for hydrogen in the 2008 Hydrogen Report.
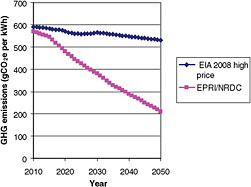
FIGURE C.23 GHG emissions from the future electric grid.
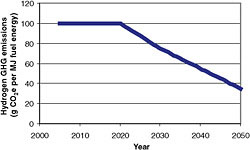
FIGURE C.24 Hydrogen GHG emissions per megajoule of energy.


