
E
Fuel Economy and Fuel Consumption as Metrics to Judge the Fuel Efficiency of Vehicles
Figure E-1 shows the relationship of fuel consumption versus fuel economy. The negative slope and the shape of this relationship are both important. The slope of the fuel consumption/fuel economy (FC/FE) curve indicates the amount of change in FC relative to a change in FE. For example, when the slope magnitude in Figure E-1 is high, such as at 10 mpg, there is a large change in FC for a small change in FE. On the other hand, at 50 mpg, there is a small change in FE, since the slope magnitude is very low and approaching zero as indicated by the lower right-hand slope scale on Figure E-1.
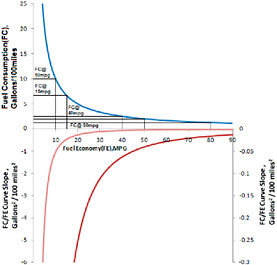
FIGURE E-1 Fuel consumption (FC) versus fuel economy (FE) (upper half of figure) and slope of FC/FE curve (lower half of figure). The light-colored lower curve matches the left-hand y-axis, while the dark curve matches the right-hand y-axis.
Fuel consumption decreases slowly after 40 mpg since the slope of the FC/FE curve approaches zero (Figure 2-1 lower curve and right-hand scale). The slope rapidly decreases past 40 mpg since it varies as the inverse of FE squared, which then results in a small decrease in FC for large FE increases. This fact is very important since fuel consumption is the metric in corporate average fuel economy (CAFE) standards for light-duty vehicles. For example, the fuel consumption is 2.5 gallons/100 miles at 40-mpg and 1.25 gallons/100 miles at 80 mpg. Thus, a 40 mpg change in fuel economy results in a change in fuel consumption of only 1.25 gallons/100 miles. In going from 8 to 9 mpg, there is a change in fuel consumption of approximately 1.39 gallons/100 miles. This means that a change from 8 to 9 mpg saves more fuel than a change from 40 to 80 mpg. This nonlinear relationship between fuel economy and fuel consumption has important meaning for regulations, where a reduction in fuel use or in greenhouse emissions is desired. Improving vehicles with high fuel consumption (low mpg) and high vehicle miles traveled (VMT) has much more effect on fuel savings than improving low-consumption (high-mpg) and low-VMT vehicles.
Tables E-1, E-2, and E-3 show vehicle groups and national average payload data that can serve as the basis for National Highway Traffic and Safety Administration (NHTSA) use in determining payloads to be used for testing and simulating any future medium- and heavy-duty vehicle fuel consumption procedures as related to standards. The data in Tables E-1 through E-3 and other data in the report on which the tables are based merit careful study by NHSTA before they are considered for use in a regulation.
The following equations hold for calculating FE and FC:.
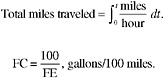
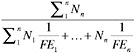
The equations above hold from engine on to engine off in order to capture idle time. Chapter 2 refers to an “average payload” to calculate load-specific fuel consumption (LSFC) but does not indicate how to calculate it on a trip delivering cargo. The calculation for average payload is as follows:
where Px = payload in tons carried for time x when the vehicle is moving, and tx = time in hours carrying payload Px. This is a “time average payload” for a vehicle operating in the field and excludes idle time—it is the integral of payload to get the average payload.
From Figure 2.6, LSFC does not decrease significantly for a payload increase as long as the payload is greater than 70 percent of the full payload.
In the equation for payload, if any Px is zero, there is zero in the numerator for that segment, but the time is counted in the denominator, which then lowers the average payload. The FC during the no-load segment would decrease, lowering the total gallons of fuel used. If the time average payload is less than 70 percent of full load, LSFC will increase—if it is greater than 70 percent, LSFC will increase somewhat based on Figure 2.6.
Then,
and the
Therefore,
For picking up cargo, the average payload equation would need a plus payload term for each segment to account for the pickup. Therefore, P2 = P1 − Pd + Pp where Pd = payload delivered and Pp = payload picked up after segment 1,
TABLE E-1 Gross Vehicle Weight Groups
|
Group |
Gross Vehicle Weight (lb) |
|
1 |
<6,000 |
|
2 |
6,001-10,000 |
|
3 |
10,001-14,000 |
|
4 |
14,001-16,000 |
|
5 |
16,001-19,500 |
|
6 |
19,501-26,000 |
|
7 |
26,001-33,000 |
|
8 |
>33,000 |
|
NOTE: Vehicle groups used for average payloads in Tables E-2 and E-3. SOURCE: Development of Truck Payload Equivalent Factor (TPEF), final report submitted to Office of Freight Management and Operations, Federal Highway Administration, Washington, D.C., by Battelle, 505 King Avenue, Columbus, Ohio 43201. June 15, 2007. Available at http://ops.fhwa.dot.gov/freight/freight_analysis/faf/faf2_reports/reports9/index.htm#toc. |
|
TABLE E-2 Average Payload (lb) by Commodities and Gross Vehicle Weight Group VIUS—National
|
Commodities |
Group 1 |
Group 2 |
Group 3 |
Group 4 |
Group 5 |
Group 6 |
Group 7 |
Group 8 |
|
Live animals and fish |
- |
5,055 |
7,638 |
5, 424 |
9,472 |
17,200 |
16,345 |
40, 022 |
|
Animal feed or products of animal origin |
- |
4,682 |
6,138 |
3, 760 |
8,330 |
11,778 |
18,980 |
39, 841 |
|
Cereal grains |
- |
13,348 |
15,234 |
8, 690 |
14,334 |
17,640 |
24,208 |
41, 922 |
|
All other agricultural products |
- |
10,728 |
6,889 |
5, 985 |
7,660 |
11,348 |
26,793 |
34, 616 |
|
Basic chemicals |
- |
* |
* |
3,386 |
* |
11,180 |
14,264 |
38, 431 |
|
Fertilizers and fertilizer materials |
- |
8,062 |
2,937 |
5,382 |
7,898 |
12,308 |
25,148 |
30,134 |
|
Pharmaceutical products |
- |
* |
* |
- |
* |
7,455 |
* |
14, 507 |
|
All other chemical products |
- |
2,715 |
3,046 |
4, 357 |
6,193 |
9,712 |
17,574 |
36, 411 |
|
Alcoholic beverages |
- |
- |
2,670 |
- |
* |
16,177 |
20,142 |
35,758 |
|
Bakery and milled grains |
- |
2,000 |
2,407 |
7,083 |
* |
3,198 |
27,732 |
31,389 |
|
Meat, seafood, and their preparation |
- |
* |
10,402 |
3, 646 |
- |
8,819 |
10,738 |
40, 012 |
|
Tobacco products |
- |
- |
2,700 |
- |
- |
* |
9, 253 |
34, 381 |
|
All other prepared foodstuff |
- |
4,354 |
3,607 |
3, 617 |
5,486 |
13,240 |
23,736 |
38, 894 |
|
Logs and other wood in rough |
- |
5,838 |
4,880 |
* |
9,384 |
11,029 |
22,746 |
46, 774 |
|
Paper and paperboard articles |
- |
- |
* |
- |
6, 718 |
8,842 |
18,591 |
37, 932 |
|
Printed products |
- |
8,864 |
3,418 |
4, 699 |
2,126 |
8,578 |
8, 805 |
21, 340 |
|
Pulp, newsprint, paper, or paperboards |
- |
* |
* |
* |
- |
10,904 |
15,815 |
41, 774 |
|
Wood products |
- |
3,303 |
3,592 |
5, 410 |
7,263 |
8,218 |
16,182 |
34, 699 |
|
Articles of base metal |
* |
1,808 |
2,016 |
4, 399 |
4,323 |
8,095 |
12,840 |
29, 564 |
|
Base metal finished or semi-finished form |
* |
3,375 |
3,871 |
3, 731 |
4,080 |
6,356 |
12,110 |
38, 010 |
|
Non-metallic mineral products |
- |
3,737 |
2,088 |
3,438 |
6,652 |
10,527 |
28,977 |
35,962 |
|
Non-powered tools |
- |
2,675 |
3,167 |
4, 353 |
5,421 |
6,680 |
9, 899 |
14, 810 |
|
Powered tools |
- |
3,894 |
3,602 |
4, 849 |
8,513 |
7,405 |
12,242 |
25, 241 |
|
Electronic and other electrical equipment |
- |
2,463 |
4,068 |
2, 060 |
* |
7,877 |
9, 946 |
26, 353 |
|
Furniture, mattresses, lamps, etc. |
- |
2,056 |
2,769 |
2, 591 |
- |
6,397 |
17,501 |
22, 598 |
|
Machinery |
- |
4,271 |
4,277 |
9, 265 |
5,020 |
9,958 |
17,598 |
35, 754 |
|
Miscellaneous manufactured products |
- |
1,401 |
2,411 |
6, 148 |
5,615 |
8,571 |
17,861 |
27, 236 |
|
Precision instruments and appliances |
- |
1,455 |
1,373 |
10, 095 |
- |
4,391 |
* |
26, 195 |
|
Textile, leather, and related articles |
- |
2,073 |
2,986 |
* |
8, 701 |
7,599 |
41,925 |
36, 656 |
|
Vehicle, including parts |
- |
3, 751 |
5,506 |
5,896 |
7, 333 |
8,173 |
23, 554 |
31,945 |
|
All other transportation equipment |
- |
- |
2,025 |
5, 431 |
* |
16,312 |
18,286 |
42, 517 |
|
Coal |
- |
* |
* |
- |
- |
6,748 |
- |
50, 011 |
|
Crude petroleum |
- |
- |
- |
- |
- |
8,590 |
- |
39,890 |
|
Gravel and crushed stones |
- |
6,544 |
6,931 |
6, 276 |
10,122 |
13,770 |
24,305 |
39, 130 |
|
Metallic ores and concentrates |
- |
- |
* |
- |
10,000 |
- |
- |
42,272 |
|
Monumental and building stones |
- |
* |
3,460 |
5, 782 |
14,100 |
10,392 |
9, 473 |
35, 960 |
|
Natural sand |
- |
7,306 |
3,029 |
12, 849 |
6,000 |
11,643 |
28,662 |
38, 067 |
|
All other nonmetallic minerals |
- |
7,337 |
3,064 |
2,478 |
7,662 |
16,262 |
13,580 |
38,835 |
|
Fuel oils |
- |
4,484 |
14,811 |
- |
* |
15,422 |
17,525 |
39, 634 |
|
Gasoline and aviation turbine |
- |
* |
- |
2, 825 |
- |
15,128 |
18,916 |
53, 423 |
|
Plastic and rubber |
- |
* |
2,931 |
3, 329 |
* |
8,113 |
12,548 |
30, 379 |
|
All other coal and refined petroleum |
- |
4,519 |
4, 336 |
* |
4,874 |
10, 326 |
18, 672 |
41,027 |
|
Hazardous waste |
- |
* |
1,500 |
- |
- |
6,854 |
15,517 |
37, 856 |
|
All other waste and scrap |
- |
3,384 |
2,927 |
* |
5,951 |
8,120 |
12,823 |
24, 944 |
|
Recyclable products |
- |
3, 153 |
4,878 |
3, 689 |
* |
8,425 |
13,743 |
27, 532 |
|
Mail and courier parcels |
* |
7,976 |
5,559 |
4, 608 |
7,342 |
10,884 |
33,344 |
31, 628 |
|
Empty shipping containers |
- |
2, 661 |
* |
- |
* |
2,309 |
16, 129 |
26,699 |
|
Passengers |
- |
2,264 |
2,501 |
* |
* |
* |
* |
* |
|
Mixed freight |
- |
2,080 |
2,633 |
4, 051 |
* |
20,137 |
28,811 |
37, 094 |
|
Multiple categories |
- |
3,602 |
3,375 |
4, 198 |
5,463 |
8,127 |
17,189 |
31, 946 |
|
Products not classified, blank, not reported or applicable |
- |
2,471 |
* |
6, 556 |
7,809 |
11,622 |
17,644 |
30, 545 |
|
SOURCE: Development of Truck Payload Equivalent Factor (TPEF), final report submitted to Office of Freight Management and Operations, Federal Highway Administration, Washington, D.C., by Battelle, 505 King Avenue, Columbus, Ohio 43201. June 15, 2007. Available at http://ops.fhwa.dot.gov/freight/freight_analysis/faf/faf2_reports/reports9/index.htm#toc. |
||||||||
TABLE E-3 Vehicle Groups and National Average Payload (lb)
|
Major Body Type |
Group 1 |
Group 2 |
Group 3 |
Group 4 |
Group 5 |
Group 6 |
Group 7 |
Group 3 |
|
Truck or Truck + Trailer |
|
|
|
|
|
|
|
|
|
Bulk |
- |
6,249 |
4,798 |
5,004 |
10,831 |
13,152 |
15,707 |
30,966 |
|
Flatbed |
* |
4,027 |
4,767 |
4,858 |
7,836 |
9,465 |
11,405 |
16,693 |
|
Tank |
- |
6,077 |
4,438 |
7,266 |
7,249 |
12,991 |
15,743 |
26,858 |
|
Van |
* |
4,179 |
3,071 |
4,322 |
6,770 |
7,516 |
9,519 |
6,233 |
|
Reefer |
- |
4,320 |
3,196 |
4,263 |
* |
9,161 |
10,983 |
10,414 |
|
Logging |
- |
15,036 |
* |
* |
* |
10,787 |
* |
42,857 |
|
Other |
* |
2,969 |
3,075 |
4,442 |
5,235 |
7,391 |
11,887 |
23,853 |
|
Tractor + Trailer |
|
|
|
|
|
|
|
|
|
Automobile |
- |
- |
- |
- |
* |
* |
25,443 |
34,257 |
|
Livestock |
- |
- |
- |
* |
- |
44,361 |
27,747 |
42,535 |
|
Bulk |
- |
* |
- |
* |
- |
36,846 |
45,319 |
50,135 |
|
Flatbed |
- |
* |
* |
* |
* |
24,997 |
31,949 |
41,874 |
|
Tank |
- |
- |
- |
- |
- |
* |
47,656 |
49,788 |
|
Van |
- |
- |
- |
- |
- |
23,995 |
28,079 |
38,721 |
|
Reefer |
- |
- |
- |
- |
- |
19,390 |
24,775 |
41,426 |
|
Logging |
- |
- |
- |
* |
- |
* |
* |
50,004 |
|
Other |
- |
- |
- |
- |
- |
* |
31,498 |
31,800 |
|
SOURCE: Development of Truck Payload Equivalent Factor (TPEF), final report submitted to Office of Freight Management and Operations, Federal High-way Administration, Washington, D.C., by Battelle, 505 King Avenue, Columbus, Ohio 43201. June 15, 2007. Available at http://ops.fhwa.dot.gov/freight/freight_analysis/faf/faf2_reports/reports9/index.htm#toc.freight_analysis/faf/faf2_reports/reports9/index.htm#toc. |
||||||||


