
4
How and Where Will 10 Billion People Live on Earth?
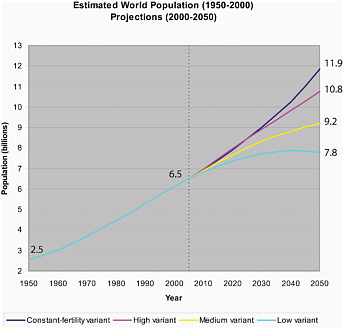
We live in the century of the city. In 2008, humanity crossed a milestone as it marked the first time that more people lived in urban areas than any other type of settlement. The United Nations forecasts that most of the global population growth in the coming decades will occur in urban areas. World population is expected to increase by 1 billion to 5 billion between 2007 and 2050 (UN, 2009),1 yielding a global total of between 7.9 and 12 billion people by 2050 depending on fertility and mortality trends (Figure 4.1).2 Under the medium-growth scenario, world population will be almost 10 billion by 2050, with an estimated 3.1 billion new urban dwellers.3 Notwithstanding uncertainties around the effect of HIV/AIDS and economic downturns on mortality and urban migration, the current scale of urbanization is unparalleled in history (Cohen, 2004).
An urbanizing global population has significant consequences—potentially positive as well as negative—for resource use, environmental sustainability, and ultimately, the well-being of humanity. The concentration of people and resources in dense urban settlements can reduce the energy consumed for buildings and transportation and can lower carbon dioxide emissions (NRC, 2009). Urban areas also provide
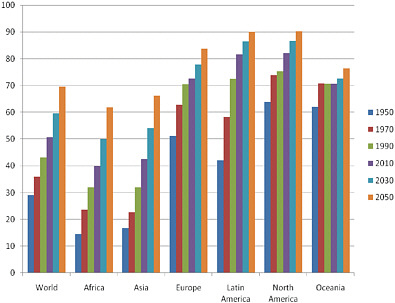
Most urban population growth will be concentrated in the developing world, particularly in Africa and Asia. Historically, urbanization has taken place primarily in more developed regions. In 1990, the populations of Europe, North America, Latin America, and Oceania were already more than 70 percent urban (Figure 4.2). In contrast, even by 2010, the urban population of Africa will barely approach 40 percent and Asia’s urban population will be less than half of the total population.
In addition to an urbanizing population, globally, the number of households is growing faster than population (Liu et al., 2003). In the United States, the average household size has been steadily declining, from 5.5 in 1850 to 4.5 in 1915 to 2.56 in 2008 (U.S. Census Bureau, 2004). In particular, the proportion of the population living in single-person households has increased significantly, from 7.7 percent in 1940 to 25.8 percent in 2000. The resulting increase in the number of households relative to population growth poses significant threats to biodiversity and natural resources because per capita consumption of resources is more closely aligned with the number of households than with the population per se (Liu et al., 2003). Not only does each household maintain its own residence, but total per capita living space has been increasing in many countries. In the United States, the average size of single-family homes increased from 1,500 ft2 (139 m2) in 1970 to 2,519 ft2 (234 m2) in 2008, an increase of more than 60 percent (U.S. Census Bureau, 2004). Similarly, in China, per capita residential living
|
1 |
United Nations Population Database, World Population Prospects, 2008 Revision. Available at www.esa.un.org/unpp/index.asp?panel=1 (accessed February 11, 2010). |
|
2 |
The high degree of variance reflects high levels of uncertainty in making population projections. |
|
3 |
The 0.6 billion difference between the increase in world population and urban population will be due to population growth occurring mainly in urban areas and rural to urban migration. economic opportunities and, in many places, are the engines of economic growth. |
space has tripled over a 27-year period, from 8.1 m2 in 1978 to 26 m2 in 2005 (National Bureau of Statistics of China, 2009).
It follows that we need to understand how 10 billion people will be allocated among households and distributed geographically across the world over the next 40 years. What processes create diverse patterns of human settlement? How is accelerating urbanization changing social, environmental, and economic conditions? The environmental challenges, resource requirements, infrastructure needs, energy demands, and governance issues associated with the unfolding growth in urban population raise fundamental, policy-relevant questions—and pose unprecedented opportunities for moving toward sustainability—that cannot be ignored as society navigates the urbanizing world of the 21st century. Thus, one of the biggest challenges facing humanity is how and where 10 billion people will live so as to reduce their environmental footprint. Given that most of these 10 billion people will live in cities, what are the consequences of an urbanizing Earth, and how can we reduce the negative impacts, while enhancing the positive impacts?
ROLE OF GEOGRAPHICAL SCIENCES
The study of human settlements is inherently an investigation of human–environment interactions, which requires spatially explicit data and analysis, an understanding of the interaction among places and across scales, and knowledge of the trade-offs among different land uses. Studies of the city, urban growth, urban-land-use theory, and the development of human settlements all have long traditions in the geographical sciences (Marsh, 1864). Much of the work on urban areas, their form and function in urban planning, urban economics, urban geography, and urban sociology, has drawn on the spatial land-use models of von Thünen (1826/1966), Burgess (1925), Muth (1961), Alonso (1964), and others.
Although cities have always depended on complex linkages with their immediate surroundings, as well as with more distant places, the speed, reach, and impact of these interconnections have become truly global, and will continue to be so. Understanding the processes and consequences of accelerating urbanization therefore requires tracing the web of connections and interactions that link people, places, and processes together. These linkages, which span environmental, cultural, social, economic, and political realms, mean that, for example, urbanization in one location affects demand for resources or waste disposal in another.
The geographical sciences have a long tradition of examining where, within urban areas, various kinds of people live, of investigating the processes that help to create such patterns, and of assessing the implications of residential patterning for variation in access to various opportunities such as jobs, medical care, or recreation. Since the 1960s, for example, studies have documented the ways in which urban settlements are distinguished by segregation along the lines of stage in the life course (e.g., singles, couples without children, families with children, and so on), socioeconomic status, and race and ethnicity. The spatial patterning of these dimensions is different in different regions of the world (Abu-Lughod, 1969), but in every place, the patterns of where people live within cities are the outcome of a mix of public policies and household preferences.
Modern geographical approaches and methods are generating insights into urban land-use patterns, from intracity to regional and global scales. The routine collection of imagery for most of Earth’s land areas by satellites provides an invaluable historical record covering more than three decades. This revolutionary development makes it possible to monitor human modification and urbanization of Earth’s surface across a range of spatial resolutions, from <1 m to the global scale (Sawaya et al., 2003; Zhang et al., 2004). Satellites such as Terra, Aqua, Landsat, and Tropical Rainfall Measuring Mission all provide data on the urban environment (Box 4.1).
The growing inventory of geographically indexed data makes it possible to combine satellite images with census and other information to develop analytically useful maps that show the distribution of human population around the world. For example, the Global Rural-Urban Mapping Project4 has generated a globally consistent and spatially explicit dataset of urban population distribution. Furthermore, advances in the development of analytical methods for geovisualization, geosimulation, and spatially explicit process models have simulated urban growth (Torrens, 2006); shown the linkages between places and scales over time (Kwan,
|
4 |
See sedac.ciesin.columbia.edu/gpw (accessed January 20, 2010). |
|
BOX 4.1 Remote Sensing Applications Related to Human Settlements The longest continuous observations of Earth are available through the Landsat Program, which has remotely monitored urban areas and urban growth since 1972. From the rate and magnitude of urban expansion, to population density and the global distribution of nighttime lights, satellite data have provided baseline information about the characteristics and geographical distribution of human settlements around the world. The long temporal record of satellite data is producing a clearer picture of the evolution of urban form (Herold et al., 2003; Seto and Fragkias, 2005), the impact of cities on prime agricultural land (Seto et al., 2000; Imhoff et al., 2004a), and the footprint of urban areas on local and global climate (Voogt and Oke, 2003; Jin et al., 2005; Shepherd, 2005). Data from the Moderate Resolution Imaging Spectroradiometer (MODIS) provide daily global coverage at 500-m to 1-km spatial resolution on urban characteristics such as land cover, surface albedo, aerosols, and land surface “skin” temperature (Engel-Cox et al., 2004; Zhou et al., 2004). Since 1992, the Defense Meteorological Satellite Program, Operational Linescan System (DMSP/OLS) has recorded low levels of visible and near-infrared radiance at night, making it possible to detect lights from cities, towns, and industrial sites (see Figure) (Small et al., 2005; Amaral et al., 2006). Below are examples of urban applications using satellite remote sensing data. 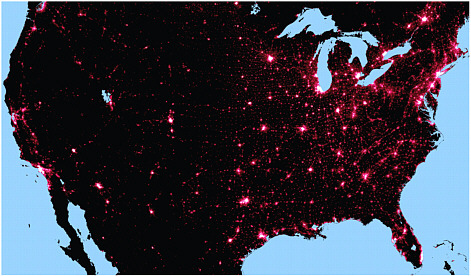 Nighttime lights in North America. SOURCE: National Atlas online database. Available at www.nationalatlas.gov/atlasftp.html#nitelti (accessed January 20, 2010). |
2000); and provided new visual representations of data for hypothesis generation (Carr et al., 2005).
As discussed in the introduction to this report, a hallmark of the geographical perspective is the recognition that human–environment interactions and responses to changed environments are “place-based,” meaning that they depend in part on particular circumstances and characteristics that coalesce in places. Especially important to a place-based analysis is the effort to understand how linkages between places shape the characteristics of settlements. Contemporary urban settlements in coastal China, for example, must be understood in the context of flows of people from villages in the countryside, flows of capital from the United States and elsewhere, and flows of raw materials and finished products that sustain manufacturing in these coastal cities (see Chapter 5). At the intraurban scale, point location data from cell phones can be aggregated at various scales to map the pattern and intensity of urban activities throughout the day, with enormous
potential for urban and transportation planning (Ratti et al., 2006).
RESEARCH SUBQUESTIONS
What forms of urbanization are most environmentally sustainable?
Although forecasts suggest that most population growth will occur in urban areas, much Less is known about which urban forms have fewer negative environmental consequences. From the design of local neighborhoods and the layout of a city, to the regional configuration of city clusters and the global geographical distribution of urban areas, how and where urban areas develop affects resource use, biodiversity, carbon emissions, and ultimately environmental sustainability. Although it is well recognized that denser, more compact settlements reduce urban growth and the physical footprint of cities, the environmental and social trade-
offs between certain shapes and sizes of cities and among distributions of cities across different ecosystems and geographical locations remain poorly understood. Cities represent the most human-dominated landscapes on Earth, but what are the consequences of different paths of urban development? What urban forms minimize resource use such as water, energy, and building materials? What are the consequences for ecosystem services, habitat fragmentation, or biodiversity of clustered urban development vs. noncontiguous metropolitan regions? What are the environmental trade-offs of 3 billion new urban dwellers being housed in megacities such as Seoul and Shanghai vs. smaller urban centers such as Chonju and Harbin?
Urban areas and urban expansion are prime causes of habitat fragmentation, habitat loss, and species extinction (McKinney, 2002). Worldwide, the transformation of landscapes for urban development has driven plant extinctions (Hahs et al., 2009). In the United States, urbanization affects more species than does any other human activity (Czech et al., 2000). The wildland-urban interface, where developed urban areas meet undeveloped wildland, is a focal zone for habitat fragmentation, the introduction of exotic species, and loss of biodiversity (Radeloff et al., 2005).
Not only do cities transform landscapes, but also urban form and urban densities affect resource use. Extensive low-density suburbanization in the United States has contributed to the growth in total vehicle miles traveled (see Chapter 7, Figure 7.1) and reduced nonmotorized travel by transit, bicycle, or foot. Extensive urban development also leads to the conversion of productive agricultural land and environmentally important ecosystems. Given increasing urbanization, which pathways of urban development will reduce the demand for energy and allow for more ecosystem services? It has long been suspected that urban land development patterns such as the density of employment and population, diversity of mixed uses, and the design of neighborhoods and streets affect the demand for travel and energy use (Cervero and Kockelman, 1997). More compact development through higher residential and employment densities can reduce energy consumption and carbon emissions. However, the energy and emissions savings are likely to be small in the short term, because the benefits of land-use changes and the reversal of current development patterns will take decades to be realized. Furthermore, the life span of the built environment and the cumulative effects of land-use change results in an increase in the cumulative savings in energy and emissions (NRC, 2009).
In the next 40 years, patterns and rates of urbanization will vary by region and within regions. The ways in which these settlements develop will affect lifestyles, landforms, and livelihoods. For example, there is growing evidence that low-density urban development is positively correlated with automobile dependence, which in turn affects walkability, physical activity, and obesity (Ewing et al., 2006; Frank et al., 2006). An epidemiological study of more than 1,500 research papers on the relationship between the built environment and obesity found that 84 percent of the studies reported a positive association between low-density urbanization and obesity (Papas et al., 2007). By definition, urban expansion transforms land cover, but where urban growth occurs also affects local ecosystem processes. The growth of Phoenix, Arizona, for example, has dramatically altered the Indian Bend Wash watershed through restructuring stream channels and creating artificial water lakes in the city (Roach et al., 2008; see also Chapter 3).
Worldwide, the fastest growing cities will be in Africa and Asia, and many of these fast-growing cities of tomorrow are just small towns today. There is, therefore, significant opportunity to direct the form of urban development and for science to help shape policies that can lead toward more sustainable and less environmentally and socially disruptive cities. An important part of the science needed to support such policies is the incorporation of uncertainty into models and scenarios of urban development.
A key question is which urban forms are more sustainable under different environmental and sociocultural conditions. For example, cellular automata research has generated insight into the evolution of urban land-use patterns and dynamics (White and Engelen, 1993; Batty, 1997; Clarke et al., 1997). Coupling cellular automata models and agent-based models can simulate decision making and represent complex spatial interactions of stakeholders (Parker et al., 2004). Spatially explicit multiscale models of urban expansion and land-use change can provide environmental indicators such as carbon sequestration, habitat fragmentation, and biodiversity (Alberti and Waddell, 2000; Theobald, 2005; Verburg et al., 2008). A growing
research community is coupling historical approaches with modern geographical methods to reconstruct the spatial history and urban ecology of cities (e.g., the Mannahatta Project5 and the Spatial History Project6). For example, a spatial historical analysis that compares the growth of Bangalore, India, with Silicon Valley in the United States shows that roads drive expansive urban development and farmland loss in Silicon Valley, but not in Bangalore (Reilly et al., 2009). Satellite image analysis can provide information on what configurations, forms, and size of human settlements have the least ecological impact. For example, nighttime city lights derived from satellite data have been used to assess the effect of urban development on soil resources (Imhoff et al., 1997) and net primary productivity (Milesi et al., 2003). Satellite data have also been used to map the effect of urban expansion on long-term ecological changes (Ellis et al, 2006), agricultural land loss (Seto et al., 2000), and forest fragmentation (Wang and Moskovits, 2001). Geographical data and geographical analysis can also help quantify the spatial structure of urban development (Seto and Fragkias, 2005; Keys et al., 2007) and evaluate the effects of urban form on water use (Jantz et al., 2004; Guhathakurta and Gober, 2007), energy demand (Ewing and Rong, 2008), and air quality (Stone et al., 2007).
How can urban areas adapt to and become more resilient to global environmental change?
Human-induced alterations and transformations of Earth drive environmental changes that are global in scale (Vitousek, 1992). At the same time, global environmental change will have a wide spectrum of effects on urban areas. Climate-related effects on urban areas include increases in temperature, heat stress, sea-level rise, storm surges, threats to building stock, energy and transportation infrastructure, and urban flooding, drainage, and landslides (NRC, 2008c). The increase in the frequency and magnitude of extreme events such as wind, snow, ice storms, hurricanes, and heat waves will threaten building stock, energy and transportation infrastructure, and ultimately the well-being of urban populations. Studies of the 1995 and 1999 Chicago heat waves conclude that housing infrastructure, in particular active cooling systems, was the strongest protective factor against heat-related death (Naughton et al., 2002). Existing transportation infrastructure may not have been designed to withstand extreme events associated with climate change. The vulnerability of transportation and energy infrastructure will depend on the rate of warming, the types of extreme events that occur, and new design standards for buildings and infrastructure. How can urban areas adapt to the suite of global environmental changes?
The ability of urban areas to cope with changing global environmental circumstances depends on geographic location in relation to a range of physical and human circumstances, the capacity of local political and economic institutions to deal with disruption, and the organization and physical character of the built environment. Different types of global environmental changes (e.g., sea-level rise, extreme heat, or prolonged drought) can also affect urban adaptive capacity in variable ways. Around the world, evidence is growing that there is an increase in extreme weather and climate events (Alexander et al., 2006). In North America, droughts are becoming more severe, heavy precipitation events are more frequent and intense, and severe storms are increasing in power and frequency (CCSP, 2008). These intense weather and climate events could pose major threats to urban systems and disrupt urban activities. Furthermore, depending on the nature of extreme events, they could exacerbate existing local environmental conditions—reducing water quality, threatening sanitation and public health, worsening local air quality, and intensifying the urban heat island effect.
However, climate change is not the only type of global environmental change to which urban areas will need to adapt. Changes in the hydrological cycle and water availability will constrain future urban growth and require water quantity management across multiple jurisdictions of metropolitan areas (Holway, 2009). Cities near rivers and in delta systems will be particularly threatened by flooding and landslides. Thirteen percent of the world’s urban population lives in low-elevation coastal zones, defined as coastal regions less than 10 m above sea level (McGranahan et al., 2007). These coastal communities will be particularly vulnerable to sea-level rise and storm surges.
More comprehensive knowledge and understanding of global environmental change and its consequences
|
5 |
See www.mannahattaproject.org (accessed January 20, 2010). |
|
6 |
See spatialhistory.stanford.edu (accessed January 20, 2010). |
for urban areas will be needed if local decision makers, communities, and individuals are to prepare, cope, and adapt to these changes (Sánchez-Rodríguez et al., 2005). Adaptation research has focused on two issues (Burton et al., 2002): (1) How can adaptation reduce the impacts of climate change, and (2) what types of adaptation policies are needed? More than 20 cities around the world—particularly in Europe and North America—are in the process of developing local climate change adaptation and action plans. For example, the Chicago Climate Action Plan outlines strategies for mitigating climate and actions to prepare for climate change adaptation. Similarly, the London Climate Change Adaptation Strategy identifies key climate risks and prioritizes adaptation strategies. However, recent research shows that local adaptation strategies may conflict with mitigation efforts. One community on the north coast of Australia’s New South Wales has a policy that requires new residential developments to maintain vegetative cover and preserve wildlife habitat for the local koala population. To achieve these goals, however, the developments must be low density and car dependent, which in turn increases driving and energy consumption. Furthermore, siting homes in natural vegetation also increases exposure to other climate change risks such as fire (Hamin and Gurran, 2009).
Advances in spatially explicit modeling and geographical simulation can deepen understandings of how cities can be more resilient to global environment change. A first step in evaluating possible adaptation and mitigation strategies is knowledge about where cities are growing and their vulnerabilities to global change (Chapter 3). In many African countries, urban population statistics are out of date or lacking, making the task of mapping the location and growth of urban settlements particularly challenging (Cohen, 2004). In these regions, much of the housing is informal (Satterthwaite, 2007). Because censuses are absent, infrequent, or unreliable in many regions and because informal settlements often lack official recognition, many of these settlements become “invisible towns” (Stickler, 1990), highlighting the need for studies using modern geographical tools to map and understand settlement locations and growth patterns.
There is a similar need to understand the patterns of urbanization in Asia, where 16 of the world’s 27 largest urban agglomerations will be located by 2050. Accurate and timely mapping and forecasting of urban settlements will be important for a range of applications, including anticipating infrastructure needs; planning for emergency response systems (Kwan and Lee, 2005); identifying regions and communities at risk from storm surges, sea-level rise, and natural hazards; and mapping urban growth and loss of natural and agricultural land (Hasse and Lathrop, 2003). Cellular automata models that were initially developed by Von Neumann (1966) are now used widely to predict urban growth in a range of cities around the world, including San Francisco (Clarke et al., 1997); Beijing, China (Chen et al., 2002); Chillán, Chile (Henríquez et al., 2005); and Lagos, Nigeria (Barredo and Dermicheli, 2003). Other methods are being developed that do not have large data requirements and will be especially applicable in developing country contexts (Fragkias and Seto, 2007). Understanding where and how intra- and interurban settlements are changing, or are likely to change, provides fundamental information and insights to urban planners and policy makers. Innovations in the geographical and computer sciences—especially online mapping and real-time geographic information systems (GIS)—are bringing together different types of spatial data from multiple sources (from governments to individuals) to increase their timeliness and utility for societal benefit. Rather than using static risk or hazard maps that suggest that vulnerability is unchanging, dynamic GIS with real-time information and real-time computing can provide up-to-date information on the distribution of vulnerability across landscapes and can differentiate risk among different communities within cities (Bankoff et al., 2004). For example, as in other parts of the world, most of the largest Asian cities are located on a river bank, in a delta, or along the coast (UN Habitat, 2008), making them particularly vulnerable to climate change, sea-level rise, flooding, and other extreme events. In the case of the 2004 Asian tsunami, GIS-based vulnerability models coupled with demographic methods of tsunami-displaced populations were used to quantify mortality estimates, methods that could also be used in the early stages of disaster relief (Doocy et al., 2007).
The uncertainties associated with climate change, as well as with the formation of human settlements, pose challenges for analysts and policy makers alike. Advances in geovisualization and geosimulation can help inform adaptation strategies under different
TABLE 4.1 Various Pathways Through Which Urbanization Affects the Climate System
|
|
Urban Land Cover |
Urban Aerosols |
Anthropogenic Greenhouse Gas Emissions |
|
Urban heat island (UHI) and mean surface temperature record |
Surface energy budget |
Insolation, direct aerosol effect |
Radiative warming and feedbacks |
|
Wind flow and turbulence |
Surface energy budget, urban morphological parameters, mechanical turbulence, bifurcated flow |
Direct and indirect aerosol effects and related dynamic/thermodynamic response |
Radiative warming and feedbacks |
|
Clouds and precipitation |
Surface energy budget, UHI destabilization, UHI mesocirculations, UHI-induced convergence zones |
Aerosol indirect effects on cloud-precipitation microphysics, insolation effects |
Radiative warming and feedbacks |
|
Land surface hydrology |
Surface runoff, reduced infiltration, less evapotranspiration |
Aerosol indirect effects on cloud-microphysical and precipitation processes |
Radiative warming and feedbacks |
|
Carbon cycle |
Replacement of high net primary productivity land with impervious surface |
Black carbon aerosols |
Radiative warming and feedbacks, fluxes of carbon dioxide |
|
Nitrogen cycle |
Combustion, fertilization, sewage release, and runoff |
Acid rain, nitrates |
Radiative warming and feedback, NOx emissions |
|
SOURCE: Seto and Shepherd (2009). |
|||
urbanization and global change scenarios. For example, the WaterSim Project7 simulates water supply and demand in a desert city. The simulation and forecast tools being developed in conjunction with this project can help cities evaluate policies to adapt to a water-constrained environment.
What are the impacts of accelerating and large-scale urbanization on local and regional climate patterns?
There is a growing scientific understanding of the relationship between urbanization and climate (Voogt and Oke, 2003; Shepherd, 2005). Urbanization alters climate through multiple pathways (Table 4.1).
Locally, the conversion of vegetated surfaces to urban areas modifies surface energy balance dynamics (Lo et al., 1997; Banta et al., 1998). Altering the exchange of heat, water, trace gases, aerosols, and momentum between the land surface and overlying atmosphere leads to the urban heat island effect, which is characterized by elevated daytime and nighttime temperatures in and near urban areas compared to non-urban or rural areas (Arnfield, 2003; Crutzen, 2004). The urban heat island effect is further affected by the interaction among building geometry, land use, and urban materials (Oke, 1973; Arnfield, 2003).
Urban areas have been shown to produce a warming trend over regional climate (Kalnay and Cai, 2003), and there is mounting evidence that urban areas also affect precipitation (Lowry, 1998; Shepherd and Jin, 2004). It has long been known that urban areas alter their regional and microclimates, resulting in an increase in rainfall downwind (Landsberg, 1970). Empirical evidence shows that in some regions, urban expansion and urban air pollution result in a decline in rainfall (Amanatidis et al., 1993; Rosenfeld, 2000; Kaufmann et al., 2007). In other places, urbanization has induced precipitation and possibly created thunderstorms, leading to significant anomalies in precipitation patterns (Figure 4.3) (Dixon and Mote, 2003). In places where it has been shown that urban areas increase rainfall, the difference can be as much as 5 percent to 25 percent (Mote et al., 2007). In addition to the quantity of rainfall, cities can also affect the timing and formation of thunderstorms and the severity of precipitation, as has been found for Tokyo (Yonetani, 1982), Beijing (Guo et al., 2006), Atlanta (Bornstein and Lin, 2000), Mexico City (Jauregui and Romales, 1996), among others. These changes imply
|
7 |
See watersim.asu.edu/ (accessed January 20, 2010). |
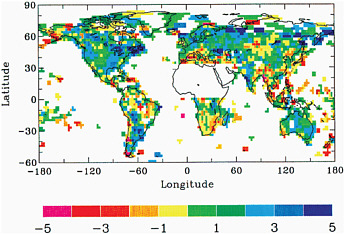
FIGURE 4.3 Annual precipitation anomalies, 1900–1988. Regions in blue show an increase in precipitation over the mean during the 1900–1988 period. Regions in red have become relatively drier during the same period. Areas without data are shown in white. SOURCE: Dai et al. (1997).
that urban land uses and urban expansion through land-cover change can affect local, regional, and global climate at diurnal, seasonal, and long-term scales (Stohlgren et al., 1998; Zhou et al., 2004).
A clearer picture is emerging that urban areas can affect climate at different scales. However, we lack a comprehensive understanding of the dynamics by which urban expansion will affect climate; nor do we understand the interactions between local-scale dynamics and regional and global patterns. We also have a fragmented picture of urban land-use patterns at a global scale. Most analyses of urban land use are based on individual case studies of city or metro regions, and there are few comparative, regional, or global studies (Seto and Shepherd, 2009). We have a good understanding of some of the ways that urban areas affect climate at several scales, but we lack comprehensive understanding, and more importantly, an understanding of how urban growth—or different forms of urban growth—will affect climate. Given the magnitude of the global urban transition of the 21st century, there is an urgent need to understand the impact of urban land-use change on precipitation and temperature, and to forecast scenarios of urban expansion and their possible impacts on precipitation changes. How will the growth of settlements affect rainfall and temperatures at local, regional, and global scales?
Continued advances in understanding the link between urban land use and regional climate will require mining a variety of data—from remote sensing of clouds, aerosols, and land to field-based meteorological data on temperature and precipitation. It will require modeling urban climates at fine spatial scales to understand the effect of building materials, street geometry, and building geometry on local temperatures (Oke, 1973, 1981), explicit treatment of urban land use in climate models (Bonan et al., 2002; Jin et al., 2005), and techniques for downscaling general circulation models (Wilby and Wigley, 1997).
SUMMARY
Urbanization in the 21st century will have far-reaching effects ranging from the local to the global. Understanding where people will live and how cities will develop in the future has implications for all aspects of human and environmental well-being discussed in this report, from the provision of food for a growing urban population to safeguarding our planet’s biodiversity and ecological services. New geographical data and emerging analytical methods, combined with existing research tools and techniques will help develop a more coherent and complete understanding of the patterns, implications, and uncertainties of urbanization.


