
10
How Might We Better Observe, Analyze, and Visualize a Changing World?
The observation, mapping, and representation of Earth’s surface have been an integral part of geographical research since Ancient times, and these activities remain central to the modern geographical sciences. Maps of Earth’s surface have provided an essential underpinning to a long series of research breakthroughs, such as the theory of continental drift and plate tectonics, our understanding of patterns of early human migration, inferences about the causes and transmission of disease, and global climatology. Today, the tasks of documenting, visualizing, and understanding the increasing rate of change that we observe on the planet’s surface are far more complex than traditional mapmaking, demanding an increasingly elaborate network of Earth-observing satellites, ground-based observers and sensors, servers, and broadband communications, and the tools to analyze, model, and visualize. Collectively, these systems exploit decades of research by geographical scientists, represent an infrastructure investment that accounts for tens of billions of dollars annually, and address needs in all walks of life, from the work of scientists striving to understand and perhaps to predict, to the broader interests of the media and the general public, to the needs of emergency managers, planners, and a host of other professionals.
In recent years, the rate of development of new tools and data sources has been spectacular. Today most computer users are familiar with sites such as Google Earth, Microsoft’s Virtual Earth, and other virtual globes that allow them to visualize the current physical appearance of Earth’s surface using imagery obtained from satellites, aircraft, or specially equipped vehicles. Many people make daily use of navigation systems, and of the host of Web-based services that now link diverse sources of data based on geographical location (Box 10.1). However, despite these developments, the geographical tools, knowledge, and understanding with which humanity faces the uncertainties of the 21st century are inadequate in many respects. Surprisingly, conventional mapmaking has been in decline worldwide for several decades (Estes and Mooneyhan, 1994), and many basic maps, including those covering the United States, are no longer updated. Although Web-based virtual globes display stunningly detailed images of how the geographical world looks, they provide little sense of how the world is changing, how it will look in the future, how certain or uncertain we may be about future states, and how the world works as an interconnected system. The general public makes use of these technologies to obtain driving directions and to look at recent events around the world, but gains very little understanding of the many problems that humanity faces, and the options available for dealing with them that have been discussed in previous chapters. The methods of analysis that search for pattern, anomaly, and correlation in geographical information reflect the needs of an earlier, slowly changing world and its somewhat leisurely pace of investigation, rather than the rapidly changing planet of the new century, and its need for quick, science-based response.
Geographical data and tools are now essential for the full range of research disciplines that study the Earth’s surface and near surface, from the social sciences
|
BOX 10.1 Linking Information Sources with Geographical Location Geographical location is now widely used on the Web as a means to link two or more existing sources of information to create a new service, providing information that would otherwise have been unavailable. These combined services are commonly known as mashups, from a term used in the recording industry to refer to music created by combining previously independent tracks. Together they form what is often termed the GeoWeb, a spider’s web of services held together through the use of geographical location, whether expressed as latitude/longitude, place name, street address, or any other convenient system of georeferencing. As an example, houses listed for sale on Craigslist (www.craigslist.com) are first analyzed by a mashup service to obtain their street addresses, which are then converted to latitude/longitude using a Web-based geocoding service (see Figure). The mashup service, www.housingmaps.com, combines these coordinates with a mapping service (Google Maps, maps.google.com) to provide detailed and useful maps of where houses are listed for sale, along with other information about the house—something that neither Craigslist nor Google Maps is capable of providing on its own. 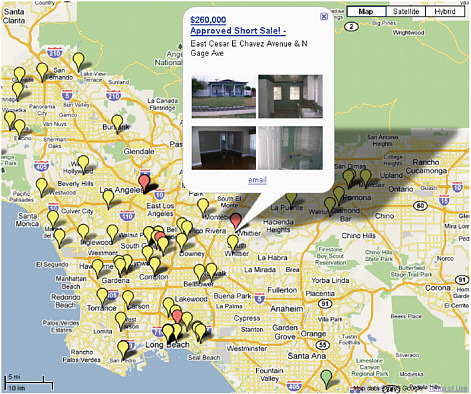 A map of houses currently listed for sale in the $150,000-300,000 price range by Craigslist for part of Los Angeles. This www.housingmaps.com mashup combines Craigslist data with Google Maps. SOURCE: www.housingmaps.com. |
such as criminology or political science to the environmental sciences such as climatology or ecology. They are an absolute necessity if scientific understanding is to be translated into effective evidence-based and place-based policy, and if the average citizen is to become fully informed and engaged in discussions about potential uses and abuses of geographical technologies.
Earth observing satellites provide powerful observations of the physical parameters that characterize the Earth system, including sea-surface temperatures, rainfall, and land cover. Geographical scientists have benefited from the massive investments that have been made not only by U.S. government agencies, but also by the private sector and by agencies in other countries. They have discovered effective means of turning raw sensor measurements into characterizations of the land surface, and have applied these in numerous ways, many of them discussed in other chapters of this report (e.g., Chapters 2, 3, and 4). However, many of the social aspects of the Earth system cannot be observed or measured from above, and understanding of them must therefore rely on people’s willingness to divulge sensitive information about themselves in programs such as the U.S. Census.
ROLE OF THE GEOGRAPHICAL SCIENCES
The activity of describing and drawing the world—the literal root of the term geography—has changed dramatically over the centuries. An editorial in Nature (Editorial, 2008) went so far as to argue that our museum collections are full of specimens collected at vaguely recorded locations (Guo et al., 2008), but there is now no longer any excuse for not recording the location of any scientific observation made of phenomena on or near Earth’s surface. For many researchers much of the science of cartography, or the drawing of maps that accurately convey knowledge, has been encapsulated in a series of default options in software. Access to the products of remote sensing, once a task requiring a great deal of technical knowledge, is now reduced for many users to the manipulation of the simple user interface of a desktop or laptop computer, or even a hand-held PDA (personal digital assistant).
However, although it has undoubtedly become easier to work with geographical data and tools, we should not confuse the act of “describing and drawing” phenomena with the geographical knowledge and understanding that are embedded in today’s tools and data acquisition systems, or with the processes of reasoning and inference that translate raw observations into scientific knowledge and ultimately into improved decisions. Even though it is possible to make a decent-looking and informative map by doing no more than accepting the default options of a software package, the science of cartography is still an active field. Remote sensing, a workhorse of modern geographical data acquisition, continues to advance, making use of new kinds of sensors that exploit different parts of the electromagnetic spectrum, access a broader range of acoustic frequencies in the case of marine remote sensing, and achieve finer levels of spatial, temporal, or spectral resolution, and each new development opens opportunities for research into additional applications in the geographical sciences.
None of these developments, however, has in any way reduced the importance of expertise in reasoning and inference, and it is clearly in this area that the role of the geographical scientist is most critical (Longley et al., 2005). No one would suggest, for example, that technology has in any way reduced the need for expert pedologists, both as creators of knowledge about soils and as interpreters of that knowledge to users, even though that knowledge may be expressed through the simple medium of a map. Similarly the expertise of the cultural geographer in observing and interpreting the human landscape can never be encapsulated in software. Geographical scientists understand the nature of particular classes of phenomena through their training and knowledge of the literature. They are aware of the importance of spatial concepts such as scale, location, place, and interaction (Gersmehl, 2005); are familiar with their underlying theories and the pitfalls associated with each; and are capable of making effective use of the geographical data and tools at their disposal to augment the sum of human knowledge about the geographical landscape, while remaining cognizant of the inevitable uncertainty associated with that knowledge.
Past investments in research into geographical data and tools have produced dramatic progress. The stunning zooms and pans of the virtual globes rely on fundamental research by geographical scientists into ways of capturing the curved surface of the planet in digital form, a research area known as discrete global
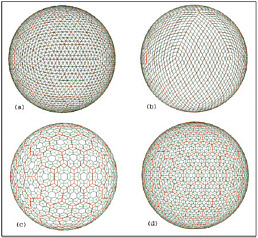
FIGURE 10.1 Illustrations of icosahedron-based discrete global grids at several resolutions. SOURCE: Sahr et al. (2003).
grids or geodesic grids (Figure 10.1), and on research in computer graphics into managing the level of detail in various parts of the visual field (level-of-detail management). Research on geographical semantics is making it possible to integrate data across national boundaries despite differences in mapping practice, terminology, classification schemes, and data formats (Figure 10.2; Goodchild et al., 1999). Much more is known now about the sources of uncertainty in geographical data, about visualizing its importance, and about modeling its impact on the results of analysis (Zhang and Goodchild, 2002). New techniques of geovisualization allow geographical data to be displayed simultaneously from many different perspectives, leading to new insights and the generation of new hypotheses (Figure 10.3). Significant advances have been made recently by geographical scientists in areas such as visualizing dynamic, multidimensional phenomena (Dykes et al., 2005; Slocum, 2009) and adapting mapmaking to the needs of the visually impaired (Golledge et al., 2005; Rice et al., 2005). All of these make use of digital technology, but require expertise not only in computer science but also in the disciplines that are intimately concerned with phenomena on Earth’s surface. There is no doubt that progress will be at least as dramatic in the future, as geographical scientists explore the opportunities created by advances in mainstream information technology, by new sensors, and by new ways of thinking about the role of the geographical perspective as a cross-cutting theme in science. The following questions illustrate lines of research that would be particularly productive to advance this topic.
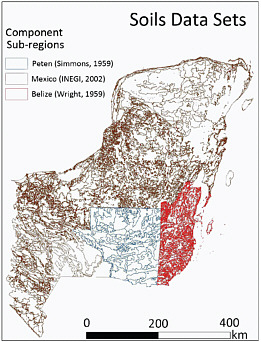
FIGURE 10.2 Soil map of the Yucatan Peninsula compiled from datasets from three different countries: Mexico (brown), Belize (red), and Guatemala (blue). For clarity, only the boundaries between areas of homogeneous soil are shown. Note the different densities of boundaries, indicating differences between national standards and practices (and also state standards in Mexico). SOURCE: Sifuentes (2005).
RESEARCH SUBQUESTIONS
How will new geographical knowledge be acquired and shared?
Many of the more recent developments in geographical technology relate to data gathering. Satellite remote sensing (Jensen, 2007), which dates from the
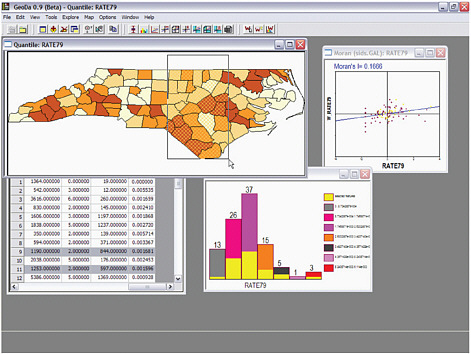
FIGURE 10.3 Screenshot from the software package GeoDa, developed for the exploration and analysis of geographical data and available free for download from the GeoDa Center at Arizona State University, geodacenter.asu.edu/. This example shows data on the rate of sudden infant death syndrome by North Carolina county from four different perspectives: map (upper left; darkest colors depict the highest rates), table (lower left), histogram (lower right); and in the upper right, a scatterplot of each county’s rate against the average of its neighbors, a plot that allows the easy identification of counties with anomalous rates that stand out from their neighbors. The rectangle, which can be maneuvered by the user, results in the highlighting of contained counties in every window. SOURCE: GeoDa 0.9 (Beta).
spy satellites of the Cold War, has evolved into a multinational enterprise producing terabytes of data per day on various characteristics of Earth’s surface, at spatial resolutions that now extend to the submeter level. Passive sensors gather radiation from the surface in visible and near-visible wavelengths, while active sensors “ping” the surface using radar, light, and microwave radiation to create accurate maps of topography, of land cover and snow, and of the immediate subsurface. Satellite-based remote sensing also provides needed inputs for models of the atmosphere that lead to accurate forecasts of temperature, rainfall, and extreme events; for monitoring of sea-surface temperature; and for a wide range of other parameters. Similarly, acoustic remote sensing, which dates from the naval vessels of World War II, has grown exponentially in importance, given the need for detailed mapping and analysis of water-column properties for climate change studies, of the related need for ocean fisheries habitat restoration and conservation, and for seafloor or subseafloor energy extraction and tsunami modeling. The geographical sciences have been central to the design of these systems; to the techniques used to interpret imagery to identify crop types, land-cover types, benthic habitat types, and biomass production; and to the research that emerges from the detailed analysis of the results (Jensen, 2005, 2007; Lillesand et al., 2008). They will continue to do so as the science of remote sensing advances in the coming years. Finer spatial resolution, more frequent overpasses, finer spectral resolution to allow more accu-
rate identification of cover and habitat types, more reliable tools for classification, faster processing, and more effective systems for distributing data will all work to enhance the benefits of remote sensing to science, to the development of public policy, and to the work of a myriad of agencies and communities.
Recently, there has been much interest in ground-based remote sensing, using networks of fixed, autonomous sensors capable of gathering useful information on properties of the environment. Sensor networks now provide a steady flow of information on worldwide sea levels, allowing scientists to test predictions of sea-level rise; they provide a cheap and dense network of ground-based weather measurements; and they provide a steady flow of useful information on traffic densities on roads.
However, there are obvious limits to what can be observed, identified, and measured from remote sensors, whether in space, on the ground, or in the ocean. People use place names, distinctive landmarks, and addresses to describe locations, but maps of these are created by humans on the ground. Data on demographics, socioeconomic status, and all of the wealth of information created by censuses, surveys, and other mechanisms for gathering social data are available only from people, and only by expensive processes of official data gathering. It is important that researchers find ways of sustaining these processes despite their cost and what appears to be an increasing unwillingness of some members of the public to participate.
An active and promising line of research by geographical scientists focuses on the use of unconventional sources to elicit or infer detailed social information. For example, Longley developed powerful techniques for deriving spatially detailed social data using personal names (Longley et al., 2007; Gibin et al., 2008), while the field of geodemographics (Harris et al., 2005) mines spatially disaggregated social statistics to sort neighborhoods into distinct social types. Recently, a range of projects has focused on eliciting and compiling detailed geographical data from the general public, a topic discussed in greater detail in Chapter 11. In all of these cases research is needed to understand the quality and usefulness of the results and to protect the interests of the providers in preserving confidentiality.
Underlying all of these approaches to data acquisition is the problem of sustaining long-term programs that can yield useful longitudinal data. All too often geographical datasets are no more than snapshots, obtained at a few times over a short interval. Changing technology, lack of interest, and the short-sighted nature of many programs present a major obstacle to any concerted effort to build lengthy time series that can support analysis of change. We run a real danger that, in the not too distant future, much of what we now know about the planet through our current programs of remote sensing will be lost because of a lack of both the resources and the organizations needed for long-term preservation. Research is needed to identify robust approaches to preservation, to ensure easy and reliable access by the researchers of the future.
What techniques will be needed to visualize Earth futures?
In an address written for the opening of the California Science Center in Los Angeles in early 1998, Vice President Al Gore expanded on an idea he had first proposed in 1993 (Gore, 1993) for an immersive environment he termed Digital Earth, which would let its users explore a visual representation of the planet. The idea of a digital replica of Earth, or mirror world, also appears in Neal Stephenson’s novel Snowcrash, published in 1992.
Although the technology of 1998, with its limited Internet connectivity and lack of advanced three-dimensional graphics, made this concept seem almost impossibly futuristic, by 2005 the average personal computer had sufficient power in visual display, and a sufficient number of households were connected by broadband communications, to make Gore’s basic vision a reality for millions of people. In that year Google acquired, rebranded, and substantially enhanced a 4-year-old software product called Earthviewer, and launched the result as Google Earth, in many ways an implementation of what Gore had described 7 years earlier. Several other virtual globes have followed, and more than 300 million copies of the Google Earth client software have been downloaded. Most users are content to zoom from global to local scales to see their own houses and neighborhoods, but the publication of the Google Earth application programming interface has allowed users to create literally hundreds of thousands of applications. Google Earth has been
described as “the democratization of GIS [geographic information systems]” (Butler, 2006) because it has allowed millions of users to become familiar with some of GIS’s very basic operations.
However, although virtual globes allow us to see a rough approximation of how the world looks (at the time the base imagery was acquired), Gore goes on to describe how a Digital Earth could be used to explore both the past and the future of the planet. Our ability to simulate the future relies on our understanding of the processes, both social and environmental, that shape the planet, and to do so at apparently increasing rates. Google Earth now has the ability to display a sequence of snapshots representing the development of some phenomena through time, and many mash-ups have been created to show historical data, but the ability to visualize future scenarios by exploiting our understanding of processes remains essentially futuristic. Enhancing forward-looking visualizations will require research in many disciplines (Craglia et al., 2008), including the geographical sciences, on topics such as the following:
-
Methods to use the spatial structure of virtual globes (discrete global grids) as the basis for a range of simulation models;
-
Methods of visualization that go beyond the current emphasis on rendering a realistic approximation of Earth’s surface appearance, and include properties that are abstract or nonvisual in nature, such as personal income, gross domestic product, or rainfall;
-
Standards and mechanisms that allow a user to search not only for data, but also for simulation models, and to implement them in a virtual globe environment;
-
Tools that allow models of a wide range of processes, from environmental to social, to be represented using a common and reusable set of software primitives;
-
Methods for downscaling predictions to the local level, so they can be made meaningful in a local context; and
-
Ways of enhancing understanding of the uncertainty associated with simulations of process, and of how that uncertainty can be displayed on a virtual globe and communicated to the user.
Today, detailed forecasts of global climate change are readily available in the scientific community, but the high level of technical and domain expertise needed to access them limits their value. Policy makers and individual citizens are far more likely to respond to such forecasts when they can see their implications locally. The idea of bringing the global message home, of localizing the global, was very much part of Gore’s original vision for Digital Earth—and far beyond what we can do today.
How can geographical tools be adapted to a world that needs just-in-time answers?
Because of the legacy of mapping relatively static phenomena, our methods of analysis are similarly geared to so-called cross-sectional data, or data of spatial distributions at one point in time. This limitation is exacerbated by the tendency for many social data-gathering exercises, such as the U.S. Census, to take place at fixed intervals. Remotely sensed images have also provided timed snapshots, although the effective frequency of overpasses has been improving recently as more satellites are launched, allowing the recovery effort following the Wenchuan earthquake in China in May 2008, for example, to make use of images collected from dozens of satellite sensors. Another reason for the paucity of lengthy time series has been the difficulty of maintaining the flow of public resources needed to keep large-scale, expensive government data-gathering programs in operation decade after decade.
As change accelerates and as sensor networks begin to provide densely sampled data in both space and time, we will need to add rapidly to our collection of spatio-temporal techniques of analysis. At this time, we know little about how to analyze and mine the increasing supply of data resulting from the tracking of vehicles, people, and animals (Miller and Han, 2001). We know little about how to assess the significance of an apparent change on Earth’s surface detected by remote sensing. We need a comprehensive battery of easy-to-use models to simulate a range of social and environmental processes, and to investigate the footprints they leave on Earth’s surface.
Even more urgent is the need for methods that can continuously monitor the stream of data coming from our acquisition systems, searching constantly for
anomalies and novel patterns, and initiating appropriate investigations. Such real-time analysis of medical diagnoses by primary care physicians, for example, could provide early warning of disease outbreaks and health hazards. Data coming from individuals could be used to provide early assessments of the damage from disasters, and could speed the initiation of response. Spatial decision-support systems based on real-time streams of data could provide new levels of effectiveness in the management of numerous social and environmental problems.
SUMMARY
Advances in technology in the contemporary area present new opportunities and challenges for the age-old task of observing, mapping, and representing Earth’s changing geographical character. Pursuit of the illustrative research questions presented in this chapter will enable the geographical sciences to collect, analyze, and share information in ways that are critical to the multidisciplinary task of understanding and assessing the human and environmental processes that are shaping the future of the planet.


