
2
Scope of the Problem
In the first workshop panel, epidemiologists from the United Kingdom (Klim McPherson, Visiting Professor of Public Health Epidemiology, Oxford University, and Chair of the National Heart Forum) and the United States (Cynthia Ogden, Epidemiologist, National Center for Health Statistics, CDC) provided overviews of the obesity problem in the United Kingdom and the United States, respectively. Their remarks revealed that the increasing prevalence of obesity became apparent earlier in the United States than in the United Kingdom, but that the problem is serious in both countries:
-
In the United Kingdom, the prevalence of obesity among boys was about 11 percent in 2000 and 16 percent in 2009, and is projected to be about 25 percent in 2020. Among girls, the prevalence was 11 percent in 2000 and 13 percent in 2009, and is projected to be about 20 percent in 2020.
-
In the United States, the prevalence of obesity among boys was about 14 percent in 2000 and 18 percent in 2008, and is projected to be about 27 percent in 2020. Among girls, the prevalence was about 14 percent in 2000 and 16 percent in 2008, and is projected to be about 22 percent in 2020.
-
Prevalence in adults in both countries has also increased. Overall, the median of body mass index (BMI) has shifted higher in both countries.
-
Obesity affects people across demographics and income levels in both countries, but the data do reveal some disparities. Examples
-
were presented not to compare or contrast, but to describe differences in the population. For instance, the UK data show some disparity by social class for adult women, with a significant difference in prevalence between lower- and upper-income women being predicted by 2020. The US data for childhood obesity show some disparities by race, sex, ethnic group, and education of the head of the household.
-
Low levels of physical activity and consumption of healthy foods and increases in the consumption of less healthy foods over the past few decades account for the worsening situation in both countries.
-
A leveling off of obesity rates among children in both countries may offer some hope that the epidemic is abating. Whether this is the start of a positive trend is still not clear, however, and a dangerously high number of people remain at risk.
It should be noted that definitions of “overweight” and “obese” can differ slightly. Generally, in both countries, an adult who has a BMI between 25 and 29.9 is considered overweight, while an adult with a BMI at or above 30 is considered obese. The data for US children presented by Ogden use the CDC 2000 growth charts to define excess weight: an overweight child is defined as at or above the 85th percentile of BMI-for-age but less than the 95th percentile, and an obese child as at or above the 95th percentile.
OBESITY AS A GROWING EPIDEMIC IN THE UNITED KINGDOM
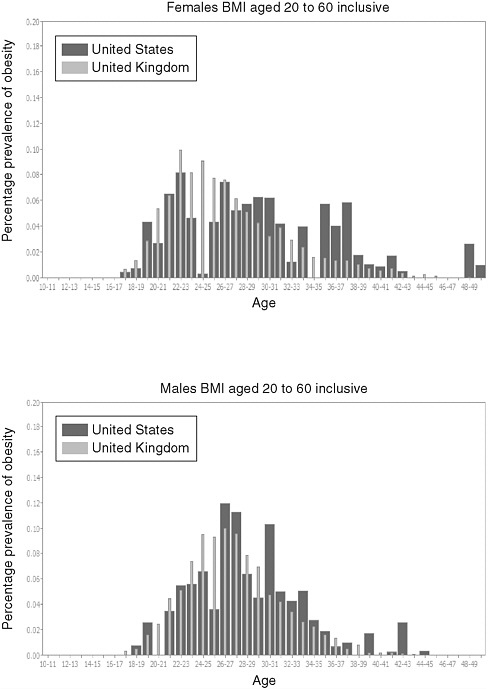
McPherson characterized obesity as a worldwide problem. The United Kingdom’s obesity prevalence rates lag behind those of the United States by 7 to 10 years, but, as indicated by the statistics reported above, the UK numbers are on the rise. According to data from CDC and the Health Survey of England, the percentages of adults with BMI categorized as overweight and obese are roughly similar in the two countries, although the United States now has more people at the extremes, that is, more thin and morbidly obese individuals, especially women (Figure 2-1).
These prevalence rates have implications for future morbidity. For example, McPherson estimated that one-quarter of adult males in the United Kingdom will have Type 2 diabetes by 2040.
Reversing the Trend
The UK government commissioned Foresight—Tackling Obesities: Future Choices, a report to better understand the obesity epidemic and identify strategies for addressing it (Box 2-1). The findings in that report were
|
BOX 2-1 The United Kingdom’s Foresight—Tackling Obesities: Future Choices Commissioned and overseen by the government’s Chief Scientist, who reports directly to the Prime Minister, the Foresight report was released in 2007 and has significantly influenced public debate and government policy in the United Kingdom. The report provides data on current conditions with respect to obesity, projections of an even more dire situation in the future, and concrete recommendations for ways to prevent these projections from being realized. According to the report, by 2050, 60 percent of men and 50 percent of women will be obese, with a cost to society of almost £50 billion. The problem cannot be solved solely through a change in individuals’ actions, but requires changes throughout society and involving government, civil society, and the private sector. Among the promising areas identified are:
The report came at an opportune time, providing scientifically sound information when concern was on the rise. As discussed throughout the workshop, the UK government drew heavily on the Foresight report to craft a cross-government strategy to combat obesity, backed up by resources and high-profile leadership. SOURCE: UK Government Office for Science, 2007. |
used in developing Healthy Weight, Healthy Lives: A Cross-Government Strategy for England. The strategy’s initial focus is to reduce the proportion of overweight and obese children to 2000 levels by 2020. According to McPherson, the next few years of data should enable an understanding of the impact of the United Kingdom’s concerted efforts and policies to reduce obesity.
In 2000, 22 percent of boys and 27 percent of girls were overweight or obese in the United Kingdom. Health Survey of England data for 1993 to 2007, as well as predictions in the Foresight report, indicate the difficulty of returning to these levels by 2020. As noted earlier, however, more recent data show a slight leveling off of prevalence among children, offering some basis for optimism that the Healthy Weight, Healthy Lives goal may be
achievable. To track progress toward that goal, researchers had to decide how far back to analyze the data. An 8-year retrospective was selected as yielding the most relevant and comprehensive information to allow more conclusive projections.
Social Class Effects
McPherson summarized data on BMI among adults in England and Wales delineated by social class, with Class I as the highest, professional class; Class V as unskilled, manual labor; and Classes II, III, and IV ranging between these two in income and occupation. (The “middle class”—Class III—is further divided into manual and nonmanual labor categories.) Among males, rates of obesity were between about 20 and 25 percent across these social classes in 2000 and are projected to increase to between 40 and 50 percent fairly evenly across class by 2020. Among women, obesity rates are also generally increasing across social classes (projected to be between about 38 and 48 percent by 2020), with the exception of women in Class I (projected to be about 15 percent in 2020). A further disparity is that rates of BMI greater than 40 are projected to be about 2 percent among Class I women by 2020, compared with 18 percent among Class V women. As discussed later in the workshop, this disparity could potentially lead to alienation among lower-income women striving for a healthier weight and lifestyle if their needs and perspectives are not addressed.
PREVALENCE, TRENDS, AND CONTRIBUTING FACTORS IN THE UNITED STATES
Ogden presented on obesity prevalence and trends and disparities in obesity rates in the United States, as well as factors contributing to the obesity problem. Estimates for children are not age-adjusted.
Obesity Among Children and Adults
In 2005–2006, using the definition based on the 2000 CDC BMI-for-age growth charts, 15.5 percent of US children and teens aged 2 to 19 (about 11.4 million) were obese, and 30.1 percent were overweight or obese (about 22.1 million in total). In the early 1970s, the rates were flat, with about 5 percent of children obese. However, from the mid-1970s to mid-2000s, the prevalence rates tripled for girls and boys nationwide (Figure 2-2).
As alarming as the figures are for children, the prevalence rates among adults are more than twice as high: just under 35 percent of men and just over 35 percent of women were obese in 2005–2006. As with children, the prevalence rates have spiked since the 1970s. In addition to the higher
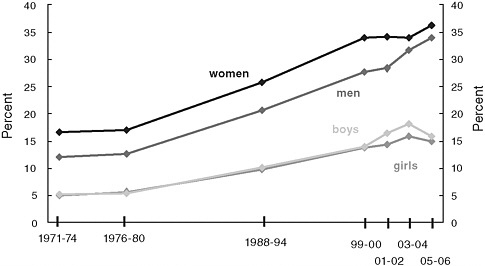
FIGURE 2-2 US trends in obesity by age and sex, 1971–1974 through 2005– 2006.
prevalence of obese people, a shift has occurred in these past few decades so that overall, the mean and median BMI of the overall US population have shifted higher.
Disparities in Obesity Rates
Ogden presented data showing some disparities in the prevalence of obesity among US girls and boys by demographics and income level in 2001–2006:
-
Race and ethnicity—Mexican American school-aged boys (aged 6 to 11) have a higher prevalence of obesity than their non-Hispanic white and non-Hispanic black counterparts. Earlier data showed no discrepancy across ethnic groups for boys. African American girls (aged 6 to 19) have a higher prevalence of obesity than their non-Hispanic white and Mexican American counterparts.
-
Education of head of household—Among non-Hispanic African American girls and non-Hispanic white boys, children (6–19 years of age) in families whose head of household had more education (for example, a college degree) had a lower prevalence of obesity than did those in families whose head of household had less education.
-
Income level—Among non-Hispanic white boys, aged 6 to 19, there was an inverse relationship between income and obesity prevalence. Those with higher income were less likely to be obese compared to those in lower income groups; otherwise, there were no significant relationships between income and obesity for other sub-groups of children.
These numbers are certainly variable: they do not point to across-the-board effects of race, ethnicity, education, or income. However, they reveal some disparities that policy makers must consider in developing solutions.
Behind the Numbers
To help explain the possible reasons behind the increased prevalence of obesity and the shift toward higher median and mean BMI, Ogden presented information on changes in diet and physical activity in the United States. In short, Americans are eating larger amounts of less healthy foods, eating more frequently and in bigger portion sizes, and engaging in little physical activity.
Americans have increased their overall caloric consumption in the last 30 years. Among children, consumption of sugar-sweetened carbonated beverages, salted snacks, and pizza has increased, while consumption of milk and vegetables has decreased. Children also report eating more frequently, with 20 percent saying they eat seven or more times a day. Food eaten outside the home accounts for almost half of households’ total food expenditures.
Meanwhile, physical activity levels are low. The number of children who engage in the recommended 60 minutes of physical activity a day is small: about 50 percent of those aged 6 to 11, dropping to less than 20 percent after age 12. Likewise, 35 percent of teens report that they watch more than 3 hours of television per day, and 25 percent report using a computer outside of school more than 3 hours per day. Few schools offer daily physical education to high school students, with the percentage dropping from 9th through 12th grade.


