
2
National Inventories of Greenhouse Gas Emissions
All countries that are party to the United Nations Framework Convention on Climate Change (UNFCCC) are required to provide national inventories of emissions and removals of greenhouse gases due to human activities. These inventories form the basis for monitoring the progress of individual countries in reducing emissions and for assessing the collective effort of countries to mitigate climate change. The inventories provide self-reported estimates of selected anthropogenic greenhouse gases for four sectors: energy; industrial processes and product use; agriculture, forestry, and other land use (AFOLU); and waste. Countries prepare the estimates using methods developed by the Intergovernmental Panel on Climate Change (IPCC) and approved by the UNFCCC. The methods generally involve multiplying national data on an emissions-generating activity, such as cement production, by an emission factor that specifies greenhouse gas emissions per unit of activity. This chapter describes current practices for developing greenhouse gas inventories, summarizes the accuracy of estimates for the gases and activities responsible for most of the emissions, and identifies improvements that would facilitate monitoring of emissions for an international climate treaty.
DEVELOPING AND REPORTING NATIONAL INVENTORIES
UNFCCC National Inventory Reporting and Review
UNFCCC reporting and review requirements for national inventories differ for developed (Annex I) and developing (non-Annex I) countries. As a result, the scope and quality of national inventories vary greatly. Developed countries annually report calendar-year estimates for all sources and sinks of the six greenhouse gases specified by the UNFCCC (carbon dioxide [CO2], methane [CH4], nitrous oxide [N2O], sulfur hexafluoride [SF6], perfluorocarbons [PFCs], and hydrofluorocarbons [HFCs]) going back to 1990. The estimates are broken down by sector and into categories within a sector (e.g., aluminum production within the industrial sector). The national inventories, along with detailed documentation of the methods and data sources used to calculate emissions and removals, are submitted electronically in a standard format to facilitate data analysis and comparison. Similar regulations govern reporting of chlorofluorocarbons (CFCs), but these fall under agreements other than the UNFCCC.
The national inventories of developed countries are subject to international review by teams of greenhouse gas inventory experts. These reviews do not attempt to reconstruct the inventory or verify estimates with independent data, but rather assess whether correct methods and appropriate data sources were used to produce the inventory. Statistical analysis of reported data is also performed to identify inconsistencies within a report or with previously submitted reports. In addition, data are analyzed across countries to determine a range of expected levels of emissions per unit of output or activity (implied emission factors) and to identify deviations from these values. Where possible, data submitted by countries are compared with data compiled by international organizations. For example, national statistics used to estimate energy emissions are
compared to International Energy Agency (IEA) data, and statistics used to estimate agriculture emissions are compared to UN Food and Agriculture Organization (FAO) data. If anomalies are identified by this analysis, the review teams dig deeper into that country’s methods and data. Unless otherwise indicated, the inventory methods discussed in this chapter pertain to developed countries.
Reporting requirements are much less rigorous for developing countries. Emission inventories are reported only periodically in conjunction with a broader national report of climate change programs and activities. There is no set frequency for these national reports and their submission often depends on the provision of international funding. As a result, most developing countries have submitted only one national inventory to date. Reporting of only CO2, CH4, and N2O is required and only at the sector level, not for categories within each sector. Developing countries are not required to provide emissions trends over time or to document methods and data sources, and their inventories are not reviewed.
IPCC Methodologies
The IPCC’s National Greenhouse Gas Inventory Program is responsible for developing methods for creating national inventories of greenhouse gas emissions. The IPCC guidelines describe how to estimate national emissions of CO2, CH4, N2O, SF6, PFCs, and HFCs from anthropogenic sources and sinks using national statistics (activity data) and activity-based emission factors for the four sectors. Guidance is also provided on data sources, data collection methods, quantification of uncertainties, management of inventories, quality assurance and control, documentation, and data archiving. The guidelines have evolved over time to include more emissions sources and to improve and standardize the methodologies. The first edition of the IPCC guidelines was completed and approved in 1994; the most recent (2006) edition has not yet been endorsed by the UNFCCC and is thus not yet used for reporting purposes. However, the 2006 guidelines are expected to be adopted as the basis for reporting national inventories beginning in 2015.
The IPCC methodologies are intended to yield national greenhouse gas inventories that are transparent, complete, accurate, consistent over time, and comparable across countries. Because different countries have different capacities to produce inventories, the guidelines lay out tiers of methods (typically three) for each emissions source, with higher tiers (Tier 3 is normally the highest) being more complex and/or resource intensive than lower tiers. The higher-tier methods usually incorporate country-specific conditions, data, and emission factors and are thus considered more accurate than the lower-tier methods. For example, the Tier 1 method for calculating CO2 emissions from stationary combustion uses default emission factors for each fuel type, whereas the Tier 2 method requires each country to develop and use country-specific emission factors for each fuel type (see detailed guidance in Gómez et al., 2006). The Tier 3 method uses emission factors that are not only country-specific, but also differentiated by technology and operating conditions. The choice of method used for a particular source in a particular country depends on (1) the importance of that source to the level and trend of emissions in that country and (2) the resources available to prepare the inventory. Countries are encouraged to use country-specific data and emission factors to the extent possible. However, they are not expected to use higher-tier methods if doing so would jeopardize their ability to estimate other important emissions sources. The scope of the effort to prepare the U.S. inventory is described in Box 2.1.
Implications for Monitoring and Verification
Although multiple greenhouse gases are emitted from multiple activities in multiple sectors, the monitoring and verification problem is comparatively simple because only a few activities and greenhouse gases are responsible for the large majority of emissions. Table 2.1 summarizes emissions by sector for Annex I countries as a group, and Figure 2.1 compares emissions across sectors for Annex I and non-Annex I countries. The most important simplifying message is that well over 90 percent of global greenhouse gas emissions are in the energy and AFOLU sectors, making these sectors an obvious focus for monitoring. Energy alone is responsible for almost 90 percent of total net greenhouse gas emissions from Annex I countries and more than 40 percent of net emissions from developing countries. In both groups, CO2 from fossil-fuel
|
BOX 2.1 Preparation of the U.S. Greenhouse Gas Emissions Inventory Preparation of a national greenhouse gas emissions inventory is a major undertaking, involving many people and agencies in a typical Annex I country. The current version of the IPCC guidelines for inventory preparation is a five-volume set of books with several hundred pages of formulas, supporting data, sample calculations, reporting formats, and technical references. In the United States, the Environmental Protection Agency is ultimately responsible for planning and preparing the national inventory, but it relies on many other agencies and individuals for data, scientific information, analysis, and review. Contributors to the inventory include the Department of Energy, U.S. Department of Agriculture (U.S. Forest Service, Agricultural Research Service, National Agricultural Statistics Service), U.S. Geological Survey, Department of Transportation (including the Bureau of Transportation Statistics), Department of Commerce, Federal Aviation Administration, Department of Defense, and Colorado State University. Many private sector contractors and academic and research institutions from all sectors of the economy also contribute data and analysis to the inventory. The majority of emissions in the U.S. inventory are estimated using the highest-tier methods, and its preparation has stimulated some original research to improve basic understanding and emissions coefficients. The U.S. inventory also undergoes separate expert and public review before publication and submission to the UNFCCC. |
combustion comprises the bulk (90 percent) of energy emissions.
The AFOLU sector is responsible for approximately 30 percent of global greenhouse gas emissions (Figure 2.1) but represents a much greater component of emissions in developing countries than in developed countries because of tropical deforestation and lower levels of industrial development. Agriculture contributes 15 percent of emissions in the developing world and deforestation contributes 35 percent. The figures are lower for Annex I countries, with agriculture emissions of less than 10 percent of the total and forests representing a net sink for CO2 (note the negative sign for the Annex I forestry emission in Table 2.1). In contrast, emissions from the industrial and waste sectors in both Annex I and non-Annex I countries are an order of magnitude lower than emissions from the energy and AFOLU sectors.
A second simplifying message is that fewer than one quarter of the 185 countries in the World Resources Institute database were responsible for more than 80 percent of global emissions in 2000 (Figure 2.2). This concentration of sources has increased over the last decade with the surge in fossil-fuel emissions from a few rapidly growing, developing economies. Because developed countries and the largest emitting developing countries are likely to be the focus of mitigation efforts under a new climate treaty, their emissions will be of particular importance for monitoring.
The many activities and gases in the two most important sectors—energy and AFOLU—are cataloged in the next section. The most important gases in these sectors are CO2, CH4, and N2O. Corresponding material for the industrial and waste sectors, including a discussion of CO2, HFCs, N2O, and CH4, is contained in Appendix A.
TABLE 2.1 Sectoral Emissions from Annex I Countries for 2007
|
Sector |
Fraction of Total Emissionsa |
Fraction of Sectoral Emissions by Gas |
|||||
|
CO2 |
CH4 |
N2O |
HFCs |
PFCs |
SF6 |
||
|
Total |
1.00 |
0.81 |
0.12 |
0.06 |
0.01 |
0.00 |
0.00 |
|
Energy |
0.91 |
0.94 |
0.05 |
0.01 |
0.00 |
0.00 |
0.00 |
|
Industrial processes |
0.08 |
0.69 |
0.00 |
0.07 |
0.18 |
0.03 |
0.03 |
|
Solvent and other product use |
0.00 |
0.48 |
0.00 |
0.52 |
0.00 |
0.00 |
0.00 |
|
Agriculture |
0.08 |
0.00 |
0.47 |
0.53 |
0.00 |
0.00 |
0.00 |
|
Land use, land-use change, and forestry (LULUCF)b |
–0.09 |
1.04 |
–0.03 |
–0.01 |
0.00 |
0.00 |
0.00 |
|
Waste |
0.03 |
0.07 |
0.90 |
0.06 |
0.00 |
0.00 |
0.00 |
|
Other |
0.00 |
0.95 |
0.02 |
0.02 |
0.01 |
0.00 |
0.00 |
|
aThe disparate gases were added assuming their global warming potential with a 100-year time horizon. Each number in the table represents the sum of values from the national reports of all Annex I countries. Each value has its own confidence level, which varies with the gas and the national and sectoral source of emissions. No composite uncertainty calculations have been attempted. bFor Annex I countries, this sector overall is a net sink due to sequestration of CO2. In national inventories, this is shown as negative emissions. Because emissions of CH4 and N2O in this sector are positive, the fraction of LULUCF that they represent is shown as a negative. SOURCE: <http://unfccc.int/ghg_data/ghg_data_unfccc/items/4146.php>. |
|||||||
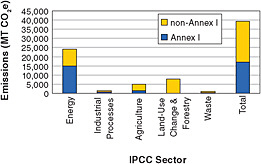
FIGURE 2.1 Greenhouse gas emissions by sector in 2000 for Annex I and non-Annex I countries; 2000 is the most recent year for which comprehensive data on the greenhouse gases are available. SOURCE: Data compiled from the Climate Analysis Indicators Tool, Version 6.0, World Resources Institute, <http://cait.wri.org/>.
SECTOR-BASED REPORTING
Energy
In most Annex I countries, CO2 from energy use dominates anthropogenic greenhouse gas emissions. The CO2 emissions from fossil-fuel combustion accounted for 80 percent of total greenhouse gas emissions (on a CO2-equivalent basis) in the United States in 2006 (EPA, 2008). Other emissions from the energy sector include CO2 from the non-energy use of fossil fuels (e.g., as petrochemicals, solvents, lubricants), CH4 from fuel production and transport systems (e.g., coal mines, gas pipelines), and N2O from transportation systems.
Carbon Dioxide. Most estimates of CO2 emissions from energy systems are based on self-reporting of fuel consumption. Emissions are estimated from the amount of fuel burned, the carbon content of the fuel, and the efficiency of combustion (i.e., the fraction of fuel that is left unoxidized or incompletely oxidized at the point of combustion as, for example, carbon monoxide or ash). The fraction left unoxidized is small in modern combustion systems, and the IPCC now suggests using the default assumption that 100 percent of the carbon in a fuel is fully oxidized (IPCC, 2006). A challenge is that the amount of fuel burned is generally measured in mass or volume units and the carbon content is not generally measured. There is a good cor-
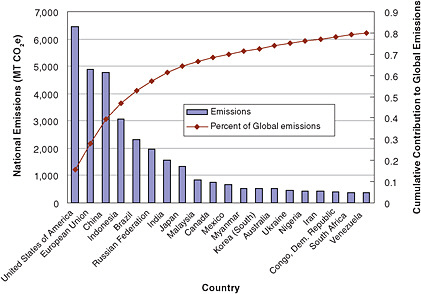
FIGURE 2.2 National greenhouse gas emissions from all IPCC sectors of the top 20 emitters in 2000. Note that the 27 countries in the European Union are treated as one. SOURCE: Data compiled from the Climate Analysis Indicators Tool, Version 6.0, World Resources Institute.
relation between the carbon content of fuels and their energy content, so conversion from mass or volume units to energy content permits the carbon content to be estimated, but with greater uncertainty (see, for example, IPCC, 2006; Marland et al., 2007; EPA, 2008, particularly Annex 2).
Direct data on fuel consumption are not always available. In some cases, CO2 emissions can be estimated using models that represent the major fuel-consuming processes, such as the amount of CO2 emitted per vehicle-mile of travel. At national scales, it is sometimes appropriate to estimate consumption from the amount of fuel produced and the net of imports and exports. However, fuel may not be consumed where and when it is made available. For example, fuel sold to ships, planes, or even road vehicles may be carried out of the country and burned elsewhere.1 Data on fuel production or consumption will generally record when and where the fuel passed some point in the distribution chain. Models based on parameters such as vehicle-miles traveled or flight patterns can approximate when and where consumption takes place, but they are not widely used. Moreover, it is difficult to capture the demonstrated tendency for travelers to purchase fuel where it is cheapest (e.g., Banfi et al., 2003).
Combustion of biomass fuels is reported to the UNFCCC, but the associated CO2 emissions are not. In theory, biomass removes CO2 from the atmosphere when growing and releases CO2 back to the atmosphere when burned, so a sustainably managed system should have no net CO2 emissions. Fossil fuels used in the production, harvest, and transport of the biomass are counted in the fossil-fuel emission inventories. When sustainably produced ethanol is combined with gasoline as a fuel, the emissions counted are only those from combustion of the gasoline fraction. Similarly, if waste is used as a fuel and the waste includes both biomass and fossil-fuel-derived materials, only the CO2 emitted from the fossil-fuel fraction is generally counted. Any net emissions of CO2 from unsustainable use of biomass fuels should be captured as a decrease in the amount of biomass in the AFOLU sector. Thus, CO2 emitted from the conversion of forested land to biofuels feedstock production, for example, would be included in the AFOLU inventory. This can lead to incomplete accounting of emissions if burning of biomass fuels occurs in a reporting country but the decrease in biospheric carbon stocks occurs in a nonreporting country (e.g., see Marland and Schlamadinger, 1997; Searchinger et al., 2009).
Fossil fuels are used for a variety of applications. For example, asphalt is used for roads and roofs, oils are used as lubricants and solvents, and a variety of petrochemicals are used in plastics and fibers. In the United States, more than 6 percent of the carbon in fossil fuels used in 2006 ended up in non-fuel applications (EPA, 2008), and this number can be higher in countries with large petrochemical industries. Some of the carbon used in these applications will be oxidized over time, often at slow rates (e.g., products in landfills). The IPCC provides guidance on estimating the lifetime, fate, and greenhouse gas emissions from these products. However, emissions are diffuse in both time and space, and only approximate values can be assigned to product fates and lifetimes and to changes in stocks over time.
Methane and Nitrous Oxide. Emissions of CH4 and N2O depend on fuel characteristics, combustion technology and maintenance, pollution-control equipment, system leakage, and prevailing current practice. Emissions occur as a result of both combustion processes and leaks from production and transport facilities such as coal mines and gas pipelines. Emissions vary widely, and emissions estimates are generally based on broad indicators and aggregate emission factors. Uncertainty is greater than for CO2 emissions from combustion, but the sources are generally small and emissions estimates for Annex I countries have been improving with increasing interest in mitigation.
Agriculture, Forestry, and Other Land Use
The AFOLU sector is responsible for about 30 percent of global anthropogenic emissions, predominantly in the form of CO2 emissions from land-use change (dominated by tropical deforestation) and CH4 and N2O emissions from farming and animal husbandry (Smith et al., 2007). Emissions vary over space and time, depending on how the land is used and on
the local climate, topography, and soil and vegetation properties. Currently, greenhouse gas emissions from land-use change are highest in tropical areas of South America, Southeast Asia, and to lesser extent, Africa (Houghton, 2003; Achard et al., 2004; DeFries et al., 2007).2 In contrast, extratropical regions in the northern hemisphere have recently produced carbon sinks (Figure 2.3 bottom) because of net forest regrowth from earlier harvesting or encroachment on abandoned agricultural land and other processes, such as sequestration of carbon in landfills and water reservoirs and woody encroachment into pastures. These sinks are thought to absorb roughly 5-20 percent of global fossil-fuel emissions (CCSP, 2007). Methane and N2O emissions are highest in regions with intensive, high-input agriculture (Figure 2.3 top), predominantly in Europe, North America, China, and India. Globally, agricultural emissions of CH4 and N2O have increased by about 1 percent per year since 1990 (Smith et al., 2007).
Estimating emissions from land-use activities is challenging due to the distributed nature of emission sources, the multitude of different processes involved, and the fact that much of the carbon is belowground in soils. Many countries simply use aggregate land-use statistics (i.e., activity data) and default emission factors (Tier 1 methods), but a number of Annex I countries use more advanced methods, employing a mixture of remote sensing, ground measurements and surveys, and process-based models. Ground surveys, where available, provide complementary information on land use and management, and ground-based measurements of carbon stock change are used to calibrate models and provide estimates of uncertainty. Models can also be calibrated with CO2 and non-CO2 flux measurements and related biological data. Remote sensing provides spatial information on land cover and surface characteristics (e.g., vegetation type, species, forest age; EPA, 2008) and is sometimes used to directly estimate emissions associated with land-use change (e.g., Richards, 2001).
Dominant sources and sinks for the AFOLU sector include CO2 emissions and removals from woody biomass and soils; CO2, CH4, and N2O emissions from fires; CH4 emissions from livestock and manure management and from rice cultivation; and N2O emissions from soil management (especially nitrogen fertilization) and manure management. Other emission sources that may be locally important but are less significant globally include soil liming, organic soil cultivation, and non-rice managed wetlands or flooded lands. Long-lived harvested wood products are a potential CO2 sink, although the average lifetime of wood products is relatively short (20 years) and UNFCCC accounting rules for them have not yet been agreed upon.
Carbon Dioxide. Net CO2 release or uptake in managed lands is estimated from changes over time in five carbon stocks: above- and belowground biomass, dead organic matter (coarse woody debris and litter), and soil organic matter. Declines in ecosystem organic carbon stocks represent net CO2 emissions to the atmosphere, and increases in stocks represent net CO2 removals from the atmosphere. Carbon stock changes are calculated for six major land categories (forestland, cropland, grassland, settlements, wetlands, and other land) and for land-use change between categories (IPCC, 2006). Predominant carbon stock changes (and hence CO2 fluxes) are associated with changes in forestland area, land use (deforestation and afforestation), and the relative carbon balance determined by growth versus harvest and natural mortality and decay. Studies of CO2 emitted from land-use change have adopted different variables to keep track of changes in land and biomass, making it difficult to compare results directly with IPCC reporting (Ito et al., 2008).
Agricultural Methane. The largest sources of agricultural CH4 are enteric fermentation in the digestive system of ruminants and other livestock, livestock waste, and emissions from paddy (flooded) rice. The simplest methods (Tier 1) for estimating enteric fermentation are based on emissions per animal for each major species. Countries that have additional information on livestock demographics (e.g., sex and age classes), feed quality, and intake rates can incorporate energy balance calculations to make more accurate estimates of CH4 emissions (Tier 2). Conventional agricultural
|
2 |
As a result of high tropical deforestation rates, the Conference of Parties to the UNFCCC has been considering offering economic incentives to avoid greenhouse gas emissions by changing forest management practices. See details of the COP 11 and COP 13 meetings at <http://unfccc.int/meetings/archive/items/2749.php>. |
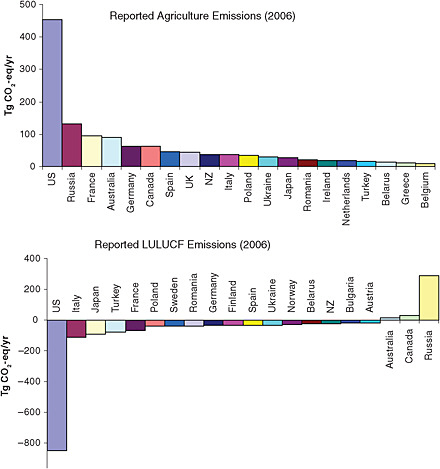
FIGURE 2.3 Annex I countries with the highest reported emissions or removals of greenhouse gases from agricultural sources (top) and from forestry and other land-use sources (bottom) in 2006. Greenhouse gases are reported as CO2 equivalents. Negative emissions represent removals of CO2 from the atmosphere. SOURCE: Data compiled from national greenhouse gas inventory reports; <http://unfccc.int/ghg_data/ghg_data_unfccc/>.
statistics kept in most Annex I and some non-Annex I countries provide accurate estimates of the number of animals by major species, but not always detailed information on animal nutrition. Emission factors for CH4 from livestock waste are estimated by using manure production rates from livestock statistics, along with information on how manure is stored and managed (e.g., waste lagoons, dry lot, composted). The primary controlling factors for emissions from flooded rice are water management (length and periodicity of flooding; Li et al., 2002; Frolking et al., 2004), organic matter management (i.e., crop residues, manure; Wassmann et al., 1996; van der Gon, 1999), and cultivar type.
Agricultural Nitrous Oxide. Approximately 3-5 percent of nitrogen added through fertilization and, to a lesser extent, fossil-fuel combustion is subsequently emitted as N2O (Crutzen et al., 2008; Galloway et al., 2008) through microbial processes in soils. Both direct emissions (i.e., those occurring at the location of nitrogen addition) and indirect emissions (i.e., those stemming from nitrogen that is volatilized or leached
and redeposited elsewhere, often in nonagricultural soils, and then emitted as N2O) are considered in AFOLU inventories. Most countries use aggregate activity data on the amount of nitrogen added to soils (from synthetic fertilizer, manure, biological nitrogen fixation from leguminous plants, and crop residues) and emission factors to estimate fluxes, although the United States and some other Annex I countries are employing more disaggregated simulation model-based approaches to reduce uncertainty. At the country level, synthetic fertilizer nitrogen production and use are well quantified from industry production and trade statistics (approximately 25 percent of global production is internationally traded) maintained by trade organizations (e.g., International Plant Nutrition Institute) and FAO. Other nitrogen addition sources such as biological nitrogen fixation and manure additions are more uncertain. Quantities of other nitrogen losses (as ammonia, nitrogen oxides, and leached nitrogen) and their contribution to indirect N2O emissions are also highly uncertain.
Emissions from Fires. Under IPCC guidelines, CO2 fluxes from forest fires on managed lands are incorporated in estimates of ecosystem carbon stock changes. Emissions of CH4, N2O, and greenhouse gas precursors (e.g., carbon monoxide, nitrogen oxides, volatile organic compounds) from incomplete combustion are inventoried separately for forests, grasslands, and crop-lands as a function of the area burned, pre-fire carbon stocks, and fire seasonality. The areal extent of fires can be estimated from satellite imagery (Giglio et al., 2006, 2009), although many short-duration fires and smaller (<500 m) individual fires are difficult to detect via satellite (Al-Saadi et al., 2008).
LIMITATIONS OF NATIONAL INVENTORIES FOR MONITORING
National greenhouse gas inventory reporting currently has a number of limitations for a new climate treaty. These include poor reporting by developing countries, uncertainties in reported data (which are especially high for some sources and some greenhouse gases), and lack of data to independently verify the activity data or the condition-specific emission factors used to prepare emission estimates. The problem would be most severe for a treaty that includes commitments from developing countries, many of which lack the infrastructure and capacity to collect, analyze, and manage inventory data consistently. In addition, our ability to compare inventories with data derived from other methods is limited by incomplete coverage of greenhouse gases, the time lag between the occurrence of emissions and the completion of inventories, and the lack of spatial information.
Infrequent, Incomplete, and Unreliable Reporting for Non-Annex I Countries
The establishment of rigorous reporting and review guidelines and requirements through the UNFCCC has led to the creation and steady improvement of national greenhouse gas inventories in Annex I countries over the past decade (Breidenich and Bodansky, 2009). There are still high levels of uncertainty in the estimates for biogenic sources, gases other than CO2, and some sectors and activities with low total emissions (see below). However, uncertainties in national totals are relatively low for Annex I countries due to their well-developed statistical systems and capacity to use higher-tier methods. The fact that most of their emissions are from fossil-fuel combustion, which has low uncertainty, also reduces the overall uncertainty of these inventories. Current uncertainties in annual emissions estimates for Annex I countries are of comparable magnitude to emissions reductions commitments, and this suggests that multiyear trends could be verified if the remaining uncertainty is considered properly (Jonas and Nilsson, 2007; Swart et al., 2007).
In contrast, national inventories of many developing countries generally have greater uncertainty and are not sufficiently rigorous to enable monitoring of emissions. The low quality of national inventories in developing countries largely reflects a lack of financial, technical, and institutional capacity. Funding to prepare national inventories is provided by the Global Environment Facility,3 but it is sporadic and insufficient to
|
3 |
The Global Environment Facility is a partnership among 178 countries, international institutions, nongovernmental organizations, and private companies that provides financial assistance to help countries meet their obligations under international agreements and conventions, including the UNFCCC. See <http://www.gefweb.org/>. |
enable consistent collection and processing of activity data or to maintain institutional capacity for inventory preparation over time. For example, even when international donors provide assistance in data collection and processing, the questionnaires on energy production and consumption that are distributed annually by the United Nations and IEA statistical offices are returned incomplete or not at all by many countries. Finally, land-use changes and agriculture frequently comprise a substantial source of emissions in developing countries, and reliable data in these sectors are often not available.
Uncertainty in Self-Reported Data
The uncertainty in estimates of greenhouse gas emissions from self-reported data depends on the uncertainty in both activity data and methods used to calculate the inventory. Uncertainty in activity data depends largely on a nation’s commitment to data collection and processing but also on its measurement capabilities. Uncertainty in methods depends on knowledge of parameters such as the heating value and carbon content of fuels used nationally, which is used to derive emission factors, and on knowledge of biochemical processes, such as denitrification in agricultural soils. In general, estimates of greenhouse gas emissions from fossil-fuel consumption have less uncertainty than emissions from biogenic processes, such as land-use change. Uncertainties tend to be lower for emissions trends than for emissions values for a given year.
Table 2.2 shows a representative range of uncertainties for the various sources and gases as calculated and reported by Annex I countries in their national inventories. It also provides estimates of uncertainties for the emissions estimates, where available, and apportions them into contributions from uncertain activity levels and from uncertain emission factors. Estimates of uncertainty, including those in Table 2.2, have traditionally been made through expert judgment about the quality of the data used in the calculations. Indications of uncertainty can also be derived by comparing (1) estimates from different sources at a specified time, (2) estimates from a single source over time, (3) estimates made by different methods, and (4) estimates with model predictions, remotely sensed data (Marland et al., 2009; see also Chapter 3), atmospheric measurements (see Chapter 4), and proxy measures that have some correlation with emissions (e.g., trade statistics; see below).
Uncertainty in Fossil-Fuel CO2Emissions. UNFCCC inventories in Annex I countries produce reasonably accurate estimates for the most important emissions category: fossil-fuel CO2. Uncertainties for Tier 1 methods are estimated to be on the order of ±5 percent, and some countries believe they can estimate emissions with even lower uncertainties using higher-tier methods (IPCC, 2006). For example, Rypdal and Winiwarter (2001) suggested that the 2 uncertainty in annual fossil-fuel CO2 emissions for countries with “well-developed energy statistics and inventories” may be as low as 2-4 percent. The uncertainty in estimates of fossil-fuel CO2 emissions from the United States has been estimated to be –1 percent to 6 percent (95 percent confidence level; EPA, 2008). Analysis of the sum of Annex I reported emissions as well as some independent estimates and inverse modeling results found a 1 uncertainty of 6 percent for fossil-fuel CO2 (Prather et al., 2009).
In contrast, uncertainty in CO2 emissions from developing countries is considered to be significantly higher. For countries with “less well-developed energy data systems,” the uncertainty may be on the order of ±10 percent (IPCC, 2006). The 2 uncertainty in annual estimates of fossil-fuel CO2 emissions from China may be as high as 15-20 percent (Gregg et al., 2008).
Uncertainty in CO2 emissions from fossil-fuel consumption arises largely from uncertainty in activity data. A comparison of annual CO2 emission values calculated from national energy data reported to the United Nations and IEA by different analysts showed significant differences for individual countries, but no systematic bias and similar global totals (Marland et al., 1999). The mean difference was on the order of 3 percent for 19 Western European countries and 7 percent for 52 African countries, with differences ranging from 0.9 percent for the United States to 10 percent for India to 52 percent for North Korea, suggesting that the quality of activity data is a greater concern for developing countries. In a separate analysis, Gregg et al. (2008) found that revisions in energy data by the China National Bureau of Statistics, which became available
TABLE 2.2 Magnitude and Uncertainty Associated with Emission Factors, Activity Data, and Annual Emissions Estimates for the Principal Emission Source Categories in Annex I Countries
|
|
|
Range of Uncertainty for 7 Annex I Countriesb |
||
|
Emission Source |
Anthropogenic Emissions of All Annex I Countriesa |
Emission Factor |
Activity Data |
Emission Estimate |
|
CO2—total anthropogenic |
|
|
|
1 |
|
CO2—largest sources |
|
|
|
|
|
Energy |
|
|
|
|
|
Fuel combustion |
82.9% |
1 |
1 |
1 |
|
Fugitive emissions from fuels |
0.6% |
1-5 |
1-2 |
1-5 |
|
Industrial processes |
|
|
|
|
|
Mineral products |
2.3% |
1 |
1 |
1-3 |
|
Metal production 2.0% |
1 |
1 |
1-2 |
|
|
Chemical industry |
0.6% |
1-2 |
1 |
1-3 |
|
AFOLU |
|
|
|
|
|
Forestlands |
–9.5% |
2-4 |
1-2 |
2-4 |
|
Croplands |
2.3% |
1-4 |
1-2 |
1-4 |
|
CH4—total anthropogenic |
|
|
|
2-3 |
|
CH4—largest sources |
|
|
|
|
|
Energy |
|
|
|
|
|
Fugitive emissions from fuels |
4.6% |
2-5 |
1-2 |
1-5 |
|
AFOLU |
|
|
|
|
|
Enteric fermentation |
2.7% |
1-3 |
1-3 |
1-3 |
|
Manure management |
0.7% |
1-4 |
1 |
1-5 |
|
Waste |
|
|
|
|
|
Solid waste disposal on land |
2.1% |
1-3 |
1 |
1-5 |
|
N2O—total anthropogenic |
|
|
|
2-5 |
|
N2O—largest sources |
|
|
|
|
|
Energy |
|
|
|
|
|
Fuel combustion |
0.7% |
2-5 |
1 |
1-5 |
|
Industrial processes |
|
|
|
|
|
Chemical industry |
0.5% |
3-4 |
1 |
2-4 |
|
AFOLU |
|
|
|
|
|
Agricultural soils |
4.0% |
2-5 |
1-2 |
2-5 |
|
Manure management |
0.5% |
2-4 |
1-3 |
2-5 |
|
HFCs, PFCs, and SF6—total anthropogenic |
|
|
|
2-5 |
|
HFCs—largest source Consumption of halocarbons |
1.1% |
1-5 |
1 |
1-5 |
|
PFCs—largest source Aluminum production |
0.2% |
1-2 |
1-3 |
1-3 |
|
SF6—largest source Use in electrical equipment |
0.1% |
1-3 |
1-3 |
2-4 |
|
Total % emissions covered |
98.4% |
|
|
|
|
NOTES: 1 = <10% uncertainty; 2 = 10-25%; 3 = 25-50%; 4 = 50-100%; 5 = >100% (i.e., for the last category, we cannot be certain if the actual emissions value is a source or a sink). aReported 2006 data are from the UNFCCC’s online greenhouse gas database (UNFCCC, 2008). bPercentages for the largest sources are based on the 2006 greenhouse emissions data reported by seven Annex I countries—Australia, Denmark, Germany, Greece, Poland, Portugal, and the United States—selected to represent a range of institutional capabilities for compiling inventories. Uncertainty ranges were derived from the uncertainty estimates reported by the Annex I countries as part of their 2008 greenhouse gas inventory submissions for 1990 through 2006 to the UNFCCC. Each Annex I party is required to quantitatively assess and report the uncertainty of its inventories in accordance with IPCC (2000) good practice guidance. The uncertainty estimates for Denmark, Germany, Greece, and Poland were prepared for the majority of emissions source categories using the Tier 1 method, while the uncertainty estimates for Australia, Portugal, and the United States were developed using the Tier 2 method (i.e., the Monte Carlo method). The uncertainties associated with total anthropogenic emissions of each gas were available only for Denmark, Greece, Poland, Portugal, and the United States. Combined uncertainties for the emissions source categories were calculated from the uncertainty estimates given for the subcategories for each country according to the following equation (IPCC, 2000): Uncertainty(combined) = ([Uncertainty(1) × Emissions(1)]2 + [Uncertainty(2) × Emissions(2)]2 + … + [Uncertainty(n) × Emissions (n)]2) / (Emissions(1) + Emissions(2) + … + Emissions(n)). Values are reported at the 95% confidence level. See Australian Government Department of Climate Change (2008); Danish National Environmental Research Institute (2008); EPA (2008, Annex 7); German Federal Environmental Agency (2008); Greek Ministry for the Environment (2008); Poland National Administration of the Emissions Trading Scheme (2008); Portuguese Environmental Agency (2008). |
||||
in 2006, raised the initially reported 2000 values by 23 percent. In contrast, Austria’s self-reported estimates have been refined every year but have remained within a range of 2-3 percent.
Methods also make a difference in fossil-fuel CO2 emissions estimates. For example, the IEA examined the effect of replacing the 1996 IPCC guidelines with the 2006 IPCC guidelines for fossil-fuel CO2 and found that only the inventories that rely on default values (i.e., use Tier 1 methods) for factors such as heating values and carbon contents of fuels were affected, but inventories that used higher-tier methods were not (IEA, 2009).
Uncertainty in AFOLU Emissions. Reported uncertainties for annual CO2 emissions from the AFOLU sector in Annex I countries range from less than 10 percent to 100 percent (Table 2.2). Independent estimates in the United States and other countries typically yield uncertainties in excess of 50 percent (Pacala et al., 2001; CCSP, 2007; Ito et al., 2008). The true uncertainty probably exceeds 100 percent in many or most non-Annex I countries.
Methodological uncertainty is more important for AFOLU emissions than for energy CO2 emissions. Uncertainties for agricultural methane emissions are greater than 50 percent for rice cultivation due to variability in irrigation and other management practices, as well as inherent spatial and temporal variability in soil CH4 production and consumption rates. The situation is better for CH4 emissions associated with animal husbandry, because uncertainties in CH4 emitted per animal are on the order of 30 percent for Tier 1 methods and 20 percent for Tier 2 methods (IPCC, 2006), and the numbers of animals are reasonably well known (Table 2.1). Methane emissions from manure are uncertain primarily because of poor documentation of manure management practices by small farms. N2O emissions have high temporal and spatial variability due to the dynamic nature and variability of the concentration of mineral nitrogen species (e.g., NH4+, NO3–), labile organic carbon, and oxygen that largely govern N2O emissions from soils. Consequently, uncertainties for N2O emissions from anthropogenic nitrogen additions are high—greater than 50 percent—because of the variability in the direct and indirect emission of N2O per unit of nitrogen added as well as uncertainty in nitrogen addition rates and management practices. Finally, emissions from fires are highly uncertain (>100 percent) because of uncertainty in the amount of fuel actually combusted and in the trace gas emissions per unit of fuel burned (Campbell et al., 2007).
Limited Availability of Independent Data Sources for Validation and Verification
There are no truly independent sources of activity data, such as fuel use, against which data used in national greenhouse gas inventories can be compared. The United Nations, International Energy Agency, Department of Energy (DOE) Energy Information Administration, and BP Corporation create large international datasets on energy production and consumption, but all of these datasets rely primarily on the same self-reported national statistics. Data on fuel production and trade are sometimes available from corporate sources, but the most complete energy data are self-reported by countries. In many developing countries, these data are not complete or accurate or are not consistently reported.
Validation of Fossil-Fuel CO2Emissions. Direct measurements of CO2 emissions are not currently used in preparing national-level inventories but could be used to validate portions of national inventories (Ackerman and Sundquist, 2008). For example, at several hundred power plants in the United States, continuous monitoring equipment measures the amount of CO2 and other gases discharged from the smokestack (EPA, 2005). This technique is both complex and expensive and it is applied only at large point sources. Continuous monitoring of emissions is particularly useful where the fuel is heterogeneous or its delivery rate is difficult to measure. Ackerman and Sundquist (2008) compared CO2 emissions estimates from fuel-based calculations and direct stack measurements at 828 U.S. power plants that used conventional fuels in 2004. The average absolute difference between the two sets of values was 16.6 percent, with the stack measurements giving higher values on average. However, because the stack measurements are both higher and lower than the fuel-based calculations, the two types of estimates differed by only 1.4 percent for total conterminous U.S. CO2 emissions. Because emissions from power plants are such a large fraction of the U.S. total, resolving the differences in these two methods may be an efficient way to reduce
uncertainty in national inventories (Ackerman and Sundquist, 2008).
Similarly, facility data collected to support emission trading programs could also be used to validate and improve national inventories. For example, the European Emissions Trading System created a new, independent data source, which European countries use to identify and fill gaps in national inventories and to improve country-specific emission factors (Herold, 2007). Data collected under EPA’s recently adopted greenhouse gas reporting rule4 can play a similar role in improving the U.S. inventory.
Atmospheric measurements may also be useful for verifying values or trends in CO2 emissions (see Chapter 4). For example, problems with the energy data from China (see “Uncertainty in Fossil-Fuel CO2 Emissions” above) had been identified earlier based on satellite measurements of trends in NO2 column abundance (Stinton, 2001; Akimoto et al., 2006; Zhang et al., 2007; Gregg et al., 2008).
In the absence of physical measurements of CO2 emissions, proxy data could be used to assess some trends. However, a climate treaty would change the historic relationships between emissions and proxies. For example, gross domestic product (GDP) is strongly correlated with CO2 emissions, but this relationship changes through time, particularly after an energy price shock, and it differs by a factor of 2 or more among countries (see, for example, Raupach et al., 2007). Emissions reduction policies are designed specifically to decrease the trend in emissions, while having minimal impact on the trend in GDP. Independent data on world trade might indicate trends in CO2 emissions in some countries and sectors. For example, 32 countries in the UN energy database burn only imported liquid fuels, and the import and export of fuel are captured in trade statistics.
Validation of AFOLU Emissions. Independent verification of changes in emission rates is difficult for all but the largest AFOLU sources because field measurements are scarce and expensive. As discussed in Chapter 3, remote sensing can be used to quantify significant changes in land use and rates of deforestation and afforestation with reasonable accuracy, and ground surveys can be used to verify carbon stock changes resulting from alterations in management. Verifying interventions to reduce enteric CH4 emissions (e.g., genetic improvement of livestock, use of methane inhibitors) and N2O soil emissions (e.g., altered timing, amount, and placement of fertilizer; use of nitrification inhibitors) depends on ground survey information and self-reporting. Water management (i.e., extent and periodicity of flooding of rice fields) could be monitored via remote sensing, although assessing other methane mitigation practices (e.g., improving cultivars, field additives to suppress CH4 production) would depend on ground survey data. As outlined in Chapter 4, atmospheric sampling networks and transport modeling for agriculture-intensive regions might help to constrain emission estimates of CH4 and N2O from agricultural sources.
Proxy data could also be used to validate AFOLU emissions. For example, fertilizer production and import-export statistics could be used to verify overall reductions in fertilizer nitrogen use at the country scale and, together with statistics on agricultural production, to track changes in nitrogen fertilizer use efficiency as an indicator of improved management practices.
Limited Comparability with Data Derived from Other Monitoring Methods
UNFCCC inventories are difficult to compare with physical measurements because (1) they do not provide complete accounting of greenhouse gas sources and sinks, (2) geographically and temporally resolved emissions data are not reported, and (3) final emissions values are commonly not available for 2 years or more after they occur. National inventories do not include all emissions of greenhouse gases, primarily because the UNFCCC addresses only anthropogenic emissions and removals. Thus, for the AFOLU sector, only anthropogenic emissions and removals on managed lands are required to be counted.5 Because unmanaged
|
4 |
See <http://www.epa.gov/climatechange/emissions/ghgrulemaking.html>. |
|
5 |
The IPCC defines managed land as “land where human interventions and practices have been applied to perform production, ecological or social functions” (IPCC, 2006). Individual countries are permitted to define what constitutes managed lands, as long as the definition is transparent and they account for the land area consistently over time. |
land is not considered, the UNFCCC inventories miss emissions and removals from natural disturbance and recovery as well as emission increases induced by climate change (e.g., increased CO2 and CH4 emissions in high-latitude tundra and boreal ecosystems). As a result, there is an inherent mismatch in the land-use component between UNFCCC inventories, process studies (e.g., Ito et al., 2008), and the atmospheric methods described in Chapter 4. In addition, some anthropogenic sources are not reported, either because methods to measure them have not been developed or approved (e.g., CH4 from reservoirs) or because UNFCCC guidelines do not require their reporting (e.g., harvested wood products).
The lack of geographically resolved data is important for tracer-transport inversions, which depend on assumptions about the initial spatial and temporal pattern and magnitude of emissions. An inverse model evaluates how atmospheric observations can alter these prior estimates while maintaining the prior pattern (e.g., Gloor et al., 2000; Rayner and O’Brien, 2001; Law et al., 2003). The initially estimated pattern of emissions at the surface is critical for the analysis (e.g., Lauvaux et al., 2008). The availability of accurate geographically and temporally resolved inventory data would provide better prior estimates of emissions. If we know where and when the emissions occurred, as well as how much was emitted, the tracer-transport modeling can tell us the extent to which atmospheric measurements are compatible with the emissions estimates. Although many developed countries collect some spatially resolved greenhouse gas data to support mitigation or air quality programs, this information is not included in national inventory reports.
The delay in reporting final emissions values frustrates efforts to independently validate national inventories with real-time physical measurements, although it does not compromise the use of national inventories for treaty purposes. Much of the activity data on which emissions estimates are based is collected on survey forms from industrial firms and energy producers and consumers. It may take several years to collect and process data after the close of an accounting year. As a result, many emissions estimates are published 1 to 2 years after the emissions actually occur, and annual updates include not just another year of data but also revisions of earlier-year estimates when more accurate or more complete data become available.
NEAR-TERM CAPABILITIES FOR IMPROVING NATIONAL GREENHOUSE GAS INVENTORIES
Self-reporting has been, and is likely to continue to be, the primary means of monitoring greenhouse gas emissions and reductions under an international climate treaty. Tier 1 IPCC methods deliver national fossil-fuel CO2 emissions estimates that are sufficiently accurate to document national multiyear trends of the dominant greenhouse gas source for the energy sector as a whole, although higher-tier methods are required to accurately estimate emissions by subsector. In contrast, Tier 1 methods do not yet produce sufficiently accurate emissions estimates from the next-largest sources: CO2 from deforestation and CH4 and N2O from agriculture. However, even where more accurate Tier 2 and 3 methods exist, many developing countries lack the resources and infrastructure to use them. Improving the inventories of both developed and developing countries and enhancing self-reported data to facilitate independent verification are discussed below. Chapters 3 and 4 describe research needed to strengthen knowledge of the poorly constrained minor sectors and gases, as well as independent data on emissions that could improve confidence in reported inventories.
Building Inventory Capacity in Developing Countries
Although technical and financial assistance has helped many developing countries complete a national inventory, the challenge is to build the capacity for these countries to create complete and accurate inventories regularly and for all years. Some international efforts to improve energy statistics include a component to increase participation by developing countries. Examples include the Oslo Working Group on Energy Statistics, which is working to refine international standards and definitions (e.g., United Nations, 2008a,b,c), and IEA initiatives to harmonize energy statistics among international organizations (Karen Treanton, IEA, personal communication, July 2009).
Improving estimates of emissions from deforestation and agriculture, which are primary sources of greenhouse gases in developing countries, is challenging because many countries do not have the technical capacity to monitor these sources. International efforts to develop comprehensive global land category maps and to disseminate affordable satellite imagery could greatly improve emissions estimates in developing countries by providing country-level activity data on land use for preparation of national inventories (see Chapter 3).
In many cases, external funding and training will be required to strengthen government and research institutions in developing countries to build and retain expertise in greenhouse gas inventories. The cost of creating an ongoing capability for Tier 1 reporting in the largest emitting developing countries using existing data is relatively modest. For example, an initial investment of $450,000 per country6 for data collection, training, and software and inventory tools could greatly improve the capacity of those countries to use higher-tier methods for inventory preparation. Additional resources on the order of $200,000 annually would be needed in countries without existing institutional capacity to maintain a permanent team of experts for inventory preparation (Mausami Desai, Environmental Protection Agency, personal communication, September 24, 2009). If only half of the 20 highest-emitting developing countries require support for institutional capacity, the cost to obtain annual estimates of their emissions would be $11 million over 5 years.
Improving Access to Data in Developed Countries
Developed countries typically have the infrastructure needed to generate reasonably accurate inventories of emissions from many significant sources and to carry out research on sources that are poorly understood (e.g., CH4 and N2O in the AFOLU sector). However, developed-country inventories would be improved by providing full and open access to basic data on energy systems and land use. Full and open access to international data would make it possible for any party to make estimates, compare data, or consider proxy indications. The United Nations, IEA, and FAO have established standards to ensure that the collection and reporting of publicly available data in international data compilations are uniform across countries and over time. These international compilations include some of the same data used by countries to estimate their emissions (e.g., production, trade, and consumption of energy; fuel characteristics; land use; agricultural production), but they provide supporting information that allows comparisons and correlations and they are publicly accessible. In contrast, data in some countries have limited availability (e.g., hard to find, incomplete, on paper only) or are available only at cost.
Facilitating Independent Verification of Self-Reported Emissions Data
Complete accounting of all greenhouse gas sources and sinks would enable more accurate comparisons of country totals with global and atmospheric data, facilitate regional estimates, and improve confidence in national estimates. Countries should continue to move toward more complete reporting of anthropogenic sources and sinks within the UNFCCC inventories. Initiatives needed to develop estimates of naturally occurring biogenic emissions and removals, such as the production of global land maps and research on biogeochemical cycles, are discussed in Chapter 3.
The development of spatially and temporally gridded emission datasets is also critical for improving atmospheric models, and several initiatives are currently under way. For example, the Vulcan project7 estimates hourly emissions based on facility-level data and geographic patterns of fuel use, but so far it covers only fossil-fuel CO2 emissions from the continental United States and only for a year. Annual gridded greenhouse gas estimates for the world are available from the Emissions Database for Global Atmospheric Research (EDGAR),8 but they are based on disaggregated national, annual data and indicators of local emission-producing activities. These initiatives are useful begin-
|
6 |
This is generally consistent with Global Environment Facility funding levels ($450,000 per country for national communications). However, inventory preparation is only one element of the national communication and only one year of data is currently required. See <www.gefweb.org/COUNCIL/GEF_C11/9.cc_brie12_review.pdf>. |
|
7 |
|
|
8 |
nings, but they need to be significantly expanded. An international effort among developed countries to prepare and publish spatially and temporally gridded estimates of national emissions would provide critical initial data for the independent verification of national emissions, and for this effort, the disaggregated data may be more important than just the total magnitudes of emissions.
Governments also have a critical role in developing standardized methods to ensure that the gridded estimates are comparable and that they are produced at the appropriate spatial and temporal resolution to support comparison with the models. The horizontal resolution necessary is likely to be 50 to 100 km for global models, 8 km for regional models (Lauvaux et al., 2008), and 1 km for point sources. All of these methods would yield improved emissions estimates with any good initial data, even if they were not at the optimal resolution for the method. Temporal resolution, particularly the typical diurnal, weekly, and/or seasonal cycle of emissions, is also a critical piece of initial data. Because of day-night patterns in meteorology, greenhouse gases emitted at different times of the day can end up at different locations. For near-instantaneous measurements near point sources, the emissions measured are only from the last hour and depend on the duty cycle of the power plant.
RECOMMENDATIONS
The uncertainties in current estimates of emissions for the various greenhouse gases and major sources, as evaluated by the countries submitting the national reports, are summarized in Table 2.2. Uncertainties in self-reported CO2 emission estimates are low (<10 percent) in many developed countries and could be lowered to similar levels in others by using the most accurate IPCC methods. Reducing uncertainties for N2O and CH4 emission estimates will also require improved activity data and emission factors, which will in some cases require research. Uncertainties in total anthropogenic N2O are driven by the AFOLU component and are likely to remain high (10-100 percent) in the near term. For CH4, the relative importance of energy and AFOLU sources will determine the extent to which uncertainty can be reduced. If improvements are made, uncertainties for total anthropogenic emissions of CH4 could be as low as 10 percent in countries where emissions are dominated by energy, and as high as 50 percent in countries where emissions are dominated by AFOLU.
Extending regular UNFCCC inventories to other countries, pushing inventories to higher tiers, carrying out research to improve emission factors, and encouraging the expansion of inventories to estimate emissions at finer spatial and temporal scales should not only reduce uncertainty, but also improve opportunities for independent verification of traditional, national emissions inventories. Consequently, UNFCCC parties should strengthen self-reported national emissions inventories in the following manner:
-
Extend regular inventory reporting and review to all countries.
-
Where necessary, provide sustained technical and financial support to develop and maintain institutional capacity and tools and training for preparing inventories in developing countries.
-
Create a central land-use database to improve AFOLU estimates in national inventories from developing countries (see Chapter 3).
-
-
Continue to improve methods used by all countries.
-
Support basic research on greenhouse gas emissions processes and corresponding improvements in IPCC methodologies, particularly for biogenic sources and the AFOLU sector (see Chapter 3).
-
Extend top-tier (most stringent) reporting to the most important greenhouse gas sources in each country.
-
-
Facilitate cross-comparisons of self-reported data with data derived from other monitoring methods and develop independent data sources.
-
Support the development of inventories of naturally occurring, land-based emissions and sinks for all lands, not just managed lands.
-
Promote free and open access to relevant national and international statistics.
-
-
-
Support IPCC, United Nations, and IEA efforts to improve energy statistics and FAO efforts to improve land-use and forestry statistics.
-
Develop and implement standardized methods for preparing and publishing Annex I country inventories that are gridded at spatial and temporal resolutions appropriate for the particular greenhouse gas and source.
-


