
F
Review of Estimate of Retail Price Equivalent Markup Factors
Vyas et al. (2000) of Argonne National Laboratory (ANL) compared their own markup factors to estimates developed by Energy and Environmental Analysis, Inc. (EEA) and Borroni-Bird. Two different markup factors were compared: (1) the markup over direct manufacturing (variable) costs for components produced in house and (2) the markup for components purchased fully manufactured from outside suppliers. In the ANL analysis, costs of manufacture include materials, assembly labor, and other manufacturing costs but not depreciation, amortization, warranty, or R&D and engineering (Table F.1). Other costs borne by the original equipment manufacturer (OEM) are corporate overhead, benefits (retirement and health care), and distribution, marketing, and dealer costs, including dealer profits.
Because the cost categories used by Borroni-Bird and EEA differed from those used by the ANL study, an exact comparison is not possible (Table F.2). While Vyas et al. (2000) concluded that the three sets of estimates were quite close, the different definitions cloud the issue. For example, Vyas et al. (2000) assumed that half of the costs—shown by Borroni-Bird as transportation/warranty; amortization and depreciation; engineering R&D, pension and health, advertising, and overhead—would be borne by the outside supplier. In their own estimates they allocate all warranty, R&D/engineering, and depreciation and amortization costs to the supplier. Clearly, even components purchased fully manufactured from a Tier 1 supplier will incur costs just for their engineering into the vehicle system and are likely to lead to some warranty costs beyond those covered by the supplier. Still, the bottom-line markup over variable manufacturing costs is very similar: 2.05 for the Borroni-Bird analysis versus 2.00 for the ANL analysis.
The Vyas et al. (2000) memorandum also summarized the cost methodology used by EEA, Inc., in a study for the Office of Technology Assessment (OTA, 1995), although it should be noted that the auto industry has undergone dramatic changes since that time, and the continued applicability of the methodology is debatable. Again, the cost categories differ, but the bottom-line markup over variable manufacturing costs is similar although a bit higher: 2.14 (Table F.3). To get an idea of the markup over outsourced component costs, the ANL analysts again assumed that the supplier would bear the costs of warranty, R&D engineering, and depreciation and amortization. Since EEA methods do not separate warranty costs from manufacturing overhead, Vyas et al. (2000) assumed that warranty costs made up half of the overhead costs. With those assumptions they obtained a markup factor of 100/(33.6 + 6.5 + 6.5 + 10.3/2 + 12.1) = 1.56. This leaves only a bit more than 5 percent of the total retail price equivalent (RPE) for the costs of integrating components into the overall vehicle design, assembly, and other OEM assembly costs.
The ANL memorandum concludes that all three sources would result in very similar markup factors (Table F.4). However, for markups over Tier 1 supplier costs, the ANL decision on how to allocate the costs has a lot to do with the similarities. A less generous allocation of warranty, assembly, and manufacturing overhead costs to suppliers would result in higher markup factors for outsourced components. Despite these ambiguities, the ANL comparison reasons that the markup for in-house-made components would be about twofold rather than the 1.5-fold markup for components purchased from Tier 1 suppliers.
A markup factor of 1.5 was used by NHTSA (DOT/NHTSA, 2009, p. 173) in its final fuel economy rule for 2011. A somewhat lower RPE markup factor of 1.4 was used by NRC (2002) and by S. Albu, assistant chief, Mobile Source Division, California Air Resources Board, in his presentation to the committee (Albu et al., 2008), while the EPA has used a markup of approximately 1.3 (EPA, 2008).
A markup of approximately 2 over the direct manufacturing cost of parts manufactured in house by an OEM was also supported by Bussmann in a presentation, “Study of industry-average markup factors used to estimate retail price equivalents (RPE),” to the committee on January 24, 2008. In that briefing, Bussman cited a 2003 study of the global automotive industry by McKinsey Global Institute, which came up with a markup factor of 2.08, and his own analysis
TABLE F.1 Components of Manufacturer’s Suggested Retail Price (MSRP) Equivalent RPE: ANL Method
|
Cost Category |
Cost Contributor |
Relative to Cost of Vehicle Manufacture |
Share of MSRP (%) |
|
Vehicle manufacture |
Cost of manufacture |
1.00 |
50.0 |
|
Production overhead |
Warranty |
0.10 |
5.0 |
|
|
R&D engineering |
0.13 |
6.5 |
|
|
Depreciation and amortization |
0.11 |
5.5 |
|
Corporate overhead |
Corporate overhead, retirement, health |
0.14 |
7.0 |
|
Selling |
Distribution, marketing, dealers |
0.47 |
23.5 |
|
Sum of costs |
|
1.95 |
97.5 |
|
Profit |
Profit |
0.05 |
2.5 |
|
Total contribution to MSRP |
|
2.00 |
100.0 |
|
SOURCE: Vyas et al. (2000). |
|||
TABLE F.2 Components of MSRP: Estimated by Borroni-Bird
|
Cost Category |
Cost Contributor |
Relative to Cost of Vehicle Manufacture |
Share of MSRP (%) |
|
Vehicle manufacture |
Materials |
0.87 |
42.4 |
|
|
Labor, other manufacturing costs |
0.13 |
6.3 |
|
Fixed cost |
Transportation and warranty |
0.09 |
4.4 |
|
Fixed cost |
Amortization and depreciation, engineering R&D, pension and health care, advertising, and overhead |
0.44 |
21.5 |
|
Selling |
Price discounts |
0.10 |
4.9 |
|
|
Dealer markup |
0.36 |
17.6 |
|
Sum of costs |
|
1.99 |
97.1 |
|
Profit |
|
0.06 |
2.9 |
|
MSRP |
|
2.05 |
100.0 |
|
SOURCE: As reported by Vyas et al. (2000). |
|||
TABLE F.3 Components of Retail Price Equivalent: EEA, Inc., Method
|
Cost Category |
Cost Contributor |
Relative to Cost of Vehicle Manufacture |
Share of MSRP (%) |
|
Vehicle manufacture |
Division costs |
0.72 |
33.6 |
|
|
Division overhead |
0.14 |
6.5 |
|
|
Assembly labor and overhead |
0.14 |
6.5 |
|
Overhead |
Manufacturing overhead |
0.22 |
10.3 |
|
|
Amortized engineering, tooling, and facilities |
0.26 |
12.1 |
|
Selling |
Dealer margin |
0.49 |
22.9 |
|
Sum of costs |
|
1.97 |
92.1 |
|
Profit |
|
0.17 |
7.9 |
|
Total |
|
2.14 |
100.0 |
|
SOURCE: EEA, Inc. (1995), as reported by Vyas et al. (2000). |
|||
TABLE F.4 Comparison of Markup Factors
|
Markup Factor for |
ANL |
Borroni-Bird |
EEA |
|
In-house components |
2.00 |
2.05 |
2.14 |
|
Outsourced components |
1.50 |
1.56 |
1.56 |
|
SOURCE: Vyas et al. (2000). |
|||
of Chrysler data for 2003-2004, which produced factors of 1.96-1.97. Since these markup factors apply to direct manufacturing costs, they are consistent with the estimates shown in Table F.4. Lyons (2008) used a markup factor of approximately 2.0 but was not specific about the cost components included in the estimate to which this factor was applied.
Information supplied to the committee in the presentation by Duleep on January 25, 2008, implies higher markup factors (Duleep, 2008). Assuming a reference cost of 1.00 for the variable factors used to produce a component (material, labor, energy, factory overhead), EEA calculates the Tier 1 supplier cost by applying multiplicative markups for supplier overhead and profit and an additive factor of 0.1 to 0.2 for tooling, facilities, and engineering (Table F.5). The range is intended to reflect the complexity of the component and the engineering effort required of the supplier to ensure its integration into the full vehicle system. Representing the variable costs by X, the total supplier price markup is given by equation 1:
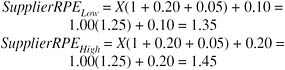
(1)
In the EEA method, OEM costs include amortization of tooling, facilities and engineering, and overhead, profit and selling costs, which include marketing, distribution, and dealer costs. EEA assumes an average manufacturer profit of 8 percent, somewhat higher than the 5 percent assumed by ANL and the 6 percent assumed by Borroni-Bird. Amortized costs vary from 5 percent to 15 percent, again depending on the complexity of the part and the costs of integrating it into the vehicle system. Marketing, distribution, and dealer costs are multiplicative and add 25 percent to the OEM costs (Figure F.1).
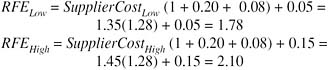
(2)
The resulting markup ranges are 2.22 to 2.51 for the markup over variable costs (corresponding to the ANL “ vehicle manufacturing” costs) and 1.65 to 1.73 for the markup over Tier 1 supplier costs (corresponding to the ANL cost of outsourced components). The full breakdown of EEA markup estimates is shown in Table F.5. The markups are comparable to those proposed by Vyas et al. (2000) but higher by a meaningful amount, as shown in Figure F.2. In a note, EEA-ICF, Inc., argues that higher supplier amortized costs are generally associated with lower OEM amortized costs for any give™n part. However, this assertion was not applied here to develop the range of markup factors based on EEA data.
Average RPE factors can be inferred by costing out all the components of a vehicle, summing them to estimate OEM Tier 1 costs or fully burdened in-house manufacturing costs, and then dividing the sum into the selling price of the vehicle. The committee contracted with IBIS Associates (2008) to conduct such an analysis for two popular vehicles: (1) the Honda Accord sedan and (2) the Ford F-150 pickup truck. Current model year (2009) designs and base model trim levels (no nonstandard options) were chosen. Base models
TABLE F.5 Fuel Economy Technology Cost Markup Factors
|
Item |
Cost Low |
Cost High |
Share Low % |
Share High % |
|
Supplier costs |
||||
|
Factors (materials, labor, energy, factory overhead) |
1.00 |
1.00 |
45 |
40 |
|
Supplier overhead |
0.20 |
0.20 |
9 |
8 |
|
Supplier profit |
0.05 |
0.05 |
2 |
2 |
|
Amortization of tooling + facilities + engineering |
0.10 |
0.20 |
4 |
8 |
|
Supplier subtotal |
1.35 |
1.45 |
61 |
58 |
|
Supplier markup |
1.35 |
1.45 |
|
|
|
OEM costs |
||||
|
OEM overhead |
0.20 |
0.20 |
12 |
12 |
|
OEM profit |
0.08 |
0.08 |
5 |
5 |
|
Tooling + facilities + engineering amortization |
0.05 |
0.15 |
2 |
6 |
|
OEM subtotal |
1.78 |
2.01 |
80 |
80 |
|
OEM markup |
1.32 |
1.38 |
||
|
Marketing, transport, dealer markup |
0.25 |
0.25 |
20 |
20 |
|
Total |
2.22 |
2.51 |
100 |
100 |
|
RPE markup (over factors) |
2.22 |
2.51 |
|
|
|
RPE markup (over supplier price) |
1.65 |
1.73 |
|
|
|
SOURCE: EEA-ICF, Inc., as reported by Duleep in his presentation to the committee on January 25, 2008. |
||||
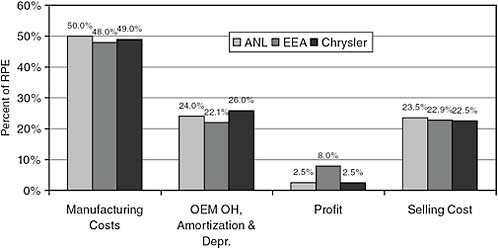
FIGURE F.1 Components of retail price equivalent (RPE) markup. SOURCE: Duleep (2008).
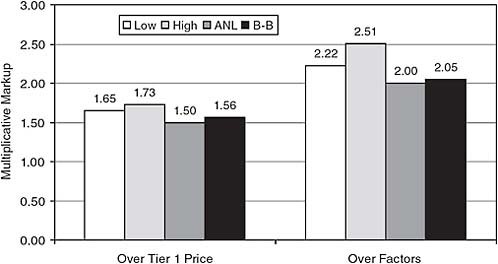
FIGURE F.2 Comparison of Duleep (2008) high/low, Argonne National Laboratory (ANL), and Borroni-Bird (B-B) cost markup factors.
were chosen to reduce the influence of market pricing decisions not driven by manufacturing costs.
Cost estimates were developed for subcomponents in terms of costs paid by OEMs for automotive components and subsystems in five broad systems. Although many of the components are manufactured in house, the costs of these components were estimated using the fixed or indirect manufacturing costs normally borne by a Tier 1 supplier. Results for the base Honda Accord are shown in Table F.6. The base vehicles are the four-door LX sedans produced in Marysville, Ohio, and Lincoln, Alabama. The curb weight of this vehicle is 3,230 lb, with a V6, 3.0-L, dual overhead cam engine, a five-speed manual transmission, and a stamped steel unibody with a lightweight aluminum subframe. Dealer invoice cost for the Accord is $18,830, MSRP is $20,755, and the average market transaction price is $19,370. The cost of all components plus assembly costs is estimated to be $14,564. This results in multipliers of 1.39 to market transaction price and 1.49 to MSRP. The multiplier to dealer invoice cost is 1.35, which means that dealer costs, including profit, amount to about 4 percent of manufacturing costs, not considering any dealer incentives offered by OEMs.
The base 2009 Ford F-150s are two-door XL Regular Cab Styleside short-bed, rear-wheel-drive pickups produced in Dearborn, Michigan, and Kansas City, Missouri. The curb weight of the vehicle is 4,743 lb, with a standard V8, 4.6-L, single overhead valve engine and a four-speed automatic transmission. The truck has a stamped steel body on frame construction. Dealer invoice cost for the F-150 is $20,055, MSRP is $21,565, and the average market transaction price is $21,344. The cost of all components plus assembly is $14,940, as shown in Table F.7. This means an RPE multiplier of 1.52 for market price and 1.54 for MSRP. The markup factor for the dealer invoice is 1.43, so that dealer costs and profit amount to about 9 percent of total manufacturing costs, not including any possible OEM incentives to dealers.
TABLE F.6 Cost Breakdown of Base 2009 Honda Accord LX
BIBLIOGRAPHY
Albu, S., California Air Resources Board. 2008. ARB perspective on vehicle technology costs for reducing greenhouse gas emissions. Presentation to the National Research Council Committee on Technologies for Improving Light-Duty Vehicle Fuel Economy on January 24.
Bussmann, W.V., and M.J. Whinihan. 2009. The Estimation of Impacts on Retail Prices of Regulations: A Critique of Automobile Industry Retail Price Equivalent and Indirect Cost Multipliers. Prepared for the Alliance of Automobile Manufacturers, Southfield, Mich. May 6.
DOT/NHTSA (U.S. Department of Transportation/National Highway Traffic Safety Administration). 2009. Average Fuel Economy Standards, Passenger Cars and Light Trucks, Model Year 2001: Final Rule. 49 CFR Parts 523, 531, 533, 534, 536, and 537, Docket No. NHTSA-2009-0062, RIN 2127-AK29. DOT/NHTSA, Washington, D.C. March 23.
Duleep, K.G. 2008. Analysis of technology cost and retail price. Presentation to the National Research Council Committee on Technologies for Improving Light-Duty Vehicle Fuel Economy, January 24.
TABLE F.7 Cost Breakdown of Base 2009 F-150
EPA (U.S. Environmental Protection Agency). 2008. EPA Staff Technical Report: Cost and Effectiveness Estimates of Technologies Used to Reduce Light-Duty Vehicle Carbon Dioxide Emissions. EPA420-R-08-008. Ann Arbor, Mich.
IBIS Associates, Inc., Waltham, Mass. 2008. Data Collection and Analysis: Vehicle Systems Costs. Report to the National Research Council Committee on Assessment of Technologies for Improving Light-Duty Vehicle Fuel Economy. December.
Lyons, J.M., Sierra Research, Inc. 2008. Technology and retail price implications of HR6 CAFE standards based on vehicle simulation modeling (preliminary results). Presentation to the National Research Council Committee on Assessment of Technologies for Improving Light-Duty Vehicle Fuel Economy, January 24.
NRC (National Research Council). 2002. Effectiveness and Impact of Corporate Average Fuel Economy (CAFE) Standards. National Academy Press, Washington, D.C.
OTA (Office of Technology Assessment). 1995. Advanced Automotive Technology: Visions of a Super-Efficient Family Car. OTA-ETI-638. Washington, D.C.
Vyas, A., D. Santini, and R. Cuenca. 2000. Comparison of Indirect Cost Multipliers for Vehicle Manufacturing. Center for Transportation Research, Argonne National Laboratory. Argonne, Ill. April.


