
5
Working Toward a Synthesis of Archaeological, Linguistic, and Genetic Data for Inferring African Population History
LAURA B. SCHEINFELDT,* SAMEER SOI,† AND SARAH A. TISHKOFF*‡§
Although Africa is the origin of modern humans, the pattern and distribution of genetic variation and correlations with cultural and linguistic diversity in Africa have been understudied. Recent advances in genomic technology, however, have led to genome-wide studies of African samples. In this chapter, we discuss genetic variation in African populations contextualized with what is known about archaeological and linguistic variation. What emerges from this review is the importance of using independent lines of evidence in the interpretation of genetic and genomic data in the reconstruction of past population histories.
Disentangling past population histories is a formidably complicated task that benefits from the synthesis of archaeological, linguistic, and genetic data. Archaeology permits insights into ancient technology and culture and provides a timetable for the emergence of innovations. Historical linguistic data complement the archaeological record by contributing an independent phylogenetic analysis of language relationships and providing clues about ancient population migration and admixture events. Similarly, genetic data provide an independent data source to understand the biological relationships among modern peoples
|
* |
Department of Genetics, |
|
† |
Genomics and Computational Biology Graduate Group, and |
|
‡ |
Department of Biology, University of Pennsylvania, Philadelphia, PA 19104. |
|
§ |
To whom correspondence should be addressed; e-mail: tishkoff@mail.med.upenn.edu. |
and likely points of origin and expansion of their ancestors. Undoubtedly, the specific details of human demographic history are more complex than any synthesis can account for, but we are focusing here on the overlap among the archaeological, linguistic, and genetic data collected in Africa to make inferences about African demographic history.
AFRICAN LANGUAGE FAMILY CLASSIFICATION
Africa is home to almost a third of all modern languages, encompassing >2,000 ethno-linguistic groups (Tishkoff et al., 2009) that have largely been classified into four language families: Niger-Kordofanian, Afroasiatic, Nilo-Saharan, and Khoesan. As displayed in Fig. 5.1, Niger-Kordofanian languages are spoken throughout western Africa, eastern Africa, central Africa, and southern Africa and include the common Bantu languages. The Afroasiatic language family includes languages spoken in northern, central, and eastern Africa such as Cushitic, Chadic, Semitic, and ancient Egyptian. The Nilo-Saharan language family is spoken predominantly in central and eastern Africa and includes the Sudanic and Nilotic languages. The Khoesan language family, which includes languages that
![FIGURE 5.1 Map of Africa colored by the language family spoken in each region [adapted from Campbell and Tishkoff (2008)]. The Afroasiatic language family is shown in dark gray, the Nilo-Saharan language family is shown in white, the Khoesan language family is shown in light gray, and the Niger-Kordofanian language family is shown in medium gray.](/openbook/12931/xhtml/images/p2001c3c8g82001.jpg)
FIGURE 5.1 Map of Africa colored by the language family spoken in each region [adapted from Campbell and Tishkoff (2008)]. The Afroasiatic language family is shown in dark gray, the Nilo-Saharan language family is shown in white, the Khoesan language family is shown in light gray, and the Niger-Kordofanian language family is shown in medium gray.
contain click consonants and is spoken by hunter-gatherer populations in eastern (Hadza and Sandawe) and southern Africa [the San, referred to here as “southern African Khoesan” (“SAK”)], is the most contentious of the African language families because there is so much divergence among the Hadza, Sandawe, and SAK languages (Nurse, 1997; Sands, 1998).
MODERN HUMAN ORIGINS AND MIGRATION OUT OF AFRICA
The earliest emergence of anatomically modern humans in the fossil record occurred in eastern Africa 200–150 thousand years ago (kya) (McDermott et al., 1996; J.D. Clark et al., 2003; McDougall et al., 2005; Trinkaus, 2005). Although the earliest dated modern humans outside of Africa were identified in the Middle East ~90 kya (Schwarcz et al., 1988; Stringer et al., 1989; McDermott et al., 1993; Mercier et al., 1993; Trinkaus, 2005), there was no continuous occupation of regions outside of Africa until ~60–40 kya; modern human remains are documented in Papua New Guinea 60–40 kya (Groube et al., 1986), southwest Asia ~35 kya, Europe ~40 kya, and mainland Asia ~35 kya (Trinkaus, 2005). Therefore, over half of modern human history took place within Africa exclusively, and understanding patterns of variation within Africa is critical for the elucidation of modern human demographic history.
Genetic data from extant modern humans complement the fossil record in the reconstruction of modern human origins. The uniparentally inherited mitochondrial DNA (mtDNA) and nonrecombinant portion of the Y chromosome (NRY) are two loci that have been extensively studied in human populations, in part because they represent the maternal and paternal population histories, respectively, in a population sample and in part because they do not undergo recombination and, therefore, lineages can be more easily traced back to a single common ancestor. Unfortunately, the mtDNA and NRY loci are single loci, which are susceptible to the effects of natural selection and genetic drift because they have smaller effective population sizes relative to the autosomes and because any selective pressure will impact the entire locus. Thus, combined mtDNA, NRY, and autosomal data are necessary for a thorough understanding of any population history.
The mtDNA, NRY, and autosomal DNA studies demonstrate that the highest levels of genetic variation are present in African samples relative to non-Africans, consistent with a model of African ancestry for all modern humans [e.g., Cann et al. (1987), Underhill et al. (2001), International HapMap Consortium (2003), Akey et al. (2004); Frazer et al. (2007), Garrigan et al. (2007), Li et al. (2008), Tishkoff et al. (2009)]. Further, phylogenetic analysis of mtDNA and NRY variation reveals that the deepest phylogenetic clades are found exclusively in African samples and all
non-African lineages derive from a subset of these African lineages (Cann et al., 1987; Ingman et al., 2000; Underhill et al., 2001; Gonder et al., 2007; Tishkoff et al., 2007a; Behar et al., 2008; Henn et al., 2008). Consistent with the archaeological record, estimates of the time to the most recent ancestor (TMRCA) for the mtDNA lineages give an age range of ~200–100 kya (Ingman et al., 2000; Salas et al., 2002; Tang et al., 2002; Behar et al., 2008) and similar results have been published for NRY lineages, ~200–65 kya (Scozzari et al., 1999; Underhill et al., 2000; Tang et al., 2002). Therefore, the genetic data corroborate a model in which modern humans arose in Africa 200–100 kya and subsequently, one or more populations split off and migrated out of Africa. The migration out of Africa was accompanied by a population bottleneck, which resulted in a reduction in genetic diversity in non-African populations relative to Africans (Campbell and Tishkoff, 2008).
MIDDLE STONE AGE IN AFRICA
The Middle Stone Age, which took place ~250–40 kya (Henshilwood et al., 2002), is a period in the archaeological record that indicates a significant change in culture and subsistence technology in Africa. Several sites in eastern, central, and southern Africa contain artifacts consistent with a shift in technology and population expansion ~75–55 kya, including hunting weapons, indications of increased plant utilization, signs of increased marine exploitation, and evidence of large-scale movement of red ochre (used for art), stone, and shell ornaments (McBrearty and Brooks, 2000; Henshilwood et al., 2001, 2002; Mellars, 2006). It is tempting to speculate that these developments are tied to improvements in human communication; however, the reconstruction of proto-languages does not extend back this far in time; therefore, there is no empirical way to establish when or where human language emerged. Interestingly, an analysis of mtDNA data estimates a population expansion in Africa 70 kya (Excoffier and Schneider, 1999), consistent with the archaeological evidence from the late Middle Stone Age. Furthermore, we would not expect to see the same signal of expansion in non-African populations given that the extreme bottleneck associated with the migration out of Africa most likely obscures more ancient demographic signals.
NEOLITHIC IN AFRICA
The Neolithic period, beginning ~10 kya, included the development of agriculture and animal domestication in Africa, with concomitant changes in population demographics due to population growth and migration to new regions. Below we discuss several such movements including
the spread of agriculture, the spread of pastoralism, and the dispersal of affiliated language groups and genetic lineages. It is important to note, however, that these associations among linguistic, archaeological, and genetic data are not presented here to paint a simple picture of migration or replacement, but rather to illustrate that large-scale movements of technology and culture have resulted in detectable amounts of gene flow among the involved peoples and that the interpretation of extant genetic patterns benefits from an understanding of the combined data.
Neolithic in Northern Africa
Approximately 14 kya, climatic changes associated with the end of the Last Glacial Maximum resulted in regions around the world becoming more favorable to human exploitation. Northern Africa is one such region, and ~13 kya, novel technologies (“Natufian”) thought to be the immediate precursor to agricultural technologies emerged and were associated with semisedentary subsistence and population expansions in northeastern Africa (Bar-Yosef, 1987). Moreover, before the emergence of the Natufian-styled artifacts, the archaeological record includes two artifact styles, the “Geometric Kebaran” and the “Mushabian” associated with Middle Eastern and Northern African populations, respectively (Bar-Yosef, 1987). The archaeological evidence suggests the peoples using these assemblages interacted for well over 1,000 years, and linguistic evidence suggests that the peoples using these assemblages may have spoken some form of proto-Afroasiatic (Bar-Yosef, 1987; Ehret et al., 2004). Although the origins of the Afroasiatic language family remain contentious, linguistic data generally support a model in which the Afroasiatic language family arose in Northern Africa >10 kya (Ehret et al., 2004). Moreover, analyses of the Cushitic branch of the Afroasiatic language family suggest that proto-Cushitic arose and diversified at least 7 kya, and this likely took place in Ethiopia (Ehret, 1979).
Intriguingly, the origin and diversification of proto-Afroasiatic is consistent with the spread of intensive plant collection in the archaeological record, and some interpret this pattern to represent a model in which proto-Afroasiatic speakers developed the novel subsistence technology resulting in the expansion and spread of their Afroasiatic descendants in the region (Ehret, 1979). Some examples of the relevant linguistic data include reconstructed Chadic root words for “porridge” and “sorghum” and the Cushitic root words for “grain” and “wheat” (Ehret, 1979). Because these and other root words are present in many of the Chadic and Cushitic languages, it is assumed that they were present in the proto-Chadic and proto-Cushitic languages and therefore must be as old as those proto-languages (Ehret, 1979).
The genetic data appear to be consistent with the archaeological and linguistic data indicative of extensive population interactions between North African and Middle Eastern populations. A recent NRY study explores the distribution of haplogroups in a sample of African, Middle Eastern, and European males (Semino et al., 2004). Whereas a subclade of haplogroup E (M35) appears to have arisen in eastern Africa over 20 kya and subsequently spread to the Middle East and Europe, haplogroup J (M267) appears to have arisen in the Middle East over 20 kya and subsequently spread into northern Africa (Semino et al., 2004). A recent study of genome-wide autosomal microsatellite markers reports that Middle Eastern and African samples share the highest number of alleles that are also absent in other non-African samples, consistent with bidirectional gene flow (Tishkoff et al., 2009). In addition, a recent study of domestic goat mtDNA and NRY variation reports similar findings as well as evidence of trade along the Strait of Gibraltar (Pereira et al., 2009). The combined archaeological, linguistic, and genetic data, therefore, suggest bidirectional migration of peoples between northern Africa and the Levant for at least the past ~14 ky.
Neolithic in Sahel
There is increasing archaeological, linguistic, and genetic evidence that the Sahel has been an important region for bidirectional migration between western and eastern Africa (Bereir et al., 2007; Cerny et al., 2007; Hassan et al., 2008; Tishkoff et al., 2009). Linguistic evidence indicates population interactions for ~20–10 kya between the Nilo-Saharan and Afroasiatic speakers in this region (Cavalli-Sforza et al., 1994). The combined linguistic and archaeological data support a model in which the Nilo-Saharan language family arose in eastern Sudan >10 kya and Nilo-Saharan speakers subsequently migrated westward to Lake Chad and southward into southern Sudan (Ehret, 1983; Tishkoff et al., 2009). Linguistic data also suggest that ~7 kya, proto-Chadic Afroasiatic speakers migrated from the Sahara into the Lake Chad Basin (Newman, 1997). This possibility is supported by an analysis of NRY variation that finds that the pattern and distribution of haplogroup R (V88) are consistent with the emergence of proto-Chadic ~7 kya and subsequent expansion of this linguistic group into the Lake Chad Basin (Cruciani et al., 2010). Whereas the inferred migration route is not consistent between NRY and mtDNA analyses, perhaps due to sex-biased migration, studies of mtDNA corroborate a model in which Sahel is a corridor for bidirectional migration between eastern and western Africa and, on the basis of the distribution of haplogroup L3f3, the proto-Chadic speakers expanded from eastern Africa into the Lake Chad Basin (Cerny et al., 2007, 2009).
The Spread of Pastoralism
Archaeological data suggest that the emergence of animal husbandry in northeastern Africa took place as early as ~11 kya (Wendorf and Schild, 1998). Archaeological studies in Nabta Playa (in Egypt’s Western Desert) reveal a spectrum of artifacts consistent with pastoralism and adaptation to the desert environment, including particular pottery styles (Khartoum tradition), evidence of well technology, and cattle burials (McDonald, 1998; Wendorf and Schild, 1998). By ~8 kya, evidence is present of imported (from the Middle East) sheep or goat remains in northeastern Africa [e.g., McDonald (1998)]. Some controversy persists in the archaeological community regarding whether cattle domestication was developed in northern Africa or imported from the Middle East; however, recent DNA analysis of extant indigenous African bovine taurine and zebu cattle (Hanotte et al., 2002) supports a model in which the earliest emergence of pastoralism involving taurine cattle took place in northeastern Africa and subsequently spread westward and southward (Hanotte et al., 2002). A recent analysis of NRY variation in 13 eastern and southern African population samples suggests that the spread of pastoralism from eastern Africa to southern Africa was accompanied by migration of pastoral peoples as well as pastoral technology as evidenced by the distribution of NRY haplogroup M293 (and the subclade E3b1f-M293) (Henn et al., 2008). Furthermore, the most likely source for this migration based on the samples included in Henn et al. (2008) would have been the southern Nilotic speaking Datog (because the haplotype frequency and diversity of M293 is highest in the Datog) ~2 kya (Henn et al., 2008).
Ehret (1967) inferred the history of pastoralism in Africa from a linguistic analysis of shared cognates. His findings support a relatively ancient emergence of pastoralism in northeastern Africa corresponding to Eastern Sudanic, Central Sudanic, and possibly Southern Cushitic speakers, followed by the subsequent spread of cattle keeping to western and southern Africa (Ehret, 1967). The relatively ancient emergence of pastoralism in the archeological record is supported by the reconstruction of proto-Cushitic languages. For example, there are at least two words for cattle that are thought to be relatively old, one in Northern Cushitic and the other in Central Cushitic. In proto-Cushitic, the word “hlee,” which translates to “head of cattle,” is related to the Southern Cushitic (Mbugu) word “hline,” which translates to “heifer” (Ehret, 1967), and so on. Furthermore, estimates of linguistic diversity of vocabulary related to cattle suggest that cattle keeping arose in northeastern Africa and subsequently spread to western and southern Africa (Ehret, 1967).
Ehret (1967) also argues that the spread of cattle milking was separate and more recent than the spread of cattle keeping. He discusses the assumption that the spread of cattle milking would require some discern-
ible impact on the language used to discuss it (Ehret, 1967). For example, the proto-Bantu word for milk is related to the proto-Bantu word for breast, but there are several root words for milk (many likely borrowed from other languages) among the Bantu languages. However, there is only one root word for milking (literally to squeeze). This observation is interpreted to support a model in which a Bantu population in Tanzania borrowed the word (possibly from the southern Cushitic speakers) representing milking as well as the actual technology related to cattle milking and subsequently spread the technology to other Bantu-speaking populations (Ehret, 1967).
The shift from food gathering to food producing inferred from African archaeological and linguistic data also resulted in a detectible genetic signal. This relationship between subsistence, culture, and biology due to gene/culture coevolution is one that has been of special interest in human genetics studies. Models of Darwinian (i.e., positive) selection are consistent with subsistence being an environmental factor that can have a profound effect on patterns of genetic variation, and the emergence of agriculture and pastoralism is tied to increased population densities and dietary changes. Thus, genetic variants that conveyed a selective advantage in this shift in diet from foraging to animal and plant products would have persisted and increased in frequency in agricultural and pastoralist communities.
Lactase persistence is one of the better studied examples of gene/culture coevolution (e.g., Durham, 1991; Hollox and Swallow, 2002). In most mammals, once an individual is weaned, it loses the ability to produce the enzyme lactase-phlorizin hydrolase (LPH), which is necessary to digest the sugar lactose present in milk without gastric distress (Ingram et al., 2009). The majority of humans do not express this enzyme as adults (referred to as the “lactase nonpersistence” phenotype) (Swallow, 2003). Several widespread mutations, however, result in the continued production of LPH into adulthood, a trait often referred to as lactase persistence (Tishkoff et al., 2007b). The distribution of the lactase persistence phenotype is intriguing given what is known about subsistence patterns worldwide (Fig. 5.2). Lactase persistence is present at high frequency in Northern European dairying and African pastoralist populations; at moderate frequency in southern European and Middle Eastern populations; and at low frequency in nonpastoral Asian, Pacific, American, and African populations (Ingram et al., 2009). In Europeans, the most common mutation associated with lactase persistence is thought to be a regulatory mutation located upstream of the gene that encodes LPH (a T at position –13910), within intron 13 of the neighboring MCM6 gene (Enattah et al., 2002; Swallow, 2003). Further, this mutation is located within a large linkage disequilibrium block that is thought to have arisen ~20–2 kya, consistent
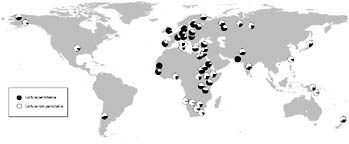
FIGURE 5.2 Global map showing the frequency of the lactase persistence trait for populations reported in Ingram et al. (2009) and citations therein. Lactase persistence is shaded in black.
with recent positive selection related to the emergence of cattle domestication and milk consumption ~10 kya in the Middle East (Edwards et al., 2007; Enattah et al., 2008).
In African populations, the lactase persistence phenotype is generally highest in pastoral populations (Swallow, 2003; Mulcare et al., 2004; Ingram et al., 2007, 2009; Tishkoff et al., 2007b). However, with the exception of the Fulani and Hausa populations (Mulcare et al., 2004), other African pastoralist populations do not have the T-13910 mutation associated with the lactase persistence trait (Ingram et al., 2007; Tishkoff et al., 2007b). Recent studies have identified at least three additional and independent mutations that are associated with lactase persistence in East African pastoralist populations: C-14010, which is most common in Kenya and Tanzania (Tishkoff et al., 2007b); G-13907, which is present at low to moderate frequency in northeast Africa (Ingram et al., 2007; Tishkoff et al., 2007b); and G-13915, which is most common in the Middle East (Enattah et al., 2008) and northeastern Africa (Ingram et al., 2007; Tishkoff et al., 2007b) and may be associated with camel domestication in the Middle East ~6 kya (Enattah et al., 2008). Tishkoff et al. (2007b) demonstrated that all three variants result in significant increases in gene expression levels driven by the lactase promoter.
The most common variant within Africa associated with lactase persistence (C-14010) is also located within an extremely large linkage disequilibrium block (2 Mb) and is thought to have arisen ~6.8–2.7 kya in either the agropastoralist Afroasiatic populations that migrated into Kenya and Tanzania from Ethiopia within the past 5,000 years or the Nilo-Saharan pastoralist populations that migrated into the region from southern Sudan within the past 3,000 years, and the variant then subsequently spread throughout pastoral populations in eastern Africa relatively rapidly, con-
sistent with the spread of pastoralism into sub-Saharan Africa ~4.5 kya (Tishkoff et al., 2007b). The estimates of the selection coefficients of the African mutations (0.035–0.097) are among the highest reported for modern humans, and intuitively this makes sense given not only the increased nutritional value of drinking milk as an adult but also the increased source of water in regions such as the Sahara where dehydration and diarrhea can cause death.
Bantu Expansion
In sub-Saharan Africa, the long-range exchange networks of Neolithic technology and associated spread of Bantu languages (which we refer to here as the “Bantu expansion” for the sake of simplicity) have had a major influence on biological and cultural diversity in sub-Saharan Africa. On the basis of archaeological and linguistic data, the Bantu languages and associated agricultural and iron age technologies are thought to have originated in Nigeria or Cameroon (Greenberg, 1972) ~5,000 years ago (Phillipson, 1975; Berniell-Lee et al., 2009) and spread relatively rapidly across sub-Saharan Africa. The extent to which this was associated with the migration of populations vs. a diffusion of language and technology among populations has been debated.
The linguistic classification of the ~600 Bantu languages is interpreted to represent several dispersals throughout sub-Saharan Africa [e.g., Vansina (1995)]. Ehret (2001) argues that proto-Bantu diverged into several daughter clades, all but one of which are spoken only in the northwestern region of the Bantu-speaking areas (i.e., western central Africa), and the other of which was a forest Savanna Bantu clade. Ehret (2001) goes on to argue that the forest Savanna Bantu clade diverged into several daughter clades, including the Savanna Bantu clade, and this diversification is linked to the spread of Bantu languages into central and southern Africa. The Savanna Bantu clade includes most of the contemporary languages spoken in eastern Africa, southeastern Africa, southwestern Africa, and the southern Savanna belt. This reconstruction supports a model in which proto-Bantu emerged in western central Africa ~5,000 years ago and diversified and spread across the rainforest for ~2,000 years before the first archaeological evidence of eastern Bantu speakers in the Great Lakes region (Ehret, 2001).
Archaeological evidence related to the Bantu expansion largely focuses on the distribution of Early and Late Iron Age sites in Africa. Phillipson argues that the Eastern Bantu languages likely arose in western central Africa around the time of the emergence of Early Iron Age artifacts consistent with cattle keeping, but that the spread of Eastern Bantu languages
is associated with the distribution of “later Iron Age” sites in central and southern Africa (Phillipson, 1976).
There is also a genetic signature of past population movements thought to be associated with the Bantu expansion. The large majority of genetic analyses have focused on mtDNA and NRY data. Overall, both datasets tie particular mtDNA (e.g., L0a, L2a, L3b, and L3e) (Pereira et al., 2001; Salas et al., 2002, Plaza et al., 2004; Beleza et al., 2005; Wood et al., 2005; Quintana-Murci et al., 2008) and NRY [e.g., E3a (M2/M180), E2 (M75), and B2a (M150)] (Beleza et al., 2005; Henn et al., 2008; Berniell-Lee et al., 2009) lineages to the Bantu expansion, because they are found in the highest frequencies in extant Bantu-speaking populations. Interestingly, comparative studies of mtDNA and NRY variation suggest different maternal and paternal population histories related to the Bantu expansion (Beleza et al., 2005; Wood et al., 2005). Specifically, NRY variation in regions affected by the Bantu expansion is low relative to mtDNA variation and consists almost exclusively of haplogroup lineages associated with the Bantu expansion (Wood et al., 2005). Conversely, the mtDNA haplogroup lineages in the same samples include lineages associated with the Bantu expansion as well as lineages that are thought to have been present in the region before the Bantu expansion (Tishkoff et al., 2007a). This discrepancy is largely attributed to sex-biased migration and gene flow due to the practice of patrilocality and/or polygyny (Wood et al., 2005; Pilkington et al., 2008), both of which are common in present-day Bantu-speaking populations. Moreover, this pattern of sex-biased gene flow is documented independently in other regions of the world such as the Pacific Islands (Scheinfeldt et al., 2006; Friedlaender et al., 2008). Both loci, however, are more susceptible to genetic drift than autosomal loci because of their relatively smaller effective population sizes; therefore, some of the differential male/female patterns may be attributed to chance. A recent analysis of genome-wide autosomal data is consistent with a large genetic impact of the Bantu expansion on most of sub-Saharan Africa, as evidenced by the presence of Niger-Kordofanian ancestry in many central, eastern, and southern African populations (Tishkoff et al., 2009). In addition, Tishkoff et al. (2009) documented evidence from their analysis of genome-wide autosomal loci of a distinct Bantu migration from eastern to southern Africa, which is consistent with the archaeological and linguistic evidence of dispersal of Bantu technology and languages from the Great Lakes region of East Africa (Ehret, 2001).
CONTEMPORARY AFRICAN GENETIC AND LINGUISTIC VARIATION
Scholars have studied language relationships within a cladistic framework since at least the early 19th century (Atkinson and Gray, 2005), and given the parallels in linguistic and genetic change over time, it is not unreasonable to use linguistic affiliations as a way of grouping individuals for genetic study. Several studies have demonstrated a correlation between linguistic and genetic variation, including cases in Europe (Cavalli-Sforza and Feldman, 1981; Piazza et al., 1995), Asia (Karafet et al., 2001), the Pacific (Merriwether et al., 1999; Robledo et al., 2003; Scheinfeldt et al., 2006; Friedlaender et al., 2008), and the Americas (Smith et al., 2000; Malhi et al., 2001; Eshleman et al., 2004; Wang et al., 2007). The main difficulty in these studies lies in the interpretation of linguistic similarities among populations. Whereas language sharing obviously results from some degree of contact among peoples, the horizontal transmission of language can occur with little to no genetic exchange. Likewise, there can be genetic exchange with little or no linguistic exchange. Therefore, the degree of correlation between genetic and linguistic variation varies depending on the populations being studied.
Studies of genetic variation within Africa, as mentioned above, have found extensive amounts of genetic variation relative to non-Africans owing to the fact that the “out of Africa” bottleneck significantly reduced genetic variation in non-Africans; however, most genetic studies of African populations are limited by the number of population samples included. More recent work has improved the understanding of genetic variation in Africa with a survey of genome-wide genetic variation in geographically and ethnically diverse African samples (Tishkoff et al., 2009). Tishkoff et al. (2008) analyzed 1,327 genome-wide autosomal microsatellite and insertion/deletion polymorphisms in 121 African population samples and a comparative sample of 1,394 non-Africans. The authors (Tishkoff et al., 2009) studied population structure and relationships using the program STRUCTURE (Pritchard et al., 2000), among other phylogenetic analyses. The STRUCTURE program uses a model-based Bayesian clustering approach to identify genetic subpopulations and assign individuals probabilistically to these subpopulations on the basis of their genotypes, while simultaneously estimating ancestral population allele frequencies. The program STRUCTURE places individuals into K clusters, where K is chosen in advance and is varied across independent runs, and individuals can have membership in multiple clusters (Pritchard et al., 2000). Tishkoff et al. (2009) inferred 14 ancestral population clusters globally as well as within Africa and found that the African samples cluster geographically as well as linguistically and ethnically (Table 5.1). In addition to the STRUCTURE analysis, the authors (Tishkoff et al., 2009) constructed a
TABLE 5.1 Inferred Population Clusters Using the STRUCTURE Analysis of Autosomal Microsatellite and Insertion/Deletion Polymorphism Data from Global Populations Adapted from Tishkoff et al. (2009)
|
K |
Emerging Clusters |
|
2 |
African, non-African |
|
3 |
East Asian, Oceanic, Native American |
|
4 |
Eastern African |
|
5 |
Hadza, Sandawe, SAK, Pygmy |
|
6 |
Western Pygmy |
|
7 |
Chadic, Nilo-Saharan |
|
8 |
Indian, Oceanic |
|
9 |
Oceanic |
|
10 |
Native American |
|
11 |
Mbuti Pygmy, SAK |
|
12 |
Chadic/Nilo-Saharan speakers from northern Cameroon, Chad, and southern Sudan |
|
13 |
Sandawe |
|
14 |
Fulani |
neighbor-joining tree on the basis of pairwise population genetic distances that showed that the African samples clustered primarily by geographic region and to a lesser extent by linguistic affiliation with a few notable exceptions. The pygmies from central Africa, for example, clustered near the southern African San.
Several studies have looked at the relationship between genetic and linguistic variation in African samples (Sanchez-Mazas, 2001; Lane et al., 2002; Tishkoff et al., 2007a, 2009; Hassan et al., 2008; Henn et al., 2008; Bryc et al., 2010). For example, an NRY study of Nilo-Saharan, Niger-Congo, and Afroasiatic speakers in Sudan revealed a strong correlation (Mantel test: r = 0.31, P = 0.007) between linguistic and NRY variation (Hassan et al., 2008), and in this case the correlation between linguistic and genetic variation was stronger than the correlation between geographic and genetic distances (Mantel test: r = 0.29, P = 0.025). Similarly, a study of mtDNA and NRY variation in 40 African samples representing all four language families reports a significant correlation between genetic and linguistic distances (Mantel of NRY, r = 0.32, P = 0.001; Mantel of mtDNA, r = 0.23, P = 0.016) (Wood et al., 2005).
The single-locus studies of genetic and linguistic correlation are consistent with the regression analysis reported by Tishkoff et al. (2009) that documents significant correlations between linguistic and genetic distances
within the Niger-Kordofanian and Nilo-Saharan language families after correction for geographic distances. To further explore the relationship among genetic and linguistic variation in Africa, we used the published dataset of genome-wide data from Tishkoff et al. (2009) that includes 103 population samples (n ≥ 10) that speak languages representing all four African language families. We first performed a Mantel test to determine to what extent genetic and linguistic distances are correlated within language families. Not surprisingly, all three tests showed that linguistic and genetic distances were significantly correlated (with 100,000 permutations): Niger-Kordofanian, r = 0.32, P = 9.99−6; Nilo-Saharan, r = 0.29, P = 9.99−6; and Afroasiatic, r = 0.27, P = 9.99−6 (the linguistic relationships among the Khoesan speakers are not clearly understood and therefore did not permit the construction of a linguistic distance matrix needed to perform a Mantel test); and the correlation coefficient is >25% in all three tests.
Because we and others (Tishkoff et al., 2009) have established a significant correlation between linguistic affiliation and genetic variation within three of the African language families, we wanted to explore to what degree samples plotted by genetic distance cluster by language family. We used multidimensional scaling (MDS) to construct a two-dimensional plot of a pairwise genetic distance matrix taken from the above-mentioned 103 population samples (Tishkoff et al., 2009). Consistent with the mtDNA and NRY studies discussed above (Wood et al., 2005; Hassan et al., 2008), our genome-wide analysis of microsatellite data shows that populations generally cluster on the basis of both geographic region and linguistic classification. Fig. 5.3 demonstrates that populations generally separate by linguistic affiliation along dimension 1. Dimension 2 separates the SAK speakers from all other Africans including the eastern Khoesan speakers, the Hadza and Sandawe, that cluster closely with other eastern Africans. Another interesting pattern that emerges in the MDS plot that is consistent with previous work (Tishkoff et al., 2009) is the clustering of the Afroasiatic Chadic speakers with the Nilo-Saharan speakers, which may reflect a past language shift (Tishkoff et al., 2009).
Because the distribution of language families in Africa roughly follows a geographic distribution (Fig. 5.1), we also performed MDS within geographic regions that include at least three language families. In central Africa (Fig. 5.4), the samples cluster by language family with a few notable exceptions. For example, the Fulani who are nomadic pastoralists that speak a Niger-Kordofanian language and reside across central and western Africa do not cluster with other Niger-Kordofanian-speaking populations. Moreover, the Fulani are distinguished from other African samples at K = 14 in Tishkoff et al.’s (2009) STRUCTURE analysis. Morphological analyses of the Fulani have been interpreted to suggest a Middle Eastern
![FIGURE 5.3 Multidimensional scaling (MDS) analysis of autosomal microsatellite data from Tishkoff et al. (2009). A pairwise genetic distance matrix using (δμ)2 [as described in Tishkoff et al. (2009)] was constructed for populations with a sample size of n ≥ 10 and used for MDS analysis. Populations are distinguished on the basis of linguistic affiliation. The Afroasiatic speakers are displayed as open circles, the Nilo-Saharan speakers are displayed as triangles, the Khoesan speakers are displayed as filled circles, and the Niger-Kordofanian speakers are displayed as squares. The Khoesan speakers are labeled. The x axis represents dimension 1 and the y axis represents dimension 2.](/openbook/12931/xhtml/images/p2001c3c8g95001.jpg)
FIGURE 5.3 Multidimensional scaling (MDS) analysis of autosomal microsatellite data from Tishkoff et al. (2009). A pairwise genetic distance matrix using (δμ)2 [as described in Tishkoff et al. (2009)] was constructed for populations with a sample size of n ≥ 10 and used for MDS analysis. Populations are distinguished on the basis of linguistic affiliation. The Afroasiatic speakers are displayed as open circles, the Nilo-Saharan speakers are displayed as triangles, the Khoesan speakers are displayed as filled circles, and the Niger-Kordofanian speakers are displayed as squares. The Khoesan speakers are labeled. The x axis represents dimension 1 and the y axis represents dimension 2.
origin for the Fulani (Ehret, 2008), and there has been some speculation based on linguistic data that the Fulani migrated to central Africa from northern Africa or the Middle East (Ehret, 2008). In addition, there is evidence of shared recent ancestry and/or gene among the Fulani and European/Middle Eastern samples from studies of mtDNA (Cerny et al., 2006), NRY (Hassan et al., 2008), and autosomal microsatellites (Tishkoff et al., 2009) and from the presence in this population of the mutation associated with lactose tolerance in Europeans (T-13910) (Mulcare et al., 2004).
Whereas previous work on mtDNA (Cerny et al., 2006) is consistent with a West African origin for the Fulani (consistent with their Niger-Kordofanian language classification), the NRY data reveal that the Fulani share recent ancestry with Nilo-Saharan- and Afroasiatic-speaking populations (Hassan et al., 2008). As in other cases where the maternal and paternal patterns of population history are not in agreement, this result could reflect differential patterns of Fulani male and female migration and gene flow, or it could reflect the influence of genetic drift or some
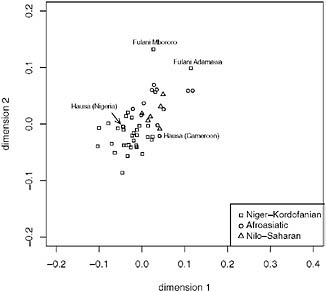
FIGURE 5.4 Multidimensional scaling (MDS) (k = 2) analysis of data from Tishkoff et al. (2009). We included central African populations with a sample of n ≥ 10, constructed a pairwise distance matrix using (δμ)2 (as described in Tishkoff et al., 2009), and the population samples are displayed by linguistic affiliation. The Afroasiatic speakers are shown as open circles, the Nilo-Saharan speakers are shown as triangles, and the Niger-Kordofanian speakers are shown as squares. The Fulani and Hausa population samples are labeled. The x axis represents dimension 1 and the y axis represents dimension 2.
combination of the two. A more recent analysis of genome-wide autosomal data shows that the Fulani, who form a distinct population cluster, show genetic similarities with the Chadic- and Central Sudanic-speaking populations (Tishkoff et al., 2009). This result is consistent with our MDS analysis in which both Fulani cluster most closely with the Chadic- and Central Sudanic-speaking populations, as well as with the Baggara (Semitic). The clustering of the Baggara near the Fulani is also consistent with Tishkoff et al. (2009), who report that the Baggara share ancestry with the Fulani and with the Chadic speakers.
To a lesser extent, the Hausa from Nigeria and Cameroon cluster more closely with the Niger-Kordofanian speakers along dimension 2 (Fig. 5.4). This result is consistent with previous genetic analysis (Tishkoff et al., 2009) and with linguistic analysis of the Hausa that suggests extensive interaction between the Hausa (who speak an Afroasiatic Chadic language) and Niger-Kordofanian speakers as evidenced by an analysis of loanwords (Ehret, 2006).
In eastern Africa (Fig. 5.5, dimension 1 separates the Afroasiatic and Niger-Kordofanian samples, and dimension 2 separates the Nilo-Saharan samples. As in Fig. 5.3, the Hadza and Sandawe do not separate from the eastern African samples along either dimension to any large extent, although they do cluster closely to each other (Fig. 5.5), and this pattern is consistent with extensive regional gene flow with neighboring populations. The other noteworthy pattern in this plot is the Luo sample (Fig. 5.5), who speak a Western Nilotic language but cluster separately from other Nilo-Saharan speakers along dimension 1, together with Bantu-speaking populations. This clustering is consistent with previous findings that the Luo show predominately Bantu ancestry (Tishkoff et al., 2009) and may reflect high levels of admixture among the Luo and geographically nearby Bantu populations (Bennett, 1983).
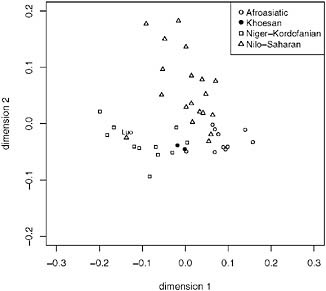
FIGURE 5.5 Multidimensional scaling (MDS) (k = 2) analysis of data from Tishkoff et al. (2009). We included eastern African populations with a sample of n ≥ 10, constructed a pairwise distance matrix using (δμ)2 (as described in Tishkoff et al., 2009), and the population samples are displayed by linguistic affiliation. The Afroasiatic speakers are shown as open circles, the Nilo-Saharan speakers are shown as triangles, the Khoesan speakers are shown as filled circles, and the Niger-Kordofanian speakers are shown as squares. The Luo population sample is labeled. The x axis represents dimension 1 and the y axis represents dimension 2.
History of Hunter-Gatherer Populations
As mentioned previously, the classification of languages within the Khoesan language family is contentious given the high diversity within each subclade and extreme divergence among them (Sands, 1998; Ehret, 2000), particularly for the Sandawe and Hadza. A common classification, therefore, groups the three languages spoken in South Africa into a separate branch (SAK) from the more divergent Sandawe and Hadza (Heine and Nurse, 2000). One interpretation of this extreme linguistic diversity is that the last common ancestor of the language family must be extremely ancient, and Ehret (2000) estimates the TMRCA to be at least 20 kya (which approaches the limit in timescale to linguistic reconstruction). The Sandawe and SAK are more similar to each other linguistically than either one is to the Hadza. Geographically, however, the Sandawe and Hadza are extremely close to each other (150 km apart in Tanzania), and both are geographically distant from the SAK populations residing in southern Africa.
A recent study of mtDNA and NRY variation investigates the genetic relationship among the Hadza, Sandawe, and SAK (Tishkoff et al., 2007a). The authors find that in general, the Hadza and Sandawe are more genetically similar to each other than either one is to the SAK. However, the Sandawe and SAK share ancient mtDNA lineages, which may suggest an ancient common ancestry. For example, mtDNA haplogroup L0d is present at high frequency in the SAK and at low frequency in the Sandawe, but is not present in the Hadza samples (Tishkoff et al., 2007a), and the TMRCA estimate of the SAK and Sandawe L0d lineages is ancient (~60 kya) (Tishkoff et al., 2007a). Similarly, the SAK and Sandawe share NRY haplogroup A (M91), which is not present in the Hadza samples (Tishkoff et al., 2007a). On the other hand, haplogroup L4g is common in both the Sandawe and the Hadza and absent from the SAK samples, and the TMRCA for the Sandawe and Hadza L4g is more recent (~25 kya) (Tishkoff et al., 2007a). And all three samples share NRY haplogroup B2b (M112) (Tishkoff et al., 2007a). The authors (Tishkoff et al., 2007a) discuss more than one interpretation of these results. The absence of mtDNA haplogroup L0d and NRY haplogroup A (M91) from the Hadza could reflect loss due to genetic drift because there is evidence of a recent bottleneck in the Hadza (Blurton Jones et al., 1992). Alternatively, the pattern of haplogroup variation could reflect an ancient linguistic and genetic divergence of the Hadza from the SAK. Moreover, the authors (Tishkoff et al., 2007a) performed a likelihood analysis to estimate the time of divergence among the populations and found that the divergence between the Hadza and the Sandawe was >20 kya and the divergence between the Hadza/Sandawe and the SAK was >40 kya. Additional studies of mtDNA and NRY variation have identified ancient shared lineages among the SAK and the Hadza as well as
several other eastern African populations (Underhill et al., 2000; Cruciani et al., 2002; Semino et al., 2002, 2004; Knight et al., 2003). Consistent with the mtDNA and NRY data, our MDS analysis shows that the Hadza and Sandawe cluster closely together with each other and with other eastern African populations (Fig. 5.3). Additionally, the Hadza are slightly farther from the SAK than the Sandawe along both dimensions (Fig. 5.3).
Tishkoff et al. (2009) provide evidence for an ancient common ancestry of Khoesan and Pygmy populations, suggesting the possibility of a proto-Khoesan hunter-gatherer population in eastern Africa that diverged >30 kya. STRUCTURE analysis revealed that the pygmies cluster together with other hunter-gatherer samples, including the SAK, Hadza, and Sandawe at low K values (K = 3), and then differentiate at higher K values (K = 5) (Table 5.1). The analysis also shows that the Mbuti pygmies cluster with the SAK at higher K values (K = 7), which could be due to either common ancestry or more recent gene flow. In addition, recent work on mtDNA, NRY, and autosomal data estimated the TMRCA of the pygmy and agricultural populations to be approximately 70–60 kya and the TMRCA of western and eastern pygmies to be approximately 20 kya (Destro-Bisol et al., 2004; Quintana-Murci et al., 2008; Patin et al., 2009). The findings of Tishkoff et al. (2009) raise the possibility that the pygmy populations, who have lost their indigenous language, once spoke some form of proto-Khoesan with click consonants. Interestingly, linguistic analysis of the SAK suggests that they originated in eastern Africa and possibly as far north as Ethiopia before migrating into southern Africa, consistent with the identification of rock art in the Sandawe homeland and in southern Africa that is thought to be related to Khoesan speakers (Lim, 1992). There is further evidence that, although there has not been recent gene flow among these populations, there has been recent admixture between the Sandawe and neighboring populations as well as between the pygmies and neighboring populations, and this recent admixture may be obscuring the more ancient relationships among the hunter-gatherer populations (Tishkoff et al., 2009). Future analyses that incorporate data from across the genome together with full-likelihood or approximate Bayesian computation methods will be necessary to more fully understand these complex population histories.
CONCLUSIONS
We have presented here a synthesis of the archaeological, linguistic, and genetic data used to infer African population history. The general picture that emerges is that genetic variation in Africa is structured geographically and to a lesser extent linguistically. This is consistent with the fact that populations in close geographic proximity to each other as well
as populations that speak linguistically similar languages are more likely to exchange genes. The pattern of genetic variation in Africa is also consistent with geographic barriers limiting gene flow as exampled by the geographic/genetic distinction between northern African and sub-Saharan African populations. When we focus, however, on particular exceptions to these broad patterns, we are able to more fully appreciate the complex population histories that have contributed to extant patterns of genetic variation. The development of sequencing and genotyping technologies is advancing at an unprecedented rate and is allowing for the genotyping of millions of single-nucleotide polymorphisms and the sequencing of millions of nucleotides across populations. These data, coupled with computational methods for inferring demographic parameters and testing demographic models (e.g., maximum likelihood and approximate Bayesian computation), are well powered to refine our understanding of African past population histories. The incorporation of archaeological and linguistic data will be important for establishing testable hypotheses and elucidating the evolutionary processes (or forces) that have shaped the genomic landscape in Africa.
ACKNOWLEDGMENTS
We thank Scott Williams, Françoise Friedlaender, William Beggs, Charla Lambert, Joseph Jarvis, Michael Campbell, and the Tishkoff Lab members for support and helpful discussions. This work was funded by National Science Foundation Grants BCS-0196183 and BCS-0827436, National Institutes of Health Grants R01GM076637 and 1R01GM083606–01, and National Institutes of Health Pioneer 1-DP1-OD-006445–01 awards (to S.A.T.).


