
3
Cardiovascular Disability Trends
IMPACT OF CARDIOVASCULAR DISEASES
Although the mortality rate from cardiovascular disease has declined by 65 percent over the past 4 decades, it remains the leading cause of death for men and women in the United States (NHLBI, 2009). In 2006, 831,000 Americans died of cardiovascular diseases, compared with 560,000 deaths from cancer, 125,000 from chronic obstructive pulmonary disease and other respiratory conditions, and 122,000 from accidents, which were the next most common causes of death (Lloyd-Jones et al., 2010; NHLBI, 2009).
Prevalence
Approximately 81 million American adults (more than one in three) have cardiovascular disease, and more than half of them (53 percent) are under age 60 (Lloyd-Jones et al., 2010). Specifically, of the 81 million
-
74.5 million have high blood pressure that, if uncontrolled, will eventually result in substantial morbidity and death;
-
17.6 million have coronary heart disease, of whom 10.2 million will suffer from angina pectoris (chest pain) and 8.5 million will experience a myocardial infarction (heart attack);
-
5.8 million have heart failure;
-
6.4 million have had a stroke; and
-
Between 650,000 and 1.3 million have congenital cardiovascular defects.
Prevalence increases with age, but cardiovascular disease is not just a disease of the aged. Although only about 10 percent of adults ages 20 to 39 have a cardiovascular condition, that percentage rises to nearly 40 percent among those ages 40 to 59 (Lloyd-Jones et al., 2010).
Incidence
According to the Framingham Heart Study, the incidence of cardiovascular disease also increases with age, up to 74 cases per thousand person-years among men ages 85 to 94. However, among working-age persons, the incidence among men ages 45 to 54 and ages 55 to 65 is 10 and 24 cases per thousand person-years, respectively (NHLBI, 2006).1
Morbidity and Disability
Cardiovascular diseases also cause substantial morbidity and disability. Cardiovascular conditions are a major cause of sick leave, and diseases of the circulatory system are estimated to be the fourth most common basis for long-term disability insurance claims (Leopold, 2003).
Since at least 1990, cardiovascular diseases have accounted for the highest number of inpatient hospital days (followed by respiratory diseases, mental disorders, and injuries) and for the highest health care expenditures (NHLBI, 2009). In 2007, heart disease was the third leading cause of activity limitation, after arthritis and back/neck conditions, and hypertension was sixth (NHLBI, 2009).
SOCIAL SECURITY CARDIOVASCULAR DISABILITY TRENDS
Total Beneficiaries and New Awardees in 2008
In December 2008, 758,324 adults ages 18 to 64 whose primary impairment was a disease of the circulatory system were receiving Social Security Disability Insurance (SSDI) or Supplemental Security Income (SSI) benefits (SSA, 2009a). They constituted 6.9 percent of the adult disability beneficiaries. Diseases of the circulatory system are the fourth most prevalent diagnostic category among adult beneficiaries after mental disorders (43.1 percent), diseases of the musculoskeletal system and connective tissue (20.3 percent), and diseases of the nervous system and sense organs (9.1 percent). In December 2008, 5,862 children under age 18 were receiving SSI
disability benefits for diseases of the circulatory system, and an additional 60,466 were receiving benefits for congenital anomalies, some of which may be cardiovascular related, but the exact number cannot be known without further research (SSA, 2009b).
During 2008, 95,445 adults with a disease of the circulatory system were awarded SSDI benefits, which was nearly 10 percent of the SSDI allowances awarded that year and the third highest number of allowances after those for adults with diseases of the musculoskeletal system and connective tissue, and with mental disorders (SSA, 2009a). In 2008, 915 children under age 18 with diseases of the circulatory system were awarded SSI benefits, and 8,625 with congenital anomalies, some of which may be cardiovascular-related, were awarded SSI benefits (SSA, 2009b).
Disposition of Adult Cardiovascular Disability Claims, 1989–2008
For the past 20 years, the Social Security Administration (SSA) has decided about 145,000 adult claims a year for SSDI or SSI benefits, or both, for adults with a cardiovascular condition as the primary impairment (Figure 3-1).2
Over the same period, the initial allowance rate for adult cardiovascular claims averaged about 40 percent each year (Figure 3-2), but the share of allowances based on meeting or medically equaling the Listings—thus avoiding the time- and resource-intensive Steps 4 and 5 of the sequential evaluation process—dropped substantially, a trend that is discussed in the next section.
Use of the Adult Cardiovascular Listings
Body System-Level Trends
Closer inspection of the share of initial adult allowances made at Step 3 (based on the cardiovascular listings) rather than at Step 5 (based on residual functional capacity, age, education, and work experience) shows a substantial decrease in the share of allowances made at Step 3 for adult cardiovascular claims, from 60 percent in 1990 to 26 percent in 2008 (Figure 3-3). The shift from the majority of initial adult cardiovascular allowances being made at Step 3 to the majority of allowances being made at Step 5 was fairly steady except for a substantial decrease in the share of listings-based allowances in 1994 that continued through 1995.
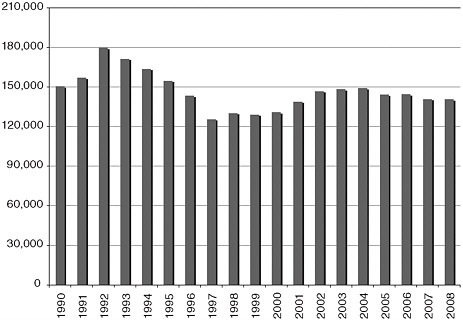
FIGURE 3-1 Annual number of initial adult cardiovascular claims, 1990–2008.
SOURCE: IOM staff, using data from a dataset provided by SSA. This dataset records the number of initial and reconsideration decisions made by the state disability determination services by primary impairment code and calendar year, which can be aggregated at the body system level, as has been done in this figure.
Part of the transition from Step 3 to Step 5 allowances during the period 1994 to 1995 may be attributed to the types of claims received during and after the 1990 to 1992 recession (Lewin-VHI, 1995). In recessions, some workers with impairments who have been able to find employment in an expanding economy are laid off. They may apply for disability, but they may be less likely to have impairments that meet the listing-level severity standard of inability to engage in any gainful work, or even SSA’s less strict disability standard of inability to engage in any substantial gainful activity. (The overall allowance rate was also depressed during the same years [Figure 3-2]).
The decrease in the share of allowances made at Step 3 during the period 1994 to 1995 also coincided with a substantial revision of the cardiovascular listings that took effect in February 1994. The committee heard anecdotally from various SSA and disability determination services (DDS) employees that the 1994 revision made the listings criteria very technical and thus more difficult for adjudicators to understand and apply. If true, this outcome underlines the value of simplicity in listings criteria, as long as they remain medically appropriate.
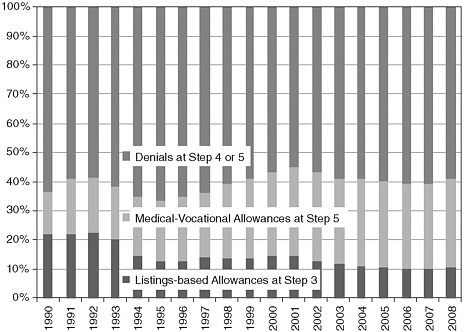
FIGURE 3-2 Annual allowance rate for initial adult cardiovascular claims, 1990–2008.
SOURCE: IOM staff, using data from a dataset provided by SSA. This dataset records the number of initial and reconsideration decisions made by the state disability determination services by primary impairment code and calendar year, which can be aggregated at the body system level, as has been done in this figure.
The next comprehensive revision of the adult cardiovascular listings took effect in April 2006 and had a lesser impact on the shares of allowances made at Steps 3 and 5. The percentage of adult allowances made on the basis of these listings stayed about the same in 2007 and 2008 rather than continuing to gradually transition from Step 3 to Step 5 allowances, as it had each of the previous 9 years.
Listing-Level Trends
SSA data can provide the number of allowances made at Step 3 by listing (Figure 3-4). However, because the Listings are a screen-in step, SSA data cannot classify Step 5 allowances by any specific listing that a claimant may have failed to meet or medically equal at Step 3. Therefore, it is not possible to report trends in Step 5 allowances or denials at Steps 4 or 5 in terms of the cardiovascular listings.
During the past decade, almost all (95 percent) of the adult allowances that SSA made using the cardiovascular listings were allowed under four
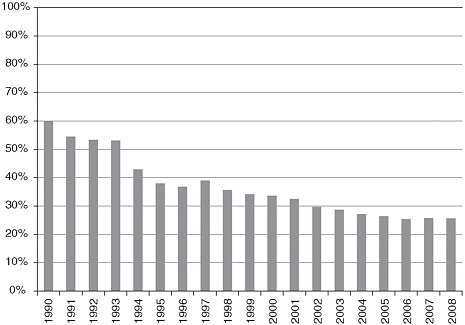
FIGURE 3-3 Annual percentage of initial adult allowances made on the basis of the cardiovascular listings, 1990–2008.
SOURCE: IOM staff, using data from a dataset provided by SSA. This dataset records the number of initial and reconsideration decisions made by the state disability determination services by primary impairment code and calendar year, which can be aggregated at the body system level, as has been done in this figure.
of these listings (Figure 3-4).3 The number of listings allowances peaked in 2001 at nearly 19,000, declined to less than 14,000 in 2006 and 2007, and began increasing again, reaching 15,000 in 2009. The upward trend after 2007 may have resulted from the 2006 cardiovascular listings revisions. The main reason for the upward trend may be the revisions SSA made to the listings for chronic heart failure and, to a lesser extent, chronic venous insufficiency.4 Over the same time period, though, Step 3 allowances based on the listing for ischemic heart disease continued to decline.
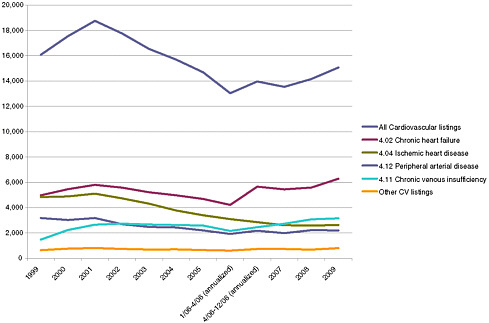
FIGURE 3-4 Annual number of initial adult allowances based on the cardiovascular listings, 1999–2009.
SOURCE: IOM staff, using data from a dataset provided by SSA. This dataset records the number of initial allowances based on meeting or equaling the cardiovascular listings made by the state disability determination services by listing and calendar year.
Impairment-Level Trends
SSA assigns a primary impairment code to each claim that receives a medical determination and can report, by impairment code, if the impairment in each claim met or medically equaled a listing, if the claim was allowed at Step 5, or if it was denied. SSA currently uses 24 cardiovascular impairment codes. These data are helpful in understanding general trends in claims involving cardiovascular impairments because there is substantial, although not absolute, consistency between each listing and its related impairment code. For example, 87 percent of the allowances under 4.02 (chronic heart failure) in 2009 were coded as either chronic heart failure or cardiomyopathy, and 75 percent of the allowances under 4.04 (ischemic heart disease) were coded as chronic ischemic heart disease.5
As expected, there was variation in the impairment codes used for Step 3 allowances based on meeting or medically equaling an adult cardiovascular listing during the period 1990 to 2009. Figure 3-5 includes some impairment codes mentioned in the following bulleted text:
-
The percentage of listing-level allowances for phlebitis/thrombophlebitis allowances based on the listings increased from 14 to 26 percent.
-
The percentage of listing-level allowances stayed about the same for some impairment codes, for example, heart transplantation (80 percent), chronic pulmonary heart disease (60 percent), and varicose veins of the lower extremities (55 percent).
-
The most-used cardiovascular impairment codes saw a steady downward trend in the number of listing-level allowances from 1990 to 2009. Listing-level allowances of claims coded as acute myocardial infarction declined from 39 to 12 percent, angina pectoris from 31 to 6 percent, and peripheral arterial disease from 68 to 41 percent.
-
The use of two other cardiovascular impairment codes also declined over the period, but with a distinct drop in 1994 and 1995.
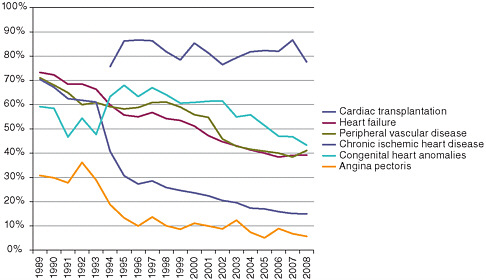
FIGURE 3-5 Percentage of adult initial allowances based on the cardiovascular listings, by selected impairment code, 1989–2008.
SOURCE: IOM staff, using data from a dataset provided by SSA. This dataset records the number of initial and reconsideration decisions made by the state disability determination services by primary impairment code and calendar year.
-
Ischemic heart disease allowances based on the listings decreased from 67 to 15 percent, but 20 of those percentage point losses occurred from 1993 to 1994 and another 10 percentage points from 1994 to 1995. This decrease accounts for much of the overall decrease shown in Figure 3-3 because at that time ischemic heart disease accounted for nearly half (46 percent) of all the cardiovascular listing-level allowances.
-
For two other impairment codes, aortic aneurysm and congenital heart disease, the proportion of initial allowances made at Step 3 increased from 1994 to 1995 before resuming a steady decline. For example, the listing-level share of initial allowances for adults with congenital heart disease declined from 58 percent in 1990 to 48 percent in 1993, jumped to 68 percent by 1995, and then declined to 43 percent in 2008.
Summary of Adult Trends
This brief analysis of data on the disposition of adult cardiovascular claims over time shows that the general decrease in the use of the Listings as the basis for allowances is generally applicable to the cardiovascular body system listings.6 This supports SSA’s concern about the usefulness of the Listings as an administrative expedient to quickly identify allowances, which would save both the claimant’s time and the agency’s resources.
The analysis also indicates some variation at the listing level and at the impairment code level. This in turn indicates less need to revise certain cardiovascular listings, which are apparently functioning well (e.g., heart transplantation) and greater need to examine certain listings whose usefulness appears to be declining despite revisions in 1994 and 2006 (e.g., chronic ischemic heart disease). As mentioned above, the drop in the use of the Listings as a screen-in tool for allowances at the time of the 1994 revision, as well as the continued decline in their use as a screen-in tool since then, argues strongly for greater simplicity and clarity in the criteria and the tests required to establish diagnoses and determine clinical severity.
Disposition of Child Cardiovascular Disability Claims, 1999–2009
In recent years, SSA has decided about 7,000 initial claims annually by children for SSI benefits in which the primary impairment code was
cardiovascular. The majority (about 60 percent) have been for congenital heart disease. The next three largest categories, at 6 to 7 percent each, have been for arrhythmias, aortic valve disorders, and valvular heart disease or other stenotic defects.7
The annual number of cardiovascular allowances to SSI children has been about 3,400 (3,600 in 2009). The annual allowance rate has been about 47 percent for the past decade. In recent years, approximately three-quarters of the allowances have been based on meeting or medically equaling the congenital heart disease listings (4.06 and 104.06), 6 percent were for meeting or medically equaling other cardiovascular listings, and 19 to 20 percent were for functionally equaling the listings.
REFERENCES
Leopold, R. 2003. A year in the life of a million American workers. New York: MetLife.
Lewin-VHI, Inc. 1995. Labor market conditions, socioeconomic factors, and the growth of applications and awards for SSDI and SSI disability benefits: Final report. Washington, D.C.: Department of Health and Human Services, Office of the Assistant Secretary for Planning and Evaluation and Social Security Administration. May 23.
Lloyd-Jones, D., R. J. Adams, T. M. Brown, M. Carnethon, S. Dai, G. De Simone, T. B. Ferguson, E. Ford, K. Furie, C. Gillespie, A. Go, K. Greenlund, N. Haase, S. Hailpern, P. M. Ho, V. Howard, B. Kissela, S. Kittner, D. Lackland, L. Lisabeth, A. Marelli, M. M. McDermott, J. Meigs, D. Mozaffarian, M. Mussolino, G. Nichol, V. Roger, W. Rosamond, R. Sacco, P. Sorlie, R. Stafford, T. Thom, S. Wasserthiel-Smoller, N. D. Wong, and J. Wylie-Rosett, on behalf of the American Heart Association Statistics Committee Stroke Statistics Subcommittee. 2010. Heart disease and stroke statistics—2010 update: A report from the American Heart Association. Circulation 121(7):e46–2e15.
NHLBI (National Heart, Lung, and Blood Institute). 2006. Incidence and prevalence: 2006 chart book on cardiovascular and lung diseases. Bethesda, MD: NHLBI. http://www.nhlbi.nih.gov/resources/docs/06a_ip_chtbk.pdf (accessed June 2, 2010).
NHLBI. 2009. Morbidity & mortality: 2009 chart book on cardiovascular, lung, and blood diseases. Bethesda, MD: NHLBI. http://www.nhlbi.nih.gov/resources/docs/2009_ChartBook.pdf (accessed June 2, 2010).
SSA (Social Security Administration). 2009a. Annual statistical report on the Social Security Disability Insurance Program, 2008. http://www.ssa.gov/policy/docs/statcomps/di_asr/2008/index.html (accessed June 2, 2010).
SSA. 2009b. SSI annual statistical report, 2008. http://www.ssa.gov/policy/statcomps/ssi_asr/index.html (accessed June 2, 2010).


