
6
Can Obesity Account for Cross-National Differences in Life-Expectancy Trends?
Dawn E. Alley, Jennifer Lloyd, and Michelle Shardell
The prevalence of obesity has increased dramatically in the United States since the 1970s across all sex, race, and socioeconomic groups (Flegal et al., 1998, 2002). Because obesity is associated with a variety of chronic conditions, disability, and mortality, this trend raises important concerns about the current and future health of the U.S. population. The purpose of this review is to examine the implications of trends in obesity for trends in life expectancy, in order to determine whether obesity might account for cross-national differences in life-expectancy trends.
Available evidence suggests that this is unlikely, for at least two reasons: (1) the epidemic of obesity is not confined to the United States. Although the prevalence of obesity in U.S. adults is the highest of any country included in this report, other countries are also experiencing rising obesity rates. (2) The association between obesity and mortality is relatively weak, particularly at older ages. The best available estimates of the effect of obesity on life expectancy suggest that it may be a small contributor to differences in life-expectancy trends, but it is not likely to fully account for them.
However, obesity’s importance as a determinant of life expectancy is likely to grow with the aging of younger cohorts, and obesity is importantly related to other indicators of population health and quality of life, including disease, disability, and health care costs. Several trends suggest that the effect of obesity on life expectancy will increase in the future, including (1) an increase in abdominal adiposity, reflected by higher waist circumference at a given body mass index (BMI); (2) an increased prevalence of obesity at all ages, particularly younger ages, in which the association between obesity
and mortality is stronger; (3) the increasing severity of obesity; and (4) the increasing duration of obesity.
In an effort to be responsive to the question at hand (i.e., Can obesity account for cross-national differences in life-expectancy trends at age 50?), the following review focuses on BMI in older cohorts. First, we examine international trends in obesity and life expectancy. Second, we review the association between obesity and mortality, prioritizing estimates that are generalizable to the U.S. population. Third, we provide estimates of the effect of obesity on life expectancy in the United States. Fourth, we discuss limitations in the use of BMI to predict mortality and the implications of these limitations for cross-national comparisons. Finally, we discuss implications of rising obesity rates for future trends in life expectancy and other population health indicators. Throughout the review, we rely on published results and our own analysis of the National Health and Nutrition Examination Survey (NHANES), a nationally representative repeated cross-sectional survey of U.S. adults that includes both a questionnaire and a physical exam, including height and weight measurement (National Center for Health Statistics, 2009).
INTERNATIONAL TRENDS IN OBESITY AND LIFE EXPECTANCY
The World Health Organization (WHO) defines obesity as a BMI (dividing weight in kg over squared height in meters) of 30kg/m2 or more. Figure 6-1 presents obesity prevalence estimates for adults in 10 countries over time.1 Among adult men, the United States has the highest obesity prevalence at all observed time points. In approximately 1978 (data collected 1976-1980), the prevalence of obesity among men in the United States was 13 percent. Around the same time, the prevalence varied from a low of 0.8 percent in Japan to a high of 12 percent in Canada. By 2003, the prevalence of obesity among American men had more than doubled, to 32 percent. The most recent estimates from other countries show that 23 percent of British and Canadian men are obese, followed by 19 percent of Australian men, 12 percent of Danish, French, and Spanish men, and 10 percent of Dutch men. Only men in Italy and Japan have an obesity prevalence below 10 percent.
Overall patterns are similar among adult women. Around 1978, the prevalence of obesity among women in the United States was already 17 percent, and it rose to 35 percent in 2003. The prevalence of obesity
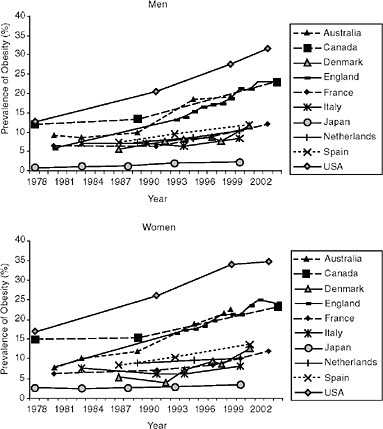
FIGURE 6-1 Trends in adult obesity prevalence by country and sex, 1978-2004.
SOURCES: Data are nationally representative unless otherwise noted. Australia: measured height and weight, ages 25-64 (1980-1989), ages 18+ (1995), ages 25+ (1999-2000), data before 1999 are from urban areas only (Australian Institute of Health and Welfare, 2009); Canada: measured height and weight, ages 20-64 (1978-1989) (Torrance, Hooper, and Reeder, 2002), ages 18+ (2004) (Tjepkema, 2005); Denmark: self-reported height and weight, ages 16+ (Bendixen et al., 2004); England: measured height and weight, ages 16+ (Department of Health, 2009; Rennie and Jebb, 2005); France: self-reported height and weight, ages 20+ (1980-1991) (Maillard et al., 1999), ages 18+ (1997-2003) (Charles, Eschwege, and Basdevant, 2008); Italy: self-reported height and weight, ages 15+ (1983-1994) (Pagano et al., 1997), ages 18+ (1999) (Calza, Decarli, and Ferraroni, 2008); Japan: measured height and weight, ages 20+ (Yoshiike, Kaneda, and Takimoto, 2002; Yoshiike et al., 2002); Netherlands: measured height and weight, ages 20-59, from three cities (International Association for the Study of Obesity, 2009; Seidell, Verschuren, and Kromhout, 1995; Visscher, Kromhout, and Seidell, 2002); Spain: self-reported height and weight, ages 21+ (1987, 1993), ages 17+ (2001) (Martínez, Moreno, and Martínez-González, 2004); United States: measured height and weight, ages 20-74 (1978, 1991, 1999) (Flegal et al., 2002), author analysis of NHANES data, ages 20-74 (2003).
in women is now between 20 and 25 percent in Australia, Canada, and England. Again, only Italy and Japan currently have an obesity prevalence below 10 percent.
Figure 6-2 presents obesity trends among older adults. In 1978, the prevalence of obesity was similar among older men and women in Canada and the United States, with the prevalence of obesity around 13-14 percent in men and 23-24 percent in women. Today, more than 25 percent of older men and 30 percent of older women are obese in Australia, England, and the United States, although the United States now has the highest rate of obesity in both men (35 percent) and women (38 percent) in this age group. Table 6-1 provides recent data from the Survey of Health, Ageing, and Retirement in Europe and the Health and Retirement Study to provide a snapshot of the obesity prevalence measured comparably (based on corrected estimates of self-reported height and weight) in the population ages 50+ in several countries (Michaud, van Soest, and Andreyeva, 2007). The prevalence of obesity among older adults is highest in the United States, followed by older adults in Spain.
Several patterns emerge in this examination of obesity trends across countries. First, the increase in the prevalence of obesity is not confined to the United States, but instead was observed across all 10 countries examined. Nonetheless, obesity levels and trends vary greatly by country. There appears to be a cluster of Anglo-Saxon countries (Australia, Canada, England, and the United States) that have experienced both higher levels and a more rapid rise in the prevalence of obesity. It is notable that the prevalence of obesity in the United States in the late 1970s was already higher than the prevalence in most other countries today. In addition, differences between the United States and other countries are larger when comparing obesity prevalence among adults of all ages than when comparing obesity prevalence among older adults. This suggests that cross-national differences in obesity prevalence are even larger at younger ages, which may be important in determining morbidity and mortality burden in the future.
Figure 6-3 summarizes trends in obesity along with trends in life expectancy at age 50 (see Glei, Meslé, and Vallin, Chapter 2, in this volume). Because of the limited amount of published obesity data on the population over age 50, the slope of the obesity trend was calculated using adult obesity prevalence. The first and last estimates of adult obesity prevalence available for each country between 1978 and 2004 were used to estimate annual change in obesity prevalence.
Among the 10 countries included here, the United States ranked eighth in life expectancy at age 50 for men (28.9 years) in 2004. The United States had the highest prevalence of adult obesity (31.7 percent) and the most rapid rate of obesity change (0.76 percent per year). Men in Australia had the highest life expectancy at age 50 in 2004 (31.0 years), followed by Japan
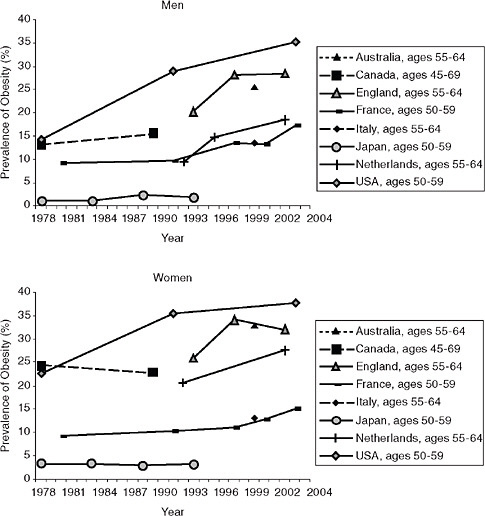
FIGURE 6-2 Trends in obesity prevalence by country and sex: Older adults, 1978-2004.
SOURCES: Data are nationally representative unless otherwise noted. Australia: measured height and weight (Cameron et al., 2003); Canada: self-reported height and weight (Torrance, Hooper, and Reeder, 2002); England: measured height and weight (Rennie and Jebb, 2005); France: self-reported height and weight (Charles, Eschwege, and Basdevant, 2008; Maillard et al., 1999); Italy: self-reported height and weight (Calza et al., 2008); Japan: measured height and weight (Yoshiike, Seino et al., 2002); Netherlands: measured height and weight, from three cities (Schokker et al., 2007); United States: measured height and weight (Flegal et al., 2002) and author analysis of NHANES data.
TABLE 6-1 Prevalence of Obesity Among Adults Ages 50+, by Country and Sex, 2004
|
|
Males (%) |
Females (%) |
|
Denmark |
17.5 |
18.2 |
|
France |
16.2 |
20.3 |
|
Italy |
15.6 |
23.4 |
|
Netherlands |
15.3 |
23.2 |
|
Spain |
20.8 |
33.6 |
|
United States |
29.6 |
36.0 |
|
SOURCE: Data from Michaud et al. (2007). |
||
(30.7 years), Italy (30.2 years), and Canada (30.1 years). Among men, there was little correlation between change in obesity prevalence and change in life expectancy after age 50 (r = 0.126). Countries with the longest life expectancy included the two countries with the lowest obesity prevalence (Italy and Japan), as well as two countries with high obesity rates and large increases in obesity (Australia and Canada). Australia and England both experienced increases in life expectancy of more than 5 years across this period at the same time that obesity prevalence increased at a rate of more than 0.5 percent per year.
Among women, there was some evidence of a negative association between change in adult obesity prevalence and changes in life expectancy at age 50 (r = −0.421). Life expectancy at age 50 in 2004 was highest for women in Japan (36.9 years), followed by France (35.5 years), Italy (35.0 years), and Australia and Spain (34.9 years). The United States ranked ninth (32.6 years). While women in the United States had the highest prevalence of adult obesity, Australia had the most rapid increase in obesity (0.76 percent per year). The rate of increase in obesity prevalence exceeded 0.5 percent per year in Australia, Canada, Denmark, England, and the United States. The Netherlands appears to be an outlier, with relatively low increases in both obesity and life expectancy. If we were to exclude the Netherlands from this analysis, the correlation between change in obesity prevalence and change in life expectancy would have been greater.
These comparisons suggest that the correlation between obesity and life expectancy is stronger in women than in men. While prior analysis suggests that associations between obesity and mortality are similar in men and women or that the association is stronger in men (Fontaine et al., 2003; Stevens et al., 1999), this finding is consistent with women’s higher prevalence of obesity and recent evidence that women account for more than two-thirds of years of life lost to obesity in the United States (Finkelstein et al., 2010).
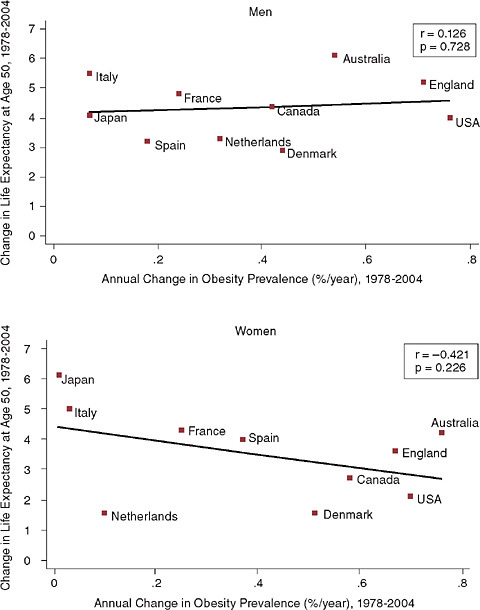
FIGURE 6-3 Trends in life expectancy at age 50 and adult obesity prevalence by country and sex.
SOURCE: Figure 6-1 and Glei, Meslé, and Vallin, Chapter 2, in this volume.
It is difficult to draw substantive conclusions from these ecological comparisons, which cannot determine whether obesity accounts for trends in life expectancy across countries. For example, life expectancy in Australia might have increased even more if the prevalence of obesity had not also been increasing. Many other factors have changed over time in the countries
assessed here, and these changes may obscure differences in life expectancy due to obesity. An additional limitation of these comparisons is that they examine contemporaneous changes in obesity and life expectancy. If there is a long latency period between development of obesity and increased mortality risk, we might observe a substantial time lag between increases in the prevalence of obesity and changes in life expectancy.
Nonetheless, these comparisons provide a context for considering the role of obesity in international life expectancy trends. If obesity is slowing life expectancy gains in the United States, it is likely that it is also affecting life expectancy trends in other countries, particularly countries like Australia, Canada, and England, which have also experienced rapid increases in obesity prevalence. Among men, there was little evidence of an association between changes in adult obesity prevalence and changes in life expectancy at age 50, although we did find some evidence of an association among women. This is particularly important, because gains in life expectancy of American women have not kept pace with those of women in most European countries.
ASSOCIATION BETWEEN OBESITY AND MORTALITY
Obesity may affect mortality risk both directly and indirectly. Fat can be thought of as an endocrine organ, secreting hormones and inflammatory proteins that are important risk factors for diabetes and cardiovascular disease (Snijder et al., 2006; Trayhurn and Beattie, 2001). Obesity is also a mediator through which physical activity and diet affect health. Obesity is clearly associated with risk factors for mortality, including high blood pressure, high cholesterol, and diabetes (Must et al., 1999; Prospective Studies Collaboration, 2009). Nonetheless, the association between BMI and mortality remains a topic of significant controversy, in part because it varies greatly by age, race, and cause of death and is confounded by smoking history.
The following review of this association relies on published reports of population-based data from the United States (except where noted). Depending on the population or population subgroup examined, the association between BMI and mortality has been characterized as linear and positive (Ajani et al., 2004; Baik et al., 2000; Gelber et al., 2007), U-shaped (Ajani et al., 2004; Allison et al., 1997; Gelber et al., 2007; Matkin Dolan et al., 2007), J-shaped (Freedman et al., 2006; Manson et al., 1995), nonexistent (Baik et al., 2000; Diehr et al., 1998), or negative (Diehr et al., 1998; Grabowski and Ellis, 2001). Despite this variability, several conclusions can be drawn from the existing literature.
First, at the population level, obesity is associated with a modest increase in all-cause mortality relative to normal weight, and the association between obesity and mortality increases with obesity severity. Results
from a recent meta-analysis based on data from 26 studies, including both sexes, several racial and ethnic groups and multiple countries are shown in Figure 6-4 (McGee and Diverse Populations Collaboration, 2005). Among men, obesity was associated with a 20 percent increase in all-cause mortality risk (RR = 1.201, 95% CI: 1.119-1.289) and a 51 percent increased risk of mortality from coronary heart disease (RR = 1.508, 95% CI: 1.362-1.67), but was not significantly associated with cancer mortality (RR = 1.055, 95% CI: 0.978-1.138). Among women, obesity was associated with approximately a 28 percent increased risk of all-cause mortality (RR = 1.275, 95% percent CI:1.183-1.373), a 62 percent increased risk of mortality from coronary heart disease (RR = 1.624, 95% CI: 1.459-1.806), and a 10 percent increased risk of cancer mortality (RR = 1.103, 95% CI: 1.001-1.215).
These associations increase with obesity severity. An analysis of international data from 894,576 participants ages 35 and older found that each 5kg/m2 increase in BMI is associated with approximately 30 percent higher overall mortality (Prospective Studies Collaboration, 2009). In one large cohort study of adults ages 50-71 at baseline, the excess mortality risk associated with obesity (relative to a BMI of 23.5-24.9) increased from 10 percent (RR = 1.10, 95% CI: 1.06-1.14) among men with Class I obesity (BMI of 30.0-34.9kg/m2), to 35 percent (RR = 1.35, 95% CI: 1.28-1.42) among those with Class II obesity (BMI: 35.0-39.9), to 83 percent (RR = 1.83, 95% CI: 1.70-1.97) among men with Class III obesity (BMI ≥ 40.0) (Adams et al., 2006). Results were similar among women, with an excess mortality risk ranging from 18 percent (RR = 1.18, 95% CI: 1.12-1.25) among those with Class I obesity to 94 percent (RR = 1.94. 95% CI: 1.79-2.09) among those with Class III obesity.
Although the majority of research on the relationship between BMI and mortality has utilized the WHO cut points to define risk groups, another way to characterize this relationship is to examine the continuous association. In one analysis of a nationally representative cohort study (the NHANES I Epidemiologic Follow-up Study), the BMI associated with minimum mortality ranged from 24.3-27.1 for different race-gender groups (Durazo-Arvizu et al., 1998). The authors determined the range of BMI values over which all-cause mortality risk would increase no more than 20 percent relative to the minimum; this interval was nine BMI units wide and included 70 percent of the U.S. population ages 25-74. Similarly, in an analysis of the association between BMI and mortality using National Health Interview Survey data for adults ages 18-64, there was no difference in mortality observed for participants with BMIs between 20 and 35, which included 85.9 percent of the population (Gronniger, 2006). Taken together, these results suggest that associations between BMI and mortality are small in most adults, increasing rapidly for those with extreme BMI values.
Second, the association between BMI and mortality changes with age. The closest associations between obesity and mortality have been observed
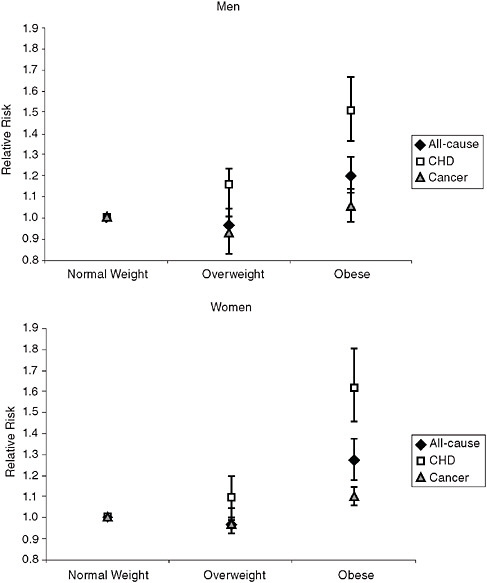
FIGURE 6-4 Association between BMI group and mortality in adults by sex and cause of death.
SOURCE: McGee and Diverse Populations Collaboration (2005); CHD = coronary heart disease; normal weight = body mass index (BMI) 18.5-24.9kg/m2; overweight = BMI 25.0-29.9kg/m2; obese = BMI ≥ 30kg/m2.
for adults under age 50 (Bender et al., 1999; Stevens et al., 1998; Thorpe and Ferraro, 2004). As age increases, the greatest risk of mortality is associated with the most extreme ends of the BMI spectrum: the lowest (underweight) and highest BMI categories (Class II and Class III obesity). Recent reviews of the association between BMI and mortality risk in the elderly have found
that obesity is associated with a 10 percent increase in mortality risk (RR = 1.10, 95% CI: 1.06-1.13) (Janssen and Mark, 2007) and that “the overall trends for the relation between BMI and mortality in older adults can be represented as a U-shaped curve, with a large flat bottom and a right curve that starts to rise for BMIs of more than 31 to 32” (Heiat, Vaccarino, and Krumholz, 2001).
Third, smoking confounds the relationship between BMI and mortality. Smoking is associated with both lower weight and higher mortality. Thus, smoking modifies the effect of BMI on mortality, so that obesity appears less harmful among current and former smokers. Excluding ever-smokers from analysis of the BMI-mortality relationship reduces the risk associated with underweight and suggests a stronger, more linear association between BMI and mortality (Adams et al., 2006; Ajani et al., 2004; Calle et al., 1999; Freedman et al., 2006; Manson et al., 1995).
In summary, the association between BMI and mortality is moderate at the population level but stronger in some subgroups, including persons with Class II or III obesity and never-smokers. The following section explores the potential effects of BMI on trends in life expectancy.
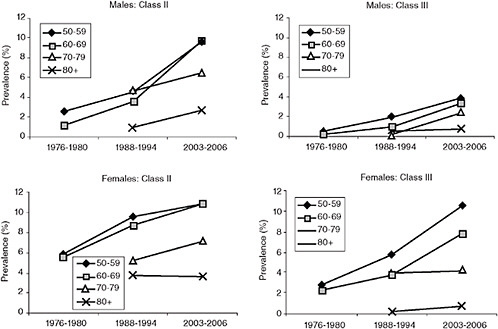
OBESITY AND LIFE EXPECTANCY
In order to move from a discussion of mortality risks at an individual level to a discussion of life expectancy at the population level, we must examine the size of the population at increased risk for poor outcomes. Figure 6-5 provides trends in the prevalence of Class II and Class III obesity by sex in the United States. Among men ages 50-59 and 60-69, the prevalence of Class II obesity reached a high of nearly 10 percent in 2003-2006, an increase of 5-6 percent from 1988-1994 and 7-8 percent from 1976-1980. The prevalence of Class III obesity has also increased markedly in men but remains fairly rare, affecting fewer than 5 percent of men ages 50 and older. Among women ages 50-59 and 60-69, the prevalence of Class II obesity reached a high of nearly 11 percent in 2003-2006, an increase of approximately 5 percent since 1976-1980. The prevalence of Class III obesity increased dramatically in women of all age groups, particularly women under age 70, in whom the prevalence of Class III obesity was 3-4 times higher in 2003-2006 than in 1976-1980.
Fontaine and colleagues (2003) estimated the years of life lost (YLL) for different BMI levels, relative to a BMI of 24, using NHANES data (see Figure 6-6). As discussed above, the effect of obesity on mortality, and in this case life expectancy, decreases with age. Among white men, Class I obesity was associated with an average of 0-1 years of life lost, Class II obesity was associated with 1-3 years of life lost, and Class III obesity was associated with 1-7 years of life lost, depending on age. These associations were similar
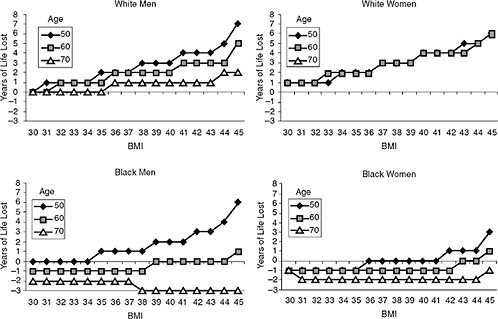
in white women (although estimates for women ages 70 and older were not available, because life expectancy for this group exceeded age 85). However, associations differed markedly by race. The negative effects of obesity on life expectancy among black men and women were observed only at younger ages and among those with very high BMIs.
Olshansky and colleagues (2005) estimated the effect of obesity on total life expectancy by estimating the potential gain in life expectancy at birth in 2000 if obesity were eliminated completely among U.S. adults ages 20-85. They found that, without obesity, life expectancy in the United States would be higher by 0.33-0.93 years for white men, 0.30-0.81 years for white women, 0.30-1.08 years for black men, and 0.21-0.73 years for black women. These estimates demonstrate that obesity is clearly a large and important contributor to life expectancy, but they represent an upper bound related to the specific questions in this chapter for two reasons. First, these estimates were based on mortality for ages 20-85. Because the association between obesity and mortality is roughly twice as large from ages 20-49 as it is for ages 50 and above (decreasing even further for those above 65) (Thorpe and Ferraro, 2004), much of this effect was probably due to deaths before age 50. Second, these estimates were based on eliminating obesity entirely in the U.S. population. Effects would be smaller if obesity were simply reduced to the prevalence already present in the U.S. population in the 1970s or to the prevalence observed in other countries today.
In order to estimate the effect of increasing obesity prevalence on trends in life expectancy at age 50 in the United States, we applied Fontaine and colleagues’ estimates (Fontaine et al., 2003) of YLL at age 50 to the BMI distribution from NHANES II (1976-1980) and NHANES 2001-2004 (see Annex for details). Results showing the estimated effect of obesity on life expectancy at age 50 are included in Table 6-2. Results are provided for whites only, because estimates for blacks were unstable.
The BMI distribution for white men at age 50 in 1976-1980 is projected to result in a reduction in life expectancy of 0.19 years in this group relative to life expectancy if all obese individuals had a BMI of 24. Because of increases in the prevalence of obesity, the effect of obesity on life expectancy is expected to increase to 0.43 years among men age 50 in 2001-2004. However, as discussed in more detail below, little is known about the lag time necessary for obesity to affect mortality risk, so it is unclear how long it will take to observe these changes at the population level. Nonetheless, these results suggest that obesity growth during this period will slow improvements in life expectancy across these cohorts of white men by approximately 0.24 years. Obesity for white women age 50 in 1976-1980 is projected to result in a reduction of 0.33 years for this group, and this effect is expected to increase to 0.73 years among women age 50 in 2001-2004. Thus, increases
TABLE 6-2 Projected Population-Level Reductions in Life Expectancy at Age 50 (years) due to Obesity, by Age and Sex, 1976-1980 and 2001-2004
|
|
1976-1980 (A) |
2001-2004 (B) |
Difference (B − A) |
|
White men |
0.19 |
0.43 |
0.24 |
|
White women |
0.33 |
0.73 |
0.40 |
|
NOTE: Relative to a BMI of 24. See Annex for more information. |
|||
in obesity prevalence during this period are likely to reduce life-expectancy improvements in white women at age 50 by approximately 0.40 years.
These results are extremely sensitive to the choice of YLL estimates used to generate them. We chose Fontaine and colleagues’ estimates for three reasons: (1) estimates are based on measured height and weight, (2) the population used to generate estimates was a representative sample of U.S. adults, and (3) sufficient detail was provided in online appendices to the publication to allow us to generate estimates. Because of a lack of complete data on age- and sex-specific BMI trends in other countries, as well as country-specific estimates of YLL due to excess BMI, we focus this analysis on the association between obesity and life expectancy in the United States. However, it is notable that Fontaine and colleagues’ estimates are lower than those from a recent large-scale collaborative analysis of 57 prospective studies. The Prospective Studies Collaboration (2009) found that life expectancy at age 35 was reduced by 2-4 years among participants who reached a BMI of 30-35 by midlife and by 8-10 years among participants who reached a BMI of 40-45 by midlife, compared with Fontaine and colleagues’ estimates of a loss of approximately 1 year of life in whites with a BMI of 30-35 and 3-7 years in whites with a BMI of 40-45. More generally, estimates of YLL have varied widely across studies (for an excellent review and comparison, see Finkelstein et al., 2010). Estimates of projected reductions in life expectancy due to obesity are directly proportional to the estimate of YLL used to generate them, allowing the reader to calculate alternative scenarios. For example, if all sex- and BMI-specific YLLs were uniformly twice as high as those estimated by Fontaine and colleagues, the projected reduction in life expectancy would be twice as high.
These data suggest that increasing obesity prevalence is likely to slow life-expectancy growth in the United States. However, it is unknown to what extent these changes have already begun to manifest themselves in the countries examined in this chapter. As noted above, all of the comparison countries included in this report also experienced significant increases in obesity during this time period. It is unlikely that the small increases in obesity occurring before 1980 explain current life-expectancy trends in the
United States or differences between trends in the United States and other countries. Between 1980 and 2004, life expectancy at age 50 in U.S. men grew by 4.0 years, while it grew by 6.1 years in Australia. In that same period, life expectancy at age 50 in U.S. women grew by 2.1 years, while it grew by 6.1 years in Japan. Based on available estimates, obesity may be a contributor to these trends, but it is unlikely to explain them. Nonetheless, the large increase in obesity prevalence in the United States since the late 1970s is likely to have important implications for life expectancy in the coming decades.
LIMITATIONS IN MEASUREMENT OF EFFECTS OF OBESITY ON MORTALITY
The purpose of this review is to summarize literature on obesity and mortality in order to determine whether obesity might account for crossnational differences in life-expectancy trends. We have attempted to address this question using the extensive published literature on the association between BMI and mortality. However, three important limitations of existing research may affect our conclusions: (1) confounding due to chronic disease, (2) lack of data on body composition, and (3) limited understanding of the natural history of obesity’s effect on mortality.
First, we are likely to underestimate the effect of BMI on mortality at older ages due to chronic disease. Although obesity is associated with increased incidence of chronic diseases, including diabetes and cardiovascular disease, many of these chronic conditions are also associated with both involuntary weight loss and increased mortality. Thus, BMI appears to have an attenuated or negative association with mortality among those with existing illness. In this group, mortality risk is particularly high at low BMIs and generally flat at higher BMIs. For example, in a review of the association between BMI and mortality among patients with coronary artery disease, patients with a low BMI had the highest total mortality risk (RR = 1.37, 95% CI: 1.32-1.43), overweight patients had the lowest risk (RR = 0.87, 95% CI: 0.81-0.94), and risk among obese patients was not significantly different from normal weight patients (RR = 0.93, 95% CI: 0.85-1.03 for Class I, RR = 1.10, 95% CI: 0.87-1.41 for Class II/III) (Romero-Corral et al., 2006).
A variety of approaches have been used to attempt to generate estimates of the effect of obesity on mortality unconfounded by chronic disease. One common approach is to exclude deaths occurring within 5 years of weight measurement. However, exclusion of early deaths does not substantially change estimated associations between BMI and mortality (Allison et al., 1999). Another approach is to restrict analyses to healthy individuals, excluding persons with preexisting chronic diseases. This approach results in a stronger, more linear association between BMI and mortality, but it
potentially excludes the majority of older persons (Adams et al., 2006; Calle et al., 1999). A final approach is to use a measure of BMI obtained earlier in life, before disease-related weight loss is likely to have begun. Available literature demonstrates that midlife BMI is more closely associated than current BMI with mortality in old age. For example, Figure 6-7 provides estimates of the adjusted relative risk of mortality by BMI group based on current BMI and recalled BMI at age 50 (Adams et al., 2006). For both men and women, using BMI at age 50 reduces the relative risk associated with underweight relative to using current BMI. In addition, when BMI groups are based on BMI at age 50, every BMI category above 26.5 was associated with significant increases in mortality risk. Thus, using an indicator of weight earlier in life may help avoid confounding in the association between BMI and mortality due to unintentional weight loss associated with chronic conditions.
Second, BMI has important limitations as a measure of adiposity (fatness), especially in older persons. BMI is a widely used measure because it provides an indicator of weight uncorrelated with height that is easy to measure and associated with health outcomes. However, BMI does not distinguish between muscle and fat and provides no information about the distribution of body fat, which may be important. Visceral fat, or intra-abdominal fat in the organ cavity, appears to be particularly harmful to health (Bergman et al., 2006; Snijder et al., 2006). Body composition measurement is difficult to implement in population-based surveys, because commonly used methods including computed tomography (CT) and dual energy x-ray absorptiometry (DXA) require equipment that is not transportable in the field. However, simple measures of anthropometry can provide useful indicators of body composition and fat distribution. In particular, waist circumference, an indicator of abdominal adiposity, may provide a useful indicator of mortality risk (Baik et al., 2000; Koster et al., 2008; Visscher et al., 2001).
Issues of body composition may be particularly important in crossnational comparisons. If Americans at a given BMI have a higher body fat or higher waist circumference relative to other populations, then comparisons based on BMI would underestimate the effect of obesity trends on crossnational differences in life expectancy. However, data on cross-national differences in body composition are limited (see Figure 6-8). As we would expect given higher BMIs in the United States, American adults have a higher waist circumference relative to European adults, especially in women. More importantly, waist circumference has been increasing in the United States even more than would be expected given concurrent BMI trends (Elobeid et al., 2007). This suggests that the obesity epidemic is resulting not only in changes in body size, but also in changes in body fat distribution, a trend that has also been identified in the Netherlands (Visscher and Seidell, 2004).
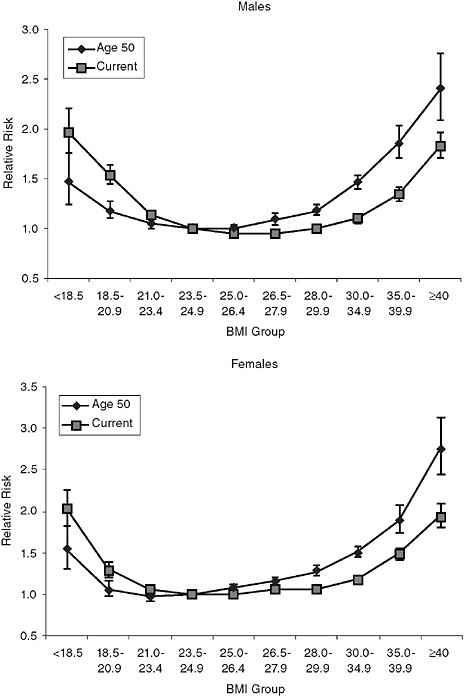
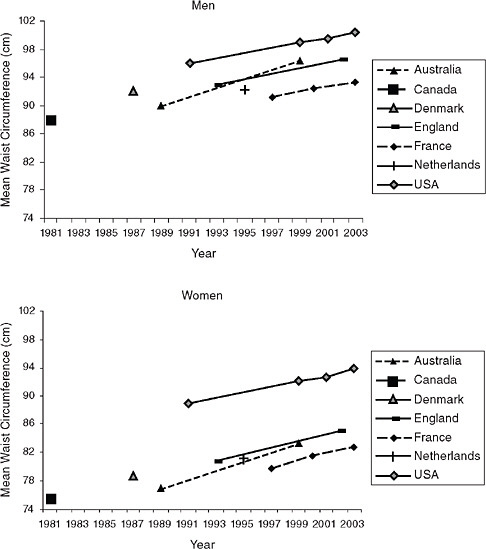
FIGURE 6-8 Trends in mean waist circumference by country and sex, 1981-2003.
SOURCES: Data are nationally representative unless otherwise noted. Australia: measured waist circumference, sample representative of Australian capital cities, ages 20-69 (1989) (Welborn, Dhaliwal, and Bennett, 2003), nationally representative ages 25+ (1999) (Snijder et al., 2004); Canada: measured waist circumference, ages 20-69 (1981) (Katzmarzyk, Craig, and Bouchard, 2002); Denmark: measured waist circumference, ages 35-65 (Heitmann, Frederiksen, and Lissner, 2004); France: self-reported waist circumference, ages 18+ (Charles, Eschwege, and Basdevant, 2008); England: measured waist circumference, ages 18-64 (Wardle and Boniface, 2007); Netherlands: measured waist circumference, representing three towns, ages 20-59 (Visscher and Seidell, 2004); United States: measured waist circumference, ages 20+ (Li et al., 2007).
Few studies have directly compared body composition across countries at a given BMI, but a recent comparison of body shape between American and British adults showed that body composition differs between them (Wells et al., 2007). American men have greater waist circumference compared with British men, even after adjusting for hip or thigh girth. American women had smaller waist circumference than British women after adjusting for hip or thigh girth, possibly related to greater total body size. These results suggest that it is important to consider body composition in cross-national comparisons in the health consequences of obesity.
A final limitation in our analysis of the association between obesity and mortality is that very little is known about how long it will take for us to observe the full effect of the increasing obesity prevalence on health outcomes at the population level. Many researchers have suggested that current increases in obesity-related chronic conditions represent the tip of the iceberg and the real impact of obesity will not be realized until cohorts with high levels of obesity at younger ages begin to age into disease and disability (Kumanyika, 2001; Sturm, Ringel, and Andreyeva, 2004). However, little is known about the lag time necessary for obesity to affect mortality risk. Clearly, the growth in childhood obesity is likely to result in an increased risk of obesity-related diseases in future cohorts of adults. Increased duration of obesity is associated with increased risk of diabetes (Wannamethee and Shaper, 1999), suggesting a potential lag between development of obesity and development of diabetes. However, there is little evidence of a lag time for obesity-related cancer development (Polendak, 2003), and research suggests that cardiovascular disease risk factors respond quickly to moderate weight loss (Klein et al., 2004). Thus, it is difficult to predict the extent to which the rise in obesity prevalence since the 1970s has already resulted in changes in life expectancy or has yet to exert its most important effects.
It is unclear how our assessment of the role of obesity as a contributor to cross-national differences in life expectancy would be different if obesity were defined based on waist circumference, weight at midlife, or different lag times between changes in obesity and changes in mortality—or all three. However, it is likely that available data using current BMI underestimate the association between obesity and mortality. Future work incorporating waist circumference and weight history data collected comparably across countries could help address these issues.
OBESITY AND MORTALITY IN THE FUTURE
Obesity’s effect on life expectancy in future cohorts will depend on at least two factors: (1) changes in the prevalence of obesity at different ages and (2) changing associations between obesity and health outcomes. Rising
rates of obesity at younger ages have two important implications for mortality. First, because the association between obesity and mortality is higher at younger ages, a rising prevalence of obesity at these ages is likely to have a greater effect on population life expectancy. Second, because more recent cohorts have an earlier average age of obesity onset (and recovery from obesity is rare), future cohorts will experience a longer duration of obesity (Leveille, Wee, and Iezzoni, 2005; Reynolds and Himes, 2007). Figure 6-9 provides the likelihood of obesity for three birth cohorts: by age 40, more than 30 percent of women in the 1969 cohort were projected to be obese, compared with only 6 percent in the 1919 cohort (Reynolds and Himes, 2007). In this relatively short time period, the duration of obesity appears to be increasing dramatically across cohorts. Few studies have examined
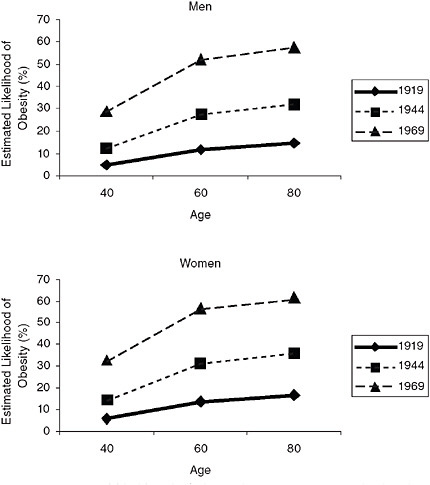
FIGURE 6-9 Estimated likelihood of obesity by age in successive birth cohorts.
SOURCE: Reynolds and Himes (2007); likelihood of obesity adjusted for age, race, ethnicity, and education.
the association between obesity duration and mortality, but a longer duration of obesity is clearly associated with increased risk of diabetes and disability (Stenholm et al., 2007; Wannamethee and Shaper, 1999). Given the increased prevalence of obesity at all ages, the strong association between obesity at younger ages and mortality, the increasing severity of obesity, and the increasing duration of obesity, it is likely that the effect of obesity on life expectancy will increase in the future.
However, there is some indication that the association between obesity and mortality, particularly cardiovascular mortality, may be decreasing over time (Flegal et al., 2005, 2007) possibly due to advances in treatment of cardiovascular risk factors (Gregg et al., 2005). This finding has not been replicated in other studies (Calle, Teras, and Thun, 2005), making predictions about the future effects of obesity on life expectancy controversial. Given rapidly rising rates of obesity at younger ages, it is likely that obesity will have a negative effect on advances in life expectancy in the future, but the magnitude of this effect is difficult to predict.
OBESITY AND OTHER HEALTH OUTCOMES
Even if obesity does not account for cross-national differences in life expectancy, rising obesity rates have important population health implications. For a variety of reasons, obesity is more closely associated with chronic conditions and disability than with mortality in old age. Thus, increases in obesity prevalence have important effects on the population burden of morbidity. As BMI increases, disability risk increases more than mortality risk (Al Snih et al., 2007; Lang et al., 2008). For example, Al Snih and colleagues (2007) found that disability risk increases above a BMI of approximately 24, while mortality risk did not begin to increase until a BMI of 27 in adults ages 65 and older. Furthermore, the slope of the BMI-disability relationship is steeper than that of the BMI-mortality relationship. This leads to a reduction in active life expectancy among the obese, even when total life expectancy is not affected (Reynolds, Saito, and Crimmins, 2005).
Similarly, obesity is associated with incidence of many chronic diseases and, as noted above, is not clearly associated with mortality in persons with chronic disease. Recent research has highlighted an “obesity paradox” in many chronic diseases associated with unintentional weight loss, particularly congestive heart failure, chronic kidney disease, and chronic obstructive pulmonary disease. This paradox refers to a combination of higher disease incidence in obese persons and lower mortality. The combination of earlier disease onset and lower mortality leads to a reduced healthy life expectancy and longer life expectancy with morbidity among these patients (Curtis et al., 2005; Kalantar-Zadeh et al., 2004, 2005; Landbo et al., 1999). A complete discussion of the possible mechanisms underlying obesity’s dif-
fering associations with morbidity and mortality is beyond the scope of this chapter (Ferrucci and Alley, 2007). However, it is important to note that obesity may importantly contribute to cross-national differences in morbidity. Obesity is also associated with excess annual health care costs of $70 to $100 billion in the United States, further emphasizing the importance of obesity as a major public health issue (Allison, Zannolli, and Narayan, 1999; Wolf and Colditz, 1998).
CONCLUSION
At an individual level, obesity is associated with excess mortality risk, particularly among younger persons and those with severe obesity. Although the rise in obesity prevalence is likely to slow life-expectancy growth in the United States in the future, it is unlikely to account for current cross-national differences in life expectancy. Because obesity is becoming both more common and more severe at younger ages, its contribution to life expectancy is likely to grow. Furthermore, obesity remains a critical population health concern because of its effects on disease, disability, and health care costs.
ACKNOWLEDGMENTS
Support for this research was provided by National Institute on Aging grant no. T32 AG000262 and National Institute of Child Health and Human Development grant no. K12 HC043489 and by the Organized Research Center on Aging at the University of Maryland, Baltimore.
REFERENCES
Adams, K.F., Schatzkin, A., Harris, T.B., Kipnis, V., Mouw, T., Ballard-Barbash, R., et al. (2006). Overweight, obesity, and mortality in a large prospective cohort of persons 50 to 71 years old. New England Journal of Medicine, 355, 763-778.
Ajani, U.A., Lotufo, P.A., Gaziano, J.M., Lee, I.M., Spelsberg, A., Buring, J.E., et al. (2004). Body mass index and mortality among U.S. male physicians. Annals of Epidemiology, 14, 731-739.
Al Snih, S., Ottenbacher, K.J., Markides, K.S., Kuo, Y., Eschbach, K., and Goodwin, J.S. (2007). The effect of obesity on disability versus mortality in older Americans. Archives of Internal Medicine, 167, 774-780.
Allison, D.B., Gallagher, D., Heo, F., and Heymsfield, S. (1997). Body mass index and all-cause mortality among people ages 70 and older: The Longitudinal Study of Aging. International Journal of Obesity, 21, 424-431.
Allison, D.B., Zannolli, R., and Narayan, K.M. (1999). The direct health care costs of obesity in the United States. American Journal of Public Health, 89, 1194-1199.
Allison, D.B., Faith, M.S., Heo, M., Townsend-Butterworth, D., and Williamson, D.F. (1999). Meta-analysis of the effect of excluding early deaths on the estimated relationship between body mass index and mortality. Obesity Research, 7, 417-419.
Australian Institute of Health and Welfare. (2009). AIHW Analysis of the 1980, 1983 and 1989 Risk Factor Prevalence Surveys, 1995 National Nutrition Survey and 1999-2000 Australian Diabetes, Obesity and Lifestyle (AusDiab) Study. Available: http://www.aihw.gov.au/dataonline/riskfactors/index.cfm [accessed June 2009].
Baik, I., Ascherio, A., Rimm, E.B., Giovannucci, E., Spiegelman, D., Stampfer, M.J., et al. (2000). Adiposity and mortality in men. American Journal of Epidemiology, 152, 264-271.
Bender, R., Jockel, K., Trautner, C., Spraul, M., and Berger, M. (1999). Effect of age on excess mortality in obesity. Journal of the American Medical Association, 281, 1498-1504.
Bendixen, H., Holst, C., Sorensen, T.I.A., Raben, A., Bartels, E.M., and Astrup, A. (2004). Major increase in prevalence of overweight and obesity between 1987 and 2001 among Danish adults. Obesity, 12, 1464-1472.
Bergman, R.N., Kim, S.P., Catalono, K.J., Hsu, I.R., Chiu, J.D., Kabir, M., et al. (2006). Why visceral fat is bad: Mechanisms of the metabolic syndrome. Obesity, 14, 16S-19S.
Calle, E., Thun, M., Petrelli, J., Rodriguez, C., and Heath, C.J. (1999). Body-mass index and mortality in a prospective cohort of U.S. adults. New England Journal of Medicine, 341, 1097-1105.
Calle, E., Teras, L., and Thun, M. (2005). Obesity and mortality. New England Journal of Medicine, 353, 2197-2199.
Calza, S., Decarli, A., and Ferraroni, M. (2008). Obesity and prevalence of chronic diseases in the 1999-2000 Italian National Health Survey. BMC Public Health, 8, 140.
Cameron, A.J., Welborn, T.A., Zimmet, P.Z., Dunstan, D.W., Owen, N., Salmon, J., et al. (2003). Overweight and obesity in Australia: The 1999-2000 Australian Diabetes, Obesity and Lifestyle Study (AusDiab). Medical Journal of Australia, 178, 427-432.
Charles, M.-A., Eschwege, E., and Basdevant, A. (2008). Monitoring the obesity epidemic in France: The ObEpi surveys 1997-2006. Obesity, 16, 2182-2186.
Curtis, J., Selter, J., Wang, Y., Rathore, S., Jovin, I., Jadbabaie, F., et al. (2005). The obesity paradox: Body mass index and outcomes in patients with heart failure. Archives of Internal Medicine, 165, 55-61.
Department of Health (United Kingdom). (2009). Health Survey for England. Available: http://www.heartstats.org [accessed June 2009].
Diehr, P., Bild, D., Harris, T., Duxbury, A., Siscovick, D., and Rossi, M. (1998). Body mass index and mortality in nonsmoking older adults: The Cardiovascular Health Study. American Journal of Public Health, 88, 623-629.
Durazo-Arvizu, R., McGee, D., Cooper, R., Liao, Y., and Luke, A. (1998). Mortality and optimal body mass index in a sample of the U.S. population. American Journal of Epidemiology, 147, 739-749.
Elobeid, M.A., Desmond, R.A., Thomas, O., Keith, S.W., and Allison, D.B. (2007). Waist circumference values are increasing beyond those expected from BMI increases. Obesity, 15, 2380-2383.
Ferrucci, L., and Alley, D. (2007). Obesity, disability, and mortality: A puzzling link. Archives of Internal Medicine, 167, 750-751.
Finkelstein, E.A., Brown, D.S., Wrage, L.A., Allaire, B.T., and Hoerger, T.J. (2010). Individual and aggregate years-of-life-lost associated with overweight and obesity. Obesity, 18, 333-339.
Flegal, K.M., Carroll, M.D., Kuczmarski, R.J., and Johnson, C.L. (1998). Overweight and obesity in the United States: Prevalence and trends, 1960-1994. International Journal of Obesity, 22, 39-47.
Flegal, K.M., Carroll, M.D., Ogden, C.L., and Johnson, C.L. (2002). Prevalence and trends in obesity among U.S. adults, 1999-2000. Journal of the American Medical Association, 288, 1723-1727.
Flegal, K.M., Graubard, B.I., Williamson, D.F., and Gail, M.H. (2005). Excess deaths associated with underweight, overweight, and obesity. Journal of the American Medical Association, 293, 1861-1867.
Flegal, K.M., Graubard, B.I., Williamson, D.F., and Gail, M.H. (2007). Cause-specific excess deaths associated with underweight, overweight, and obesity. Journal of the American Medical Association, 298, 2028-2037.
Fontaine, K., Redden, D., Wang, C., Westfall, A., and Allison, D. (2003). Years of life lost due to obesity. Journal of the American Medical Association, 289, 187-193.
Freedman, D.M., Ron, E., Ballard-Barbash, R., Doody, M.M., and Linet, M.S. (2006). Body mass index and all-cause mortality in a nationwide U.S. cohort. International Journal of Obesity, 30, 822-829.
Gelber, R.P., Kurth, T., Manson, J.E., Buring, J.E., and Gaziano, J.M. (2007). Body mass index and mortality in men: Evaluating the shape of the association. International Journal of Obesity, 31, 1240-1247.
Grabowski, D., and Ellis, J. (2001). High body mass index does not predict mortality in older people: Analysis of the Longitudinal Study of Aging. Journal of the American Geriatrics Society, 49, 968-979.
Gregg, E., Cheng, Y., Cadwell, B., Imperatore, G., Williams, D., Flegal, K., et al. (2005). Secular trends in cardiovascular disease risk factors according to body mass index in U.S. adults. Journal of the American Medical Association, 293, 1868-1874.
Gronniger, J.T. (2006). A semiparametric analysis of the relationship of body mass index to mortality. American Journal of Public Health, 96, 173-178.
Heiat, A., Vaccarino, V., and Krumholz, H.M. (2001). An evidence-based assessment of federal guidelines for overweight and obesity as they apply to elderly persons. Archives of Internal Medicine, 161, 1194-1203.
Heitmann, B.L., Frederiksen, P., and Lissner, L. (2004). Hip circumference and cardiovascular morbidity and mortality in men and women. Obesity Research, 12, 482-487.
International Association for the Study of Obesity. (2009). Global Prevalence of Adult Obesity. Available: http://www.iotf.org/database/documents/GlobalPrevalenceofAdultObesityJune2009updateonweb.pdf [accessed June 2009].
Janssen, I., and Mark, A.E. (2007). Elevated body mass index and mortality risk in the elderly. Obesity Reviews, 8, 41-59.
Kalantar-Zadeh, K., Block, G., Horwich, T., and Fonarow, G. (2004). Reverse epidemiology of conventional cardiovascular risk factors in patients with chronic heart failure. Journal of the American College of Cardiology, 43, 1439-1444.
Kalantar-Zadeh, K., Kopple, J.D., Kilpatrick, R.D., McAllister, C.J., Shinaberger, C.S., Gjertson, D.W., et al. (2005). Association of morbid obesity and weight change over time with cardiovascular survival in a hemodialysis population. American Journal of Kidney Disease, 46, 489-500.
Katzmarzyk, P.T., Craig, C.L., and Bouchard, C. (2002). Adiposity, adipose tissues distribution and mortality rates in the Canada Fitness Survey follow-up study. International Journal of Obesity, 26, 1054-1059.
Klein, S., Burke, L.E., Bray, G.A., Blair, S., Allison, D.B., Pi-Sunyer, X., et al. (2004). Clinical implications of obesity with specific focus on cardiovascular disease: A statement for professionals from the American Heart Association Council on Nutrition, Physical Activity, and Metabolism: Endorsed by the American College of Cardiology Foundation. Circulation, 110, 2952-2967.
Koster, A., Leitzmann, M.F., Schatzkin, A., Mouw, T., Adams, K.F., van Eijk, J.T.M., et al. (2008). Waist circumference and mortality. American Journal of Epidemiology, 167, 1465-1475.
Kumanyika, S.K. (2001). Minisymposium on obesity: Overview and some strategic considerations. Annual Review of Public Health, 22, 293-308.
Landbo, C., Prescott, E., Lange, P., Vestbo, J., and Almdal, T.P. (1999). Prognostic value of nutritional status in chronic obstructive pulmonary disease. American Journal of Respiratory and Clinical Care Medicine, 160, 1856-1861.
Lang, I.A., Llewellyn, D.J., Alexander, K., and Melzer, D. (2008). Obesity, physical function, and mortality in older adults. Journal of the American Geriatrics Society, 56, 1474-1478.
Leveille, S.G., Wee, C.C., and Iezzoni, L.I. (2005). Trends in obesity and arthritis among baby boomers and their predecessors, 1971-2002. American Journal of Public Health, 95, 1607-1613.
Li, C., Ford, E.S., McGuire, L.C., and Mokdad, A.H. (2007). Increasing trends in waist circumference and abdominal obesity among U.S. adults. Obesity, 15, 216-216.
Maillard, G., Charles, M.-A., Thibult, N., Forhan, A., Sermet, C., Basdevant, A., et al. (1999). Trends in the prevalence of obesity in the French adult population between 1980 and 1991. International Journal of Obesity, 23, 389-394.
Manson, J., Willett, W., Stampfer, M., Colditz, G., Hunter, D., Hankinson, S., et al. (1995). Body weight and mortality among women. New England Journal of Medicine, 333, 677-685.
Martínez, J.A., Moreno, B., and Martínez-González, M.A. (2004). Prevalence of obesity in Spain. Obesity Reviews, 5, 171-172.
Matkin Dolan, C., Kraemer, H., Browner, W., Ensrud, K., and Kelsey, J. (2007). Associations between body composition, anthropometry, and mortality in women aged 65 years and older. American Journal of Public Health, 97, 913-918.
McGee, D.L., and Diverse Populations Collaboration. (2005). Body mass index and mortality: A meta-analysis based on person-level data from twenty-six observational studies. Annals of Epidemiology, 15, 87-97.
Michaud, P., van Soest, A.H.O., and Andreyeva, T. (2007). Cross-country variation in obesity patterns among older Americans and Europeans. Forum for Health Economics and Policy, 10.
Must, A., Spadano, J., Coakley, E.H., Field, A.E., Colditz, G., and Dietz, W.H. (1999). The disease burden associated with overweight and obesity. Journal of the American Medical Association, 282, 1523-1529.
National Center for Health Statistics. (2009). National Health and Nutrition Examination Survey. Available: http://www.cdc.gov/nchs/nhanes.htm [accessed June 2009].
Olshansky, S., Passaro, D., Hershow, R., Layden, J., Carnes, B., Brody, J., et al. (2005). A potential decline in life expectancy in the United States in the 21st century. New England Journal of Medicine, 352, 1138-1145.
Pagano, R., La Vecchia, C., Decarli, A., Negri, E., and Franceschi, S. (1997). Trends in overweight and obesity among Italian adults, 1983 through 1994. American Journal of Public Health, 87, 1869-1870.
Polendak, A.P. (2003). Trends in incidence rates for obesity-associated cancers in the U.S. Cancer Detection and Prevention, 27, 415-421.
Prospective Studies Collaboration. (2009). Body-mass index and cause-specific mortality in 900,000 adults: Collaborative analyses of 57 prospective studies. Lancet, 373, 1083-1096.
Rennie, K.L., and Jebb, S.A. (2005). Prevalence of obesity in Great Britain. Obesity Reviews, 6, 11-12.
Reynolds, S.L., and Himes, C.L. (2007). Cohort differences in adult obesity in the United States: 1982-2002. Journal of Aging and Health, 19, 831-850.
Reynolds, S.L., Saito, Y., and Crimmins, E.M. (2005). The impact of obesity on active life expectancy in older American men and women. Gerontologist, 45, 438-444.
Romero-Corral, A., Montori, V., Somers, V., Korinek, J., Thomas, R., Allison, T., et al. (2006). Association of bodyweight with total mortality and with cardiovascular events in coronary artery disease: A systematic review of cohort studies. Lancet, 368, 666-678.
Schokker, D.F., Visscher, T.L.S., Nooyens, A.C.J., van Baak, M.A., and Seidell, J.C. (2007). Prevalence of overweight and obesity in the Netherlands. Obesity Reviews, 8, 101-107.
Seidell, J.C., Verschuren, W.M., and Kromhout, D. (1995). Prevalence and trends of obesity in the Netherlands 1987-1991. International Journal of Obesity and Related Metabolic Disorders, 19, 924-927.
Snijder, M.B., Zimmet, P.Z., Visser, M., Dekker, J.M., Seidell, J.C., and Shaw, J.E. (2004). Independent and opposite associations of waist and hip circumferences with diabetes, hypertension and dyslipidemia: The AusDiab Study. International Journal of Obesity and Related Metabolic Disorders, 28, 402-409.
Snijder, M.B., van Dam, R.M., Visser, M., and Seidell, J.C. (2006). What aspects of body fat are particularly hazardous and how do we measure them? International Journal of Epidemiology, 35, 83-92.
Stenholm, S., Rantanen, T., Alanen, E., Reunanen, A., Sainio, P., and Koskinen, S. (2007). Obesity history as a predictor of walking limitation at old age. Obesity, 15, 929-938.
Stevens, J., Cai, J., Pamuk, E.R., Williamson, D.F., Thun, M., and Wood, J.L. (1998). The effect of age on the association between body-mass index and mortality. New England Journal of Medicine, 338, 1-7.
Stevens, J., Cai, J., Thun, M.J., Williamson, D.F., and Wood, J.L. (1999). Consequences of the use of different measures of effect to determine the impact of age on the association between obesity and mortality. American Journal of Epidemiology, 150, 399-407.
Sturm, R., Ringel, J., and Andreyeva, T. (2004). Increasing obesity rates and disability trends. Health Affairs, 23, 199-205.
Thorpe, R., and Ferraro, K. (2004). Aging, obesity, and mortality: Misplaced concern about obese older people? Research on Aging, 26, 108-129.
Tjepkema, M. (2005). Measured Obesity. Adult Obesity in Canada: Measured Height and Weight. Ottawa: Statistics Canada.
Torrance, G.M., Hooper, M.D., and Reeder, B.A. (2002). Trends in overweight and obesity among adults in Canada (1970-1992): Evidence from national surveys using measured height and weight. International Journal of Obesity, 26, 797-804.
Trayhurn, P., and Beattie, J.H. (2001). Physiological role of adipose tissue: White adipose tissue as an endocrine and secretory organ. Proceedings of the Nutrition Society, 60, 329-339.
Visscher, T.L.S., and Seidell, J.C. (2004). Time trends (1993-1997) and seasonal variation in body mass index and waist circumference in the Netherlands. International Journal of Obesity and Related Metabolic Disorders, 28, 1309-1316.
Visscher, T.L.S., Seidell, J.C., Molarius, A., van der Kuip, D., Hofman, A., and Witteman, J.C. M. (2001). A comparison of body mass index, waist-hip ratio and waist circumference as predictors of all-cause mortality among the elderly: The Rotterdam Study. International Journal of Obesity, 25, 1730-1735.
Visscher, T.L.S., Kromhout, D., and Seidell, J.C. (2002). Long-term and recent time trends in the prevalence of obesity among Dutch men and women. International Journal of Obesity, 26, 1218-1224.
Wannamethee, S., and Shaper, A. (1999). Weight change and duration of overweight and obesity in the incidence of type 2 diabetes. Diabetes Care, 22, 1266-1272.
Wardle, J., and Boniface, D. (2007). Changes in the distributions of body mass index and waist circumference in English adults, 1993/1994 to 2002/2003. International Journal of Obesity, 32, 527-532.
Welborn, T.A., Dhaliwal, S.S., and Bennett, S.A. (2003). Waist-hip ratio is the dominant risk factor predicting cardiovascular death in Australia. Medical Journal of Australia, 179, 580-585.
Wells, J.C.K., Cole, T.J., Bruner, D., and Treleaven, P. (2007). Body shape in American and British adults: Between-country and inter-ethnic comparisons. International Journal of Obesity, 32, 152-159.
Wolf, A., and Colditz, G. (1998). Current estimates on the economic cost of obesity in the United States. Obesity Research, 6, 97-106.
Yoshiike, N., Kaneda, F., and Takimoto, H. (2002). Epidemiology of obesity and public health strategies for its control in Japan. Asia Pacific Journal of Clinical Nutrition, 11, S727-S731.
Yoshiike, N., Seino, F., Tajima, S., Arai, Y., Kawano, M., Furuhata, T., et al. (2002). Twenty-year changes in the prevalence of overweight in Japanese adults: The National Nutrition Survey 1976-95. Obesity Reviews, 3, 183-190.
ANNEX 6A
We first estimated the proportion at each BMI at approximately age 50 for both sexes using data from NHANES II (1976-1980) and NHANES (2001-2004). In order to generate a relatively smooth BMI distribution, we estimated the BMI distribution for the population ages 48-52 at each BMI in both surveys.
We then used the following formula to calculate the effect of obesity on life expectancy:
where:
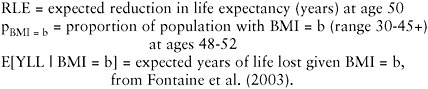
A BMI of 24 was defined as the reference category. Therefore, E[YLL | BMI = 24] was defined to be 0, and E[YLL | BMI = b] is interpreted as expected YLL at age 50, comparing those with BMI b with those with BMI 24.
This approach assumes that age-specific mortality and the association between BMI and mortality were constant.


