
4
Discovery Research for Rare Diseases and Orphan Product Development
I could see there was a transformation of cancer treatment on the horizon thanks to breakthroughs in biochemistry and genomics. I wanted to be part of that, which is why I was a physician-researcher… . By the late 1980s, C.M.L. [chronic myeloid leuke-mia], though rare, was a cancer that scientists knew a lot about. We knew, for instance that a chromosomal abnormality existed in every C.M.L. patient. We knew that this abnormality created an enzyme that caused the uncontrolled growth of cancer cells… . If you want to develop targeted chemotherapies, C.M.L. is the disease to study. We know the most about it—and, if we can figure out a way to block this enzyme, we can turn off the cancer switch.
Interview with Brian Druker (Dreifus, 2009)
The research undertaken by Brian Druker and his colleagues and predecessors offers a classic example of the foundation that basic research builds for the subsequent development of therapies for rare diseases. Breakthroughs in biochemistry and genomics, as well as advances in computational tools, have transformed the process of research and drug development. The process begins with basic laboratory studies that reveal the molecular mechanisms of disease, which related to a chromosomal abnormality in the case of chronic myelogenous leukemia (CML). This foundation leads to the discovery of biomarkers for rare conditions and the discovery of potential biological targets on which drugs can act. The target in CML is a rogue enzyme created by the mutated chromosomes, which triggers uncontrolled cell growth. Once a target is defined, the process shifts from basic research
to the discovery of a therapeutic approach. Imatinib mesylate (Gleevec), the drug discovered by Druker, specifically deactivates the enzyme target in CML. It was approved by the Food and Drug Administration (FDA) in 2001 and is now used not only for CML but also for other rare cancers. Increased knowledge of kinase inhibitors (of which imatinib was the first) is supporting the development of more potent, second-generation drugs for CML that may also be less susceptible to resistance (Sawyers, 2010).
Today, as a result of scientific and technological innovations, much of the basic research initially undertaken with CML could be done more quickly, inexpensively, and easily. For example, identification of the genetic cause of conditions that are clearly inherited used to involve speculative approaches and laborious analytical tools. The sequencing of the human genome has spawned an array of rapid and relatively inexpensive DNA analysis tools that have the potential to foster more targeted and efficient therapeutics development for rare diseases. Advances in the scientific understanding of disease mechanisms likewise are helping researchers focus more efficiently and effectively on potential therapeutic targets. As a result, the future holds the promise of continued innovation that will further accelerate biomedical research to the benefit of patients with rare as well as common diseases.
As discussed in Chapter 1, research on rare diseases can illuminate disease mechanisms and therapeutic opportunities for more common diseases. Box 4-1 briefly summarizes several additional examples of rare diseases research that have yielded broader knowledge.
Many of the same approaches and techniques are used to study both rare and common diseases, but research on rare diseases faces some special barriers and constraints. One is the sheer number of rare diseases, an estimated 5,000 to 8,000. Many of the challenges stem from the low prevalence that is the defining characteristic of rare diseases. Particularly for extremely rare conditions, the small numbers of affected individuals means a dearth of biological specimens, which severely limits studies of disease mechanism and etiology. Small numbers also constrain epidemiologic research and clinical trials as highlighted in Chapters 3 and 5. Other challenges include the limited funding for research and a limited number of investigators committed to the study of rare conditions.
The basic research tools available to investigators have advanced dramatically over the past 20 years, with new approaches continuing to evolve, both in the laboratory and from the use of computational biology. Along with new and better tools, models for supporting discovery research have also undergone a transformation in recent years. This chapter briefly examines the implications for rare diseases research of a number of current research strategies for both target discovery and therapeutic discovery. The next chapter focuses on product development, particularly from the perspective of companies and their academic and government collaborators
|
BOX 4-1 Examples of Research on Rare Diseases with Implications for Treatment of Common Conditions Some of the most effective treatments for coronary artery disease (a very common condition) were first established during the study of a rare condition called familial hypercholesterolemia. The disease was ultimately linked to mutations in the gene for the low-density lipoprotein receptor that coordinates the uptake of cholesterol from the blood. This work laid the foundation for the development and use of drugs (specifically, statins) that inhibit the rate-limiting enzyme in cholesterol synthesis, hydroxymethylglutaryl (HMG)-CoA (coenzyme A) reductase, in the lowering of circulating cholesterol and the prevention of coronary artery disease and myocardial infarction (Stossel, 2008). Patients with a rare condition called osteoporosis-pseudoglioma syndrome have loss-of-function mutations in the low-density lipoprotein receptor-related protein-5 (LRP5), while mutations causing rare conditions associated with high bone mass and density produce increased LRP5 function. Subsequent work showed that LRP5 normally inhibits serotonin production in the gut. Inhibition of gut serotonin production has emerged as a promising treatment for common causes of osteoporosis including the loss of bone mineral density associated with aging and menopause (Haigh, 2008; Long, 2008). Aortic aneurysm is the cause of death in about 1 to 2 percent of individuals in industrialized countries, but its cause is largely unknown and medical treatments are lacking. During the study of Marfan syndrome, a rare connective tissue disorder associated with a high risk of ascending aortic aneurysm and tear, researchers showed that aneurysm development and progression is associated with increased activity of transforming growth factor β (TGF-β), a molecule that instructs cellular behavior. It was subsequently shown that interventions that inhibit TGF-β, including administration of a neutralizing antibody or the angiotensin II type 1 receptor blocker losartan, could attenuate or prevent many manifestations of Marfan syndrome in mouse models. Responsive Marfan phenotypes included aortic aneurysm, skeletal muscle myopathy, pulmonary emphysema, and degeneration of the mitral valve. This work prompted the launch of the first clinical trial for Marfan syndrome based upon a refined understanding of disease pathogenesis, specifically assessing the efficacy of losartan in attenuating aortic root growth. Alteration of TGF-β activity was subsequently linked to other rare (e.g., Loeys-Dietz syndrome) and common (e.g., bicuspid aortic valve with aneurysm) presentations of aortic aneurysm (Jones et al., 2009). Losartan has also proved effective in the treatment of TGF-β-induced myopathy in a mouse model of Duchenne muscular dystrophy (Cohn et al., 2007). |
who are evaluating and undertaking the complex work needed to transform promising research discoveries into products that are safe and effective for patients in need. All along this continuum from basic research through clinical trials, infrastructure and innovation are needed to accelerate the development of therapies for people with rare diseases. The discussion here
focuses on the role of government, industry, academic investigators and institutions, and advocacy groups. Other groups also contribute, for example, organizations such as the American College of Medical Genetics.
Both this and the next chapter discuss the infrastructure for rare diseases research and orphan product development and “innovation platforms” to encourage and support collaborative work. Such collaboration is needed to bridge the gulf—sometimes referred to as the “valley of death”—between basic research findings and beneficial products, especially in the stages that precede clinical studies of efficacy. Early initiatives to bridge the gulf included public policies such as the Amendments to the Patent and Trademark Act of 1980 (P.L. 96-517, commonly known as the Bayh-Dole Act). That legislation encouraged cooperation among academic institutions, other nonprofit organizations, and small businesses to commercialize research discoveries funded by the federal government (Schact, 2007). Efforts continue to successfully engage government, academic, nonprofit, and commercial entities as collaborators in translating research discoveries into safe and effective drugs and medical devices. First, however, must come the discoveries.
TARGET DISCOVERY
Most rare diseases have a genetic etiology, but the molecular pathogenesis has been defined for a relatively small number of rare diseases. For most of this small group, a specific gene alteration is recognized as responsible for the disorder, and for a subset, understanding of the pathogenesis extends to identification of the function of the affected gene product. For an even smaller subset, investigators have described targets such as specific molecules or physiologic pathways that are amenable to therapeutic modification. The next sections discuss some particular areas of research advances and their prospects for increasing understanding of the molecular pathogenesis of rare diseases. Such understanding provides the basis for modern drug discovery.
Traditional Genetic Studies
Because most rare diseases are caused by defects in a single gene, identification of a mutated gene is the logical starting point for research in most cases. Although the standard approach to mapping the chromosomal location of the gene of interest has used candidate gene analysis or linkage analysis, these methods are inherently slow and often cumbersome.
Many factors can limit the utility of genetic mapping studies for rare disorders, notably the lack of large families with multiple affected, surviving individuals. Early death and other disease-related causes of reduced
reproduction contribute to this lack as does the general decline in family size associated with economic and social development. Recent technological advances have enabled researchers to employ genome-wide association studies to identify genetic variation that contributes to the pathogenesis of common disorders, as well as some of the most prevalent rare diseases such as juvenile idiopathic arthritis (see, e.g., Thomson et al., 2010). These studies depend on large patient populations and on an inherent assumption that the predisposing alleles or haplotypes are both ancient and shared among unrelated affected patients, effectively precluding this approach for small patient populations with high locus or allelic heterogeneity. Impaired reproductive fitness, a feature of many rare disorders, imposes allelic heterogeneity and would therefore implicitly disqualify this approach as a strategy for research on these disorders. Although some critics of genome-wide association studies argue that they have not been terribly informative with regard to individual risk of disease, the studies have highlighted pathways whose relevance to a particular disease had been unsuspected (Hirschhorn, 2009). Fortunately, additional tools for genetic research are now available.
Study of Modifier Genes and Epigenetics
Variation in secondary genes can alter primary gene effects and related pathways and can attenuate or mask underlying disease predisposition. Studies of these secondary genes are likely to inform the development of novel therapeutic strategies. For many rare and common disorders, there is considerable phenotypic variation among individuals with the same underlying primary disease gene mutation. This can be particularly striking when wide phenotypic variation is seen within individual families. For example, in X-linked adrenoleukodystrophy (a metabolic disorder that causes neurological damage), some affected family members have onset of neurodegeneration and death in childhood, whereas others show mild manifestations of disease such as isolated adrenal insufficiency that first manifests in adulthood. Yet other family members may be entirely asymptomatic (Maestri and Beaty, 1992; Moser et al., 2009).
The study of modifier genes can be facilitated through the use of inbred mouse strains that often show wide variation in disease severity based upon the genetic background on which a primary disease-causing mutation occurs. Animal models also offer the ability to use targeted genetic or pharmacologic perturbations to test focused hypotheses regarding modifier genes and pathways. The identification of modifier genes is of particular value in rare diseases, where diagnosis is already difficult due to the small number of cases.
Beyond germline genetic variation, modification of DNA (e.g., DNA
methylation, histone acetylation) contributes to rare disorders such as the Prader-Willi syndrome and Angelman syndrome (Adams, 2008), but it may be even more important as a contributory factor in modulating gene expression and, therefore, disease predisposition and severity. These epigenetic modifications are likely acquired as the result of an array of exposures (e.g., prenatal exposure to tobacco smoke) and experiences (e.g., stress). Investigators are now using microarray and sequencing to analyze methylation patterns as biomarkers that can have clinical value.
Whole Genome Sequencing, Gene Expression Analysis, and Exome Sequencing
Whole genome sequencing provides a complete analysis of the entire complement of an individual’s DNA. It can now be used to identify genetic variants associated with rare diseases in individual patients or families (Lupski et al., 2010; Roach et al., 2010). The cost for sequencing has fallen dramatically, but it remains resource intensive and challenging because each exome contains a large number of polymorphisms (variants), only one of which is typically the primary gene alteration (Lifton, 2010; Wade, 2010).
Microarray methods, which are used to comprehensively assess which genes are transcribed and which are not active in making proteins, are not diagnostic for genetic diseases. They can, however, be helpful in working out pathways that are dysfunctional in both genetic and acquired rare disorders (Wong and Wang, 2008). Experimental methods to interrupt gene expression in cell culture systems and animal models include the introduction of target-specific microRNAs, a tool that has been used to confirm the role of genes and pathways in the pathogenesis and modulation of disease.
Exome sequencing is a promising new approach to the search for disorder-causing genes for rare diseases (Kuehn, 2010; Tabor and Bamshad, 2010). The method focuses on the less than 5 percent of the genome that actually codes for protein. With this method, identification of genes associated with disorders of previously unknown etiology is possible using DNA from as few as two to four patients (Ng et al., 2009; Johnston et al., 2010). This approach provides a particular advantage to rare diseases, given that biological specimens are often scarce. It is expected to accelerate the rate of identification of gene defects for rare diseases.
Proteomics and Metabolomics
Researchers have made significant progress in the cataloging of genetic variation and its correlation with disease predisposition, initiation, and progression. Parallel initiatives for protein variation are also important.
Proteomics is the science of detecting, identifying, and quantifying the products of gene translation and represents another approach to uncovering variation that underlies the pathogenesis of rare diseases. A single gene can generate an array of protein species based upon alternative translational start and stop sites and splicing. The derived proteins can be further diversified in relative abundance, structure, and function by posttranslational modifications including phosphorylation, glycosylation, acetylation, and tagging for degradation. Proteomics analyses can detect primary perturbations that cause disease (e.g., congenital disorders of glycosylation), pathogenetic or compensatory pathway activation (e.g., the activation of kinases through quantitative analysis of substrates for phosphorylation), and candidate proteins for validation as biomarkers to aid in diagnosis, prognostication, or therapeutic trials (e.g., newborn screening by tandem mass spectrometry or detection of increased circulating levels of cardiac muscle-specific enzymes after myocardial infarction) (see, e.g., Duncan and Hunsucker, 2005; Haffner and Maher, 2006; Suzuki et al., 2009; Van Eyk, 2010). One challenge is that proteomic analysis requires expensive equipment (e.g., mass spectrometry) and data analysis tools, which means that this technique is usually centralized in special laboratories.
Metabolomics involves the study of the small-molecule metabolites found in an organism. As in proteomics, mass spectrometry can be used to detect abnormal metabolic products, to diagnose rare diseases, and to understand alterations in relevant biological pathways. An example is the elucidation of a series of synthetic enzyme deficiencies that result in the production of abnormal bile acids leading to serious liver, neurologic, connective tissue, and nutritional disorders (Heubi et al., 2007).
Systems Biology and Bioinformatics
With the aid of translational bioinformatics (Schadt et al., 2005a; Vodovotz et al., 2008), the construction of molecular networks and pathways relevant to specific rare disorders is increasingly possible. Bioinformatic analyses of data from gene expression arrays, proteomics studies, and clinical observations on patients with rare diseases can define signatures of fundamental disease mechanisms (Dudley et al., 2009; Patel et al., 2010; Suthram et al., 2010). Integration of this information with signatures of drug activities or therapeutic responses could intuitively promote discovery regarding the etiology, pathogenesis, and treatment of unclassified or poorly understood disorders (Schadt et al., 2005b). For example, if two diseases show overlapping or identical signatures, established treatments for one might benefit the other. Drugs that show signatures that oppose those seen for certain diseases emerge as candidate therapies. Bioinformatic methods can screen known chemical compounds for structural characteristics that
predict desired drug activities that are potentially beneficial for patients with rare diseases. Identification of drugs with overlapping signatures will promote the informed testing and substitution of agents that might show greater efficacy or other desirable characteristics such as reduced toxicity. Through these approaches, it should be possible to identify multiple intervention target sites for some disorders.
Conversely, studies of biological networks can also identify common pathways for multiple rare diseases that are biologically related. For example, a more comprehensive understanding of the molecular basis for lysosomal function may provide an opportunity for interventions that are beneficial for an array of lysosomal disorders (Sardiello et al., 2009). More broadly, this capability may open the door for the discovery of single therapies that can benefit multiple rare disorders and, potentially, also more common diseases.
The promise of systems biology is built on the availability of molecular and genetic data, combined with the development of valid computational methods for integrating these data into predictive models of disease (Schadt, 2005a). Although most genomic sequences are available in publicly accessible databases, many experimental biological data as well as clinical trials data are not collected or stored in a way that ensures broad access to the information. Thus, as discussed later in this chapter, the infrastructure for rare diseases research and product development should include structures and processes for sharing research resources, including data and biological specimens.
THERAPEUTICS DISCOVERY
Once basic research is performed and findings implicate a specific biological target, which could be an enzyme, a product of a biochemical pathway, an altered gene, an epigenetic mechanism, or a combination of the above, then the search begins for an appropriate therapeutic agent. Sometimes recognition of a molecular defect can point directly to potential therapies.
Effective therapies can either inhibit deleterious or excessive functions or restore missing functions, both of which can result from gene mutations. In the former category, for example, the finding that transforming growth factor β (TGF-β) plays a role in the development of aortic root aneurysms in Marfan syndrome led to studies of an inhibitor of TGF-β (angiotensin II type I receptor inhibitor losartan) that are currently in phase III trials (Dietz, 2010). A large number of monoclonal antibodies are available to modulate exuberant immunologic, inflammatory reactions in rare as well as more common diseases. Imatinib successfully treats CML and other cancers by inhibiting tyrosine kinases. Increasingly, small interfering RNAs
(siRNAs) are being tested as inhibitory drugs, systemically and by direct instillation into the central nervous system and other tissues (Dykxhoorn and Lieberman, 2006).
A few disorders can be treated with “curative” therapies that restore missing functions. Examples of such conditions and treatments include congenital hypothyroidism (replacement of thyroid hormone), bile acid synthetic enzyme deficiencies (oral bile acid therapy), biotinidase deficiency (biotin vitamin therapy), and celiac disease (dietary avoidance therapy). Still, for most rare diseases an obvious and easy therapeutic remedy is elusive or beyond current scientific capabilities. As discussed in Chapter 2, for most rare conditions, treatment is limited to symptomatic therapies (see, e.g., Campeau et al., 2008; Dietz, 2010).
High-Throughput Screening of Compound Libraries
When a potentially relevant target for an identified disease is validated, chemists then mount an intensive search for chemicals that might modify the target or targets. They screen vast compound libraries that are primarily assembled and secured within pharmaceutical companies to develop a list of potential “hits” that might some day become a “lead compound” and eventually new medicine, almost always after extensive “medicinal” chemistry to improve various properties of the parent compound and turn it into a drug suitable for testing in humans. This sophisticated process can be divided into three distinct steps: (1) development and maintenance of large compound libraries, (2) specific assay development, and (3) high-throughput screening.
Assays are analyses that quantify the interaction of the biological target and the compound that the researchers are investigating. They also might measure how the presence of the compound changes the way in which the biological target behaves. The chemical compounds tested in these assays are maintained in large compound libraries, which may contain more than 5 million chemicals. Products from natural sources such as plants, fungi, bacteria, and sea organisms can be integrated within compound libraries. Most compounds, though, are derived through the use of chemical synthesis techniques, in which researchers create chemical compounds by manipulating “parent” chemicals. They might also use combinatorial chemistry, in which researchers create new but related chemical compounds and test them rapidly for desirable properties. Sometimes companies will provide compounds to laboratories for low-volume screening, or alternatively the assay for the molecular target can be provided to a company where it will be optimized for high-throughput screening.
Testing the expanding number of available biological targets against thousands or millions of chemical entities requires highly sophisticated
screening methods. Researchers use robotics, for example, to simultaneously test thousands of distinct chemical compounds in functional and binding assays. Academic researchers with expert knowledge of specific pathways may guide the development of assays in collaboration with industry. The chemical compounds identified through this kind of screening can provide powerful research tools that contribute to a better understanding of biological processes. This, in turn, may lead to new targets for potential drug discoveries.
The purpose of this chemistry stage is to refine the compound. Hundreds and possibly thousands of related compounds may be tested to determine if they have greater effectiveness, reduced toxicity, or improved pharmacological behavior, such as better absorption after a patient takes the drug orally.
To optimize the molecules being investigated, scientists use computers to model the structure of the lead compounds and how they link to the target protein—an approach to structure-based design known as in silico modeling (silico referring to the silicon technology that powers computers). This kind of structural information gives chemists a chance to modify lead molecules or compounds in a more rational way. This refinement process is called lead optimization, which may produce a drug candidate that has promising biological and chemical properties for the treatment of a disease.
Once a candidate drug (or group of candidates) is developed and its effectiveness in altering the molecular target is verified, then animal studies begin to determine whether the drug can be absorbed through the gastrointestinal tract for oral delivery, whether adequate levels of the drug are achieved in the blood, how the drug is metabolized in the body and excreted, and whether it actually reaches the molecular target defined by the basic research. In addition, if an animal model of the rare disease exists (through genetic alterations), this provides researchers with an opportunity to gather a preclinical proof of therapeutic concept, which can be very important before the compound enters development. This process of drug discovery for rare diseases is no different than that for common diseases—the costs and infrastructure required for both are significant.
Methodological Approaches to Biologics Discovery
For a biologic product (e.g., a specific protein, enzyme, peptide, antibody, or vaccine), the discovery phase varies considerably from the process for a small-molecule drug described above. It requires different areas of expertise, some of which can be found at academic institutions and others of which are available at biotechnology and pharmaceutical companies.
If the defect in a specific rare disease is due to deficiency of a specific protein, then human protein replacement therapy may be a feasible approach. To accomplish this, the replacement protein can either be isolated from other animals or, more commonly, be expressed in microorganisms or plant, nonhuman mammalian, or human cells after introduction of a gene encoding the desired human protein (so-called recombinant expression). This process can be extremely complicated. Some proteins require specific modifications (called posttranslational modifications) that are only accomplished by specific organisms or cell types. Other proteins require artificial modifications to target them to a specific tissue or cell type or to facilitate their uptake into cells, if that is where their critical function resides. For example, for some lysosomal enzyme deficiency diseases, it is critical to target the replacement protein for uptake in liver or muscle cells, whereas for other diseases, the replacement protein must have different modifications that promote uptake by reticuloendothelial cells (Grabowski and Hopkin. 2003). Not all obstacles have found solutions. Currently, a sizable number of rare diseases that affect the brain present a major challenge since many biologics lack the ability to cross from the circulation into the central nervous system (the so-called blood-brain barrier). Researchers continue to investigate strategies for overcoming this problem (see, e.g., LeBowitz, 2005; Valeo, 2010).
Given this complexity, there is no single path to success for biologic therapeutics. Rather, the opportunities and obstacles must be elucidated for each disease, and the approach must be tailored accordingly—a truly daunting task for thousands of rare disorders. Nevertheless, biologics have strong appeal because they have the potential to address the etiologic foundation of a disease process (e.g., through replacement of a deficient protein), to prevent diseases (e.g., with vaccines), or to harness the power of the immune system to achieve target specificity and to diversify the output of potential therapeutic agents (e.g., by production of an antibody that neutralizes a deleterious protein). Good examples include clotting factor proteins to treat hemophilia, vaccines to prevent smallpox or measles, and antibodies to treat multiple forms of cancer (Reichert et al., 2005).
Restoration of functional levels of missing molecules includes enzyme replacement therapy, available for several lysosomal storage diseases. Among these are Gaucher disease, Fabry disease, mucopolysaccharidosis I and VI, and Pompe disease (Lim-Melia and Kronn, 2009). Enzyme therapy is also employed for one form of severe combined immunodeficiency, adenosine deaminase deficiency (Aiuti et al., 2009). These approaches have required research efforts to express the protein yeast, bacteria, plant, or mammalian cell systems at small laboratory scale to provide sufficient enzyme for research studies. Enzyme therapy does not correct central nervous system
dysfunction because an enzyme does not cross the blood-brain barrier. An approach, not yet successful, has been to make this barrier transiently permeable, and hematopoietic stem cell transplantation is being explored to restore the brain’s capacity to make protein on its own (Hemsley and Hopwood, 2009).
Other Forms of Therapy Applicable to Rare Diseases
Cell Therapy
Cell therapies for rare disorders are largely confined to blood and marrow transplants to repopulate key cell subpopulations through differentiation of hematopoietic stem cells. Examples include a diverse range of rare disorders including degenerative neurologic disorders such as Krabbe disease (Escolar et al., 2006), Fanconi anemia (Kelly et al., 2007), and metabolic storage diseases such as the mucopolysaccharidoses (Sauer et al., 2004). Blood and marrow transplantation offers the opportunity for long-term correction but is attended by major risks (especially when using unrelated donors) such as failure of reconstitution, graft versus host disease, severe infections owing to immune suppression, and death. Current research efforts are aimed at reducing or eliminating these side effects. Undoubtedly, blood and marrow transplants will be studied for efficacy in additional rare diseases.
Cell therapies beyond blood and marrow transplantation have the potential through tissue engineering to reconstitute organ tissues that have been injured as a result of a rare disorder. New cell therapies will utilize embryonic or adult stem cells that can be programmed to differentiate into a mature cell of choice. It is likely that initially targeted disorders for cell therapies will be the more commonly occurring organ system injuries such as myocardial infarction. Nonetheless, cell therapies hold promise for rarer events and disorders, and human clinical trials of stem cells as potential therapy for rare diseases have begun (see, e.g., Steiner et al., 2009).
Gene Therapy
Gene therapy has been successful in limited circumstances. The overall goal of traditional gene therapy is to deliver a normal gene to compensate for one that is either dysfunctional or absent in a specific rare disease. Attempts to deliver genes with viral or other vectors directly to organs such as the lung for cystic fibrosis or the liver for metabolic disorders or hemophilia (High, 2009) have not yet been therapeutically successful. Attempts to introduce the factor IX gene into hemophilia patients using adeno-associated virus (AAV) have demonstrated factor production but have been attended by hepatoxic immunologic reactions (High, 2009).
More recently, correction of several rare disorders has been accomplished by inserting genes with retrovirus vectors into the patient’s hematopoietic stem cells and returning these cells to the patient to restore lost function. This approach seemed to provide successful correction for severe combined immunodeficiency, but it also induced malignant transformation of lymphocytes in several of the treated patients, halting the further use of this approach pending the ability to overcome this serious adverse event (Aiuti et al., 2009; Hacein-Bey-Abina et al., 2010). Similarly, promising results for treatment of chronic granulomatous disease with gene-modified autologous stem cells have been accompanied by unanticipated serious adverse outcomes (Stein et al., 2010). The use of self-inactivating lentivirus vectors may circumvent some of the problems attributable to retrovirus vectors (Neschadim et al., 2007).
High (2009) recently reported the finding of improved vision after direct injection of an AAV vectored wild-type gene necessary for production of visual pigment into the subretinal space of patients with Leber congenital amaurosis. Other recent successful gene therapies have also been reported (see, e.g., Bainbridge et al., 2008; Cartier et al., 2009). These achievements provide renewed hope, but gene therapy is currently considered experimental and is tightly regulated. Extensive research will be needed to create gene therapies that provide efficient, stable, and safe correction across a range of rare disorders. Future research should overcome many of the current barriers to corrective gene therapy including avoidance of insertional mutagenesis and deleterious immunologic responses, maintenance of gene expression, and promotion of the targeting, engraftment, and viability of genetically altered cells. The research to achieve these goals may require decades.
Combined gene and cell therapy also demonstrates promise. Mesenchymal stem cells can repopulate injured tissues, but can also be genetically programmed to enhance their benefit. For example, mesenchymal stem cells that have been genetically programmed to produce interleukin-10 have been shown to protect against reperfusion injury in transplanted rat lungs (Manning et al., 2010). This strategy has also been studied in treating osteogenesis impefecta (Chamberlin et al., 2004). Continuing support of improved and novel approaches to gene therapy is important for rare diseases, which for the most part have genetic causes that will often be difficult to treat with simpler therapies.
Diagnostics
Rare disorders are identified in a variety of ways, including by physical examination for clinical phenotypes, by biochemical assays, by testing for chromosomal abnormalities, by testing for gene mutations, and by imaging to detect structural and functional abnormalities. There are many rare
diseases for which no diagnostic tests are available. These diseases must be diagnosed on the basis of carefully defined clinical characteristics. Box 4-2 highlights some of the enabling technologies to support advances in diagnostics.
As noted earlier, detection of gene mutations is accelerating for rare diseases, and new methods such as whole exome sequencing promise even greater momentum. Once the primary genes are identified, the development of laboratory tests for rare disorders becomes feasible. (As described in Chapter 7, many diagnostic tests are regulated as medical devices. FDA has recently indicated that it will seek to regulate some genetic tests, although the specifics have yet to be determined.) In addition, genotyping now allows for identification of classical disease subtypes, an increasingly important step in designing and prescribing effective therapeutic agents. Finally, genetic testing for polymorphisms of genes coding for drug metabolizing enzymes (pharmacogenetics) will be increasingly useful for identifying drug responders and nonresponders with rare as well as common diseases.
In addition, research in the area of development of new technologies for newborn screening is advancing reasonably quickly; most targeted conditions are rare diseases (see Chapter 2). For example, tandem mass spectrometry for the direct assay of enzymes in dried blood spots has been applied to newborn screening for Krabbe disease (Li et al., 2004). As new biomarkers are described, cheaper and more facile diagnostic methods will
|
BOX 4-2 Improving Rare Disease Diagnostics: Enabling Technologies
|
undoubtedly be developed and used at an early age to identify presymptomatic rare conditions.
If DNA sequencing and interpretation of sequence data can in the future be carried out at low cost, it is conceivable that whole exome or whole genome sequencing will be productive for early diagnosis or even for newborn screening (Collins, 2009). The responsible application of such testing will require a comprehensive assessment of ethical, economic, practical, and social implications.
Genetic tests will, in all likelihood, include not only the identification of single nucleotide polymorphisms of the primary gene but also of DNA copy number variations, modifier gene polymorphisms, gene expression profiles, and the determination of epigenetic modification of DNA or histones that bear on gene expression and, therefore, the clinical manifestations. This extended genetic testing, when coupled with meticulous patient phenotyping, has the potential to explain clinical variation within defined rare disorders and offers opportunities to more accurately predict the clinical course of the disease. Such diagnostic information will be useful in guiding decisions about the timing of therapeutic interventions and their intensity. As is true of most diagnostic testing, genetic testing also may identify variants of uncertain significance that puzzle clinicians and do not yet assist decisions about patient care.
In addition to genetic markers, other biomarkers may be useful in predicting disease severity or progression. They may include specific patterns of peptides and metabolites identified by proteomic or metabolomic analysis. In selected disorders, longitudinal assessments of environmental exposures may predict variation in outcomes (e.g., for patients with cystic fibrosis who are exposed to tobacco smoke).
INFRASTRUCTURE FOR BASIC RESEARCH AND DRUG DISCOVERY FOR RARE DISEASES
As highlighted above, the basic research tools available to investigators have advanced dramatically over the past 20 years, with new approaches continuing to evolve. Along with them, models for providing the infrastructure necessary for discovery research have also undergone a transformation in recent years. This section describes some elements of the necessary infrastructure, including animal models, patient registries and biospecimen repositories, research funding, and training and also describes innovations in the area of sharing data and other resources, which can lower the considerable costs of basic and translational research.
Although collaboration and innovation in the sharing of data and other scarce resources are particularly useful for advancing research on rare diseases, commonly cited barriers include concerns about the protection of
intellectual property. These concerns involve legal, technical, and financial issues related to the patent process itself, but they also derive from the significance of intellectual property, broadly construed, to the success of institutions and individuals. The committee was not asked to examine the protection of intellectual property, but it is importance to recognize that such protection through the issuing of patents and copyrights is a fundamental element of the infrastructure linking biomedical research to product development. The passage of the Orphan Drug Act was in part a response to the lack of incentives for companies to investigate rare diseases applications of off-patent or unpatentable drugs (Asbury, 1985). Although the patenting process is the same for products for common and rare diseases, questions about the status of patents on genes and proteins may present special challenges for rare genetic diseases research that relate to development of new drugs (discussed in Chapter 5).1
At the institutional level, developing feasible mechanisms for data and resource sharing in both academic and commercial research is not a straightforward process (see, e.g., Cohen and Walsh, 2008; So and Stewart, 2009). For example, university technology transfer offices have been criticized for being slow and cumbersome. Moreover, because the patenting process is costly, institutions with limited resources may be forced to choose which discoveries they will seek to protect and which they will not. In these circumstances, the limited commercial prospects for many products for rare diseases may influence institutions to bypass future commercialization opportunities, and the lack of patent protection may discourage the sharing of data and materials with potential collaborators.
At the individual level, investigators’ desires for professional advancement and stature as well as their property interests in discoveries may sometimes impede and sometimes support sharing and collaboration. One study of access to genetic data and materials reported that nearly 50 percent of genetic researchers have encountered negative responses to their requests for data or materials related to published research (Campbell et al., 2002; see also Schofield et al., 2009). Reasons cited for denying access included not only desires to protect the commercial value of the intellectual property but also to maintain publication opportunities. Another factor cited was the cost of producing the data or materials requested.
Although barriers are significant, a range of infrastructure and information sharing innovations can be cited, including several that operate
under the auspices of the National Center for Biotechnology. One example is GenBank, which is a National Institutes of Health (NIH) database of publicly available DNA sequences that have been submitted by individual laboratories or from large-scale sequencing projects (Benson et al., 2008). A significant incentive for such submissions is the requirement by scientific journals for deposition to GenBank or a similar database so that an accession number will be included in a published article.
Also, a significant response to institutional, individual, and other barriers to information access has been the requirement by NIH that applicants for grants that exceed $500,000 include a plan for “timely release and sharing of final research data from NIH-supported studies” (NIH, 2003, unpaged). In addition, some private organizations such as the Myelin Repair Foundation have grant provisions to speed information sharing (MRF, 2010; see also Schofield et al., 2009). More examples of initiatives to increase access to information and other infrastructure resources are described below and in Chapter 5.
Animal Models
Development of disease models in animals yields major opportunities for discovery of the genetic and biochemical basis for rare diseases, the identification of therapeutic targets, and the testing of new drugs and biologics for efficacy and safety. A number of genetic diseases occur naturally in animals (e.g., hemophilia B in dogs [Kay et al., 1994]), and various techniques exist for creating such models when they do not exist in nature. Mouse models are common, but simpler, more rapidly reproducing models such as the zebrafish are also valuable where genetic mouse models do not fully recreate human disease. Technological advances have allowed the development of long-sought alternative animal models for Huntington disease (monkey) and cystic fibrosis (pig) (Wolfe, 2009), but satisfactory animal models still await many rare diseases, for example, Smith Lemli Opitz syndrome (Merkens et al., 2009).
Mouse models, and occasionally other animal models, can be created using both forward and reverse genetic manipulation. Forward genetics involves the altering of specific genes to change their expression patterns and products. Although expensive and time-consuming, this approach is now a fundamental experimental strategy and has been an important contributor to research advances for an array of rare diseases. Reverse genetics is carried out by exposing animals to mutagenic agents and identifying genetic disorders by careful genotyping and phenotyping of the animals. Using this approach, a lethal skeletal dysplasia was created in mice that led to the identification of a deficiency of the GMAP-210 gene in these mice as well as in human achondrogenesis type 1A (Smits et al., 2010). The ability
to carry out these studies requires animal (especially mouse) manipulation and maintenance facilities that are now available in most major academic research centers. Adequate funding for these studies is a challenge for fledgling research programs.
Expanded development and access to genetically modified mice that are relevant to rare diseases will promote research progress and accelerate work aimed at identifying potential therapeutic agents for rare diseases. Other research approaches have used cultured cells from mouse models of rare disease. Mice with humanized livers can be a boon for drug toxicity testing. Interestingly, it was research on tyrosinemia, a rare disease that led to this model (Azuma et al., 2007). Progress at the preclinical stage will undoubtedly be aided by the creative use of human cells, both normal and those derived from patients with genetic defects. An emerging option may be the in vitro generation of normal or disorder-specific differentiated cells from human pluripotent cells.
Mice with genetic disorders are collected, studied, and made available to researchers by various organizations, including the National Cancer Institute (http://mouse.ncifcrf.gov/) and the Jackson Laboratories, which also offers cells, tissues, and other products and services (http://jaxmice.jax.org/). One initiative of the Friedreich’s Ataxia Research Alliance was to arrange with Jackson Laboratories to make mice available so that researchers no longer had to maintain their own research animals (Farmer, 2009).
Patient Registries and Sample Repositories
Patient registries can address many obstacles faced in the study of rare disorders including provision of a centralized source of information regarding disease incidence, prevalence, regional or temporal clustering of cases, and natural history or response to treatment. They can also serve as a recruitment tool for the launch of studies focused on disease etiology, pathogenesis, diagnosis, or therapy. (Chapter 5 discusses the role of patient registries in clinical studies.) In addition, patient registries can form the basis for the development of support networks and national or regional patient advocacy groups.
When combined with genetic information, patient registries can inform the correlation of patient genotype with the distribution, onset, severity, or progression of clinical manifestations or response to treatment (phenotype-genotype correlations). In essence, for rare disorders it is necessary to collect as much information as possible on as many patients as possible to discriminate predictive patterns from chance correlations, to validate these patterns using statistical methods, and to apply them productively in individual patient diagnosis, prognostication, counseling, and management (i.e., individualized medicine). Patient registries can be organized
for a specific diagnosis (e.g., the Cystic Fibrosis Foundation [CFF] Patient Registry), a class of phenotypically related diagnoses (e.g., the National Registry of Genetically Triggered Thoracic Aortic Aneurysms and Cardiovascular Conditions [GenTAC]), or even a particularly important clinical event or outcome that is common to many conditions (e.g., the International Registry of Acute Aortic Dissections). Decisions about whether a registry should attempt to capture a comprehensive or representative sample are often influenced by disease prevalence. For example, the GenTAC cohort derives from five centers with a high surgical volume of patients with aortic aneurysm, whereas for the CFF registry, centers accredited by the CFF make a concerted effort to enter prescribed data elements for all patients. The CFF approach, in which designation as an accredited center and funding are linked to participation in the registry effort, has proven remarkably effective; more than 25,000 individuals are included in the registry (CFF, 2009). CFF-accredited centers also provide rich genotypic information and use standardized and evidence-based diagnostic and management guidelines based in part on national registry data analyses. This approach can serve as a model for certain other rare disorders, although it will be limited to patient advocacy groups or other coordinating entities that have substantial sophistication, organization, and resources to exert as leverage.
In addition to patient registries, a number of advocacy groups have promoted the development of repositories of biospecimens. In recognition of the challenges this undertaking presents for many groups, the Genetic Alliance Biobank provides infrastructure coordination for multiple rare diseases, and it includes clinical records and questionnaires as well as biological materials (Genetic Alliance, 2010). This type of federated approach also lowers the barriers for access to patient samples by individual researchers.
The National Disease Research Interchange, a federally funded private organization, takes a different approach to biospecimens (http://www.ndriresource.org/). It provides academic and industry researchers with a national human tissue and organ retrieval system. The organization recently created an alliance with a number of rare diseases organizations to increase awareness of its resources and develop new resources, including the National Rare Disease Biospecimen Resource.
Given the scope of the challenge to strengthen patient registries and other aspects of the research infrastructure for many or all rare disorders, it seems highly practical and desirable for NIH to be positioned as a central partner if not the leader in this effort. Later in this chapter, Recommendation 4-1 proposes that NIH collaborate on a comprehensive system of shared resources for discovery research on rare diseases. In Chapter 5, Recommendation 5-3 calls for NIH to support a collaborative public-private partnership to develop and manage a freely available platform for creating or restructuring patient registries and biorepositories for rare diseases and
sharing de-identified data. Many complex details will need to be considered to implement these recommendations.
Funding of Basic Research and Drug Discovery for Rare Diseases
The discussion below focuses on government and nonprofit organizations as funders of basic research on rare diseases, but it also includes some data and some concerns related to the financing of clinical studies. In general across many sectors of the economy, industry funds relatively little basic research, both as a percentage of total industry funding of research and development and in comparison to federal government funding (AAAS, 2009). In health care, publicly funded basic research is a foundation for pharmaceutical development.
NIH and Other Federal Agencies
As with other basic biomedical research in the United States, the major funding source for basic research on rare diseases is undoubtedly NIH. The committee was not, however, able to determine the amount of NIH funding directed to all conditions that are identified as rare. It understands that the Office of Rare Diseases Research at NIH has requested that the process for categorizing and collecting data on spending by category be revised to allow the easier generation of disease-specific totals and totals for all spending on rare diseases research. This would allow a more systematic assessment of current resources and resource allocation.
Categorizing basic research spending by disease is less straightforward than categorizing clinical research, but an informal examination of the RePORTER database of current NIH awards (http://projectreporter.nih.gov/reporter.cfm) indicates that many rare diseases have attracted substantial funding but that funding for specific rare diseases is highly variable. Figure 4-1 presents a scatter plot for 32 rare diseases (selected to be generally representative of different kinds of conditions), with disorder prevalence displayed on the horizontal axis and numbers of awards on the vertical axis. (Limitations of the data source for the prevalence statistics are described in Chapter 2.) The number of NIH awards varies from none for tetralogy of Fallot and one for Ehlers-Danlos syndrome to more than 600 awards for Huntington disease and nearly 800 awards for cystic fibrosis.
Many factors undoubtedly contribute to the variation in the number of awards for this group of diseases. Although a systematic analysis was beyond the committee’s resources, several general observations can be made. First, those rare diseases for which a specific gene mutation or set of gene mutations has been identified have generally attracted substantial
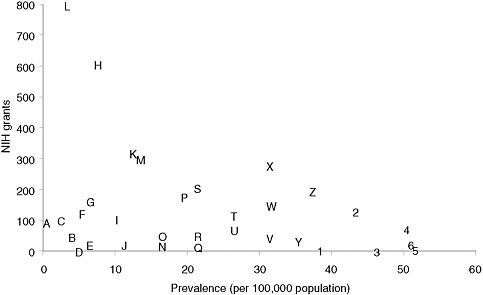
FIGURE 4-1 Plot of NIH grants for illustrative rare diseases by disease prevalence.
NOTE: Prevalence figures come from Orphanet, 2009 (see discussion of data in Chapter 2). Grant numbers include American Recovery and Reinvestment Act grant supplements and training grants.
SOURCE: NIH Reporter (http://projectreporter.nih.gov/reporter.cfm).
A — Progeria
B — Niemann-Pick disease
C — Fanconi anemia
D — Ehlers-Danlos syndrome (classic)
E — Primary ciliary dyskinesia
F — Rett syndrome
G — Duchenne muscular dystrophy
H — Huntington disease
I — Tuberous sclerosis
J — Leber congenital amaurosis
K — Sickle cell anemia
L — Cystic fibrosis
M — Acute myeloid leukemia
N — Congenital diaphragmatic hernia
O — Sarcoidosis
P — Familial dilated cardiomyopathy
Q — Hereditary spherocytosis
R — Turner syndrome
S — Gastric cancer
T — Neurofibromatosis (type 1)
U — Alpha1-antitrypsin
V — Marfan syndrome
W — Amyloidosis
X— Acute respiratory distress syndrome (adult)
Y — Cryptosporidiosis
Z — Non-Hodgkin lymphoma
1— Albright hereditary
osteodystrophy
2 — Scleroderma
3 — Tetralogy of Fallot
4 — Narcolepsy (cataplexy)
5— Melanocortin-4 receptor deficiency
6 — Noonan syndrome
numbers of NIH awards. Second, those disorders for which robust, high-profile patient advocacy groups have been established also tend to be the ones garnering more federal funding. Third, one feature of research on a rare disease, especially an extremely rare disease, is that only one or two investigators may be funded to study the condition, which means that the loss of funding can bring research virtually to a halt. Few advocacy groups have the resources to step into the funding breach.
Table 4-1 presents data on NIH awards for four very rare disorders, progeria, Neiman-Pick disease, Fanconi anemia, and primary ciliary dyskinesia. The numbers of awards for these conditions range from approximately 20 to 100. The variation is fivefold and does not appear to be related to knowledge of genetic or molecular causation, which the committee believes is similar for all four. Most of the awards are directed to basic science exploration of biological mechanisms that are related to the gene(s) of interest for that disorder. A much smaller number of awards fund preclinical (animal models) research examining both pathogenesis and therapeutic interventions.
For these four rare disorders, NIH is funding very few clinical trials. This may reflect the time lag between scientific discovery and clinical therapeutics research, the difficulties of conducting clinical research on very rare conditions, NIH’s traditional emphasis on basic research, and the dominance of industry in funding clinical trials of drugs or other thera-
TABLE 4-1 Active NIH Awards for Four Rare Diseases by Number, Funding Total, and Type as of April 2010
|
Condition |
Disease Prevalence (per 100,000) |
Total Grants Listed |
Annual Total Funding (millions of dollars) |
Number of Grants Directly Targeting the Disorder |
Preclinical Studies |
Clinical Trials |
Other Clinical Studies |
|
Progeria |
0.2 |
44 |
22.6 |
18 |
3 |
1 |
3 |
|
Niemann-Pick |
0.5 |
46 |
17.8 |
20 |
7 |
1 |
0 |
|
Fanconi anemia |
1.0 |
103 |
45.5 |
51 |
15 |
1 |
0 |
|
Primary ciliary dyskinesia |
5.0 |
23 |
8.0 |
13 |
0 |
0 |
3 |
|
NOTES: A committee member (TFB) categorized grants directly targeting a disorder by reading the abstract for each grant to judge whether it directly addressed pathogenetic or clinical dimensions of the disorder or was focused on questions that were related only tangentially to the disorder. Likewise, this reader also evaluated whether the research involved preclinical (largely animal model) research, a clinic trial, or other clinical research (e.g., a natural history study). Supplementary grants under the American Recovery and Reinvestment Act are counted as separate awards. SOURCE: NIH RePORTER (http://projectreporter.nih.gov/reporter.cfm). Prevalence data were taken from Orphanet, 2009 (see discussion of these data in Chapter 2). |
|||||||
peutic agents. Ongoing attention to the balance between basic and applied research for rare diseases will be critical to the acceleration of diagnostic and therapeutic product development.
Beyond those cited above, other factors contributing to the variation in federal funding of rare diseases research may include the number of scientific issues raised by a particular rare disease, the potential broader relevance of those issues, the availability of pilot grants from disease-specific foundations, the extent to which clinical care and clinical research are focused in disorder-specific clinics or centers, and workforce issues such as numbers of trained basic and clinical investigators.
Federal agencies beyond NIH also fund some biomedical research on rare diseases, particularly clinical studies. Chapter 3 describes the small orphan products grant program at FDA. Also within the Department of Health and Human Services, agencies such as the Centers for Disease Control and Prevention, the Bureau of Maternal and Child Health, and the Agency for Healthcare Research and Quality (AHRQ) support some research on rare conditions, particularly clinical, population-based, and health services research. For example, AHRQ has supported a review of the effectiveness of specific screening options to prevent neonatal encephalopathy owing to hyperbilirubinemia (Trikalinos et al., 2009). Chapter 1 cited the Congressionally Directed Research Program at the U.S. Department of Defense, which has been mandated to conduct research on several rare conditions.
Advocacy Groups and Foundations
An increasing number of disease-specific foundations and advocacy groups provide funding for research. The aim of many of these foundations is to attract investigators with skills and research track records in other areas to devote their attention to a particular rare disease. Several also support research training and career development in an attempt to engage future investigators in research efforts that advance their medical scientific agendas. This has worked well for foundations such as CFF, which over the years has committed $50 million to $100 million a year in the support of research. Other groups such as the Fanconi Anemia Research Fund have more recently entered the research funding arena and have been successful in attracting substantial but smaller numbers of investigators. (Appendix F presents several illustrative examples of elements of research support strategies pursued by advocacy organizations.)
Traditionally, disease-specific foundations have recognized that support across the entire continuum—basic research through clinical development—is necessary. In some cases, advocacy groups have been responsible for funding the fundamental scientific breakthroughs that were necessary
for progress toward new therapies. Examples include CFF’s support for work leading to the discovery of the CF gene (Riordan et al., 1989) and, much earlier, the National Foundation for Infantile Paralysis (now March of Dimes), which funded the work that produced the fundamental scientific insights needed for the development of the polio vaccine.
As part of their strategic planning, some rare diseases research foundations have undertaken analyses of public and private research spending on specific conditions. For example, the International Rett Syndrome Foundation determined that NIH accounted for 72 percent of funding of research on the syndrome, with foreign governments contributing 3 percent and nonprofit organizations 23 percent (IRSF, 2008; see also Appendix F). Of the funding, 94 percent was directed to basic research, with the largest share of both public and private funds devoted to finding and validating potential drug targets. Their conclusion was that a “bottleneck” existed in the translation of basic research findings into new therapies.
A number of foundations sponsor annual research meetings at which investigators share their research results and discuss opportunities in therapeutic development. In some cases, the foundations provide the impetus for the first gatherings of researchers working on certain rare diseases (e.g., the Chordoma Foundation, which jointly sponsored a workshop in 2007 with the NIH Office of Rare Diseases Research). Foundations have also partnered with federal agencies to promote research or launch clinical trials (e.g., the National Marfan Foundation and the Pediatric Heart Network of the National Heart, Lung, and Blood Institute, which launched the first clinical trial for Marfan syndrome [Lacro et al., 2007]).
Although disease-specific foundations do fund important research, private foundations collectively account for less than 10 percent of all support for biomedical research (Dorsey et al., 2010). When this support is divided into research on particular diseases and weighed against the cost of clinical trials, the amount available from private nonprofit sources for development of therapies is typically quite small. Individual foundations often seek to leverage relatively limited funds through the use of seed grants that help investigators develop the data needed to support competitive NIH grant proposals.
Investigator Training and Recruitment
A decision to pursue basic or translational rare diseases research is inherently risky, especially for young investigators. It is important that this reality be appreciated, both by funding agencies and by host academic institutions. Although academic investigators are attracted to the intellectual challenge of a rare diseases puzzle, they confront numerous vulnerabilities, including the scarce funding for research on most rare diseases, the limited number of potential collaborators, the limited access to biospecimens that
are necessary for basic research, and the substantial uncertainty about industry interest in translating discoveries into products for rare diseases. All of these factors add to the difficulties normally confronted by academic researchers trying to establish research careers. Other issues, which are not confined to research on rare diseases in the university setting, include the complexities of negotiating contracts and materials transfer and other intellectual property agreements and the need to identify and manage or eliminate conflicts of interest that may arise from financial relationships with industry (e.g., research funding, consulting).
The review process at NIH also raises concerns. Existing study sections may be predisposed toward more common diseases, may not appreciate the critical importance of natural history studies for rare diseases, or may lack expertise to evaluate proposals that involve innovative trial designs and analytic methods for small populations. Possible responses include creating special NIH review mechanisms for rare diseases research proposals or developing guidance for existing study sections on the review of rare diseases proposals.
Specialized incentives to attract young investigators to the field include loan repayment, targeted requests for proposals from young investigators, and fellow-to-faculty transition awards. These mechanisms are useful in attracting young investigators into all disease areas and could be targeted specifically to investigators in areas of rare disease.
Areas of training particularly relevant to the development of rare diseases-oriented basic science careers include research in clinical genetics, tissue engineering and cell therapies, gene therapy, and bioinformatics. Training of clinicians in medical genetics, pediatric cardiology, or adult hematology-oncology represents a possible entry point to careers focused on a number of rare diseases encountered in these subspecialty areas. In addition to programs associated with the Rare Diseases Clinical Research Network (see Chapter 5), a few other training programs focused on rare diseases exist, for example, in juvenile rheumatoid arthritis, cystic fibrosis, muscular dystrophy, and sickle cell disease.
The basic science foundation needed for investigators in rare diseases is not distinct from that required for all biomedical research. Where the training needs diverge is at the point when an identified target is used to discover a potential drug and, from there, to move that drug into candidacy for clinical testing in humans and for therapeutic product development. At this point, the prospects for success begin to be affected by small patient populations and the relative lack of development interest from industry.
A few special programs aim to train individuals in the development of diagnostic or therapeutic products for rare diseases—for example, the SPARK program at the Stanford University School of Medicine (http://sparkmed.stanford.edu/). The program is institutionally funded (in part
by an NIH Clinical and Translational Science Award) and seeks to create opportunities for medical and graduate students to build and execute a product development plan for new chemical entities and other discoveries generated by Stanford faculty that are not far enough advanced to attract industry interest. The program provides faculty and industry-experienced mentors for competitively selected projects. One emphasis is product development targeted to rare and neglected diseases, including through the repurposing of old drugs or the reconsideration of abandoned ideas or projects. Several products have been licensed and are in clinical development, which suggests that the goals of this program—education, stimulation of applied research, and commercialization of intellectual property—are being achieved. This is one example of an innovation platform that could accelerate future orphan products development.
Among particular needs for clinical-translational investigators in rare diseases is training in trial designs that can be applied to studies of small populations of patients with rare diseases. These investigators will also have to recognize when they need consultants to give them more expert guidance. Clinical subspecialists who work with both children and adults with rare diseases should be trained to collect data that will lead to standardized and detailed phenotyping and the elucidation of clinical natural histories, two potentially important contributions to research progress related to rare diseases. Training in systems biology and bioinformatics will also be key for future investigators working in rare diseases areas because these disciplines hold the potential to rapidly advance knowledge and its application to rare diseases. Beyond scientific training, successful investigators must know how to build and sustain productive collaborations and must be comfortable communicating their work to interdisciplinary audiences.
Training of young investigators or retraining of experienced investigators to conduct research on specific rare diseases will depend on the existence of productive and funded programs in rare disorders-specific research that can serve as training sites for both basic and clinical research. Thus, adequate funding for rare diseases research is an important first step in establishing training environments. Funding from NIH, other federal agencies, and disease-specific advocacy groups serves the dual purpose of fostering research progress and exposing investigators-in-training or young investigators to the relevant research activities.
The federal government through NIH and other agencies provides training grants, which may focus on individuals or programs (an example of the latter is the T-32 grants from NIH). These grants target specialty fellows in relevant medical subspecialties and graduate students or postdoctoral graduate fellows. Some disease-specific foundations also support training and young investigator grants.
Targeted career development awards for young faculty are particularly important in promoting and sustaining interest in and activity related to rare diseases. Examples of such awards include the K series grants from NIH and young investigator grants from CFF (e.g., the Leroy Matthews and Harry Shwachman Awards). The Dana Foundation’s competitive grants programs in brain and immunoimaging and neuroimmunology primarily support new investigators with innovative clinical research hypotheses to develop pilot data on brain or spinal cord diseases, most of which are rare. Some of these new investigators have NIH K-08 (or K-23) mentored grants, which provide up to 75 percent of their salaries, and Dana funds support the remaining 25 percent. Both Dana and the NIH training grants support the new investigators’ salaries, and other research-related costs often are supported by the investigators’ institutions. The Burroughs Wellcome Fund offers a postdoctoral fellow-to-faculty transition grant for physician scientists, a model for the NIH K99-R00 awards. This approach is particularly effective at establishing early independence for fellows (Pion and Ionescu, 2003), and it could be employed more broadly for researchers in rare diseases areas.
The committee did not locate any compilation of resources for training related to rare diseases. Thus, it was difficult to judge the current amount of training or its content as a basis for identifying specific gaps. The emphasis here is therefore more generally on the need for training in basic and translational or clinical research areas that will be relevant to many rare diseases.
INNOVATION PLATFORMS FOR TARGET AND DRUG DISCOVERY
The high costs and low success rates associated with drug discovery and development, combined with the absence, in the case of rare diseases, of a large market for approved therapies, have stimulated the development of innovation platforms on a number of levels. One typical characteristic of these emerging approaches involves the sharing of the data, biological specimens, chemical compounds, and other resources that are needed at various stages to move from discovery to product approval and marketing.
Another characteristic is the involvement of funding organizations beyond their traditional roles of supporting research projects and training. Some patient-led foundations have taken on the task of “de-risking” the early stages of drug discovery through early-stage clinical trials, for example, by combining an infusion of philanthropic capital with the development of research tools and organized access to patients. For example, CFF has assembled drug discovery tools of potential interest to the scientific community working on the disease: an antibody distribution program,
primary human epithelial cells harvested from lung transplants, a purified CFTR (cystic fibrosis transmembrane conductance regulator) protein supply, and validated assay services. These efforts of CFF and others are summarized in Chapter 5. NIH has also created new internal capacities and new partnership mechanisms for facilitating drug discovery, which are described in this section.
Public-Private Partnerships and Other Coordinating Strategies
Public-private partnerships have been a standard approach when the needs of the public sector converge with goals of the private sector, prompting the joint provision and management of resources for targeted projects. Examples include the delivery of services or facilities in the energy, transportation, education, or urban development sectors. NIH defines a public-private partnership as an agreement for the agency “to work in concert with a nonfederal party or parties to advance mutual interests to improve health” (NIH, 2007, p. 2). Although gifts, clinical research contracts and other contracts, and technology transfer agreements involve relationships with a nonfederal party or parties, NIH does not consider these arrangements to be partnerships. Other groups may have more expansive interpretations of the concept.
The formation of public-private partnerships involving government, industry, and nonprofit organizations has been a successful model for the infrastructure gaps in the area of neglected tropical diseases, which share with rare diseases the lack of commercial incentives for product development. For example, the multilateral Special Programme for Research and Training in Tropical Diseases (Morel, 2000; Ridley, 2003) and, more recently, the Medicines for Malaria Venture (Ridley, 2002) combine government, philanthropic, and industry funding2 and enlist the expertise of an external scientific advisory board to select projects for support. These initiatives coordinate activities between industry and academic centers (e.g., sharing of compound libraries) to discover new molecules for the treatment of tropical diseases and shepherd them through the subsequent stages along the discovery-development pipeline, thereby acting as “virtual biotech” companies. Projects not meeting specified milestones are dropped and replaced with others, such that each organization manages a portfolio
of projects with varying degrees of risk (MMV, 2002, 2003; Nwaka and Ridley, 2003; TDR, 2008).
An example of a public-private partnership in the rare diseases area is the Spinal Muscular Atrophy project (http://www.smaproject.org/). Established by the National Institute of Neurological Diseases and Stroke, the pilot project is a multisite drug discovery and development enterprise that is guided by consultants with academic, FDA, NIH, and pharmaceutical industry expertise. The project focuses on optimizing lead compounds and making them available to researchers for preclinical testing.
NIH has initiated several broader programs to support drug discovery for rare diseases. The NIH Chemical Genomics Center (NCGC), which was established as part of the NIH Roadmap, focuses on novel targets as well as roughly a dozen rare and neglected diseases. As described on its website, it will “optimize biochemical, cellular and model organism-based assays submitted by the biomedical research community; perform automated high-throughput screening (HTS); and perform chemistry optimization on confirmed hits to produce chemical probes for dissemination to the research community” (http://www.ncgc.nih.gov/about/mission.html). The NCGC is also building a library of approved drugs so that these compounds can be more easily screened for possible repurposing for new indications; it has undertaken screening related to certain lysosomal storage diseases among other rare conditions (Austin, 2010).
The Therapeutics for Rare and Neglected Diseases (TRND) program, which was established in 2009, will collaborate with the NCGC as well as companies and nonprofit patient groups; it thus can be considered a public-private partnership (NIH, 2009b). The program aims to bring promising compounds to the point of clinical testing and adoption for further development by commercial interests. TRND, which had an initial budget of $24 million a year, is expected to ramp up to work on roughly five projects per year. Its first pilot projects involve sickle cell disease, chronic lymphocytic leukemia, Niemann-Pick Type C, hereditary inclusion body myopathy, and the parasitic diseases schistosomiasis and hookworm (Marcus, 2010b). (The NIH Rapid Access to Interventional Development program, which takes projects through preclinical development, is discussed in Chapter 5.)
TRND is a much-needed and innovative development. However, its scope (five projects per year) is well below the number of rare diseases that need therapies and have researchers positioned to take advantage of this capability. In addition, extension of services to include access to animal models of rare diseases could facilitate preclinical studies, a frequent barrier to therapeutic development. Expansion of both capacity and geographical distribution of TRND activities could advance therapeutics development for more rare diseases.
Sharing Biological Data on Disease Mechanisms
As discussed earlier in this chapter, arriving at a candidate drug requires extensive basic research into the disease mechanism, identification of potential targets for the drug, and generation of extensive molecular and genetic data. Typically, these mechanistic data are held by intrinsically competitive academic or industry labs that may have interests in protecting publication priorities or intellectual property or both. One consequence is that the data are not collected or stored in a way that ensures broad access to the information. This, in turn, has slowed the pace of information dissemination and driven up the cost of drug discovery.
In recent years, several developments have challenged this approach, particularly in the pharmaceutical industry. One development is the growing recognition that many research questions in human diseases are too complex for any one laboratory or any one company (Duncan, 2009). Another development is accumulating research that shows that many common diseases actually consist of subsets of disease based on their molecular characteristics, which often determine how individuals will respond to therapy. As a result, what might once have been a potentially large market of patients for a particular therapy is fragmented into a number of small markets. At the same time, companies have seen increasing costs of drug discovery and development without a corresponding increase in productivity of the industry, as measured by output of new molecular entities (Munos, 2009).
Taken together, these trends are stimulating innovation in the form of initiatives to share data “precompetitively” (see, e.g., Stoffels, 2009; Hunter and Stephens, 2010; Marcus, 2010a; but see also Munos, 2010). A recent workshop at the Institute of Medicine explored the opportunities and challenges of such collaborations, some of which involve only private entities (e.g., several companies or advocacy groups and companies) whereas others also involve the public sector (IOM, 2010b).
One model of precompetitive collaboration outside the health care arena is the development of the Linux operating system, which involved competitors sharing the benefits of increased productivity resulting from joint, voluntary investments in early-stage research. Given the increasing information richness of biology, similar integration of knowledge about biochemical pathways and networks from a wide range of researchers may spur productivity in the identification of molecular targets for diseases and otherwise advancing discovery research and product development. Existing examples of such efforts to share biological information or technology development resources include the following:
-
Enlight Biosciences, a private company created in partnership with major pharmaceutical companies to develop enabling technologies that
-
will alter the process of drug discovery and development (Zielinska, 2009); and
-
voluntary, open-source sharing of biological data through the Sage Commons, an initiative of Sage Bionetworks, a new, nonprofit medical research organization (http://sagebase.org).
The second example, Sage Bionetworks, uses data shared by pharmaceutical companies and others to develop computational models that predict potential drug targets as well as potential toxicities (Melese et al., 2009). The data shared with Sage will eventually be publicly available and could be particularly valuable for rare diseases research. For example, the organization has already provided a significant amount of clinical data to the Huntington disease research community. The data were generated in a clinical study of Alzheimer disease in which individuals with Huntington disease were used as controls. Without the Sage resource, these data would likely have remained unknown and unavailable to Huntington disease investigations (Marcus, 2010a).
Some rare diseases advocacy groups have made the sharing of research data by grant recipients a prerequisite for funding. For example, through its Accelerated Research Collaboration model, the Myelin Repair Foundation has insisted that those funded in its collaborations share their research findings with one another without awaiting scientific publication (MRF, 2010). To cite another example, in 2007 the Multiple Myeloma Research Consortium launched a Genomics Portal, through which researchers have unrestricted access to prepublication genomic and other molecular data (Kelley, 2009). This approach is not conventional in academic environments where researchers are rewarded for individual achievement, but by mandating data sharing, the consortium has succeeded in significantly expanding the therapies currently under development for multiple myeloma.
Sharing Compound Libraries
A related trend is the opening of what were once proprietary company libraries of chemical compounds to investigators interested in the potential of compounds to interact with drug targets across a wide range of diseases. Compounds and information on their structures have typically been generated and held tightly by pharmaceutical companies. In recent years, companies have begun sharing compound libraries with researchers working in neglected diseases areas. For example,
-
Eli Lilly Co. is sharing its compound libraries with researchers seeking therapies for tuberculosis (http://www.tbdrugdiscovery.org/);
-
Pfizer Inc. has signed an agreement with the Drugs for Neglected Diseases initiative to share its library of novel chemical entities so that investigators can screen it for potential treatments for human African trypanosomiasis, visceral leishmaniasis, and Chagas disease (DNDi, 2009); and
-
GlaxoSmithKline will share the chemical structures of compounds with potential activity against malaria through websites supported by federal, for-profit, and foundation funding (Guth, 2010).
In addition to the compound sharing initiative noted above, Eli Lilly has also established the Phenotypic Drug Discovery Initiative (https://pd2.lilly.com/pd2Web/). The company provides access to a phenotypic assay panel at no cost to external investigators, who can make a confidential compound submission and receive a full data report in return. Promising findings can lead to a collaboration agreement.
In the area of neglected diseases, access to compound libraries and chemical structures can significantly lower the threshold for pursuing drug discovery and development. Similarly, the European Rare Diseases Therapeutic Initiative has worked to bring about such access for academic institutions pursuing treatments for rare diseases (Fischer et al., 2005). To address intellectual property concerns, it has been proposed that compounds with commercial value might be accessed using a trusted intermediary, with initial confidentiality about the compound maintained and companies’ reserving the option of first refusal for development (Rai et al., 2008). The experience with these efforts might inform the development of institutional mechanisms to facilitate access to proprietary compound libraries.
RECOMMENDATIONS
Two critical issues for rare diseases research are the small number of patients available to participate in research on rare diseases and the limited sources of funding for discovery and development of potential therapies for these diseases. It is therefore particularly important to make the best use possible of the information and other products that research generates—whether the research is directed specifically at a rare condition or at a more common condition that potentially has relevance for a rare condition. Making the best use of information and resources has several dimensions that target problems created by current practices. These problems include
-
institutional and individual interests—economic, reputational, and professional—that can impede collaboration and resource sharing even as they may also stimulate innovation;
-
fragmented, proprietary patient registries that have developed in the absence of consistent standards for the creation of accurate, usable information;
-
fragmented, poorly preserved, and inaccessible biospecimen collections; and
-
other resources such as biological data and research findings that are not broadly accessible to researchers who may then have to collect that information anew.
The committee does not underestimate the diverse barriers to resource sharing and collaboration or the need for creativity and patience in dealing with them. Nonetheless, it believes that the initiatives cited above illustrate promising strategies for either overcoming or coexisting with these barriers.
As components of an integrated policy to accelerate rare diseases research, several steps can be taken to develop a system that will support the sharing of resources, for example, compound libraries, and discourage the creation of a duplicative infrastructure. In some instances, steps may include the required sharing of research resources, for example, tissue specimens and data generated by federally funded or foundation-funded research on rare diseases. What is envisioned is essentially a “research commons” and public-private partnership (or series of partnerships) that has several unlinked or loosely linked elements.
RECOMMENDATION 4-1: NIH should initiate a collaborative effort involving government, industry, academia, and voluntary organizations to develop a comprehensive system of shared resources for discovery research on rare diseases and to facilitate communication and cooperation for such research.
Creating such a system of shared resources for rare diseases research will require a significant developmental effort and commitment of public, commercial, and nonprofit funding and other resources, for example, assistance in creating mechanisms for coordination and oversight and model provisions for public access to the information developed with government and nonprofit grant support. Key elements of this system would include, among other possible features,
-
a repository of publicly available animal models for rare disorders that reflect the disease mechanisms and phenotypic diversity seen in humans;
-
a publicly accessible database that includes mechanistic biological data on rare diseases generated by investigators funded by NIH, private foundations, and industry;
-
common platforms for patient registries and biorepositories (see Chapter 5);
-
model arrangements and agreements (e.g., template language on intellectual property) for making relevant portions of compound libraries available to researchers in rare diseases areas; and
-
further exploration of precompetitive models and opportunities for developing technologies and tools for discovery research involving rare diseases.
Given the challenges outlined in this chapter and other parts of this report and given the important role that NIH plays in supporting research on rare diseases, the committee believes that a comprehensive NIH action plan on rare diseases would be useful to better integrate and expand existing work. This plan would take into account developments since the 2000 report of a special panel on coordinating rare diseases research programs within NIH (NIH, 2000). The following recommendation spans all phases of research on rare diseases and orphan products. Thus, it supports not only the discovery research discussed in this chapter but also the product development work and recommendations discussed in Chapter 5. It would likewise encompass research and development involving medical devices for people with rare diseases.
RECOMMENDATION 4-2: NIH should develop a comprehensive action plan for rare diseases research that covers all institutes and centers and that also defines and integrates goals and strategies across units. This plan should cover research program planning, grant review, training, and coordination of all phases of research on rare diseases.
The development of an action plan would, at various points, necessarily involve consultation with FDA, advocacy groups, and industry. It likewise would involve consultation with investigators and academic institutions engaged in rare diseases research and product development.
The aspects of the plan that involve training would include incentives to attract new and established academic investigators to the study of rare diseases and orphan products and also support investigators currently studying rare diseases. Such a plan could include a loan repayment program for investigators working on rare diseases, the creation of an award for highly innovative proposals for rare diseases, and the broader use of the K99-R00 (Pathway to Independence) awards to attract outstanding new investigators in rare diseases research. Training opportunities through the NIH intramural research programs could also be identified. In addition, the program could include a mechanism for identifying training opportunities (especially in computational science, small clinical trial design, and orphan
products development) that are particularly useful for investigators of rare diseases. Likewise, the program could support the identification, development, and replication of successful training models for investigators in rare diseases.
For all investigators, the creation of an award similar to the NIH Director’s Pioneer Awards could provide an incentive and a reward for innovation. It would also draw attention to the opportunities for rare diseases research. These awards are intended to support investigators of outstanding creativity who propose truly innovative and even transforming biomedical research.
With respect to the review of proposals for research on rare diseases, the NIH action plan would include the development of guidance for study sections and institute councils. This guidance would, for example, clarify the potential public health relevance of rare diseases research, the range of appropriate methods for studying rare diseases, and the use of alternative mechanisms to ensure expert review of grant applications on rare diseases. Such mechanisms could include appointing special experts on rare diseases as primary reviewers to existing study sections, including rare diseases experts in the Center for Scientific Review, or creating a study section dedicated to rare diseases grants. More generally, NIH could investigate means of accelerating its decisions about preclinical (and clinical) awards for research on rare diseases.
Further, as discussed in Chapter 3, NIH and FDA should continue to cooperate in developing training and guidance to improve the quality of NIH-funded rare diseases and orphan products research and increase the likelihood that the research—including preclinical studies—will provide acceptable evidence for FDA review of marketing applications for drugs and biologics. For example, one element of the action plan could be a focused Request for Applications for natural history studies of rare diseases to help identify therapeutic targets for rare diseases or build the evidence base to support FDA approval of a specific drug being studied with NIH support. The lack of natural history studies has been identified as a problem in Chapter 3. Such studies are one focus of the Rare Diseases Clinical Research Network, but this network (as described in Chapter 5 and Appendix E) supports only 19 consortia that study approximately 165 rare conditions. NIH also funds a number of studies outside the network, but the natural history of many more rare diseases remains to be studied.
Another element of the action plan would be the development of a systematic, reliable, and comprehensive system for identifying and tracking public and private funding for rare diseases studies to help highlight gaps and opportunities for public and private research sponsors. As more private foundations and research initiatives are created, the lack of integrated information on funding will become a more serious problem and
will interfere with the ability of these groups to target their resources and collaborate effectively.
The following chapter shifts the focus from basic research to the preclinical and clinical development investigations that are required to establish safety and efficacy and otherwise meet regulatory standards for approval of pharmaceuticals and biologics. It concludes with additional recommendations for resource sharing and collaboration.


