
4
Transforming Education
|
Key Message #2: Nurses should achieve higher levels of education and training through an improved education system that promotes seamless academic progression. Major changes in the U.S. health care system and practice environments will require equally profound changes in the education of nurses both before and after they receive their licenses. Nursing education at all levels needs to provide a better understanding of and experience in care management, quality improvement methods, systems-level change management, and the reconceptualized roles of nurses in a reformed health care system. Nursing education should serve as a platform for continued lifelong learning and include opportunities for seamless transition to higher degree programs. Accrediting, licensing, and certifying organizations need to mandate demonstrated mastery of core skills and competencies to complement the completion of degree programs and written board examinations. To respond to the underrepresentation of racial and ethnic minority groups and men in the nursing workforce, the nursing student body must become more diverse. Finally, nurses should be educated with physicians and other health professionals as students and throughout their careers. |
Major changes in the U.S. health care system and practice environments will require equally profound changes in the education of nurses both before and after they receive their licenses. In Chapter 1, the committee set forth a vision of health care that depends on a transformation of the roles and responsibilities of nurses. This chapter outlines the fundamental transformation of nurse education that must occur if this vision is to be realized.
The primary goals of nursing education remain the same: nurses must be prepared to meet diverse patients’ needs; function as leaders; and advance science that benefits patients and the capacity of health professionals to deliver safe, quality patient care. At the same time, nursing education needs to be transformed in a number of ways to prepare nursing graduates to work collaboratively and effectively with other health professionals in a complex and evolving health care system in a variety of settings (see Chapter 3). Entry-level nurses, for example, need to be able to transition smoothly from their academic preparation to a range of practice environments, with an increased emphasis on community and public health settings. And advanced practice registered nurses (APRNs) need graduate programs that can prepare them to assume their roles in primary care, acute care, long-term care, and other settings, as well as specialty practices.
This chapter addresses key message #2 set forth in Chapter 1: Nurses should achieve higher levels of education and training through an improved education system that promotes seamless academic progression. The chapter begins by focusing on nurses’ undergraduate education, emphasizing the need for a greater number of nurses to enter the workforce with a baccalaureate degree or to progress to this degree early in their career. This section also outlines some of the challenges to meeting undergraduate educational needs. The chapter then turns to graduate nursing education, stressing the need to increase significantly the numbers and preparation of nurse faculty and researchers at the doctoral level. The third section explores the need to establish, maintain, and expand new competencies throughout a nurse’s education and career. The chapter next addresses the challenge of underrepresentation of racial and ethnic minority groups and men in the nursing profession and argues that meeting this challenge will require increasing the diversity of the nursing student body. The fifth section describes some creative solutions that have been devised for addressing concerns about educational capacity and the need to transform nursing curricula. The final section presents the committee’s conclusions regarding the improvements needed to transform nursing education.
The committee could have devoted this entire report to the topic of nursing education—the subject is rich and widely debated. However, the committee’s statement of task required that it examine a range of issues in the field, rather than delving deeply into the many challenges involved in and solutions required to advance the nursing education system. Several comprehensive reports and analyses addressing nursing education have recently been published. They include a 2009 report from the Carnegie Foundation that calls for a “radical transforma-
tion” of nursing education (Benner et al., 2009); a 2010 report from a conference sponsored by the Macy Foundation that charts a course for “life-long learning” that is assessed by the “demonstration of competency [as opposed to written assessment] in both academic programs and in continuing education” (AACN and AAMC, 2010); two consensus reports from the Institute of Medicine (IOM) that call for greater interprofessional education of physicians, nurses, and other health professionals, as well as new methods of improving and demonstrating competency throughout one’s career (IOM, 2003b, 2009); and other articles and reports on necessary curriculum changes, faculty development, and new partnerships in education (Erickson, 2002; Lasater and Nielsen, 2009; Mitchell et al., 2006; Orsolini-Hain and Waters, 2009; Tanner et al., 2008). Additionally, in February 2009, the committee hosted a forum on the future of nursing in Houston, Texas, that focused on nursing education. Discussion during that forum informed the committee’s deliberations and this chapter; a summary of that forum is included on the CD-ROM in the back of this report.1 Finally, Appendix A highlights other recent reports relevant to the nursing profession. The committee refers readers wishing to explore the subject of nursing education in greater depth to these publications.
UNDERGRADUATE EDUCATION
This section begins with an overview of current undergraduate nursing education, including educational pathways, the distribution of undergraduate degrees, the licensing exam, and costs (see Appendix E for additional background information on undergraduate education). The discussion then focuses on the need for more nurses prepared at the baccalaureate level. Finally, barriers to meeting undergraduate educational needs are reviewed.
Overview of Current Undergraduate Education
Educational Pathways
Nursing is unique among the health care professions in the United States in that it has multiple educational pathways leading to an entry-level license to practice (see the annexes to Chapter 1 and Appendix E). For the past four decades, nursing students have been able to pursue three different educational pathways to become registered nurses (RNs): the bachelor’s of science in nursing (BSN), the associate’s degree in nursing (ADN), and the diploma in nursing. More recently, an accelerated, second-degree bachelor’s program for students who possess a baccalaureate degree in another field has become a popular option. This multiplicity of options has fragmented the nursing community and has created
|
1 |
The summary also can be downloaded at http://www.iom.edu. |
confusion among the public and other health professionals about the expectations for these educational options. However, these pathways also provide numerous opportunities for women and men of modest means and diverse backgrounds to access careers in an economically stable field.
In addition to the BSN, ADN, or diploma received by RNs, another undergraduate-level program available is the licensed practical/vocational diploma in nursing. Licensed practical/vocational nurses (LPNs/LVNs) are especially important because of their contributions to care in long-term care facilities and nursing homes.2 LPNs/LVNs receive a diploma after completion of a 12-month program. They are not educated or licensed for independent decision making for complex care, but obtain basic training in anatomy and physiology, nutrition, and nursing techniques. Some LPNs/LVNs continue their education to become RNs; in fact, approximately 17.9 percent of RNs were once licensed as LPNs/LVNs (HRSA, 2010b). While most LPNs/LVNs have an interest in advancing their education, a number of barriers to their doing so have been cited, including financial concerns, lack of capacity and difficulty getting into ADN and BSN programs, and family commitments (HRSA, 2004). Although this chapter focuses primarily on the education of RNs and APRNs, the committee recognizes the contributions of LPNs/LVNs in improving the quality of health care. The committee also recognizes the opportunity the LPN/LVN diploma creates as a possible pathway toward further education along the RN and APRN tracks for the diverse individuals who hold that diploma.
Distribution of Undergraduate Degrees
At present, the most common way to become an RN is to pursue an ADN at a community college. Associate’s degree programs in nursing were launched in the mid-20th century in response to the nursing shortage that followed World War II (Lynaugh, 2008; Lynaugh and Brush, 1996). The next most common undergraduate nursing degree is the BSN, a 4-year degree typically offered at a university. Baccalaureate nursing programs emphasize liberal arts, advanced sciences, and nursing coursework across a wider range of settings than are addressed by ADN programs, along with formal coursework that emphasizes both the acquisition of leadership development and the exposure to community and public health competencies. The least common route to becoming an RN currently is the diploma program, which is offered at a hospital-based school and generally lasts 3 years. During the 20th century, as nursing gained a stronger theoretical foundation and other types of nursing programs increased in number, the number of diploma programs declined remarkably except in a few states, such as New Jersey, Ohio,
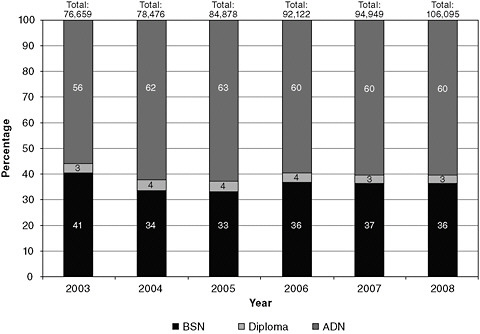
FIGURE 4-1 Trends in graduation from basic RN programs, by type, 2002–2008.
SOURCE: NLN, 2010b.
and Pennsylvania. Figure 4-1 gives an overview of trends in the distribution of nursing graduates by initial nursing degree.
Entry into Practice: The Licensing Exam3
Regardless of which educational pathway nursing students pursue, those working toward an RN must ultimately pass the National Council Licensure Examination for Registered Nurses (NCLEX-RN), which is administered by the National Council of State Boards of Nursing (NCSBN), before they are granted a license to practice. Rates of success on the NCLEX-RN are often used for rating schools or for marketing to potential students. As with many entry-level licensing exams, however, the NCLEX-RN uses multiple-choice, computer-based methods to test the minimum competency required to practice nursing safely. The exam is administered on a pass/fail basis and, although rigorous, is not meant to be a test of optimal performance. Following passage of the exam, individual state boards of nursing grant nurses their license to practice.
The content of the NCLEX-RN is based on surveys of what new nurses need to know to begin their practice. As with most entry-level licensing exams, the
content of the NCLEX-RN directly influences the curricula used to educate nursing students. Currently, the exam is skewed toward acute care settings because this is where the majority of nurses are first employed and where most work throughout their careers. To keep pace with the changing demands of the health care system and patient populations, including the shift toward increasing care in community settings (see Chapter 2), the focus of the exam will need to shift as well. Greater emphasis must be placed on competencies related to community health, public health, primary care, geriatrics, disease prevention, health promotion, and other topics beyond the provision of nursing care in acute care settings to ensure that nurses are ready to practice in an evolving health care system.
Costs of Nursing Education
Although a limited number of educational grants and scholarships are available, most of individuals seeking nursing education must finance their own education at any level of preparation. Costs vary based on the pathway selected for basic preparation and through to doctoral preparation. The LPN degree is the least expensive to attain, followed by the ADN, BSN (accelerated program), BSN, master’s of science in nursing (MSN), and PhD/doctor of nursing practice (DNP) degrees. It is no surprise that educational costs and living expenses play a major role in determining which degree is pursued and the numbers of nurses who seek advanced degrees.
To better understand the costs of nursing education, the committee asked the Robert Wood Johnson Foundation (RWJF) Nursing Research Network to estimate the various costs associated with pursuing nursing education, specifically at the advanced practice level, in comparison with those for a medical doctor (MD) or doctor of osteopathy (DO). The RWJF Nursing Research Network produced several comparison charts in an attempt to convey accurately the differences in costs between alternative nursing degrees and the MD or DO degree. This task required making assumptions about public versus private and proprietary/for-profit education options, prerequisites for entry, and years required to complete each degree. An area of particular difficulty arose in assessing costs associated with obtaining an ADN degree. In most non–health care disciplines, the associates degree takes 2 years to complete. In nursing, however, surveys have found that it takes students 3 to 4 years to complete an ADN program because of the need to fulfill prerequisites necessary to prepare students for entry into degree programs and the lack of adequate faculty, which lead to long waiting lists for many programs and classes (Orsolini-Hain, 2008). Box 4-1 illustrates the challenges of this task by outlining the difficulty of comparing the cost of becoming a physician with the cost of becoming an APRN. The task of comparing the increasing “sticker costs” of nursing and medical education was complicated further because much of the data needed to compute those costs is either missing or drawn from incomparable years. In the end, the committee decided not to include detailed discussion of the costs of nursing education in this report.
|
BOX 4-1 Costs of Health Professional Education Depending on the method used, the number of advanced practice registered nurses (APRNs) that can be trained for the cost of training 1 physician is between 3 and 14. Assessing the costs of education is a multidimensional problem. Manno (1998) has suggested that costs for higher education can be measured in at least four ways:
While the first of these measures, the production cost to the institution, is the most complete, it is the most complex to derive. One study attempted to compare the educational cost for various health professions. This study, sponsored by the Association of Academic Health Centers (Gonyea, 1998), used the 1994 methodology of Valberg and colleagues, which included 80 percent essential education and 20 percent complementary research and service (Valberg et al., 1994). The conclusion reached was that for every 1 physician (4 years), 14 advanced nurse practitioners or 12 physician assistants could be produced (Starck, 2005). If one examines simply the cost to students of postsecondary training (the “sticker price”), the differences among professions are slightly less dramatic. The cost to students is defined as the tuition and fees students/families pay. This measure does not include costs associated with room and board, books, transportation, and other living expenses. Nor does it include those costs incurred by the educational programs that may be beyond what is covered by tuition revenues. Residency programs for physicians are not included in this estimate because students do not pay them. Medical residencies are funded largely by Medicare, and in 2008, totaled approximately $9 billion per year ($100,000 on average for each of about 90,000 residents) for graduate medical education (MedPAC, 2009). Some of the Medicare expenditures are for indirect costs, such as the greater costs associated with operating a teaching hospital. Estimates of the average cost per resident for the federal government are difficult to establish because of the wide variation in payments by specialty and type of hospital. In addition, residency costs vary significantly by year, with the early years requiring more supervision than the later years. |
Why More BSN-Prepared Nurses Are Needed
The qualifications and level of education required for entry into the nursing profession have been widely debated by nurses, nursing organizations, academics, and a host of other stakeholders for more than 40 years (NLN, 2007). The causal relationship between the academic degree obtained by RNs and patient outcomes is not conclusive in the research literature. However, several studies
support a significant association between the educational level of RNs and outcomes for patients in the acute care setting, including mortality rates (Aiken et al., 2003; Estabrooks et al., 2005; Friese et al., 2008; Tourangeau et al., 2007; Van den Heede et al., 2009). Other studies argue that clinical experience, qualifications before entering a nursing program (e.g., SAT scores), and the number of BSN-prepared RNs that received an earlier degree confound the value added through the 4-year educational program. One study found that the level of experience of nurses was more important than their education level in mitigating medication errors in hospitals (Blegen et al., 2001). Another study performed within the Department of Veterans Affairs (VA) system found no significant association between the proportion of RNs with a baccalaureate degree and patient outcomes at the hospital level (Sales et al., 2008).
This debate aside, an all-BSN workforce at the entry level would provide a more uniform foundation for the reconceptualized roles for nurses and new models of care that are envisioned in Chapters 1 and 2. Although a BSN education is not a panacea for all that is expected of nurses in the future, it does, relative to other educational pathways, introduce students to a wider range of competencies in such arenas as health policy and health care financing, leadership, quality improvement, and systems thinking. One study found that new BSN graduates reported significantly higher levels of preparation in evidence-based practice, research skills, and assessment of gaps in areas such as teamwork, collaboration, and practice (Kovner et al., 2010)—other important competencies for a future nursing workforce. Moreover, as more nurses are being called on to lead care coordination efforts, they should have the competencies requisite for this task, many of which are included in the American Association of Colleges of Nursing’s (AACN’s) Essentials of Baccalaureate Education for Professional Nursing Practice.4
Care within the hospital setting continues to grow more complex, and nurses must make critical decisions associated with care for sicker, frailer patients. Care in this setting depends on sophisticated, life-saving technology coupled with complex information management systems that require skills in analysis and synthesis. Care outside the hospital is becoming more complex as well. Nurses are being called upon to coordinate care among a variety of clinicians and community agencies; to help patients manage chronic illnesses, thereby preventing acute care episodes and disease progression; and to use a variety of technological tools to improve the quality and effectiveness of care. A more educated nursing workforce would be better equipped to meet these demands.
An all-BSN workforce would also be poised to achieve higher levels of education at the master’s and doctoral levels, required for nurses to serve as primary care providers, nurse researchers, and nurse faculty—positions currently in great demand as discussed later in this chapter. Shortages of nurses in these positions continue to be a barrier to advancing the profession and improving the delivery of care to patients.
Some health care organizations in the United States are already leading the way by requiring more BSN-prepared nurses for entry-level positions. A growing number of hospitals, particularly teaching and children’s hospitals and those that have been recognized by the American Nurses Credentialing Center Magnet Recognition Program (see Chapter 5), favor the BSN for employment (Aiken, 2010). Depending on the type of hospital, the goal for the proportion of BSN-prepared nurses varies; for example, teaching hospitals aim for 90 percent, whereas community hospitals seek at least 50 percent (Goode et al., 2001). Absent a nursing shortage, then, nurses holding a baccalaureate degree are usually the preferred new-graduate hires in acute care settings (Cronenwett, 2010). Likewise, in a recent survey of 100 physician members of Sermo.com (see Chapter 3 for more information on this online community), conducted by the RWJF Nursing Research Network, 76 percent of physicians strongly or somewhat agreed that nurses with a BSN are more competent than those with an ADN. Seventy percent of the physicians surveyed also either strongly or somewhat agreed that all nurses who provide care in a hospital should hold a BSN, although when asked about the characteristics they most value in nurses they work with, the physicians placed a significantly higher value on compassion, efficiency, and experience than on years of nursing education and caliber of nursing school (RWJF, 2010c).
In community and public health settings, the BSN has long been the preferred minimum requirement for nurses, given the competencies, knowledge of community-based interventions, and skills that are needed in these settings (ACHNE, 2009; ASTDN, 2003). The U.S. military and the VA also are taking steps to ensure that the nurses making up their respective workforces are more highly educated. The U.S. Army, Navy, and Air Force require all active duty RNs to have a baccalaureate degree to practice, and the U.S. Public Health Service has the same requirement for its Commissioned Officers. Additionally, as the largest employer of RNs in the country, the VA has established a requirement that nurses must have a BSN to be considered for promotion beyond entry level (AACN, 2010c). As Table 4-1 shows, however, the average earnings of BSN-prepared nurses are not substantially higher than those of ADN- or diploma-prepared nurses.
Decades of “blue ribbon panels” and reports to Congress on the health care workforce have found that there is a significant shortage of nurses with baccalaureate and higher degrees to respond to the nation’s health needs (Aiken, 2010). Almost 15 years ago, the National Advisory Council on Nurse Education and Practice, which advises Congress and the secretary of Health and Human Services on areas relevant to nursing, called for the development of policy actions that would ensure a minimum of 66 percent of RNs who work as nurses would have a BSN or higher degree by 2010 (Aiken et al., 2009). The result of policy efforts of the past decade has been a workforce in which approximately 50 percent of RNs hold a BSN degree or higher, a figure that includes ADN- and diploma-educated RNs who have gone on to obtain a BSN (HRSA, 2010b). Of significant note, the Tri-Council for Nursing, which consists of the American Nurses Association, American Organization of Nurse Executives, National
TABLE 4-1 Average Earnings of Full-Time RNs, by Highest Nursing or Nursing-Related Education and Job Title
League for Nursing (NLN), and AACN, recently released a consensus policy statement calling for a more highly educated nursing workforce, citing the need to increase the number of BSN-prepared nurses to deliver safer and more effective care (AACN, 2010a).
In sum, an increase in the percentage of nurses with a BSN is imperative as the scope of what the public needs from nurses grows, expectations surrounding quality heighten, and the settings where nurses are needed proliferate and become more complex. The formal education associated with obtaining the BSN is desirable for a variety of reasons, including ensuring that the next generation of nurses will master more than basic knowledge of patient care, providing a stronger foundation for the expansion of nursing science, and imparting the tools nurses need to be effective change agents and to adapt to evolving models of care. As discussed later in this chapter, the committee’s recommendation for a more highly educated nursing workforce must be paired with overall improvements to the education system and must include competencies in such areas as leadership, basic health policy, evidence-based care, quality improvement, and systems thinking. Moreover, even as the breadth and depth of content increase within prelicensure curricula, the caring essence and human connectedness nurses bring to patient care must be preserved. Nurses need to continue to provide holistic, patient-centered care that goes beyond physical health needs to recognize and respond to the social, mental, and spiritual needs of patients and their families. Other fundamental elements of nursing education, such as ethics and integrity, need to remain intact as well.
The Goal and a Plan for Achieving It
In the committee’s view, increasing the percentage of the current nursing workforce holding a BSN from 50 to 100 percent in the near term is neither practical
nor achievable. Setting a goal of increasing the percentage to 80 percent by 2020 is, however, bold, achievable, and necessary to move the nursing workforce to an expanded set of competencies, especially in the domains of community and public health, leadership, systems improvement and change, research, and health policy.
The committee believes achieving the goal of 80 percent of the nursing workforce having a BSN is possible in part because much of the educational capacity needed to meet this goal exists. RNs with an ADN or diploma degree have a number of options for completing the BSN, as presented below. The combination of these options and others yet to be developed will be needed to meet the 80 percent goal—no one strategy will provide a universal solution. Technologies, such as the use of simulation and distance learning through online courses, will have to play a key role as well. Above all, what is needed to achieve this goal is the will of nurses to return to higher education, support from nursing employers and others to help fund nursing education, the elevation of educational standards, an education system that recognizes the experience and previous learning of returning students, and regional collaboratives of schools of nursing and employers to share financial and human resources.
While there are challenges associated with shortages of nurse faculty and clinical education sites (discussed below), these challenges are less problematic for licensed RNs pursuing a BSN than for prelicensure students, who require more intense oversight and monitoring by faculty. Additionally, most of what ADN-prepared nurses need to move on to a baccalaureate degree can be taught in a classroom or online, with additional tailored clinical experience. Online education creates flexibility and provides an additional skill set to students who will use technology into the future to retrieve and manage information.
Over the course of its deliberations and during the forum on education held in Houston, the committee learned about several pathways that are available to achieve the goal of 80 percent of the nursing workforce having a BSN (additional innovations discussed at the forum on education can be found in the forum summary on the CD-ROM in the back of this report). For RNs returning to obtain their BSN, a number of options are possible, including traditional RN-to-BSN programs. Many hospitals also have joint arrangements with local universities and colleges to offer onsite classes. Hospitals generally provide stipends to employees as an incentive to continue their education. Online education programs make courses available to all students regardless of where they live. For prospective nursing students, there are traditional 4-year BSN programs at a university, but there are also community colleges now offering 4-year baccalaureate degrees in some states (see the next section). Educational collaboratives between universities and community colleges, such as the Oregon Consortium for Nursing Education (described in Box 4-2), allow for automatic and seamless transition from an ADN to a BSN program, with all schools sharing curriculum, simulation facilities, and faculty. As described below, this type of model is goes beyond the conventional articulation agreement between community colleges and universities. Beyond traditional nursing schools, new providers of nursing education are entering the
|
BOX 4-2 Case Study: The Oregon Consortium for Nursing Education (OCNE) Sharing Resources to Prepare the Next Generation of Nurses In 2006, when Basilia Basin, BSN, RN, entered nursing school at Mount Hood Community College in Gresham, Oregon, near Portland, she was not sure whether she would pursue a bachelor’s degree. A paycheck was important, she thought, and if she could obtain an associate’s degree and a license after 3 years of schooling, why stay on for a fourth year to get her bachelor’s? She took her time answering the question, but in the end she went for “the opportunity for professional development,” she said. Ms. Basin was in the first class of nursing students affiliated with the Oregon Consortium for Nursing Education (OCNE; www.ocne.org), a partnership, formed in 2003, between the five geographically dispersed campuses of Oregon Health & Science University (OHSU) and eight community colleges across Oregon. The 13 campuses share a standard, competency-based curriculum that was developed by faculty at fullpartner community colleges and the university. The model makes the best
use of scarce resources by pooling faculty, classrooms, and clinical education resources in a state with urban, rural, and frontier settings (Gubrud-Howe et al., 2003; Tanner et al., 2008). Community college nursing students can obtain their associate’s degree in 3 years and continue for another year at OHSU to receive their baccalaureate without leaving their rural communities. This is facilitated through a seamless co-enrollment process across types of schools and financial aid transfers from the community college to the |
market, such as proprietary/for-profit schools. These programs are offering new models and alternatives for delivering curriculum and reaching RNs and prospective students, although each of these schools should be evaluated for its ability to meet nursing accreditation standards, including the provision of clinical experiences required to advance the profession.
Two other important programs designed to facilitate academic progression to higher levels of education are the LPN-to-BSN and ADN-to-MSN programs.
|
university. The overarching goal is twofold: to broaden and strengthen the professional competency of new nurses like Ms. Basin and to use scarce resources wisely to address the nursing shortage. Ms. Basin took her nursing licensure examination after she attained her associate’s degree, remaining dually enrolled at Mount Hood and OHSU. “It was quite a unique experience,” she said, “working as a nurse and being in school to become a nurse.” That experience is one that Christine A. Tanner, PhD, RN, FAAN, would like to make less unique for nursing students in her state. “We created a system that makes the best use of faculty resources, clinical training sites, and the strengths of the community college systems and the university,” said Dr. Tanner, A. B. Youmans-Spaulding distinguished professor at OHSU’s nursing school. Using resources more efficiently was not her sole aim, however. The nation needs “a new kind of nurse,” she said, one competent in the skills needed for care in the 21st century. But only 21 percent of nurses receiving an associate’s degree nationwide go on to obtain a bachelor’s degree (HRSA, 2006), leaving the nation with an insufficient supply of nurses who can become faculty, advanced practice registered nurses, or clinicians prepared for a future health care system that emphasizes community-based care. Dr. Tanner knew that nursing schools needed a new kind of curriculum. She and her OHSU colleagues met with representatives of the community colleges and agreed to craft a single nursing curriculum that would span all 13 campuses. The first course in the program, after prerequisites, is health promotion. It introduces students to clinical decision making and nursing leadership—“learning to think like a nurse,” as Dr. Tanner put it—as they relate to prevention and wellness. Students then move on to courses in chronic illness management and acute care. Those who remain enrolled for the bachelor’s take courses in population-based care, epidemiology, leadership, and outcome management. Although the number of nursing students per faculty member in Oregon nearly doubled between 2001 and 2008 (Oregon Center for Nursing, 2009), 95 to 100 percent of graduates of OCNE schools pass the nursing licensure exam (the national average is 88 percent [NCSBN, 2009]). Of students in the OCNE system who attain an associate’s degree, 45 percent receive a bachelor’s degree. One important result is that nurses with a baccalaureate are becoming more widely distributed in rural areas. Dr. Tanner is working on edu |
The ADN-to-MSN program, in particular, is establishing a significant pathway to advanced practice and faculty positions, especially at the community college level. Financial support to help build capacity for these programs will be important, including funding for grants and scholarships for nurses wishing to pursue these pathways. By the same token, the committee believes that diploma programs should be phased out over the next 10 years and should consolidate their resources with those of community college or preferably university programs

offering the baccalaureate degree. Additionally, there are federal resources currently being used to support diploma schools that could better be used to expand baccalaureate and higher education programs.
The committee anticipates that it will take a few years to build the educational capacity needed to achieve the goal of 80 percent of the nursing workforce being BSN-prepared by 2020, but also emphasizes that existing BSN completion programs have capacity that is far from exhausted. Regional networks of schools
working together, along with health care organizations, may best facilitate reaching this goal. Moreover, the committee believes this clearly defined goal will stimulate stakeholders to take action. Examples of such action include academic and health care organizations/employers partnering to achieve strategic alignment around workforce development; government and foundations introducing funding opportunities for scholarships to build faculty and provide tuition relief; state boards of nursing increasing the use of earmarks on licensure fees to offset the cost of education; and states developing statewide policy agendas and political action plans with identified leaders in nursing, government, and business to adopt measures to meet the goal.
The Role of Community Colleges
Community colleges play a key role in attracting students to the nursing education pipeline. Specifically, they provide an opportunity for students who may not have access to traditional university baccalaureate programs because of those programs’ lack of enrollment capacity, distance, or cost.
Community colleges have an important role to play in ensuring that more BSN-prepared nurses are available in all regions of the United States and that nursing education at the associate level is high quality and affordable and prepares ADN nurses to move on to higher levels of education. Currently, ADN- and BSN-prepared nurses are not evenly distributed nationwide. BSN-prepared RNs are found more commonly in urban areas, while many rural and other medically underserved communities depend heavily on nurses with associate’s degrees to staff their hospitals, clinics, and long-term care facilities (Cronenwett, 2010). Figure 4-2 shows the highest nursing or nursing-related education by urban/rural residence. According to a study by the Urban Institute, “medical personnel, including nurses, tend to work near where they were trained” (Bovjberg, 2009; see Figure 4-3). This suggests that state and community investments in nursing education (e.g., building nursing school capacity, building infrastructure to support that capacity, funding the purchase of technology, and offering scholarships) may be an effective way to reduce local and regional shortages. Community colleges are the predominant educational institutions in rural and medically underserved areas. Therefore, they must either join educational collaboratives or develop innovative and easily accessible programs that seamlessly connect students to schools offering the BSN and higher degrees, or they must develop their own BSN programs (if feasible within state laws and regulations). Community colleges must foster a culture that promotes and values academic progression and should encourage their students to continue their education through strategies that include making them aware of the full range of educational pathways and opportunities available to them (e.g., ADN-to-MSN and online RN-to-BSN programs). Box 4-3 describes a community college in Florida where nursing students can take advantage of lower costs and online classes to receive a BSN degree.
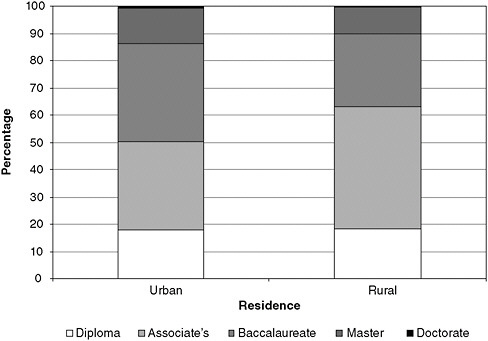
FIGURE 4-2 Highest nursing or nursing-related education by urban/rural residence.
SOURCE: Calculations performed using the data and documentation for the 2004 National Sample of Registered Nurses, available from the Health Resources and Services Administration’s Geospatial Data Warehouse (HRSA, 2010a).
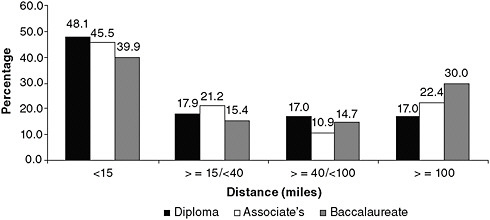
FIGURE 4-3 Distance between nursing education program and workplace for early-career nurses (graduated 2007–2008)
SOURCE: RWJF, 2010a. Reprinted with permission from Lori Melichar, RWJF.
Barriers to Meeting Undergraduate Educational Needs
Although the committee believes the capacity needed to ensure a nursing workforce that is 80 percent BSN-prepared by 2020 can be attained using the approaches outlined above, getting there will not be easy. Nursing schools across the United States collectively turn away tens of thousands of qualified applicants each year because of a lack of capacity (Kovner and Djukic, 2009)—a situation that makes filling projected needs for more and different types of nurses difficult. Figure 4-4 shows the breakdown of numbers of qualified applicants who are turned away from ADN and BSN programs.
An examination of the root causes of the education system’s insufficient capacity to meet undergraduate educational needs reveals four major barriers: (1) the aging and shortage of nursing faculty; (2) insufficient clinical placement opportunities of the right kind or duration for prelicensure nurses to learn their profession; (3) nursing education curricula that fail to impart relevant competencies needed to meet the future needs of patients and to prepare nurses adequately for academic progression to higher degrees; and (4) inadequate workforce planning, which stems from a lack of the communications, data sources, and information systems needed to align educational capacity with market demands. This final root cause—inadequate workforce planning—affects all levels of nursing education and is the subject of Chapter 6.
Aging and Shortage of Nursing Faculty
There are not enough nursing faculty to teach the current number of nursing students, let alone the number of qualified applicants who wish to pursue nursing. The same forces that are leading to deficits in the numbers and competencies of bedside nurses affect the capacity of nursing faculty as well (Allan and Aldebron, 2008). According to a survey by the NLN, 84 percent of U.S. nursing schools tried to hire new faculty in the 2007–2008 academic year; of those, four out of five found it “difficult”5 to recruit faculty, and one out of three found it “very difficult.” The principal difficulties included “not enough qualified candidates” (cited by 46 percent) and the inability to offer competitive salaries (cited by 38 percent). The survey concluded that “post-licensure programs were much more likely to cite a shortage of faculty, whereas pre-licensure programs reported that lack of clinical placement settings were [sic] the biggest impediment to admitting more students. Specifically, almost two thirds (64 percent) of doctoral programs and one half of RN-BSN and master’s programs identified an insufficient faculty pool to draw from as the major constraint to expansion, in contrast to one third of prelicensure programs” (NLN, 2010a).
|
Some critics argue that in granting baccalaureates, community colleges are reaching beyond the bounds of their original mission of granting 2-year degrees as a stepping stone to a university education. Other opponents say that community college enrollments—and funds—are already stretched to the limit. In Michigan, for instance, critics say that community college tuition for the BSN will have to rise to avoid the need for more state funding (Lane, 2009). Still, many nurses are praising the quality, convenience, flexibility, and affordability of the BSN programs available at community colleges. Jean Wortock, PhD, MSN, ARNP, dean and professor of nursing at Saint Petersburg College, said her school’s BSN program is opening up an important channel for Florida nurses to advance their education in a state where 46 percent of qualified applicants to BSN programs were turned away in 2009 because of faculty shortages and other factors (Florida Center for Nursing, 2010). “We strongly encourage all of our baccalaureate graduates to go on for master’s degrees,” she said. “And a number of ours have.” Dr. Wortock said that St. Petersburg College and USF have worked closely in the past 9 years to determine the degrees each institution would offer: “We’re offering some that they prefer not to offer so that they can focus more on master’s programs in a particular field.” St. Petersburg College now offers 22 bachelor’s degrees, and even though both institutions have RN-to-BSN programs, the St. Petersburg nursing school has had high enough enrollments to allow the hiring of eight full-time faculty members with doctorates to teach in its BSN program. Dr. Wortock has talked to nurses at community colleges in California, Washington, and Michigan about how her school took the lead in offering the BSN in Florida. And while she acknowledged that the movement is controversial, it is a movement nonetheless. “It will give us a cadre of graduates and nurses that are much more prepared for research and evidence-based practice,” she said.  Nursing instructor Tamela Monroe, herself a former BSN student at St. Petersburg college, teaches nursing students in a virtual classroom. |
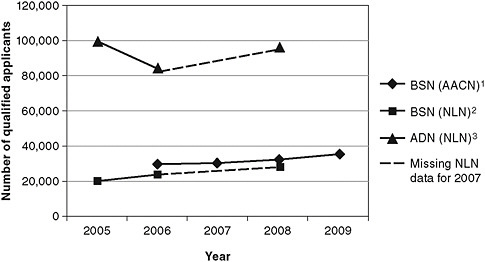
FIGURE 4-4 Numbers of qualified applicants not accepted in ADN and BSN programs.
NOTES:
1 Number of qualified applicants not accepted in baccalaureate generic RN programs, based on AACN data in Enrollment and Graduations in Baccalaureate and Graduate Programs in Nursing (2006-07, Table 37; 2007-08, Table 39; 2008-09, Table 38; 2009-2010, Table 39).
2 Number of qualified applicants not accepted in baccalaureate generic RN and RN-to-BSN programs, based on National League for Nursing data in Nursing Data Review (2004-05, Tables 3 & 6; 2005-06, Tables 2 & 5; 2007-08; Tables 2 & 5).
3 Number of qualified applicants not accepted in associate’s degree RN programs, based on National League for Nursing data in Nursing Data Review (2004-05, Tables 3 & 6; 2005-06, Tables 2 & 5; 2007-08; Tables 2 & 5).
The definition of “qualified” varies from nursing program to nursing program and is based on each program’s admission requirements and completion standards at the schools that were surveyed.
SOURCE: RWJF, 2010b. Reprinted with permission from Lori Melichar, RWJF.
Age is also a contributing factor to faculty shortages. Nursing faculty tend to be older than clinical nurses because they must meet requirements for an advanced degree in order to teach. Figure 4-5 shows that the average age of nurses who work as faculty as their principal nursing position—the position in which a nurse spends the majority of his or her working hours6—is 50 to 54. By contrast, the median age of the total RN workforce is 46. More than 19 percent of RNs whose principal position is faculty are aged 60 or older, while only 8.7 percent
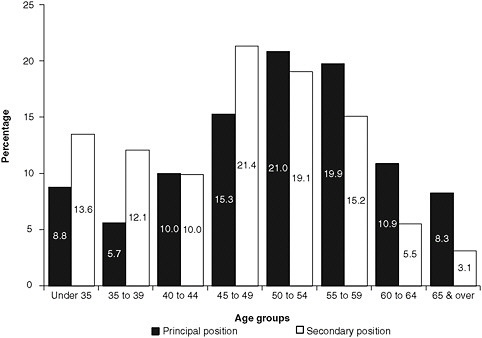
FIGURE 4-5 Age distribution of nurses who work as faculty.
SOURCE: HRSA, 2010b.
of nurses who have a secondary position as faculty—those who hold a nonfaculty (e.g., clinical) principal position—are aged 60 or older. Nurses who work as faculty as their secondary position tend to be younger; among nurses under age 50, more work as faculty as their secondary than as their principal position (HRSA, 2010b). Moreover, the average retirement age for nursing faculty is 62.5 (Berlin and Sechrist, 2002); as a result, many full-time faculty will be ready to retire soon. Given the landscape of the health care system and the fragmented nursing education system, the current pipeline cannot easily replenish this loss, let alone meet the potential demand for more educators. In addition to the innovative strategies of the Veterans Affairs Nursing Academy (VANA) and Gulf Coast Health Services Steering Committee for responding to faculty shortages (discussed later in this chapter), a potential opportunity to relieve faculty shortages could involve the creation of programs that would allow MSN, DNP, and PhD students to teach as nursing faculty interns, with mentoring by full-time faculty. Box 4-4 presents a nurse profile of one assistant professor and her experience moving into an academic career.
Effects of the first degree at entry into the profession Nurses who enter the profession with an associate’s degree are less likely than those who enter with a
|
BOX 4-4 Nurse Profile: Jennifer Wenzel* Pursuing an Academic Career Although she believes that “all nurses make a difference, wherever we practice, whatever we do,” Jennifer Wenzel, PhD, RN, CCM, said that her primary motivation in choosing an academic career, one that combined research with teaching, was that it gave her a way “to have a wider, broader impact.” She’s an assistant professor of nursing at Johns Hopkins University in Baltimore, the manager of the Center for Collaborative Intervention Research, and the principal investigator or co-investigator on 17 research projects in the past decade. In her research Dr. Wenzel has explored, among other topics, rural African Americans with cancer and self-care in patients with diabetes. She has also studied “professional bereavement” and resilience in oncology nurses—how nurses cope with the recurring loss of patients—with lead researcher Sharon Krumm, PhD, RN. Dr. Wenzel said that one not-so-surprising finding has been a discussion of “some of the pressures and demands that nurses place on themselves and on each other.” What she finds exciting about her work, whether with students or with research subjects, she said, is “the opportunity for sustainability. I’m trying to build something that has a lasting effect. That’s always been my dream—what can we give people that will help them, not just in the situation that they’re in, but in future situations, as well?”  Jennifer Wenzel, PhD, RN, CCM |
bachelor’s degree to advance to the graduate level over the course of their career (Cleary et al., 2009). Figure 4-6 gives an overview of the highest educational degree obtained by women and men who hold the RN license. It includes RNs who are working as nurses and those who have retired, have changed professions, or are no longer working. According to an analysis by Aiken and colleagues (2009),
|
The “broader impact,” the “lasting effect”: these are the goals of a woman reared in a tradition of service. An adopted child, she grew up in San Diego in a military family that valued hard work, education, and helping others. And even though neither of her parents finished college, they supported her decision to enter a “two-plus-two” nursing program at Southern Adventist University in Collegedale, Tennessee, in the 1980s. She went through a bit of culture shock there. As an Asian American, she didn’t look like most of her patients; as a Californian, she didn’t sound like them, either. There were times it became clear that her patients had no idea what she was saying: “I would overhear somebody say to another, ‘Is she speaking English? Can you tell?’” Dr. Wenzel said that it taught a lesson that has served her well as a teacher and a researcher: in order to be understood, you have to listen. She earned an associate’s degree after two years and went on to complete the bachelor’s in two more years while working as a staff nurse in endocrinology at a Chattanooga hospital, supporting not only her own education but also her sister’s. “There had always been this idea that it’s important to give back, that society doesn’t necessarily owe you anything,” Dr. Wenzel said of her family’s values. After completing her bachelor’s, she taught a clinical course at a Chattanooga community college. She enjoyed it but felt more drawn to clinical practice and worked as a case manager at a Georgia facility. Her first real immersion in education came at the University of Virginia, where as a doctoral student she was asked to teach a clinical group on inpatient oncology. Other offers soon followed, and she discovered that nurses with advanced degrees always have options.
That’s the message she’s getting as a Robert Wood Johnson Foundation Nurse Faculty Scholar, as well. The national program aids junior nursing faculty in becoming academic leaders, skilled teachers, and productive scholars. And it’s what she tries to impart to her students, too. She tells them: “‘I know that many of you have the ability to [get a doctorate] if you want to do it. And don’t let anyone tell you that you can’t.’” That sort of determination continues to fuel her career. “It’s a real pleasure to see people who are starting out doing something that you love,” said Dr. Wenzel. “Seeing their excitement about it reenergizes you and helps to remind you what drew you to the profession.” |
nurses whose initial degree is the ADN are just as likely as BSN-prepared nurses to seek another degree. Approximately 80 percent of the time, however, ADN graduates fail to move beyond a BSN. Therefore, the greatest number of nurses with a master’s or doctorate, a prerequisite for serving as faculty, received a BSN as their initial degree. Since two-thirds of current RNs received the ADN as their
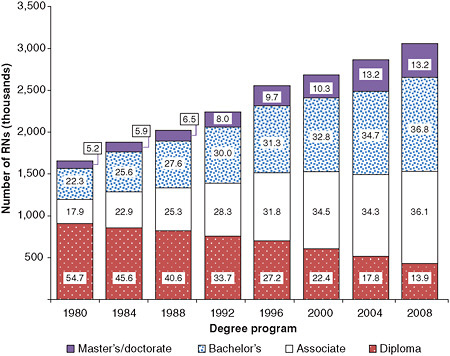
FIGURE 4-6 Distribution of the registered nurse population by highest nursing or nursing-related educational preparation, 1980–2008
NOTES: The totals in each bar may not equal the estimated numbers for RNs in each survey year because of incomplete information provided by respondents and the effect of rounding. Only those who provided information on initial RN educational preparation to surveyors were included in the calculations used for this figure.
SOURCE: HRSA, 2010b.
initial degree, Aiken’s analysis suggests that currently “having enough faculty (and other master’s prepared nurses) to enable nursing schools to expand enrollment is a mathematical improbability” (Aiken et al., 2009). A separate analysis of North Carolina nurses led to a similar conclusion (Bevill et al., 2007). Table 4-2 shows the length of time it takes those nurses who do move on to higher levels of education to progress from completing initial nursing education to completing the highest nursing degree achieved.
Salary disparities Another factor that contributes to the current nursing faculty shortage is salary disparities between nurses working in education and those working in clinical service (Gilliss, 2010). As shown in Table 4-3, the average annual earnings of nurses who work full time as faculty (most with either a master’s or doctoral degree) total $63,949. By contrast, nurse practitioners (NPs) (with
TABLE 4-2 Years Between Completion of Initial and Highest RN Degrees
|
Initial RN Education |
Highest Nursing or Nursing-Related Degree |
||
|
Bachelor’s |
Master’s |
Doctorate |
|
|
Diploma |
10.5 |
13.9 |
15.6 |
|
Associate’s |
7.5 |
11.5 |
12.5 |
|
Bachelor’s |
— |
8.2 |
12.4 |
|
NOTE: Average years between diploma and ADN not calculated due to larger than average rates of missing data. Too few cases to report estimated percent (fewer than 30 respondents). SOURCE: HRSA, 2010b. |
|||
TABLE 4-3 Average Annual Earnings of Nurses Who Work Full Time as Faculty in Their Principal Nursing Position, 2008
|
|
Annual Earnings ($) |
|
All Faculty |
63,985 |
|
Earnings by type of program |
|
|
Faculty in diploma/ADN programs |
62,689 |
|
Faculty in BSN programs |
64,789 |
|
Earnings by faculty job title |
|
|
Instructor/lecturer |
54,944 |
|
Professor |
69,691 |
|
SOURCE: HRSA, 2010b. NOTE: Only registered nurses who provided earnings information were included in the calculations used for this table. |
|
either a master’s or doctoral degree) average just over $85,000 (see Table 4-4). Section 5311 of the Affordable Care Act (ACA) offers an incentive designed to offset lower faculty salaries by providing up to $35,000 in loan repayments and scholarships for eligible nurses who complete an advanced nursing degree and serve “as a full-time member of the faculty of an accredited school of nursing, for a total period, in the aggregate, of at least 4 years.”7 However, the ACA does not provide incentives for nurses to develop the specific educational and clinical competencies required to teach.
Projections of future faculty demand To establish a better understanding of future needs, the committee asked the RWJF Nursing Research Network to proj-
TABLE 4-4 Average Earnings by Job Title of Principal Position for Nurses Working Full Time
|
Position Title |
Average Annual Earnings ($) |
|
Staff nurse |
61,706 |
|
Management/administration |
78,356 |
|
First-line management |
72,006 |
|
Middle management |
74,799 |
|
Senior management |
96,735 |
|
Nurse anesthetist |
154,221 |
|
Clinical nurse specialist |
72,856 |
|
Nurse midwife |
82,111 |
|
Nurse practitioner |
85,025 |
|
Patient educator |
59,421 |
|
Instructor |
65,844 |
|
Patient coordinator |
62,978 |
|
Informatics nurse |
75,242 |
|
Consultant |
76,473 |
|
Researcher |
67,491 |
|
Surveyor/auditor/regulator |
65,009 |
|
Other* |
64,003 |
|
Total |
66,973 |
|
NOTE: *Other position title includes nurses for whom position title is unknown. Only registered nurses who provided earnings and job title information are included in the calculations used for this table. SOURCE: HRSA, 2010b. |
|
ect faculty demand for the next 15 years. After reviewing data from the AACN8 and the NLN (Kovner et al., 2006), the network estimated that between 5,000 and 5,500 faculty positions will remain unfilled in associate’s, baccalaureate, and higher degree programs. This projection is based on historical nurse faculty retirement rates and on graduation trends in research-focused nursing PhD programs. Although a doctoral degree is often required or preferred for all current faculty vacancies, some of these positions can be filled with faculty holding DNP or master’s degrees.
If faculty retirement rates decrease and/or new faculty positions are created to meet future demands (resulting, for example, from provisions for loan repayment in the ACA), these factors will affect the shortage estimates. Additionally, the faculty supply may be affected positively by growing numbers of graduates with a DNP degree (discussed later in this chapter) who, as noted above, may be eligible for faculty positions in some academic institutions.
Insufficient Clinical Placement Opportunities
As nursing education has moved out of hospital-based programs and into mainstream colleges and universities, integrating opportunities for clinical experience into coursework has become more difficult (Cronenwett, 2010). Nursing leaders continue to confront challenges associated with the separation of the academic and practice worlds in ensuring that nursing students develop the competencies required to enter the workforce and function effectively in health care settings (Cronenwett and Redman, 2003; Fagin, 1986). While efforts are being made to expand placements in the community and more care is being delivered in community settings, the bulk of clinical education for students still occurs in acute care settings.
The required number of clinical hours varies widely from one program to another, and most state boards of nursing do not specify a minimum number of clinical hours in prelicensure programs (NCSBN, 2008). It is likely, moreover, that many of the clinical hours fail to result in productive learning. Students spend much of their clinical time performing routine care tasks repeatedly, which may not contribute significantly to increased learning. Faculty report spending most of their time supervising students in hands-on procedures, leaving little time focused on fostering the development of clinical reasoning skills (McNelis and Ironside, 2009).9
Some advances in clinical education have been made through strong academic–service partnerships. An example of such partnerships in community settings is nurse-managed health centers (discussed in Chapter 3), which serve a dual role as safety net practices and clinical education sites. Another, commonly used model is having skilled and experienced practitioners in the field oversee student clinical experiences. According to a recent integrative review, using these skilled practitioners, called preceptors, in a clinical setting is at least as effective as traditional approaches while conserving scarce faculty resources (Udlis, 2006). A variety of other clinical partnerships have been designed to increase capacity in the face of nursing faculty shortages (Baxter, 2007; DeLunas and Rooda, 2009; Kowalski et al., 2007; Kreulen et al., 2008; Kruger et al., 2010).
In addition to academic–service partnerships and preceptor models, the use of high-fidelity simulation offers a potential solution to the problem of limited opportunities for clinical experience, with early studies suggesting the effectiveness of this approach (Harder, 2010). The NLN, for example, has established an online community called the Simulation Innovation Resource Center, where nurse faculty can learn how to “design, implement, and evaluate the use of simulation” in
|
9 |
This paragraph, and the three that follow, were adapted from a paper commissioned by the committee on “Transforming Pre-Licensure Nursing Education: Preparing the New Nurse to Meet Emerging Health Care Needs,” prepared by Christine A. Tanner, Oregon Health & Science University School of Nursing (see Appendix I on CD-ROM). |
their curriculum.10 However, there is little evidence that simulation expands faculty capacity, and no data exist to define what portion of clinical experience it can replace. To establish uniform guidelines for educators, accreditation requirements should be evaluated and revised to allow simulation to fulfill the requirement for a standard number of clinical hours. The use of simulation in relationship to the promotion of interprofessional education is discussed below.
Increased attention is being focused on the dedicated education unit (DEU) as a viable alternative for expanding clinical education capacity (Moscato et al., 2007). In this model, health care units are dedicated to the instruction of students from one program. Staff nurses who want to serve as clinical instructors are prepared to do so, and faculty expertise is used to support their development and comfort in this role. DEUs were developed in Australia and launched in the United States at the University of Portland in Oregon in 2003. Since then, the University of Portland has helped at least a dozen other U.S. nursing schools establish DEUs. In programs that offer DEUs, students perform two 6-week rotations per semester, each instructor/staff nurse teaches no more than two students at a time, and a university faculty member oversees the instruction. Early results suggest the DEU can dramatically increase capacity and have a positive effect on satisfaction among students and nursing staff. A multisite study funded by RWJF is currently under way to evaluate outcomes of the DEU model.
DEUs offer benefits for the nursing schools, the hospitals, the faculty, and the students. Because the hospital employs the clinical instructors, the nursing school can increase its enrollment without increasing costs. The hospital benefits by training students it can hire after their graduation and licensure. Students benefit by having consistent clinical instructors each day, something not guaranteed under the traditional preceptorship model. As the case study in Box 4-5 shows, the benefits of DEUs extend beyond the academic environment to the practice setting as well.
Need for Updated and Adaptive Curricula
A look at the way nursing students are educated at the prelicensure level11 shows that most schools are not providing enough nurses with the required competencies in such areas as geriatrics and culturally relevant care to meet the changing health needs of the U.S. population (as outlined in Chapter 2) (AACN and Hartford, 2000). The majority of nursing schools still educate students primarily for acute care rather than community settings, including public health and long-term care. Most curricula are organized around traditional medical specialties (e.g., maternal–child, pediatrics, medical–surgical, or adult health) (McNelis
|
10 |
See http://sirc.nln.org/. |
|
11 |
Available evidence is based on evaluation of BSN programs and curricula. Evidence was not available for ADN or diploma programs. |
and Ironside, 2009). The intricacies of care coordination are not adequately addressed in most prelicensure programs. Nursing students may gain exposure to leading health care disciplines and know something about basic health policy and available health and social service programs, such as Medicaid. However, their education often does not promote the skills needed to negotiate with the health care team, navigate the regulatory and access stipulations that determine patients’ eligibility for enrollment in health and social service programs, or understand how these programs and health policies impact health outcomes. Nursing curricula need to be reexamined and updated. They need to be adaptive enough to undergo continuous evaluation and improvement based on new evidence and a changing science base, changes and advances in technology, and changes in the needs of patients and the health care system.
Many nursing schools have dealt with the rapid growth of health research and knowledge by adding layers of content that require more instruction (Ironside, 2004). A wide range of new competencies also are being incorporated into requirements for accreditation (CCNE, 2009; NLNAC, 2008). For example, new competencies have been promulgated to address quality and patient safety goals (Cronenwett et al., 2007; IOM, 2003a). Greater emphasis on prevention, wellness, and improved health outcomes has led to new competency requirements as well (Allan et al., 2005). New models of care being promulgated as a result of health care reform will need to be introduced into students’ experiences and will require competencies in such areas as care coordination. These models, many of which could be focused in alternative settings such as schools and workplaces, will create new student placement options that will need to be tested for scalability and compared for effectiveness with more traditional care settings. (See also the discussion of competencies later in the chapter.)
The explosion of knowledge and decision-science technology also is changing the way health professionals access, process, and use information. No longer is rote memorization an option. There simply are not enough hours in the day or years in an undergraduate program to continue compressing all available information into the curriculum. New approaches must be developed for evaluating curricula and presenting fundamental concepts that can be applied in many different situations rather than requiring students to memorize different lists of facts and information for each situation.
Just as curricula must be assessed and rethought, so, too, must teaching–learning strategies. Most nurse faculty initially learned to be nurses through highly structured curricula that were laden with content (NLN Board of Governors, 2003), and too few have received advanced formal preparation in curriculum development, instructional design, or performance assessment. Faculty, tending to teach as they were taught, focus on covering content (Benner et al., 2009; Duchscher, 2003). They also see curriculum-related requirements as a barrier to the creation of learning environments that are both engaging and student-centered (Schaefer and Zygmont, 2003; Tanner, 2007).
|
BOX 4-5 Case Study: The Dedicated Education Unit A New Model of Education to Increase Enrollment Without Raising Costs Jamie Sharp, a 21-year-old University of Portland (UP) nursing student who has performed clinical rotations in a variety of units, remembers a particularly unpleasant experience in a psychiatric unit where she felt she was “in the way” of her nurse preceptors. This was in stark contrast to her experience on a neurovascular unit at Providence St. Vincent Medical Center, where she had just one clinical instructor, a nurse who was eager to teach her. That neurovascular unit was a dedicated education unit (DEU). Created in Australia in the late 1990s and launched in the United States at UP in 2003, the DEU model joins a school of nursing with units at local hospitals, where experienced staff nurses become clinical instructors of juniors and seniors in the bachelor’s degree program. Each instructor teaches no more than two students at a time, but the DEU can be used around the clock. With a DEU, a nursing school can “cultivate a unit” as an excellent learning environment, said UP’s dean of nursing, Joanne Warner, PhD, RN, FAAN. Most important, she added, is “the expertise of the nurses there—they know the clinical procedures, the current medications, the policies of the hospital.” The DEU differs from a usual clinical rotation in the relationship that develops between instructor and student, something that cannot take place when a preceptor has eight students that change from week to week. The instructor gets to know the strengths and weaknesses of the student and supports the student in building confidence and relevant knowledge and skills.
Ms. Sharp was paired with Cathy Mead, ADN, RN, a nurse with 25 years of experience in the unit who received clinical instructor training from the nursing school. Her instruction is overseen by both a university faculty member and the unit’s nurse manager. Dr. Warner said that the benefits to her school and to students are quite tangible: “We have tripled our enrollment. If we had a traditional model I would not have the budget to hire the clinical faculty needed.” The number of students on clinical rotations increased from 227 in 14 units in 2002, before the DEUs were implemented, to 333 in 6 units in 2006, after the DEUs were instituted (Moscato et al., 2007). Now, up to 60 percent of a UP nursing student’s clinical rotations take place in DEUs. But equally important, the students |
|
report learning more in DEUs and are seeking clinical placements on them. It might appear that the university profits far more than the hospital—especially since nearly 40,000 qualified applicants were turned away from baccalaureate nursing programs in 2009 because of shortages of faculty and clinical teaching sites (AACN, 2009c)—but that is not the case, said Cindy Lorion, MSN, RN, nurse manager of the neurovascular and orthopedic units at Providence St. Vincent Medical Center. The clinical instructors are enthusiastic about their new role. They receive adjunct faculty appointments at UP, gaining such benefits as library access but no additional pay from the university (some but not all facilities increase a clinical instructor’s salary). Ms. Lorion has seen an increase in evidence-based practice and in the retention of nurses, as well as better-prepared graduates, many of whom seek jobs at the hospital. She also said that “a village” grows around the students, with everyone from physicians to nurses’ aides taking part in “raising” them. The partnership has led to changes in teaching and in clinical care. After a student made an error by injecting a medication into the wrong tube, the hospital changed its policy on syringe placement, and the school added a “tubes lab” to its courses. A limited number of available clinical training sites in some areas may hamper widespread use of the model, and some units may take students on reluctantly, requiring a change in organizational culture. Nonetheless, more than 100 schools of nursing participated in an international symposium on DEUs in 2007, and more than 20 are developing their own DEUs. After 25 years as a nurse, Ms. Mead is pursuing her bachelor’s degree. “I definitely have to keep it fresh,” she said of the challenge of working with students like Ms. Sharp. “And not everyone can say that after being on the same unit for years.”  Seasoned nurse and clinical instructor Cathy Meade provides guidance as student Jamie Sharp examines a patient. |
GRADUATE NURSING EDUCATION
Even absent passage of the ACA, the need for APRNs, nurse faculty, and nurse researchers would have increased dramatically under any scenario (Cronenwett, 2010). Not only must schools of nursing build their capacity to prepare more students at the graduate level, but they must do so in a way that fosters a unified, competency-based approach with the highest possible standards. Therefore, building the science of nursing education research, or how best to teach students, is an important emphasis for the field of nursing education. For APRNs, graduate education should ensure that they can contribute to primary care and help respond to shortages, especially for those populations who are most underserved. For nurse researchers, a focus on fundamental improvements in the delivery of nursing care to improve patient safety and quality is key.
Numbers and Distribution of Graduate-Level Nurses
As of 2008, more than 375,000 women and men in the workforce had received a master’s degree in nursing or a nursing-related field, and more than 28,000 had gone on to receive either a doctorate in nursing or a nursing-related doctoral degree in a field such as public health, public administration, sociology, or education12 (see Table 4-5) (HRSA, 2010b). Master’s degrees prepare RNs for roles in nursing administration and clinical leadership or for work in advanced practice roles (discussed below) (AARP, 2010 [see Annex 1-1]). Many nursing faculty, particularly clinical instructors, are prepared at the master’s level. Doctoral degrees include the DNP and PhD. A PhD in nursing is a research-oriented degree designed to educate nurses in a wide range of scientific areas that may include clinical science, social science, policy, and education. Traditionally, PhD-educated nurses teach in university settings and conduct research to expand knowledge and improve care, although they can also work in clinical settings and assume leadership and administrative roles in health care systems and academic settings.
The DNP is the complement to other practice doctorates, such as the MD, PharmD, doctorate of physical therapy, and others that require highly rigorous clinical training. Nurses with DNPs are clinical scholars who have the capacity to translate research, shape systems of care, potentiate individual care into care needed to serve populations, and ask the clinical questions that influence organizational-level research to improve performance using informatics and quality improvement models. The DNP is a relatively new degree that offers nurses an opportunity to become practice scholars in such areas as clinical practice, leadership, quality improvement, and health policy. The core curriculum for DNPs is
|
12 |
Nursing-related doctoral degrees are defined by the National Sample Survey of Registered Nurses as non-nursing degrees that are directly related to a nurse’s career in the nursing profession. “Nursing-related degrees include public health, health administration, social work, education, and other fields” (HRSA, 2010b). |
TABLE 4-5 Estimated Distribution of Master’s and Doctoral Degrees as Highest Nursing or Nursing-Related Educational Preparation, 2000–200
|
Degree |
Estimated Distribution |
||
|
2000 |
2004 |
2008 |
|
|
Master’s |
257,812 |
350,801 |
375,794 |
|
Master’s of science in nursing (MSN) |
202,639 |
256,415 |
290,084 |
|
Nursing-related master’s degree |
55,173 |
94,386 |
85,709 |
|
Percent of master’s degrees that are nursing (MSN) |
78.6 |
73.1 |
77.2 |
|
Doctoral |
17,256 |
26,100 |
28,369 |
|
Doctorate in nursing |
8,435 |
11,548 |
13,140 |
|
Nursing-related doctoral degree |
8,821 |
14,552 |
15,229 |
|
Percent of doctorates that are nursing |
48.9 |
44.2 |
46.3 |
|
SOURCE: HRSA, 2010b. |
|||
guided by the AACN’s Essentials of Doctoral Education for Advanced Nursing Practice.13
Schools of nursing have been developing DNP programs since 2002, but only in the last 5 years have the numbers of graduates approached a substantial level (Raines, 2010). Between 2004 and 2008 the number of programs offering the degree increased by nearly 40 percent, as is shown in Figure 4-7. At this point, more evidence is needed to examine the impact DNP nurses will have on patient outcomes, costs, quality of care, and access in clinical settings. It is also difficult to discern how DNP nurses could affect the provision of nursing education and whether they will play a significant role in easing faculty shortages. While the DNP provides a promising opportunity to advance the nursing profession, and some nursing organizations are promoting this degree as the next step for APRNs, the committee cannot comment directly on the potential role of DNP nurses because of the current lack of evidence on outcomes.
Although 13 percent of nurses hold a graduate degree, fewer than 1 percent (28,369 nurses) have a doctoral degree in nursing or a nursing-related field, the qualification needed to conduct independent research (HRSA, 2010b). In fact, only 555 students graduated with a PhD in nursing in 2009, a number that has remained constant for the past decade (AACN, 2009a). As noted, key roles for PhD nurses include teaching future generations of nurses and conducting research that becomes the basis for improvements in nursing practice. As the need for nursing education and research and for nurses to engage with interprofessional research teams has grown, the numbers of nurses with a PhD in nursing or a related field have not kept pace (see Figure 4-7 for trends in the various nursing programs). The main reasons for this lag are (1) an inadequate pool of nurses
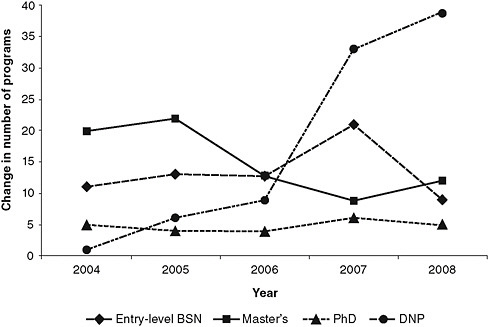
FIGURE 4-7 Growth trends in different nursing programs.
NOTE: BSN = bachelor’s of science in nursing; DNP = doctor of nursing practice.
SOURCES: AACN, 2005, 2006, 2007, 2008a, 2009b.
with advanced nursing degrees to draw upon, (2) faculty salaries and benefits that are not comparable to those of nurses with advanced nursing degrees working in clinical settings, and (3) a culture that promotes obtaining clinical experience prior to continuing graduate education.
Preparation of Advanced Practice Registered Nurses
Nurses prepared at the graduate level to provide advanced practice services include those with master’s and doctoral degrees. APRNs serve as NPs, certified nurse midwives (CNMs), clinical nurse specialists (CNSs), and certified registered nurse anesthetists (CRNAs). To gain certification in one of these advanced practice areas, nurses must take specialized courses in addition to a basic core curriculum. Credit requirements vary from program to program and from specialty to specialty, but typically range from a minimum of 40 credits for a master’s to more than 80 credits for a DNP. Upon completion of required coursework and clinical hours, students must take a certification exam that is administered by a credentialing organization relevant to the specific specialization, such as the American Nursing Credentialing Center (for NPs and CNSs), the American Midwifery Certification Board (for CNMs), or the National Board on Certification and Recertification of Nurse Anesthetists (for CRNAs).
Nurses who receive certification, including those serving in all advanced practice roles, provide added assurance to the public that they have acquired the specialized professional development, training, and competencies required to provide safe, quality care for specific patient populations. For example, NPs and CNSs may qualify for certification after completing a master’s degree, post-master’s coursework, or doctoral degree through an accredited nursing program, with specific advanced coursework in areas such as health assessment, pharmacology, and pathophysiology; additional content in health promotion, disease prevention, differential diagnosis, and disease management; and at least 500 hours of faculty-supervised clinical training within a program of study (ANCC, 2010a, 2010c).
Certification is time-limited, and maintenance of certification requires ongoing acquisition of both knowledge and experience in practice. For example, most advanced practice certification must be renewed every 5 years (NPs, CNSs); requirements include a minimum of 1,000 practice hours in the specific certification role and population/specialty. These requirements must be fulfilled within the 5 years preceding submission of the renewal application (ANCC, 2010b). CRNAs are recertified every 2 years and must be substantially engaged in the practice of nurse anesthesia during those years, in addition to completing continuing education credits (NBCRNA, 2009). Recertification for CNMs is shifting from 8 to 5 years and also involves a continuing education requirement (AMCB, 2009).
As the health care system grows in complexity, expectations are that APRNs will have competence in expanding areas such as technology, genetics, quality improvement, and geriatrics. Coursework and clinical experience requirements are increasing to keep pace with these changes. Jean Johnson, Dean of the School of Nursing at The George Washington University, notes that in terms of education, this is a time of major transition for APRNs.14 With the DNP, some nursing education institutions are now able to offer professional parity with other health disciplines that are shifting, or have already shifted, to require doctorates in their areas of practice, such as pharmacy, occupational and physical therapy, and speech pathology. As discussed above, DNP programs allow nurses to hone their expertise in roles related to nurse executive practice, health policy, informatics, and other practice specialties. (It should be noted, however, that throughout this report, the discussion of APRNs does not distinguish between those with master’s and DNP degrees who have graduated from an accredited program.)
Research Roles
Graduate-level education produces nurses who can assume roles in advanced practice, leadership, teaching, and research. For the latter role, a doctoral degree is required, yet as noted above, fewer than 1 percent of nurses have achieved
this level of education. This number is insufficient to meet the crucial need for research in two key areas: nursing education and nursing science.
Research on Nursing Education
At no time in recent history has there been a greater need for research on nursing education. As health care reform progresses, basic and advanced nursing practices are being defined by the new competencies alluded to above and discussed in the next section, yet virtually no evidence exists to support the teaching approaches used in nursing education.15
Additionally, little research has focused on clinical education models or clinical experiences that can help students achieve these competencies, even though clinical education constitutes the largest portion of nurses’ educational costs. Likewise, little evidence supports appropriate student/faculty ratios. Yet current clinical education models and student/faculty ratios are limiting capacity at a time when the need for new nurses is projected to increase. The paucity of evidence in nursing education and pedagogy calls for additional research and funding to ascertain the efficiency and effectiveness of approaches to nursing education, advancing evidence-based teaching and interprofessional knowledge. Chapter 7 outlines specific research priorities that could shape improvements to nursing education.
In a recent editorial, Broome (2009) highlighted the need for three critical changes required to “systematically build a … science that could guide nurse educators to develop high quality, relevant, and cost-effective models of education that produce graduates who can make a difference in the health system”:
-
funding to support nursing education research, potentially via mechanisms through the Health Resources and Services Administration;
-
multidisciplinary research training programs, including postdoctoral training to prepare a cadre of nurses dedicated to developing the science of nursing education; and
-
efforts to foster the development of PhD programs that have faculty expertise to mentor a new generation of nursing education researchers.
Research on Nursing Science
The expansion of knowledge about the science of nursing is key to providing better patient care, improving health, and evaluating outcomes. Along with an adequate supply of qualified nurses, meeting the nation’s growing health care needs
|
15 |
Some faculty development programs and training opportunities are offered through universities and professional organizations, such as the AACN and the NLN. Additionally, the NLN offers a certification program for nurse educators, who can publically confirm knowledge in the areas of pedagogy, learning, and the complex encounter between educator and student. This certification program can provide a basis for innovation and the continuous quality improvement of nursing education. |
requires continued growth in the science of delivering effective care for people and populations and designing health systems. Nurse scientists are a critical link in the discovery and translation of knowledge that can be generated by nurses and other health scientists. To carry out this crucial work, a sustainable supply of and support for nurse scientists will be necessary (IOM, 2010).
The research conducted by nurse scientists has led to many fundamental improvements in the provision of care. Advances have been realized, for example, in the prevention of pressure ulcers; the reduction of high blood pressure among African American males; and the models described elsewhere in this report for providing transitional care after hospital discharge and for promoting health and well-being among young, disadvantaged mothers and their newborns. Yet nursing’s research capacity has been largely overlooked in the development of strategies for responding to the shortage of nurses or effecting the necessary transformation of the nursing profession. The result has been a serious mismatch between the urgent need for knowledge and innovation to improve care and the nursing profession’s ability to respond to that need, as well as a limitation on what nursing schools can include in their curricula and what is disseminated in the clinical settings where nurses engage.
A chapter of the National Research Council’s 2005 report, Advancing the Nation’s Health Needs: NIH’s Research Training Program, focuses on nursing research; it identified factors that would likely influence its future, for example: an aging cadre of nursing science researchers, longer times required to complete doctoral degrees, increasing demands on nursing faculty to also meet workforce demands, and the emergence of clinical doctoral programs (NRC, 2005). Evaluating these and other factors will be essential to achieving the transformation of the nursing profession that this report argues is essential to a transformed health care system.
COMPETENCY-BASED EDUCATION
Competencies that are well known to the nursing profession, such as care management and coordination, patient education, public health intervention, and transitional care, are likely to dominate in a reformed health care system. As Edward O’Neil, Director, Center for the Health Professions at the University of California, San Francisco, pointed out however, “these traditional competencies must be reinterpreted for students into the settings of the emergent care system, not the one that is being left behind. This will require faculty to not only teach to these competencies but also creatively apply them to health environments that are only now emerging” (O’Neil, 2009). Emerging new competencies in decision making, quality improvement, systems thinking, and team leadership must become part of every nurse’s professional formation from the prelicensure through the doctoral level.
A review of medical school education found that evidence in favor of competency-based education is limited but growing (Carraccio et al., 2002). Nursing
schools also have embraced the notion of competency-based education, as noted earlier in the chapter in the case study on the Oregon Consortium for Nursing Education (Box 4-2). In addition, Western Governors University uses competency-based education exclusively, allowing nursing students to move through their program of study at their own pace. Mastery of the competency is achieved to the satisfaction of the faculty without the normal time-bound semester structure (IOM, 2010).
Defining Core Competencies
The value of competency-based education in nursing is that it can be strongly linked to clinically based performance expectations. It should be noted that “competencies” here denotes not task-based proficiencies but higher-level competencies that represent the ability to demonstrate mastery over care management knowledge domains and that provide a foundation for decision-making skills under variety of clinical situations across all care settings.
Numerous sets of core competencies for nursing education are available from a variety of sources. It has proven difficult to establish a single set of competencies that cover all clinical situations, across all settings, for all levels of students. However, there is significant overlap among the core competencies that exist because many of them are derived from such landmark reports as Recreating Health Professional Practice for a New Century (O’Neil and Pew Health Professions Commission, 1998) and Health Professions Education: A Bridge to Quality (IOM, 2003b). The competencies in these reports focus on aspects of professional behavior (e.g., ethical standards, cultural competency) and emphasize areas of care (e.g., prevention, primary care), with overarching goals of (1) providing patient-centered care, (2) applying quality improvement principles, (3) working in interprofessional teams, (4) using evidence-based practices, and (5) using health information technologies.
Two examples of sets of core competencies come from the Oregon Consortium for Nursing Education16 and the AACN. The former set features competencies that promote nurses’ abilities in such areas as clinical judgment and critical thinking; evidence-based practice; relationship-centered care; interprofessional collaboration; leadership; assistance to individuals and families in self-care practices for promotion of health and management of chronic illness; and teaching, delegation, and supervision of caregivers. The AACN’s set of competencies is outlined in Essentials for Baccalaureate Education and highlights such areas as “patient-centered care, interprofessional teams, evidence-based practice, quality improvement, patient safety, informatics, clinical reasoning/critical thinking, genetics and genomics, cultural sensitivity, professionalism, practice across the lifespan, and end-of-life care” (AACN, 2008b). While students appear to gradu-
|
16 |
See http://www.ocne.org/. |
ate with ample factual knowledge of these types of core competencies, however, they often appear to have little sense of how the competencies can be applied or integrated into real-world practice situations (Benner et al., 2009).
Imparting emerging competencies, such as quality improvement and systems thinking, is also key to developing a more highly educated workforce. Doing so will require performing a thorough evaluation and redesign of educational content, not just adding content to existing curricula. An exploration of the educational changes required to teach all the emerging competencies required to meet the needs of diverse patient populations is beyond the scope of this report.
Defining an agreed-upon set of core competencies across health professions could lead to better communication and coordination among disciplines (see the discussion of the Interprofessional Education Collaborative below for an example of one such effort). Additionally, the committee supports the development of a unified set of core competencies across the nursing profession and believes it would help provide direction for standards across nursing education. Defining these core competencies must be a collaborative effort among nurse educators, professional organizations, and health care organizations and providers. This effort should be ongoing and should inform regular updates of nursing curricula to ensure that graduates at all levels are prepared to meet the current and future health needs of the population.
Assessing Competencies
Changes in the way competencies are assessed are also needed. In 2003, the IOM’s Health Professions Education: A Bridge to Quality called for systemwide changes in the education of health professionals, including a move on the part of accrediting and certifying organizations for all health professionals toward mandating a competency-based approach to education (IOM, 2003a). Steps are already being taken to establish competency-based assessments in medical education. In its 2009 report to Congress on Improving Incentives in the Medicare Program, the Medicare Payment Advisory Commission highlighted an initiative of the Accreditation Council for Graduate Medical Education to require greater competency-based assessment of all residency programs that train physicians in the United States (MedPAC, 2009). The NCSBN has considered various challenges related to competency assessment and is considering approaches to ensure that RNs can demonstrate competence in the full range of areas that are required for the practice of nursing.17
A competency-based approach to education strives to make the competencies for a particular course explicit to students and requires them to demonstrate mastery of those competencies (Harden, 2002). Performance-based assessment then shows whether students have both a theoretical grasp of what they have learned
and the ability to apply that knowledge in a real-world or realistically simulated situation. The transition-to-practice or nurse residency programs discussed in Chapter 3 could offer an extended opportunity to reinforce and test core competencies in real-world settings that are both safe and monitored.
Lifelong Learning and Continuing Competence
Many professions, such as nursing, that depend heavily on knowledge are becoming increasingly technical and complex (The Lewin Group, 2009). No individual can know all there is to know about providing safe and effective care, which is why nurses must be integral members of teams that include other health professionals. Nor can a single initial degree provide a nurse with all she or he will need to know over an entire career. Creating an expectation and culture of lifelong learning for nurses is therefore essential.
From Continuing Education to Continuing Competence
Nurses, physicians, and other health professionals have long depended on continuing education programs to maintain and develop new competencies over the course of their careers. Yet the 2009 IOM study Redesigning Continuing Education in the Health Professions cites “major flaws in the way [continuing education] is conducted, financed, regulated, and evaluated” and states that the evidence base underlying current continuing education programs is “fragmented and undeveloped.” These shortcomings, the report suggests, have hindered the identification of effective educational methods and their integration into coordinated, comprehensive programs that meet the needs of all health professionals (IOM, 2009). Likewise, the NCSBN has found that there is no clear link between continuing education requirements and continued competency.18 A new vision of professional development is needed that enables learning both individually and from a collaborative, team perspective and ensures that “all health professionals engage effectively in a process of lifelong learning aimed squarely at improving patient care and population health” (IOM, 2009).
This new comprehensive vision is often termed “continuing competence.” The practice setting, like the academic setting, is challenged by the need to integrate traditional and emerging competencies. Therefore, building the capacity for lifelong learning—which encompasses both continuing competence and advanced degrees—requires ingenuity on the part of employers, businesses, schools, community and government leaders, and philanthropies. The case study in Box 4-6 describes a program that extends the careers of nurses by training them to transition from the acute care to the community setting.
Interprofessional Education
The importance of interprofessional collaboration and education has been recognized since the 1970s (Alberto and Herth, 2009). What is new is the introduction of simulation and web-based learning—solutions that can be used to can break down traditional barriers to learning together, such as the conflicting schedules of medical and APRN students or their lack of joint clinical learning opportunities. Simulation technology offers a safe environment in which to learn (and make mistakes), while web-based learning makes schedule conflicts more manageable and content more repeatable. If all nursing and medical students are educated in aspects of interprofessional collaboration, such as knowledge of professional roles and responsibilities, effective communication, conflict resolution, and shared decision making, and are exposed to working with other health professional students through simulation and web-based training, they may be more likely to engage in collaboration in future work settings. Further, national quality and safety agendas, including requirements set by the Joint Commission, the Commission on Collegiate Nursing Education, the NLN, and the Association of American Medical Colleges (AAMC), along with studies that link disruptive behavior between RNs and MDs to negative patient and worker outcomes (Rosenstein and O’Daniel, 2005, 2008), create a strong incentive to not just talk about but actually work on implementing interprofessional collaboration.
England, Canada, and the United States have made strides to improve interprofessional education by bringing students together from academic health science universities and medical centers (e.g., students of nursing, medicine, pharmacy, social work, physical therapy, and public health, among others) in shared learning environments (Tilden, 2010). Defined as “occasions when two or more professions learn with, from, and about each other to improve collaboration and the quality of care” (Barr et al., 2005), such education is based on the premise that students’ greater familiarity with each other’s roles, competencies, nomenclatures, and scopes of practice will result in more collaborative graduates. It is expected that graduates of programs with interprofessional education will be ready to work effectively in patient-centered teams where miscommunication and undermining behaviors are minimized or eliminated, resulting in safer, more effective care and greater clinician and patient satisfaction. Interprofessional education is thought to foster collaboration in implementing policies and improving services, prepare students to solve problems that exceed the capacity of any one profession, improve future job satisfaction, create a more flexible workforce, modify negative attitudes and perceptions, and remedy failures of trust and communication (Barr, 2002).19
|
19 |
This paragraph draws upon a paper commissioned by the committee on “The Future of Nursing Education,” prepared by Virginia Tilden, University of Nebraska Medical Center College of Nursing (see Appendix I on CD-ROM). |
|
BOX 4-6 Case Study: Nursing for Life—The RN Career Transition Program A New Program Extends the Working Life of Aging Nurses By Training Them to Work in Community Settings At age 62 Jackie Tibbetts, MS, RN, CAGS, was thinking, naturally, about retirement. She was nearing the end of a 39-year teaching career when a close friend became ill, and her proximity to her friend’s care and eventual death made her realize she still had a great deal to offer. She felt compelled to return to nursing, her first profession. Ms. Tibbetts now provides skilled nursing care at a retirement community in a suburb of Boston. She made the move to long-term care through the Nursing for Life: RN Career Transition program at Michigan State University (MSU) College of Nursing, an outgrowth of a 2002 online refresher course the school offered. Because she had maintained her registered nurse (RN) license, she was eligible for the course, and with a background in rehabilitation she determined that the long-term care setting would be a good fit. Ms. Tibbetts received online education and performed a clinical practicum near her Massachusetts home. Now 64, she plans to work as a nurse “as long as I’m able,” she said. In 2006 the Blue Cross Blue Shield of Michigan Foundation, in concert with the College of Nursing at MSU, set out to broaden the opportunities for Michigan’s, and the nation’s, aging nursing workforce. “We began to think about some of the needs of mid-to-late-career nurses still working in acute care and looking to move away from that work, for the physical intensity of it,” said Terrie Wehrwein, PhD, RN, NEA-BC, associate professor at the school. The Blue Cross Blue Shield of Michigan Foundation and the College of Nursing at MSU were among the first recipients of a grant from Partners Investing in Nursing’s Future, a joint venture of the Northwest Health Foundation and The Robert Wood Johnson Foundation. The program began in 2008 as a pilot project to train licensed RNs to work in four community settings that may be less physically demanding than acute care—home care, long-term care, hospice, and ambulatory care—and that are open to any licensed nurse, not just those in Michigan. (Two new tracks, in case management and quality and safety management, are being developed.)
The program has two components: an online, self-paced didactic course has seven core modules, plus seven modules specific to each specialty, and an 80-hour clinical practicum pairs the nurse, ideally, with a single preceptor in the area of |
|
study. Nurses have 1 year to finish the online course and are encouraged to complete the practicum within 5 weeks. The program has attracted not only aging nurses but also younger ones wanting to change work settings. And Michigan is not the only state that benefits; of the 28 nurses who have completed the program, about 10 percent live out of state. (Michigan residents who cannot afford the $1250 tuition may be eligible for aid through the state’s No Worker Left Behind program. Other states may provide similar assistance.) After receiving a bachelor’s degree in nursing in 1974 and a master’s in 1982, Shari Morris, MN, RN, left the profession in 1990 to home-school her four sons. She took a Minnesota refresher course in 2006, when she was 54, and got a job in a pediatrician’s office. She realized she would need further training to advance in ambulatory care and enrolled in Nursing for Life. For her clinical practicum she chose two pediatric clinics in a nearby hospital. When asked what impact the program has had on her ability to remain a nurse, she said, “I think, probably, courage.” The course gave her the self-assurance to apply for a job in teaching when she could not find an opening in ambulatory care; she is now an instructor in nursing at a Michigan community college. “I felt confident to step out of the first setting I’d been in 17 years and go into another arena, without any difficulties,” Ms. Morris said.  The online education Jackie Tibbetts received through the Nursing for Life: RN Career Transition program helped her shift back to a nursing career after almost four decades as a teacher. |
The AAMC, the American of Association of Colleges of Osteopathic Medicine, the American Dental Education Association, the American Association of Colleges of Pharmacy, the Association of Schools of Public Health, and the AACN recently formed a partnership called the Interprofessional Education Collaborative. This collaborative is committed to the development of models of collaboration that will provide the members’ individual communities with the standards and tools needed to achieve productive interprofessional education practices. These organizations are committed to fulfilling the social contract that every nursing, pharmacy, dental, public health, and medical graduate is proficient in the core competencies required for interprofessional, team-based care, including preventive, acute, chronic, and catastrophic care. The collaborative is also committed to facilitating the identification, development, and deployment of the resources essential to achieving this vision. As a first step, the collaborative is developing a shared and mutually endorsed set of core competencies that will frame the education of the six represented health professions.20
Efforts have been made to evaluate the effectiveness of interprofessional education in improving outcomes, including increased student satisfaction, modified negative stereotypes of other disciplines, increased collaborative behavior, and improved patient outcomes. However, the effect of interprofessional education is not easily verified since control group designs are expensive, reliable measures are few, and time lapses can be long between interprofessional education and the behavior of graduates. Barr and colleagues (2005) reviewed 107 evaluations of interprofessional education in published reports and found support for three outcomes: interprofessional education creates positive interaction among students and faculty; encourages collaboration between professions; and results in improvements in aspects of patient care, such as more targeted health promotion advice, higher immunization rates, and reduced blood pressure for patients with chronic heart disease. Reeves and colleagues (2008) reviewed six later studies of varying designs. Four of the studies found that interprofessional education improved aspects of how clinicians worked together, while the remaining two found that it had no effect (Reeves et al., 2008). Although empirical evidence is mixed, widespread theoretical agreement and anecdotal evidence suggest that students who demonstrate teamwork skills in the simulation laboratory or in a clinical education environment with patients will apply those skills beyond the confines of their academic programs.21
|
20 |
Personal communication, Geraldine Bednash, CEO, AACN, August 12, 2010. |
|
21 |
This paragraph draws upon a paper commissioned by the committee on “The Future of Nursing Education,” prepared by Virginia Tilden, University of Nebraska Medical Center College of Nursing (see Appendix I on CD-ROM). |
THE NEED TO INCREASE THE DIVERSITY OF THE NURSING WORKFORCE
Chapter 3 highlighted a variety of challenges facing the nursing profession in meeting the changing needs of patients and the health care system. A major challenge for the nursing workforce is the underrepresentation of racial and ethnic minority groups and men in the profession. To better meet the current and future health needs of the public and to provide more culturally relevant care, the nursing workforce will need to grow more diverse. And to meet this need, efforts to increase nurses’ levels of educational attainment must emphasize increasing the diversity of the student body. This is a crucial concern that needs to be addressed across all levels of nursing education.
Racial and Ethnic Diversity
Although the composition of the nursing student body is more racially and ethnically diverse than that of the current workforce, diversity continues to be a challenge. Figure 4-8 shows the distribution of minority students enrolled in nursing programs by race/ethnicity and by program type. Their underrepresentation is greatest for pathways associated with higher levels of education. In academic year 2008–2009, for example, ethnic minority groups made up 28.2 percent of ADN, 23.6 percent of BSN, 24.4 percent of master’s, and 20.3 percent of doctoral students (NLN, 2009). Even less evidence of diversity is present among nurses in faculty positions (AACN, 2010b).
In 2003, the Sullivan Commission on Diversity in the Healthcare Workforce was established to develop recommendations that would “bring about systemic change … [to] address the scarcity of minorities in our health professions.” The commission’s report, Missing Persons: Minorities in the Health Professions (Sullivan Commission on Diversity in the Healthcare Workforce, 2004), offered strategies to increase the diversity of the medical, nursing, and dentistry professions and included recommendations designed to remove barriers to health professions education for underrepresented minority students. The commission’s 37 recommendations called for leadership, commitment, and accountability among a wide range of stakeholders—from institutions responsible for educating health professionals, to professional organizations and health systems, to state and federal agencies and Congress. The recommendations focused on expediting strategies to increase the number of minorities in health professions, improving the education pipeline for health professionals, financing education for minority students, and establishing leadership and accountability to realize the commission’s vision of increasing the diversity of health professionals. The committee believes the implementation of these recommendations holds promise for ensuring a more diverse health care workforce in the future.
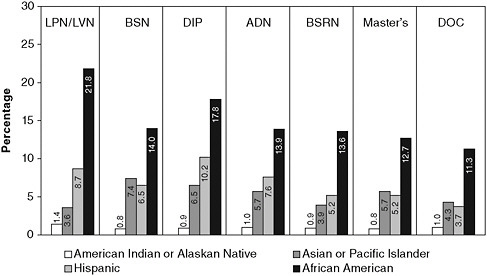
FIGURE 4-8 Percentage of minority students enrolled in nursing programs by race/ethnicity and program type, 2008–2009
NOTE: ADN = associate’s degree programs; BSN = bachelor’s of science programs; BSRN = RN-to-BSN programs; DIP = diploma nursing programs; DOC = nursing school programs offering doctoral degrees; LPN = licensed practical nursing programs; LVN = licensed vocational nursing programs.
SOURCE: NLN, 2010c. Reprinted with Permission from the National League for Nursing.
In the nursing profession, creating bridge programs and educational pathways between undergraduate and graduate programs—specifically programs such as LPN to BSN, ADN to BSN, and ADN to MSN—appears to be one way of increasing the overall diversity of the student body and nurse faculty with respect to not only race/ethnicity, but also geography, background, and personal experience. Mentoring programs that support minority nursing students are another promising approach. One example of such a program is the National Coalition of Ethnic Minority Nursing Associations, a group made up of five ethnic minority nursing associations that aims to build the cadre and preparation of ethnic minority nurses and promote equity in health care across ethnic minority populations (NCEMNA, 2010). This program is described at greater length in Chapter 5. Another example of a successful program that has promoted racial and ethnic diversity is the ANA Minority Fellowship Program,22 started in 1974 under the leadership of Dr. Hattie Bessent. This program has played a crucial role in supporting minority nurses with predoctoral and postdoctoral fellowships to advance research and clinical
|
22 |
See http://www.emfp.org/. |
practice (Minority Fellowship Program, 2010). Programs to recruit and retain more individuals from racial and ethnic minority groups in nursing education programs are needed. A necessary first step toward accomplishing this goal is to create policies that increase the overall educational attainment of ethnic minorities (Coffman et al., 2001).
Gender Diversity
As noted in Chapter 3, the nursing workforce historically has been composed predominantly of women. While the number of men who become nurses has grown dramatically in the last two decades, men still make up just 7 percent of all RNs (HRSA, 2010b). While most disciplines within the health professional workforce have become more gender balanced, the same has not been true for nursing. For example, in 2009 nearly half of medical school graduates were female (The Kaiser Family Foundation—statehealthfacts.org, 2010), a significant achievement of gender parity in a traditionally male-dominated profession. Stereotypes, academic acceptance, and role support are challenges for men entering the nursing profession. These barriers must be overcome if men are to be recruited in larger numbers to help offset the shortage of nurses and fill advanced and expanded nursing roles. Compounding the gender diversity problem of the nursing profession is the fact that fewer men in general are enrolling in higher education programs (Mather and Adams, 2007). While more men are being drawn to nursing, especially as a second career, the profession needs to continue efforts to recruit men; their unique perspectives and skills are important to the profession and will help contribute additional diversity to the workforce.
One professional organization that works to encourage men to join the nursing profession and supports men who do so is the American Assembly for Men in Nursing (AAMN).23 To increase opportunities for men interested in joining the profession, the AAMN Foundation, in partnership with Johnson & Johnson, has awarded more than $50,000 in scholarships to undergraduate and graduate male nursing students since 2004 (AAMN, 2010b). Additionally, each year the AAMN recognizes the best school or college of nursing for men; in 2009, the honor was given to Monterey Peninsula College in Monterey, California, and Excelsior College in Albany, New York, for their “efforts in recruiting and retaining men in nursing, in providing men a supportive educational environment, and in educating faculty, students and the community about the contributions men have and do make to the nursing profession” (AAMN, 2010a).
|
23 |
See http://www.aamn.org/. |
SOLUTIONS FROM THE FIELD
This chapter has outlined a number of challenges facing nursing education. These challenges have been the subject of much documentation, analysis, and debate (Benner et al., 2009; Erickson, 2002; IOM, 2003a, 2009; Lasater and Nielsen, 2009; Mitchell et al., 2006; Orsolini-Hain and Waters, 2009; Tanner et al., 2008). Various approaches to responding to these challenges and transforming curricula have been proposed, and several are being tested. The committee reviewed the literature on educational capacity and redesign, heard testimony about various challenges and potential solutions at the public forum in Houston, and chose a number of exemplars for closer examination. Three of these models are described in this section. The committee found that each of these models provided important insight into creative approaches to maximizing faculty resources, encouraging the establishment and funding of new faculty positions, maximizing the effectiveness of clinical education, and redesigning nursing curricula.
Veterans Affairs Nursing Academy
In 2007, the VA launched the VANA—a 5-year, $40 million pilot program—with the primary goals of developing partnerships with academic nursing institutes; expanding the number of faculty for baccalaureate programs; establishing partnerships to enhance faculty development; and increasing baccalaureate enrollment to increase the supply of nurses, not solely for the VA, but for the country at large. VANA also was aimed at encouraging interprofessional programs and increasing the retention and recruitment of VA nurses.24
Since the program’s inception, three cycles of requests for proposals have been sent to more than 600 colleges and schools of nursing, as well as to institutions within the VA system. Fifteen geographically and demographically diverse pilot sites were selected to participate in VANA based on the strength of their proposals.
Each funded VANA partnership is required to have a rigorous evaluation plan to measure outcomes. Outcomes are expected to include increased staff, patient, student, and faculty satisfaction; greater scholarly output; enhanced professional development; better continuity and coordination of care; more reliance on evidence-based practice; and enhanced interprofessional learning. Each selected school is also expected to increase enrollment by at least 20 students a year.
The program has already resulted in 2,700 new students, with 620 receiving the majority of their clinical rotation experiences at the VA. The graduates of this program may include students who have pursued a traditional prelicensure
|
24 |
This paragraph, and the three that follow, draw upon a presentation made by Cathy Rick, chief nursing officer for the VA, at the Forum on the Future of Nursing: Education, held in Houston, TX on February 22, 2010 (see Appendix C) and published in A Summary of the February 2010 Forum on the Future of Nursing: Education (IOM, 2010). |
BSN, a BSN through a second-degree program, or a BSN through an RN-to-BSN program. The number of nursing school faculty has increased by 176 and the number of VA faculty by 264.
In addition to the new nurses and faculty, educational innovations have encompassed curriculum revision, including quality and safety standards; DEUs (described earlier in Box 4-4); and a postgraduate baccalaureate nurse residency (see Chapter 3). Other changes include interprofessional simulation training and the development of evidence-based practice committees and programs. Beyond these specific changes and accomplishments, the VANA faculty has worked to develop the program into a single community of learning and to prepare students in a genuinely collaborative practice environment with clinically proficient staff and educators.
Carondolet Health Network
The Carondolet Health Network of Tucson, Arizona, is an example of how employers can offer educational benefits that improve both patient outcomes and the bottom line. Carondelet, which includes four hospitals and other facilities and employs approximately 1,650 nurses, is featured as one of seven cases studies in the Lewin Group’s 2009 report Wisdom at Work: Retaining Experienced RNs and Their Knowledge—Case Studies of Top Performing Organizations.
After Carondelet became part of Ascension Health in 2002, the Tucson organization embarked on a strategic plan to recruit and retain more nurses. Arizona faces some of the severest nursing shortages in the nation, and most nurses prefer to live and work in higher-paying markets, such as Phoenix or southern California. When Carondelet instituted an on-site BSN program, which it subsidized in exchange for a 2-year work commitment, the response was dramatic. Instead of an anticipated class size of 20 nurses in the first semester of the program, it enrolled 104. Of interest, it was the business case—the opportunity to decrease the amount of money the organization was spending on costly temporary nurses—that tipped the balance in favor of action (The Lewin Group, 2009).
Hospital Employee Education and Training
The Hospital Employee Education and Training (HEET) program was developed through a joint effort of the 1199NW local affiliate of the Service Employees International Union and the Washington State Hospital Association Work Force Institute to help address shortages in nursing and nursing-related positions through education and upgrading of incumbent workers. The program is administered through the Washington State Board for Community and Technical Colleges. Across the state, HEET-funded programs support industry-based reform of the education system and include preparation and completion of nursing career ladder programs. HEET seeks to develop educational opportunities that support
both employer needs and the career aspirations of health care workers. It features cohort-based programs, distance learning, worksite classes, use of a simulation laboratory for nursing prerequisites, case management, tutoring support for those reentering academia, and nontraditional scheduling of classes to enable working adults to attend and address employee barriers to education.
The findings for this union-inspired initiative demonstrate its potential to increase racial/ethnic diversity in the nursing population. HEET participants represent a pool of potential nurses who are more diverse than the current nursing workforce. Providing on-site classes at hospitals appears to support the participation of working adults who are enrolled in nursing school while continuing to work at least part time. Workers participating in the HEET program have had lower attrition rates and higher rates of course completion compared with community college students in nursing career tracks. The curriculum also blends academic preparation with health care career education, thereby opening the doors of college to workers who might not otherwise enroll or succeed (Moss and Weinstein, 2009).
CONCLUSION
The future of access to basic primary care and nursing education will depend on increasing the number of BSN-prepared nurses. Unless this goal is met, the committee’s recommendations for greater access to primary care; enhanced, expanded, and reconceptualized roles for nurses; and updated nursing scopes of practice (see Chapter 7) cannot be achieved. The committee believes that increasing the proportion of the nursing workforce with a BSN from the current 50 percent to 80 percent by 2020 is bold but achievable. Achieving this target will help meet future demand for nurses qualified for advanced practice positions and possessing competencies in such areas as community care, public health, health policy, evidence-based practice, research, and leadership. The committee concludes further that the number of nurses holding a doctorate must be increased to produce a greater pool of nurses prepared to assume faculty and research positions. The committee believes a target of doubling the number of nurses with a doctorate by 2020 would meet this need and is achievable.
To achieve these targets, however, will require overcoming a number of barriers. The numbers of educators and clinical placements are insufficient for all the qualified applicants who wish to enter nursing school. There also is a shortage of faculty to teach nurses at all levels. Incentives for nurses at any level to pursue further education are few, and there are active disincentives against advanced education. Nurses and physicians—not to mention pharmacists and social workers—typically are not educated together and yet are increasingly required to cooperate and collaborate more closely in the delivery of care.
To address these barriers, innovative new programs to attract nursing faculty and provide a wider range of clinical education placements must clear long-stand-
ing bottlenecks. To this end, market-based salary adjustments must be made for faculty, and more scholarships must be provided to help nursing students advance their education. Accrediting and certifying organizations must mandate demonstrated mastery of clinical skills, managerial competencies, and professional development at all levels. Mandated skills, competencies, and professional development milestones must be updated on a more timely basis to keep pace with the rapidly changing demands of health care. All health professionals should receive more of their education in concert with students from other disciplines. Efforts also must be made to increase the diversity of the nursing workforce.
The nursing profession must adopt a framework of continuous lifelong learning that includes basic education, academic progression, and continuing competencies. More nurses must receive a solid education in how to manage complex conditions and coordinate care with multiple health professionals. They must demonstrate new competencies in systems thinking, quality improvement, and care management and a basic understanding of health care policy. Graduate-level nurses must develop an even deeper understanding of care coordination, quality improvement, systems thinking, and policy.
The committee emphasizes further that, as discussed in Chapter 2, the ACA is likely to accelerate the shift in care from the hospital to the community setting. This transition will have a particularly strong impact on nurses, more than 60 percent of whom are currently employed in hospitals (HRSA, 2010b). Nurses may turn to already available positions in primary or chronic care or in public or community health, or they may pursue entirely new careers in emerging fields that they help create. Continuing and graduate education programs must support the transition to a future that rewards flexibility. In addition, the curriculum at many nursing schools, which places heavy emphasis on preparing students for employment in the acute care setting, will need to be rethought (Benner et al., 2009).
REFERENCES
AACN (American Association of Colleges of Nursing). 2005. Enrollment and graduations in baccalaureate and graduate programs in nursing, 2004-05. Washington, DC: AACN.
AACN. 2006. Enrollment and graduations in baccalaureate and graduate programs in nursing, 2005-06. Washington, DC: AACN.
AACN. 2007. Enrollment and graduations in baccalaureate and graduate programs in nursing, 2006-07. Washington, DC: AACN.
AACN. 2008a. Enrollment and graduations in baccalaureate and graduate programs in nursing, 2007-08. Washington, DC: AACN.
AACN. 2008b. The essentials of baccalaureate education for professional nursing practice. Washington, DC: AACN. Available from http://www.aacn.nche.edu/education/pdf/BaccEssentials08.pdf.
AACN. 2009a. Advancing higher education in nursing: 2009 annual report. Washington, DC: AACN.
AACN. 2009b. Enrollment and graduations in baccalaureate and graduate programs in nursing, 2008-09. Washington, DC: AACN.
AACN. 2009c. Student enrollment expands at U.S. Nursing colleges and universities for the 9th year despite financial challenges and capacity restraints. http://www.aacn.nche.edu/Media/NewsReleases/2009/StudentEnrollment.html (accessed March 13, 2010).
AACN. 2010a. Education policy: New policy statement from the Tri-Council for Nursing on the educational advancement of registered nurses. http://www.aacn.nche.edu/Education/ (accessed September 7, 2010).
AACN. 2010b. Enhancing diversity in the nursing workforce: Fact sheet updated March 2010. http://www.aacn.nche.edu/Media/FactSheets/diversity.htm (accessed July 1, 2010).
AACN. 2010c. The impact of education on nursing practice. http://www.aacn.nche.edu/media/factsheets/impactednp.htm (accessed September 7, 2010).
AACN and AAMC (Association of American Medical Colleges). 2010. Lifelong learning in medicine and nursing: Final conference report. Washington, DC: AACN and AAMC.
AACN and Hartford (The John A. Hartford Foundation Institute for Geriatric Nursing). 2000. Older adults: Recommended baccalaureate competencies and curricular guidelines for geriatric nursing care. Washington, DC and New York: AACN and The John A. Hartford Foundation Institute for Geriatric Nursing.
AAMN (American Assembly for Men in Nursing). 2010a. Awards: Best nursing school/college for men in nursing. http://www.aamn.org/awschool.html (accessed September 10, 2010).
AAMN. 2010b. Scholarships. http://www.aamn.org/scholarships.html (accessed September 10, 2010).
AARP. 2010. Preparation and roles of nursing care providers in America. http://championnursing.org/resources/preparation-and-roles-nursing-care-providers-america (accessed August 17, 2010).
ACHNE (Association of Community Health Nursing Educators). 2009. Essentials of baccalaureate nursing education for entry level community/public health nursing. Wheat Ridge, CO: ACHNE.
Aiken, L. H. 2010. Nursing education policy priorities. Paper commissioned by the Committee on the RWJF Initiative on the Future of Nursing, at the IOM (see Appendix I on CD-ROM).
Aiken, L. H., S. P. Clarke, R. B. Cheung, D. M. Sloane, and J. H. Silber. 2003. Educational levels of hospital nurses and surgical patient mortality. JAMA 290(12):1617-1623.
Aiken, L. H., R. B. Cheung, and D. M. Olds. 2009. Education policy initiatives to address the nurse shortage in the United States. Health Affairs 28(4):w646-w656.
Alberto, J., and K. Herth. 2009. Interprofessional collaboration within faculty roles: Teaching, service, and research. OJIN: The Online Journal of Issues in Nursing 14(2).
Allan, J., and J. Aldebron. 2008. A systematic assessment of strategies to address the nursing faculty shortage, U.S. Nursing Outlook 56(6):286-297.
Allan, J., J. Stanley, M. Crabtree, K. Werner, and M. Swenson. 2005. Clinical prevention and population health curriculum framework: The nursing perspective. Journal of Professional Nursing 21(5):259-267.
AMCB (American Midwifery Certification Board). 2009. Letter to certified nurse-midwives and certified midwives from B.W. Graves, president, AMCB. http://www.amcbmidwife.org/assets/documents/FINAL%20CMP%20LETTER3.pdf (accessed September 27, 2010).
ANCC (American Nurses Credentialing Center). 2010a. Adult nurse practitioner certification eligibility criteria. http://www.nursecredentialing.org/Eligibility/AdultNPEligibility.aspx (accessed September 27, 2010).
ANCC. 2010b. ANCC nurse certification. http://www.nursecredentialing.org/Certification.aspx (accessed September 8, 2010).
ANCC. 2010c. Clinical nurse specialist in adult health certification eligibility criteria. http://www.nursecredentialing.org/Eligibility/AdultHealthCNSEligibility.aspx (accessed September 27, 2010).
ASTDN (Association of State and Territorial Directors of Nursing). 2003. Quad council PHN competencies. http://www.astdn.org/publication_quad_council_phn_competencies.htm (accessed September 7, 2010).
Barr, H. 2002. Interprofessional education today, yesterday and tomorrow: A review. London: LTSN Hs&P.
Barr, H., I. Koppel, S. Reeves, M. Hammick, and D. Freeth. 2005. Effective interprofessional education: Argument, assumption & evidence. Oxford, England: Blackwell Publishing, Ltd.
Baxter, P. 2007. The CCARE model of clinical supervision: Bridging the theory-practice gap. Nurse Education in Practice 7:103-111.
Benner, P., M. Sutphen, V. Leonard, and L. Day. 2009. Educating nurses: A call for radical transformation. San Francisco, CA: Jossey-Bass.
Berlin, L. E., and K. R. Sechrist. 2002. The shortage of doctorally prepared nursing faculty: A dire situation. Nursing Outlook 50(2):50-56.
Bevill, J. W., Jr., B. L. Cleary, L. M. Lacey, and J. G. Nooney. 2007. Educational mobility of RNs in North Carolina: Who will teach tomorrow’s nurses? A report on the first study to longitudinally examine educational mobility among nurses. American Journal of Nursing 107(5):60-70; quiz 71.
Blegen, M. A., T. E. Vaughn, and C. J. Goode. 2001. Nurse experience and education: Effect on quality of care. Journal of Nursing Administration 31(1):33-39.
Bovjberg, R. 2009. The nursing workforce challenge: Public policy for a dynamic and complex market. Washington, DC: Urban Institute.
Broome, M. E. 2009. Building the science for nursing education: Vision or improbable dream. Nursing Outlook 57(4):177-179.
Carraccio, C. M. D., S. D. M. D. Wolfsthal, R. M. D. M. P. H. Englander, K. M. D. Ferentz, and C. P. Martin. 2002. Shifting paradigms: From Flexner to competencies. Academic Medicine 77(5):361-367.
CCNE (Commission on Collegiate Nursing Education). 2009. Standards for accreditation of baccalaureate and graduate degree nursing programs. Washington, DC: CCNE.
Cleary, B. L., A. B. McBride, M. L. McClure, and S. C. Reinhard. 2009. Expanding the capacity of nursing education. Health Affairs 28(4):w634-w645.
Coffman, J. M., E. Rosenoff, and K. Grumbach. 2001. Racial/ethnic disparities in nursing. Health Affairs 20(3):263-272.
Cronenwett, L. R. 2010. The future of nursing education. Paper commissioned by the Committee on the RWJF Initiative on the Future of Nursing, at the IOM (see Appendix I on CD-ROM).
Cronenwett, L. R., and R. Redman. 2003. Partners in action: Nursing education and nursing practice. Journal of Nursing Administration 33(3):131-133.
Cronenwett, L., G. Sherwood, J. Barnsteiner, J. Disch, J. Johnson, and P. Mitchell. 2007. Quality and safety education for nurses. Nursing Outlook 55(3):122-131.
DeLunas, L. R., and L. A. Rooda. 2009. A new model for the clinical instruction of undergraduate nursing students. Nursing Education Perspectives 30(6):377-380.
Duchscher, J. E. 2003. Critical thinking: Perceptions of newly graduated female baccalaureate nurses. Journal of Nursing Education 42(1):14-27.
Erickson, H. 2002. Concept-based curriculum and instruction: Teaching beyond the facts. Thousand Oaks, CA: Corwin Press.
Estabrooks, C. A., W. K. Midodzi, G. G. Cummings, K. L. Ricker, and P. Giovannetti. 2005. The impact of hospital nursing characteristics on 30-day mortality. Nursing Research 54(2):74-84.
Fagin, C. M. 1986. Institutionalizing faculty practice. Nursing Outlook 34(3):140-144.
Florida Center for Nursing. 2010. Florida nursing education capacity and nurse faculty supply/ demand: 2007-2009 trends. http://www.flcenterfornursing.org/files/2010_Education_Report.pdf (accessed March 29, 2010).
Friese, C. R., E. T. Lake, L. H. Aiken, J. H. Silber, and J. Sochalski. 2008. Hospital nurse practice environments and outcomes for surgical oncology patients. Health Services Research 43(4):1145-1163.
Gilliss, C. L. 2010. Nursing education: Leading into the future. Cronenwett, L. R. 2010. The future of nursing education. Paper commissioned by the Committee on the RWJF Initiative on the Future of Nursing, at the IOM (see Appendix I on CD-ROM).
Gonyea, M. A. 1998. Assessing resource requirements and financing for health professions education. In Mission management: A new synthesis, edited by E. R. Rubin. Washington, DC: Association of Academic Health Centers. Pp. 217-233.
Goode, C. J., S. Pinkerton, M. P. McCausland, P. Southard, R. Graham, and C. Krsek. 2001. Documenting chief nursing officers’ preference for BSN-prepared nurses. Journal of Nursing Administration 31(2):55-59.
Gubrud-Howe, P., K. Shaver, C. Tanner, J. Bennett-Stillmaker, S. Davidson, M. Flaherty-Robb, K. Goudreau, L. Hardham, C. Hayden, S. Hendy, S. Omel, K. Potempa, L. Shores, S. Theis, and P. Wheeler. 2003. A challenge to meet the future: Nursing education in Oregon, 2010. Journal of Nursing Education 42(4):163-167.
Harden, R. M. 2002. Developments in outcome-based education. Medical Teacher 24 (2):117-120.
Harder, B. N. 2010. Use of simulation in teaching and learning in health sciences: A systematic review. Journal of Nursing Education 49(1):23-28.
HRSA (Health Resources and Services Administration). 2004. Supply, demand, and use of licensed practical nurses. Rockville, MD: HRSA.
HRSA. 2006. The registered nurse population: Findings from the National Sample Survey of Registered Nurses, March 2004. Rockville, MD: HRSA.
HRSA. 2010a. HRSA Geospatial Data Warehouse (HGDW). http://datawarehouse.hrsa.gov/nursingsurvey.aspx (accessed September 2, 2010).
HRSA. 2010b. The registered nurse population: Findings from the 2008 National Sample Survey of Registered Nurses. Rockville, MD: HRSA.
IOM (Institute of Medicine). 2003a. Health professions education: A bridge to quality. Washington, DC: The National Academies Press.
IOM. 2003b. Health professions education: A bridge to quality. Washington, DC: The National Academies Press.
IOM. 2009. Redesigning continuing education in the health professions. Washington, DC: The National Academies Press.
IOM. 2010. A summary of the February 2010 Forum on the Future of Nursing: Education. Washington, DC: The National Academies Press.
Ironside, P. 2004. “Covering content” and teaching thinking: Deconstructing the additive curriculum. Journal of Nursing Education 43(1):5-12.
The Kaiser Family Foundation—statehealthfacts.org. 2010. Distribution of medical school graduates by gender, 2009. http://www.statehealthfacts.org/comparetable.jsp?ind=435&cat=8&sub=101&yr=92&typ=1 (accessed September 10, 2010).
Kovner, C., and M. Djukic. 2009. The nursing career process from application through the first 2 years of employment. Journal of Professional Nursing 25(4):197-203.
Kovner, C. T., S. Fairchild, and L. Jacobson. 2006. Nurse educators 2006: A report of the faculty census survey of RN and graduate programs. Washington, DC: NLN.
Kovner, C. T., C. S. Brewer, S. Yingrengreung, and S. Fairchild. 2010. New nurses’ views of quality improvement education. Joint Commission Journal on Quality and Patient Safety 36(1):29-35.
Kowalski, K., M. Horner, K. Carroll, D. Center, K. Foss, and S. Jarrett. 2007. Nursing clinical faculty revisited: The benefits of developing staff nurses as clinical scholars. Journal of Continuing Education in Nursing 38:69-75.
Kreulen, G. J., P. K. Bednarz, T. Wehrwein, and J. Davis. 2008. Clinical education partnership: A model for school district and college of nursing collaboration. The Journal of School Nursing 24(6):360-369.
Kruger, B. J., C. Roush, B. J. Olinzock, and K. Bloom. 2010. Engaging nursing students in long-term relationships with a home-base community. Journal of Nursing Education 49(1):10-16.
Lane, A. 2009. Battle of degrees heats up: Universities, community colleges spar over four-year programs. http://www.crainsdetroit.com/article/20091129/FREE/311299958 (accessed November 29, 2009).
Lasater, K., and A. Nielsen. 2009. The influence of concept-based learning activities on students’ clinical judgment development Journal of Nursing Education 48(8):441-446.
The Lewin Group. 2009. Wisdom at work: Retaining experienced RNs and their knowledge—case studies of top performing organizations. Falls Church, VA.
Lynaugh, J. E. 2008. Kate Hurd-Mead lecture. Nursing the great society: The impact of the Nurse Training Act of 1964. Nursing History Review 16:13-28.
Lynaugh, J. E., and B. L. Brush. 1996. American nursing: From hospitals to health systems. Cambridge, MA and Oxford, U.K.: Blackwell Press.
Manno, B. V. 1998. Vocabulary lesson: Cost, price, and subsidy in American higher education. Business Officer 31(10):22-25.
Mather, M., and D. Adams. 2007. The crossover in female-male college enrollment rates. http://www.prb.org/articles/2007/crossoverinfemalemalecollegeenrollmentrates.aspx (accessed September 10, 2010).
McNelis, A. M., and P. M. Ironside. 2009. National survey on clinical education in prelicensure nursing education programs. In Clinical nursing education: Current reflections, edited by N. Ard and T. M. Valiga. New York: National League for Nursing.
MedPAC (Medicare Payment Advisory Commission). 2009. Report to the Congress: Improving incentives in the Medicare program. Washington, DC: MedPAC.
Minority Fellowship Program. 2010. Background. http://www.emfp.org/MainMenuCategory/AboutMFP/Background.aspx (accessed September 8, 2010).
Mitchell, P. H., B. Belza, D. C. Schaad, L. S. Robins, F. J. Gianola, P. S. Odegard, D. Kartin, and R. A. Ballweg. 2006. Working across the boundaries of health professions disciplines in education, research, and service: The University of Washington experience. Academic Medicine 81(10):891-896.
Moscato, S. R., J. Miller, K. Logsdon, S. Weinberg, and L. Chorpenning. 2007. Dedicated education unit: An innovative clinical partner education model. Nursing Outlook 55(1):31-37.
Moss, H., and M. Weinstein. 2009. Addressing the skills shortage in healthcare through the development of incumbent employees: Hospital employee education and training (HEET) program. Eugene, OR: University of Oregon Labor Education and Research Center.
NBCRNA (National Board on Certification and Recertification of Nurse Anesthetists). 2009. Recertification. http://www.nbcrna.com/recertification.html (accessed September 28, 2010).
NCEMNA (National Coalition of Ethnic Minority Nurse Associations). 2010. About NCEMNA. http://www.ncemna.org/about.asp (accessed July 2, 2010).
NCSBN (National Council of State Boards of Nursing). 2008. Member board profiles National Council of State Boards of Nursing. https://www.ncsbn.org/MBP_PDF.pdf (accessed September 3, 2010).
NCSBN. 2009. NCLEX examination pass rates, 2009. https://www.ncsbn.org/Table_of_Pass_Rates_2009.pdf (accessed March 30, 2010).
NLN (National League for Nursing). 2007. Reflection & dialogue: Academic/professional progression in nursing. http://www.nln.org/aboutnln/reflection_dialogue/refl_dial_2.htm (accessed September 8, 2010).
NLN. 2009. Annual survey of schools of nursing academic year 2008-2009. New York: NLN.
NLN. 2010a. 2010 NLN nurse educator shortage fact sheet. http://www.nln.org/governmentaffairs/pdf/NurseFacultyShortage.pdf (accessed July 2, 2010).
NLN. 2010b. Nursing education research: Graduations from RN programs. http://www.nln.org/research/slides/topic_graduations_rn.htm (accessed September 8, 2010).
NLN. 2010c. Percentage of minority students enrolled in nursing programs by race-ethnicity and program type, 2008-2009. http://www.nln.org/research/slides/pdf/AS0809_F14.pdf (accessed September 5, 2010.
NLN Board of Governors. 2003. Position statement: Innovation in nursing education: A call to reform. http://www.nln.org/aboutnln/positionstatements/innovation082203.pdf (accessed September 27, 2010).
NLNAC (National League for Nursing Accrediting Commission). 2008. NLNAC 2008 standards and criteria. http://www.nlnac.org/manuals/SC2008.htm (accessed March 11, 2010).
NRC (National Research Council). 2005. Advancing the nation’s health needs: NIH research training programs. Washington, DC: National Academy of Sciences.
O’Neil, E. H., and Pew Health Professions Commission. 1998. Recreating health professional practice for a new century: The fourth report of the Pew Health Professions Commission. San Francisco: CA.
O’Neil, E. 2009. Four factors that guarantee health care change. Journal of Professional Nursing 25(6):317-321
Oregon Center for Nursing. 2009. Oregon’s nurse faculty workforce: A report from the oregon center for nursing. http://www.oregoncenterfornursing.org/documents/OCN%20Nurse%20Faculty%20Workforce%20Report%202009.pdf (accessed March 22, 2010).
Orsolini-Hain, L. 2008. An interpretive phenomenological study on the influences on associate degree prepared nurses to return to school to earn a higher degree in nursing, Department of Nursing, University of California, San Francisco.
Orsolini-Hain, L., and V. Waters. 2009. Education evolution: A historical perspective of associate degree nursing. Journal of Nursing Education 48(5):266-271.
Raines, C. F. 2010. The doctor of nursing practice: A report on progress. Paper presented at AACN Spring Annual Meeting 2010.
Reeves, S., M. Zwarenstein, J. Goldman, H. Barr, D. Freeth, M. Hammick, and I. Koppel. 2008. Interprofessional education: Effects on professional practice and health care outcomes. Cochrane Database of Systematic Reviews (1):CD002213.
Rosenstein, A. H., and M. O’Daniel. 2005. Disruptive behavior and clinical outcomes: Perceptions of nurses and physicians. American Journal of Nursing 105(1):54-64; quiz 64-55.
Rosenstein, A. H., and M. O’Daniel. 2008. A survey of the impact of disruptive behaviors and communication defects on patient safety. Joint Commission Journal on Quality and Patient Safety 34(8):464-471.
RWJF (Robert Wood Johnson Foundation). 2010a. Distance between nursing education program and workplace for early career nurses (graduated 2007-2008). http://thefutureofnursing.org/NursingResearchNetwork5 (accessed December 6, 2010).
RWJF. 2010b. Qualified applicants not accepted in Associate (AD) and Baccalaureate (BS) RN programs. http://thefutureofnursing.org/NursingResearchNetwork6 (accessed December 15, 2010).
RWJF. 2010c. Sermo.Com survey data on physicians’ opinions of nurse practitioners and nurses’ educational preparation. http://thefutureofnursing.org/NursingResearchNetwork8 (accessed December 15, 2010).
Sales, A., N. Sharp, Y. F. Li, E. Lowy, G. Greiner, C. F. Liu, A. Alt-White, C. Rick, J. Sochalski, P. H. Mitchell, G. Rosenthal, C. Stetler, P. Cournoyer, and J. Needleman. 2008. The association between nursing factors and patient mortality in the Veterans Health Administration: The view from the nursing unit level. Medical Care 46(9):938-945.
Schaefer, K. M., and D. Zygmont. 2003. Analyzing the teaching style of nursing faculty. Does it promote a student-centered or teacher-centered learning environment? Nursing Education Perspectives 24(5):238-245.
Starck, P. L. 2005. The cost of doing business in nursing education. Journal of Professional Nursing 21(3):183-190.
Sullivan Commission on Diversity in the Healthcare Workforce. 2004. Missing persons: Minorities in the health professions: A report of the Sullivan Commission on Diversity in the Healthcare Workforce. Washington, DC: The Sullivan Commission.
Tanner, C. A. 2007. The curriculum revolution revisited. Journal of Nursing Education 46(2):51-52.
Tanner, C. A., P. Gubrud-Howe, and L. Shores. 2008. The Oregon Consortium for Nursing Education: A response to the nursing shortage. Policy, Politics & Nursing Practice 9(3):203-209.
Tilden, V. 2010. The future of nursing education. Paper commissioned by the Committee on the RWJF Initiative on the Future of Nursing, at the IOM (see Appendix I on CD-ROM).
Tourangeau, A. E., D. M. Doran, L. McGillis Hall, L. O’Brien Pallas, D. Pringle, J. V. Tu, and L. A. Cranley. 2007. Impact of hospital nursing care on 30-day mortality for acute medical patients. Journal of Advanced Nursing 57(1):32-44.
Udlis, K. A. 2006. Preceptorship in undergraduate nursing education: An intergrative review. Journal of Nursing Education 47(1):20-29.
Valberg, L. S., M. A. Gonyea, D. G. Sinclair, and J. Wade. 1994. Planning the future academic medical centre. Canadian Medical Association Journal 151(11):1581-1587.
Van den Heede, K., E. Lesaffre, L. Diya, A. Vleugels, S. P. Clarke, L. H. Aiken, and W. Sermeus. 2009. The relationship between inpatient cardiac surgery mortality and nurse numbers and educational level: Analysis of administrative data. International Journal of Nursing Studies 46(6):796-803.


