
2
Adolescents and the Risks That Affect Them
Broadly speaking, adolescence is understood to mean the period between childhood and adulthood. Although the precise age range it encompasses is debatable, it is agreed that during this period young people experience rapid physical and cognitive growth, reach puberty, and move from the relative security of childhood to confront an array of social and other life challenges. Adolescents are defined here as 10- to 19-year-olds and are currently 13.9 percent of the U.S. population. They are generally healthy, yet an overview of the health status of this demographic group illustrates the breadth of the public health challenge they present.
This chapter begins with a portrait of the health and circumstances of U.S. adolescents and then takes a close look at a few of the most prevalent risks they take—sexual risk-taking, substance use, illegal behavior, and risky driving. The chapter closes with a look at the most common emotional disorders that affect them.
OVERVIEW OF HEALTH AND RISK FACTORS THAT AFFECT ADOLESCENTS
Demographically, adolescents are a changing group, as workshop presenter Robert Wm. Blum explained. In 1980, 80 percent of young people ages 15 to 24 in the United States were white. In 2010, that figure is closer to 60 percent, and by 2040 it is projected to be under 50 percent (Mulye et al., 2009). As in the population at large, the fastest growing group is of Hispanic and Latino origin.
Similar disparities are evident in death rates for different subgroups of teenagers. American Indian/Alaskan native adolescents had the highest rate in 2003 (91 per 100,000), and those of Asian/Pacific Islander descent had the lowest (37 per 100,000). Black youth had the second-highest rate: 82 per 100,000. Deaths in this age group are largely preventable. A total of 75 percent of all deaths in the second decade of life are caused by vehicular injuries, homicide, or suicide, climbing from 47 percent for 10-year-olds to 81 percent for 18-year-olds. Trends in mortality from vehicular crashes support the proposition that many of the risks that affect adolescents can be mitigated through legislative interventions—an important reason to explore risk patterns closely. Deaths from vehicular crashes among young people fell by 38 percent between 1988 and 1992 and have stabilized at approximately 1992 levels. The primary reason, Blum observed, is the 1984 Uniform Drinking Age Act, which required states to raise the drinking age to 21 as a condition of federal funding.
Youth violence is another area, in Blum’s view, in which public policy has an important influence. The United States has a higher rate of deaths by firearm among children and youth than the rates of the next 25 industrialized nations combined. Despite an almost 50 percent decline in the nation’s overall victimization rate between 1993 and 2005, 3.4 million teens annually are victims of violence. Data from the Youth Risk Behavior Surveillance System (YRBSS) also show that, in 2005, 4.2 percent of male adolescents and nearly 11 percent of females reported having been physically forced to have sex, although this type of violence is often difficult to measure (CDC, 2009). One-third of all firearm deaths among young people are self-inflicted. YRBSS data indicate that, in 2005, 17 percent of youth contemplated suicide and 13 percent said that they had made a suicide plan.1
Turning to morbidity, Blum highlighted trends in substance use from the Monitoring the Future survey (http://monitoringthefuture.org). There has been a decline of approximately 20 percent among young people who report having used an illicit substance in the past month: in 2005 that figure was 16 percent, compared with over 19 percent 4 years earlier. Alcohol use has declined from a high in 1979, when more than 70 percent of 12th graders reported having used it in the past 30 days, to just over 40 percent in 2005 (there were similar declines for 8th and 10th graders). Cigarette smoking is at the lowest point since the Monitoring the Future survey began data collection, with 14 percent of 12th graders smoking daily, compared with 24 percent in 1997, for example. In contrast, the use
|
1 |
These data are updated regularly; see http://www.cdc.gov/HealthyYouth/yrbs/index.htm for the most recent statistics [September 2010]. |
of prescription drugs (e.g., OxyContin, Vicodin) by adolescents is showing an upward trend.
Between 1995 and 2007, there was a steady decline in the percentages of both girls (from 51.7 to 46.8 percent) and boys (from 55.3 percent to 46.0 percent) reporting that they had had sexual intercourse (Abma et al., 2004). These rates parallel declines in the rates of teen pregnancy or having caused a pregnancy (Guttmacher Institute, 2010). The largest decline in having caused a pregnancy was among African-American males. However, these declines have reversed in the past 2 years; in 2006, the teen pregnancy rate increased for the first time in more than a decade, rising by 3 percent, and the teen birth rate increased by 4 percent (Guttmacher Institute, 2010). Blum suggested that the apparent increase in unsafe sex indicated by these numbers is a source of concern in part because young people (in this case defined as ages 15-24) account for nearly half of all sexually transmitted diseases in the United States: 4.6 million cases of human papillomavirus, 1.9 million cases of trichomoniasis, and 1.5 million cases of chlamydia, for example (Weinstock et al., 2004).
Another serious health concern for young people is obesity, which increased threefold between 1991 and 1999. Whereas the increase appears to have slowed, in recent studies 31.9 percent of children and youth were at or above the 85th percentile for body mass index (BMI, a formula for calculating a person’s relative weight for their given height). The sharpest increases have been among black and Mexican-American youth. Obesity, a chronic illness that can have profound effects on health as well as social and economic consequences, is likely to be a lifelong problem for those who experience it during adolescence: 80 percent of all young people who are obese on their 18th birthday are likely to remain so throughout their lives. Rates of asthma also increased from the early 1980s through 1995 (with a decline since 1995 that may reflect an altered definition of chronic asthma (Akinbami, 2006).
For Blum, this portrait of the threats to adolescent health underlies the importance of understanding the interrelationships between environmental and individual factors. Adolescents, like younger children, experience high rates of poverty: among all adolescents, nearly 40 percent are either poor or near-poor, and adolescents who are black or Hispanic are twice as likely to be in one of those categories as those who are white. Families living in poverty and in low-income neighborhoods, he pointed out, have fewer financial resources and less social capital (the support of extended family and community networks), while also tending to experience more social disorganization and discrimination—other factors that expose young people to stress and risk. Strong support from and ties to school, family, and community, in contrast, are sources of protection. Individual biological factors, such as brain development (which he noted
to be heavily influenced by the social and physical environments in which a young person lives) and innate temperament, interact with these environmental factors in complex ways. He presented a model (Figure 2-1) to illustrate the way these sources of risk and protection interact, providing a backdrop for detailed discussion of each of these influences.
RISK-TAKING
As the general portrait indicated, a few areas of risk-taking pose the most serious threats to adolescents: sexual risk-taking, substance use, illegal behavior, and risky driving. Each of these behaviors provides an interesting lens through which to examine questions about the influence of environmental and individual factors, so we explore here the prevalence of each of these behaviors among population subgroups and the developmental course typical for each.
Sexual Risk-Taking
James J. Jaccard began with a few comments about research on adolescent sexual behavior. He noted that although there are numerous ways
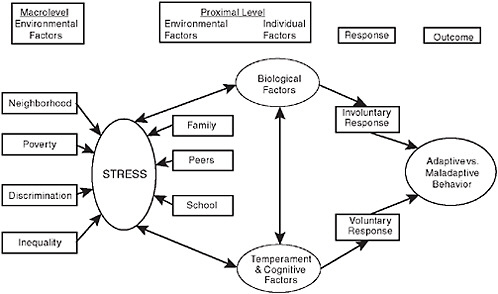
FIGURE 2-1 A model of risk and protection in adolescence.
SOURCE: Blum and Blum, 2009.
to examine what teenagers do and how their behaviors change over time, researchers studying sexuality—recognizing that some sexual behavior is normative and not necessarily risky—have focused on four outcomes: frequency of sexual intercourse, consistency of condom use, number of partners, and age at first intercourse. Other important outcome variables include infection with HIV and other sexually transmitted diseases, abortion, pregnancy and childbirth, and use of other types of birth control. Jaccard suggested that age at first intercourse might be the most important to track because it is predictive of such risks as unintended pregnancy and sexually transmitted disease
Several meta-analyses have shown that various sexual behaviors have intercorrelations of approximately .35, which is about the same as the intercorrelation among other risk behaviors, such as alcohol and drug use or smoking. For Jaccard, this suggests that unique determinants exist for each of these behaviors that must be understood. Another challenge is that much of the research has focused on individuals—their attitudes, normative pressures that affect them, impulse control, religious influences, and so on. Yet because most of the behavior involves the choices of two individuals, it is important to consider the dyad, or couple (even if the relationship is transitory), to fully understand the decisions and behaviors of interest. Sexual behavior is unlike most other adolescent risk behaviors in this regard, and the field, he suggested, needs better models of dyadic influence and decision making if it is to improve intervention strategies.
Prevalence
Jaccard presented data from the YRBSS (CDC, 2009) on the prevalence of sexual risk behaviors that reveal a range of serious public health concerns. More than 2,000 girls ages 15 to 19 become pregnant every day (the annual pregnancy rate is 84 per 1,000). This results in over 1,100 births to girls ages 15-19 each day (an annual birth rate of 40 per 1,000 girls). Among girls ages 14 to 19, 24.5 percent have human papillomavirus, 46.8 percent of high school students have had sexual intercourse, and 14.9 percent have had more than three sex partners. Adolescents attempt to practice safe sex: 61.5 percent reported using a condom the last time they had intercourse, but 30 percent of those reported experiencing a problem or error with its use. The overall effectiveness of the condom as birth control for all ages is 85 percent, and the effectiveness of the birth control pill is 92 percent. Effectiveness rates, however, are significantly lower for adolescents.
Group differences are apparent in these data as well. Jaccard explained that boys take more sexual risks than girls do, noting that they are more
likely to have intercourse during high school and have more partners than girls, while being less likely to say that a condom or other birth control was used the last time they had intercourse. Birth rates are dramatically higher for Hispanic (more than 80 per 1,000) and black (60 per 1,000) girls than for white (just over 25 per 1,000) and Asian girls (just over 15 per 1,000). In other areas, such as number of sexual partners and rates of sexually transmitted disease, black high school students tend to have the highest rates of risk, with Hispanics in the middle and whites at the lower end. There are also regional differences in these data. Pregnancy among girls ages 15 to 19 is most prevalent in the southwestern states. Rates of pregnancy, abortion, and birth for this age group are also significantly higher in the United States than in Sweden, France, Canada, or Great Britain, and Figure 2-2 shows that the United States has a significantly higher birth rate for youth under age 20 than 25 other industrialized nations.
Historical trend data indicate that most sexual risk behaviors began to decline in the early 1990s and then reached a plateau. There is some indication that the declines have actually begun to reverse more recently. Figure 2-3 shows the birth rate to adolescents from 1940 through 2006.
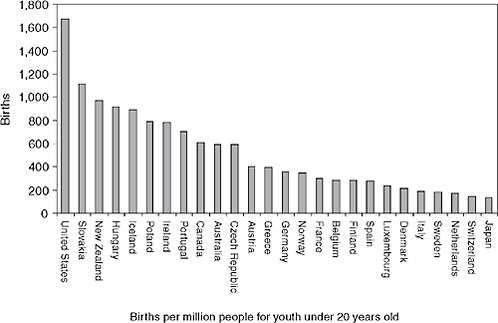
FIGURE 2-2 Country differences.
SOURCE: Jaccard, 2008; Data from UNICEF Innocenti Research Centre. Available online at http://www.nationmaster.com/graph/hea_tee_pre_percap-health-teenage-pregnancy-per-capita (accessed November 10, 2008).
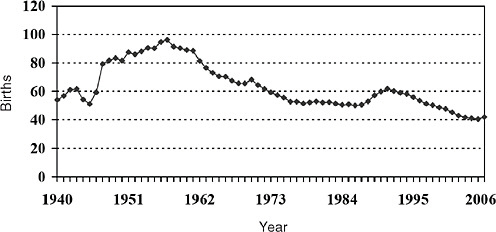
FIGURE 2-3 Historical trends in adolescent birth rates. Number of births per 1,000 females aged 15-19.
SOURCE: The National Campaign to Prevent Teen and Unplanned Pregnancy, 2008. Available online at http://www.thenationalcampaign.org/resources/pdf/TBR_1940-2006.pdf (accessed November 10, 2008).
The rate reached its peak in 1957 and reached a new low for the period measured in 2000.
Trends are similar for the percentage of high school students who have had sexual intercourse, had three or more partners, and report not using condoms. There has been a slow decline followed by a plateau, but researchers have not yet identified the reason for the plateau, Jaccard explained.
Developmental Course
The prevalence of sexual activity increases by about 10 percent in each year of the adolescent period, with about 12 percent of 7th graders reporting having had sexual intercourse, while the figure is more than 60 percent for 12th graders. The peak age for reported first sexual intercourse is 16. Again, there are subgroup differences: Hispanic adolescents start out with lower rates than other groups and then show a big jump in 8th grade, for example. Rates of condom use are lowest in middle school. Young people also report increasing numbers of casual sexual partners with each grade, accelerating after 8th grade; the pattern is similar for pregnancies.
All of these factors suggest to Jaccard that the optimal time for intervention is in early middle school, even though most of the research
focuses on high school–age adolescents. That view is reinforced by data showing declines in some of the factors that help protect teenagers that are accompanied by the increase in risk behaviors. Data from the National Longitudinal Study of Adolescent Health (called Add Health) show, for example, that the number of domains in which parents allow their adolescent children to make their own decisions increases steadily from 7th through 12th grade, as parental monitoring decreases (Guilamo-Ramos et al., 2010). Thus, older teenagers generally have more freedom to explore behaviors of which their parents may not approve. From middle school through high school, adolescents perceive their parents as being less warm and affectionate as they get older, and they are also less likely to say that they feel a part of their schools and communities.
Jaccard closed with a few thoughts about the factors that influence adolescents’ sexual behavior. He noted that researchers have proposed more than 500 possible variables, and the findings are inconsistent. Some studies found that self-esteem is predictive of particular behaviors, and others found that it is not. Some found ethnic differences, and others did not (Jaccard, 2009). What is missing is a framework that could integrate thinking about the most important explanatory variables (such as personality, mental health, substance use, attitudes, cultural norms, and self-efficacy), contextual factors, such as school and family, as well as the theoretical contributions from biobehavioral research and other fields. This integrated approach would be the platform from which to consider ways to change adolescent behavior.
Substance Use
Substance use in adolescence encompasses a fairly wide range of behaviors, Laurie Chassin explained. Adolescents vary in what they imbibe, how much, and how frequently, as well as in the extent to which their substance use causes problems. There are also different stages of adolescent substance use, beginning with initiation or experimentation, in which the largest percentage engages. For some, this escalates to regular use, then to heavy or problem use. For most adolescents, substance use is reduced or stopped in early young adulthood, but for others heavy use in adolescence is the beginning of multiple cycles of cessation and relapse.
These variations in behavior are the key to understanding the primary differences between adolescent and adult substance use, Chassin added. Adolescents, for example, are most likely to try or use multiple different substances, which may complicate analysis, while adults more typically use just one or two. Adults are also more likely to imbibe small quantities on more frequent occasions, whereas many adolescents are engaged in a binging pattern, in which they take in very large quantities on fewer occa-
sions. Although for adolescents the occasions may be less frequent, the high quantity means that for them the risks for a variety of consequences are much greater. Figure 2-4 presents data from the National Survey on Drug Use and Health demonstrating this difference.
It is also important to distinguish between substance use and substance use disorder (SUD), which is a clinical diagnosis included in the Diagnostic and Statistical Manual of Mental Disorders (DSM-IV). Whereas the term “substance use” simply refers to the consumption of an illicit substance (for adolescents under legal drinking age, this includes alcohol), the term “disorder” refers to a pattern of use associated with impairment in which the individual continues to use one or more substances despite noteworthy life difficulties, such as getting in trouble at school or getting caught driving under the influence. The term disorder also refers to substance dependence, in which the individual uses the substance compulsively despite loss of control and recurring life problems, may develop a tolerance (i.e., require increasing doses to get the same effects), and experience withdrawal symptoms when use is discontinued.
Currently, these disorders are treated separately in the DSM, Chassin explained, yet they also represent points on a continuum of behaviors. Another issue in diagnosis is the question of how well criteria developed for adults work in the diagnosis of adolescents. Adolescents and adults, for example, may develop tolerance to particular substances at different rates, and so they may need to be considered differently in diagnosis.
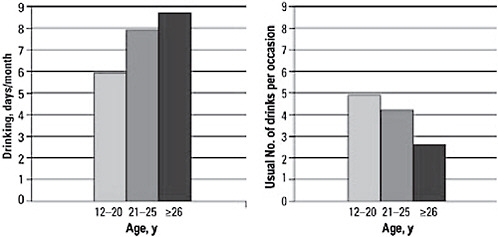
FIGURE 2-4 Compared to adults, adolescents drink less frequently but in higher quantity.
NOTE: Substance Abuse and Mental Health Services Administration data from the 2005 National Survey on Drug Use and Health.
SOURCE: Masten et al., 2008. Reproduced with permission from Pediatrics, Vol. 121, pp. 235-251. Copyright © 2008 by AAP.
Similarly, adolescents may show symptoms of disorder at lower levels of intake than adults. Questions about diagnosis guidelines also relate to questions about the best targets for intervention. Should adults intervene at the first sign of any substance use, or should that decision depend on the child’s age or the type of substance? Would it make more sense to intervene only with adolescents who are showing signs of dysfunction related to substance use?
Prevalence
A look at some of the data on adolescent substance use provides some context for thinking about these questions. Table 2-1 shows the percentages of young people who have experimented with substances (including alcohol, illicit drugs, and also misuse of prescription drugs) by the 8th, 10th, and 12th grades. Use has fluctuated over time, as Figure 2-5 shows.
Recent data on specific substances show some differences, however. Use of marijuana, amphetamines, Ritalin, methamphetamines, crystal methamphetamines, and steroids are declining, for example, whereas use of cocaine, crack, LSD, other hallucinogens, most prescription drugs (sedatives, OxyContin, Vicodin), and cough syrup is unchanged. Use of alcohol and cigarettes is also steady, but use of ecstasy is increasing. Chassin cautioned that fluctuations in these data are common, as new drugs emerge and new generations of young people discover old ones.
Most substance use among young people does not rise to the level of a clinical problem, but substance use disorders are still a substantial public health problem, as Table 2-2 shows.
TABLE 2-1 Percentage of Adolescents Reporting Any Use of Substances
|
Grade Level |
8th |
10th |
12th |
|
Cigarettes |
22.1 |
34.6 |
46.2 |
|
Alcohol |
38.9 |
61.7 |
72.2 |
|
Marijuana |
14.2 |
31.0 |
41.8 |
|
Any illegal substance other than marijuana |
11.1 |
18.2 |
25.5 |
|
NOTE: The most recent data on drug use can be found at http://www.nida.nih.gov/drugpages/mtf.html (accessed September 2010) and http://www.oas.samhsa.gov/nhsda.htm (accessed September 2010). SOURCE: Chassin, 2008. Presentation based on data from Monitoring the Future (data from Johnston et al., 2007). |
|||
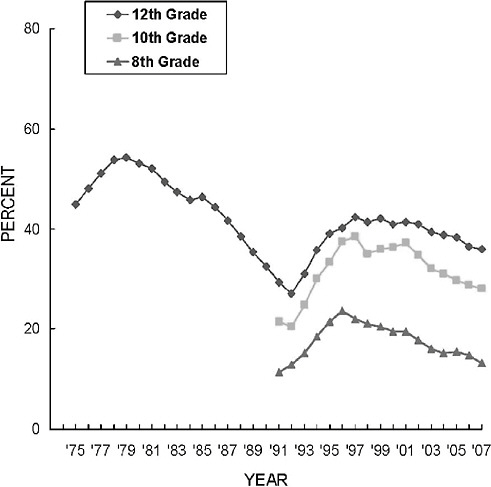
FIGURE 2-5 Trends in annual prevalence of an illicit drug use index: Grades 8, 10, and 12.
SOURCE: Monitoring the Future Study, Institute for Social Research, University of Michigan, Ann Arbor, MI, 2004. Available online at http://ns.umich.edu/?Releases/2004/Dec04/r122104a (accessed November 1, 2008).
Although researchers have documented demographic variations in substance use, the data can be difficult to interpret, Chassin observed. Some correlations among various demographic factors and substance use are apparent, but there are questions about reporting bias. Much of the data, for example, use school-based samples, and significant differences occur in the rates at which students in different demographic groups drop out of school, so data from those who remain in school are not fully representative. Nevertheless, it is clear that the problem is not confined
TABLE 2-2 Percentage of Young People Diagnosed with Substance Use Disorder in the Past Year
|
Age |
12-17 years |
18 to 25 years |
26 years or older |
|
Alcohol |
2.2 |
7.3 |
2.9 |
|
Either alcohol or illicit drug |
3.8 |
11.2 |
3.8 |
|
SOURCE: Chassin, 2008 (data from Johnston et al., 2008). |
|||
to just one or two subgroups, and several differences among subgroups are worth noting.
-
Overall, boys use more substances than girls, although the differences vary with the substance. There is some evidence that girls progress through the stages of use more quickly.
-
Adolescents from families with low socioeconomic status (SES) are more likely to smoke cigarettes than other adolescents, but they are no more likely to use alcohol or marijuana. Researchers have found some evidence that adolescents who live in poverty or in affluence may have higher rates of substance use than those in between.
-
Black adolescents have the lowest use rates, while Hispanics have the highest rates in the lower grades. Because school dropout rates are so high for Hispanics, it may be that their reduced rates in the upper grades reflect their absence from data collection. Trends for white, black, and Hispanic adolescents are shown in Figure 2-6.
-
The differences among these three groups are larger for alcohol use, as shown in Figure 2-7.
Influences and Developmental Course
Apart from possible demographic influences, Chassin identified several interacting influences that appear to increase children’s vulnerability to risky substance use. First, children who experience adverse circumstances, such as prenatal exposure to substances, genetic propensity to addiction and disinhibition, and poor parenting, are more likely to have difficulty regulating their behavior, to be impulsive, and to have poor executive functioning. These children are at heightened risk for school failure, are more likely to be excluded from prosocial peer groups, and to associate with deviant groups that promote substance use. This influence she described as proneness to deviance.
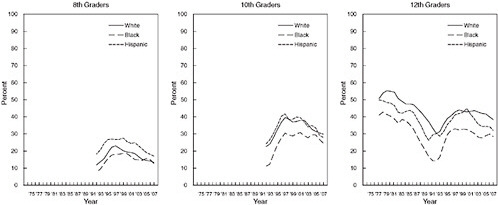
FIGURE 2-6 Any illicit drug: Trends in annual prevalence by race/ethnicity.
SOURCE: Monitoring the Future Study, Institute for Social Research, University of Michigan, Ann Arbor, MI, 2005. Available online at http://monitoringthefuturPercente.org/pubs/occpapers/occ61.pdf (accessed November 1, 2008).
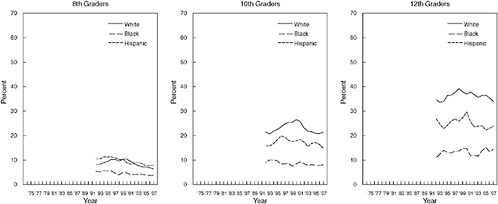
FIGURE 2-7 Alcohol: Trends in 30-day prevalence of having been drunk by race/ethnicity.
SOURCE: Monitoring the Future Study, Institute for Social Research, University of Michigan, Ann Arbor, MI, 2005. Available online at http://monitoringthefuturPercente.org/pubs/occpapers/occ61.pdf (accessed November 1, 2008).
Another influence, which she referred to as negative affect, reflects many factors, including the combination of genetic propensity, temperament, early environmental adversity, and stress that affects some children as they enter adolescence and produces negative affective states. These adolescents are prone to seek out the mood-enhancing potential of substance use. The third influence, or pathway, to risky substance use is the reinforcing properties of many substances themselves, which may reflect individual differences. Adolescents who are either less sensitive to the negative effects of the substance or who experience greater benefits (such as stress reduction) have greater incentives to use it.
These pathways offer some possible explanations for the patterns in the developmental course of both substance use and substance use disorders. The general pattern is that experimentation begins in early adolescence, with use peaking at the period of transition to adulthood, but there is variation in the age of first use, the speed of progression through the stages, and the persistence of use. Chassin noted that early experimentation with substances is linked to many other factors associated with heightened risk. Adolescents in families with a history of substance abuse, for example, are more likely to use substances early and to be diagnosed with a clinical disorder. They are likely to progress to disorder more quickly than other young people, and their substance use is more persistent. These young people are more likely to find the experience pleasant and more likely to have difficulty with developmentally appropriate transition to adult roles. Looking at alcohol specifically, Chassin noted that the younger an individual is at first use of alcohol, the more likely he or she is to develop dependence.
These data strongly suggest to Chassin the value of intervening with young adolescents to prevent or reduce substance use, although a number of questions still need to be resolved. It is not clear whether early onset of substance use is simply a marker for other risk factors. It is also not yet clear how genetic factors and adversity in the environment of infants and young children may affect adolescents’ development, their capacity for self-regulation, and the rewards they perceive from substance use. Adolescents may be more vulnerable than adults to the physical effects of substances, and it is not known whether early substance use affects subsequent psychosocial and physical development.
Illegal Behavior
As with both sexual behavior and substance use, the illegal behavior adolescents engage in encompasses a wide range of acts, as D. Wayne Osgood explained. Some behavior is illegal (delinquent) only if it is done by an individual below a certain age, and even those behaviors vary a
great deal in their seriousness. He also pointed out overlap with the other risk behaviors. Some sexual activity, for example, is illegal because of the ages of the participants, and of course alcohol use is illegal only under a particular age. Osgood focused on more serious crimes that do not fall into those categories.
Prevalence
Law enforcement agencies in the U.S. justice system collect data on reported offenses in two broad categories: violent crimes (homicide, forcible rape, robbery, and aggravated assault) and property crimes (burglary, larceny, motor vehicle theft, and arson). A good deal of additional data are available from self-report studies, in which young people are asked, for example, how many times in the past year they got into a serious fight, took something not belonging to them worth less than $50, or deliberately damaged school property. Using such data, the Monitoring the Future survey (Johnston et al., 2009) shows that 55.3 percent of 18-year-olds had committed at least one of the offenses on the list in the past year. Osgood noted, however, if one uses a long enough list of offenses and a long period of time, that figure could increase to 90 percent because it is the unusual adolescent who never engages in any illegal act—not consuming a single alcoholic drink before age 21, for example, or ever engaging in a prank that results in property damage.
Arrest rates are much lower, totaling 6.6 percent for all categories for youth ages 10 to 17 (and 0.004 percent for murder, 0.25 percent for burglary, 0.8 percent for larceny theft, for example (FBI, 2007). As these data suggest, the most serious and frequent involvement in illegal behavior is concentrated among a small percentage of adolescents. In a study of youth in Philadelphia, for example, Wolfgang and colleagues (1987) found that 6 percent of young men had been arrested five or more times, and that group accounted for more than 50 percent of all arrests among the approximately 10,000 adolescents studied and an even larger share of serious violent crimes. In sum, prevalence of at least some illegal behavior is quite common, but frequent and serious illegal behavior is highly concentrated in a small group.
Prevalence of involvement in the justice system reflects a major domain of consequences of illegal behavior for young people’s lives. Of the 6.6 percent of young people arrested in 2006, 8 percent were sent to adult court and 68 percent to juvenile court, Osgood reported. Generally, approximately 25 percent are released and a little more than half are put on probation. Based on data from 1999, Osgood estimates that approximately 117,000 young people are incarcerated in juvenile correc-
tional facilities at any given time (approximately another 4,000 have gone through adult courts and are imprisoned).2
Historical trends in juvenile crime differ by type of crime, as Figures 2-8 and 2-9 show. For example, burglary declined steadily from 1980 through 2006, whereas overall property crime was steady from 1980 through the mid-1990s and then declined and violence sharply rose and then declined from 1988 through about 2000. Osgood noted that some parallels occur in trends across offenses, such as the broad declines starting in the mid-1990s, but there is no overall trend for risk-taking behavior. Osgood suggested that trends for specific behaviors can be subject to idiosyncratic influences, such as burglary becoming more dangerous over time as increasing numbers of householders have acquired burglar alarms and firearms. Moreover, trends for some aspects of illegal behavior, such
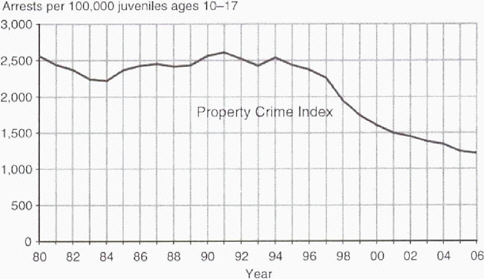
FIGURE 2-8 Historical trends: Property arrests.
NOTE: Analysis of arrest data from the FBI and population data from the U.S. Census Bureau and the National Center for Health Statistics.
SOURCE: U.S. Department of Justice, Office of Juvenile Justice and Delinquency Prevention. Available online at http://www.ncjrs.gov/pdffiles1/ojjdp/221338.pdf (accessed November 15, 2008).
|
2 |
The most recent data on juveniles in residential placement can be found at http://www.ojjdp.gov/ojstatbb/default.asp [September 2010] and http://www.ojjdp.gov/ojstatbb/cjrp/ [September 2010]. |
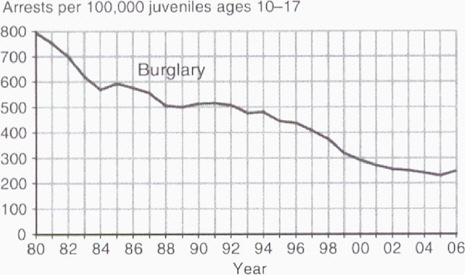
FIGURE 2-9 Historical trends can vary greatly by offense.
NOTE: Analysis of arrest data from the FBI and population data from the U.S. Census Bureau and the National Center for Health Statistics.
SOURCE: U.S. Department of Justice, Office of Juvenile Justice and Delinquency Prevention. Available online at http://www.ncjrs.gov/pdffiles1/ojjdp/221338.pdf (accessed November 15, 2008).
as incarceration rates, may reflect other factors, such as enforcement policies, besides adolescents’ propensity to break the law.
Developmental Course and Demographic Variations
The peak age for arrests across the life span is about 16, although it varies slightly with the type of crime. Figure 2-10 shows the pattern. Osgood noted that self-report data from the National Youth Survey3 about involvement with violent crime show a similar pattern, with the peak slightly higher, at age 17. Describing the developmental course of illegal behavior is complicated for a few reasons, however. First, some of the behaviors in question are interpreted differently in different contexts and at different ages. It is not generally disturbing to see young children take objects or physically interfere with other children. By the mid-teen years, however, most children have long outgrown such behaviors, and those
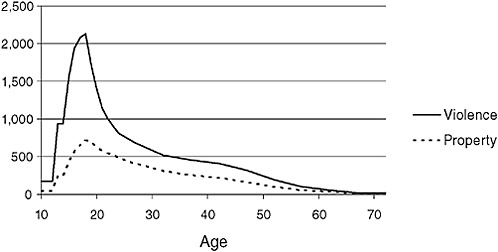
FIGURE 2-10 Arrests per 100,000 by age, 2008.
SOURCE: Osgood, 2008. Data from 2008 UCR arrest data and current population data from U.S. census. Available at http://www.fbi.gov/ucr/cius2008/index.html (accessed November 10, 2008).
who have not are capable of committing more harmful versions of these acts, which can lead authorities to identify them as delinquent. In general, socialization processes succeed in eliminating these behaviors in most children, but even some toddlers may exhibit behavior that is out of the norm and cause for concern.
Osgood explained that individual differences in behavior are relatively stable over the life course and that an early onset of delinquent behavior tends to be associated with serious, long-term illegal offending. However, although it is rare to see a serious adult offender who had not been involved in delinquent behavior as an adolescent, the reverse is not also true. That is, many adolescents who get into serious trouble move away from it in adulthood. The important question, for Osgood, is identifying processes and experiences that lead some to stop serious illegal behavior when others do not.
Rates of illegal behavior (based on arrest reports) differ quite clearly in relation to some demographic variables (including age, as just discussed), and less so in relation to others. Researchers have documented a large difference between the sexes, with young men engaging in higher rates of illegal behavior. The differences are especially pronounced for more serious crimes: young men account for 60 percent of larceny arrests among adolescents, 76 percent of arrests for aggravated assault, and 91 percent of arrests for robbery. African-American youth are more likely than those in other groups to be arrested, and the difference is greatest
for violence, especially robbery, for which their arrest rates are 10 times higher than other groups. (Osgood noted that arrest rates for Hispanic youth are not well documented).
The data on socioeconomic differences are somewhat ambiguous. Self-reported involvement with illegal activities does not correlate strongly with SES, but justice system outcomes do. In other words, Osgood noted, it appears that low-SES young people may not be significantly more likely to commit crimes, yet they are significantly more likely than other youth to be formally punished. He suggested that young people with greater resources are more likely to have parents who intervene, hire lawyers and counselors, and take responsibility for addressing the problem, all of which will be viewed favorably by judges and probation officers.
Osgood also explored other factors that may be associated with delinquency and identified many of the same ones that correlate with other risky behaviors. Looking at personality, he noted that impulsiveness, difficulty with self-control, and sensation-seeking, as well as a negative emotional state and neuropsychological deficits, have all been established as correlating with delinquency. Youth in families in which there is coercive parenting or abuse or other dysfunctional childrearing are at increased risk of delinquency, whereas parental monitoring and warm interfamily attachments are protective factors. Living in economically disadvantaged circumstances increases risk, as does residential instability. Bonding with school and succeeding academically are protective, and spending unstructured time with delinquent friends has a negative influence.
Osgood also pointed out that the strongest correlates of delinquent behavior are other problem behaviors—risky sex, dangerous driving, substance use—especially when they begin early. However, although risk behaviors may tend to cluster together, there are important differences as well. For Osgood, the most persuasive model for thinking about this is that some influences generally predispose young people to take risks and that other factors determine which specific risks individual young people take. He thinks the general factors will be tied to either of two features that are common to all of these behaviors: the willingness to violate conventional rules and norms for behavior and responsiveness to the appeal of taking exciting risks.
Both of these phenomena appear to be amplified when young people spend unstructured, unsupervised time with their peers, and research has supported the association of this kind of time with a variety of illegal and problem behaviors. Osgood noted that the research on this connection has included qualitative and quantitative methods, and it has found an association in many developed nations as well as in a number of preliterate societies. Opportunities for unstructured socializing increase as adolescents get older and then decrease as they become young adults
with greater responsibilities and less leisure time, which matches neatly the developmental pattern of most risky behavior. Osgood sees this as an especially promising avenue for further research and intervention.
Risky Driving
The significance of the risks teen drivers pose is apparent in Figure 2-11, which shows the crash rate by age throughout the life span, and Figure 2-12, which shows the learning curve for newly licensed drivers.4 Teen drivers also pose a threat to others: 45 percent of teenagers ages 13 to 19 who die in vehicle crashes caused by teen drivers are passengers, not drivers. Allan Williams opened his presentation by noting that despite these
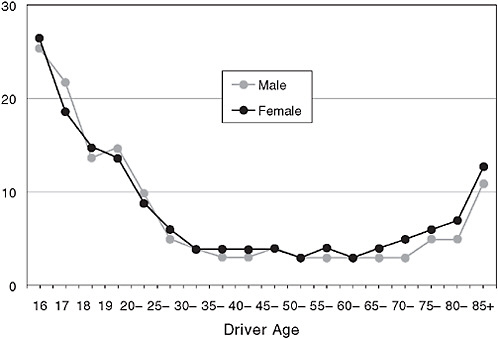
FIGURE 2-11 Young driver crash risk, crashes per million miles, by driver age, 2001-2002.
SOURCE: IIHS (Insurance Institute for Highway Safety). Licensing systems for young drivers. http://www.iihs.org/laws/graduatedLicenseIntro.aspx (accessed October 10, 2008).
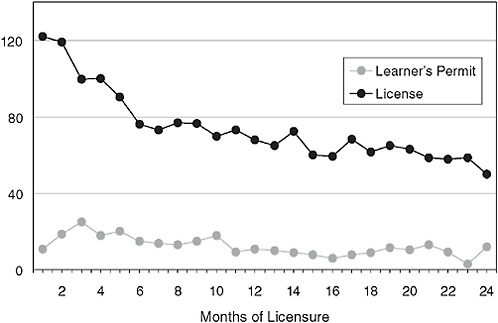
FIGURE 2-12 Crashes by license status and months of licensure per 10,000learner/licensed drivers.
SOURCE: IIHS (Insurance Institute for Highway Safety). Licensing systems for young drivers. http://www.iihs.org/laws/graduatedLicenseIntro.aspx (accessed October 10, 2008).
alarming statistics, teen driving has not been as thoroughly researched as other risk behaviors.
The primary question to be answered is why, specifically, the risks are so high for adolescent drivers. The logical first places to look in answering this question are age and inexperience, but, Williams pointed out, it is difficult to distinguish the relative effect of each because they are very highly correlated. Both come into play in making drivers more likely to take risks and less able to detect and respond to hazards. Studies in other countries, where it is more common to license drivers at age 18, suggest that inexperience is a greater risk factor than chronological age, but it is likely that they interact. Observational studies of crashes and violations have shown that adolescent drivers are more likely to speed, tailgate, and leave too small a gap between their vehicle and the one in front, for example. They also lack the experience that helps older drivers perceive that their speed is too great for conditions or take note of a situation in the middle distance that may require responsive action.
Two conditions that exacerbate the already heightened risk for young and inexperienced drivers—driving at night (limited light and
increased fatigue) and driving with peers (increased distractions) in the car—illustrate the way the risks work. More fatal crashes occur at night for all age groups, but the differences are far more pronounced for drivers under age 30, as shown in Figure 2-13. For drivers ages 16 and 17, the risk of crashing increases rapidly with each additional passenger in the vehicle. That effect is present, but much smaller, for drivers ages 18 and 19, but not for older drivers—indeed, the presence of passengers actually makes older drivers slightly safer. For adults, a passenger can help by reading maps or directions or helping to spot a hazard. For teenage drivers, however, particularly males, peer passengers are a distraction and perhaps a motivation to drive too fast or take other risks.
Adolescents driving under the influence of alcohol receive a lot of public attention, particularly in the spring when proms and graduation parties are scheduled. Adolescents who are inexperienced at both driving and drinking are at heightened risk, and Williams noted that adolescents become impaired with lower blood concentrations than adults do. The rate of adolescent crashes involving alcohol, however, has gone down
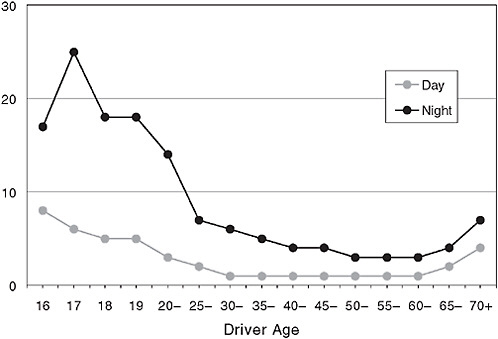
FIGURE 2-13 Night driving risks, fatal crashes per 100 million miles, by driver age, 2001-2002.
SOURCE: IIHS (Insurance Institute for Highway Safety). Licensing systems for young drivers. http://www.iihs.org/laws/graduatedLicenseIntro.aspx (accessed October 10, 2008).
markedly since the early 1980s, during which time the drinking age was raised to 21 in all 50 states and the District of Columbia. In 1982, 41 percent of fatal crashes among 16- and 17-year-olds involved illegal blood alcohol concentration, whereas in 2007 that figure was 18 percent.
Graduated Licensing
Another area of improvement is in driver licensing. In Williams’ view, the prevailing approach prior to 1995 was not effective. Beginners were taught and tested on the rudiments of driving and then given full driving privileges, typically at age 16. Once licensed, drivers who had large numbers of violations or crashes might be identified and have their privileges restricted in some way. In the last 10 years, all states have adopted some form of graduated licensing. The requirements vary but the essential principle is that beginning drivers are given extended opportunities for supervised practice driving so that they do not encounter high-risk driving situations until they have had significant time behind the wheel. Williams noted that graduated licensing is unlike training that uses driving simulators to provide practice in a completely safe environment; rather, it allows learning drivers on the road so they can amass experience with real-world hazards. Research on simulated driving has thus far used only outcomes measured during the simulated situation, Williams noted, so there is no evidence on whether the skills transfer to real-world driving.
States may vary as to where they draw the line between safety and mobility, but all of the graduated licensing plans have the advantage of delaying full driving privileges while adolescents mature. Most have a learner stage of at least 6 months, during which the beginning driver must log at least 50 hours of parent-supervised driving. During the intermediate stage, new drivers may not be allowed to drive unsupervised at night or to transport passengers while driving unsupervised. Full licensure is delayed until age 17 or 18. The range of requirements is shown in Table 2-3.
TABLE 2-3 Core Elements of Graduated Licensing as of 2008
|
Element |
Number of Jurisdictions |
|
Learner period of 6 months minimum |
45 |
|
At least 30 hours of certified practice driving |
34 |
|
Night restrictions |
47 |
|
Passenger restrictions |
40 |
|
SOURCE: Williams, 2008. Data from IIHS (Insurance Institute for Highway Safety). |
|
Many states could do more, Williams suggested, but the benefits have already been dramatic: a 20 to 40 percent overall reduction in crashes in the states and a 42 percent reduction in the nationwide rate of crashes involving 16-year-olds. More significant benefits could come with improved enforcement. Some states are finding that parents are not as compliant as they had hoped and are exploring more stringent penalties and greater police involvement in enforcement.
The question of how to further reduce adolescents’ risk from vehicle crashes points to the gaps in understanding of the risk mechanisms that affect driving. Williams noted that the study of driving has generally not drawn on findings from research on adolescent development and that the model for thinking about teen drivers is fairly narrow and simplistic (NRC and IOM, 2007). Policy makers and driving safety researchers have accepted the idea that teenagers are thrill-seekers and have a limited understanding of risks and their consequences without searching for deeper explanations. The result has been a focus on scare tactics designed to heighten adolescents’ awareness of risks, which, in Williams’ view, have not shown marked success in reducing crash rates.
MENTAL HEALTH RISKS
The mental health status of adolescents relates in various ways to the discussion of each of these risks. Mental or emotional problems may be among the reasons why young people are attracted to risky behaviors, and these problems in turn may exacerbate the risky behaviors. Various mental health problems are also among the possible negative outcomes of some risk behaviors. Daniel S. Pine provided an overview of what is and is not known about the mental health status of adolescents, and his first point was that some disorders are both common and age-related. In a prospective epidemiological study from the United States of diagnosed depression among boys and girls by age, data show that depression rates begin to increase in the early puberty years and increase across the span of puberty, particularly among girls (Glied and Pine, 2002) (see Figure 2-14). Thus, rates of increase in depression are higher for girls than for boys; the same is true for rates of overanxious disorder, although this disorder is actually more prevalent at ages 10 to 13, as Figure 2-15 shows. By contrast, conduct problems are more prevalent among boys.5 These disorders are predictive of a range of risk-taking behaviors. Conduct problems are associated with smoking and substance use, vehicle crashes
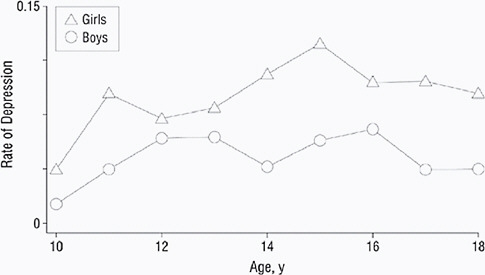
FIGURE 2-14 Adolescent age and rates of depression.
SOURCE: Gleid and Pine, 2002. Reproduced with permission from Archives of Pediatrics & Adolescent Medicine, Vol. 156, pp. 1009-1014. Copyright © 2002 by AMA.
and other impulsive behaviors, and risky sexual behavior. Major depression is predictive of suicide and suicide attempts and possibly substance abuse as well.
In Pine’s view, not nearly enough is known about the treatment of these disorders. He noted that early treatment for conduct disorder appears to be more effective than treatment that begins later. More worrisome is the treatment picture for depression. The suicide rate for both boys and girls ages 10 to 19 has declined since the late 1970s, but rates
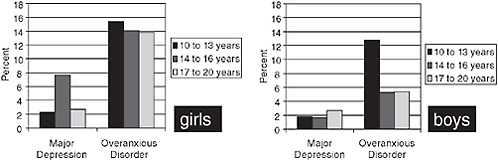
FIGURE 2-15 Age-related changes in prevalence.
SOURCE: Pine, 2008. Data from Cohen et al., 1993.
for both sexes began to increase in 2003 (Bridge et al., 2008). The causes behind both these trends remain poorly understood, raising questions about how best to treat children and adolescents who are at risk for suicide. This relates to broader questions about the underlying causes of mental health problems in children and adolescents. In the area of depression, one particularly vexing puzzle is that, although depression is more prevalent among girls, rates of completed suicide are higher among boys. As noted above, another important puzzle is that researchers have not been able to pinpoint the reasons for either the several-decade downward trend or the recent upswing. Some have suggested that suicide rates increased when the utilization rates for antidepressant medications went down, but there is no firm evidence for that explanation.
A related question is how likely mental and emotional disorders are to persist past adolescence, and here, Pine indicated, the picture is mixed. For example, he pointed out that diagnosis rates for anxiety are quite high among adolescents: in one study of adolescent boys, 253 out of 670 study participants had a diagnosed anxiety disorder (Pine et al., 1998). Their disorder was more likely to persist to age 22 among youth with larger numbers of symptoms, but there was no threshold number of symptoms that identified the young people at highest risk. Nevertheless, of the 253 with a diagnosed anxiety disorder in adolescence, 191 no longer had any form of mood or anxiety disorder by age 22. Pine suggested that the pattern is similar for other disorders, including schizophrenia and substance use: although problems are common during adolescence, most young people are resilient and stop showing symptoms by early adulthood. The adolescents with the most persistent problems account for the majority of chronically afflicted adults. Hence, understanding the factors that differentiate adolescents who are resilient from those who manifest persistent problems is of major public health importance. Not only will answers to these questions benefit youth, but they also will dramatically affect understanding of chronic mental illnesses, as they manifest throughout life.
For Pine, this pattern highlights the importance of resilience. He noted that brain research has yielded valuable information about the mechanisms of fear and anxiety that offers promise for research on the relationship between brain activity and various disorders. Since much is known about the neural correlates of fear and anxiety in various mammalian species, the detailed knowledge acquired in research with animals can be readily applied to questions about humans. Pine noted, for example, that research has identified functional differences between adolescents who are anxious but not depressed and those who are depressed, suggesting that many mental health disorders are the result of distinct disruptions or problems in neural circuitry (Beesdo et al., 2009). This issue is addressed in Chapter 3.
For Pine, several important questions cannot yet be answered. At this point, at least from a biological or neuroscience perspective, there is no scientific way to distinguish “normal” adolescents from “abnormal” ones. Some behaviors put adolescents at risk, but the thresholds that are used to distinguish between adolescents whose behavior is abnormal and are therefore in need of services, and those whose behavior does not cross that threshold, are arbitrary. These thresholds are not derived from or associated with particular patterns of brain function that have been observed—currently there is no scientific basis for identifying a threshold at which behaviors cross into a dysfunctional or disordered zone for any particular behavior. Classifying behaviors as normal or abnormal is a judgment that inevitably reflects the context in which the behavior occurs. As a result, identifying a level of risk or type of behavior that is tolerable or problematic is not obvious.
It is similarly difficult to pinpoint the age at which the problems of adolescence begin. There is clear indication that negative experiences in the first years of life can have long-lasting impact; less clear are the optimal times to intervene to prevent risk behaviors in adolescence. It is also difficult to distinguish the problems that are likely to be transient—as the majority are—from those likely to cause lasting harm.
It is also not yet clear how to use new information on neural function. Brain research is likely to offer intriguing ideas for new treatments, which can then be refined and developed using currently available approaches. Nevertheless, Pine thinks that it will be a long time before what has been learned will change the way individual children are diagnosed and treated. Finally, he observed that little is known about the long-term effects of treatment. Some researchers have reported that when early interventions are successful, they can have surprisingly broad effects, yet frustratingly little basis now exists for decisions about when and how to intervene and with which children.
SUMMARY
The presentations and discussions highlighted key points about the most prevalent adolescent risk behaviors. First is the importance of understanding the interrelationships among the environmental and individual factors that affect adolescent behavior. The familiar cluster of risk factors—living in poverty, dysfunctional family patterns, substance use in the home—appears to be associated with each of the risk behaviors, although the precise mechanisms have not been systematically traced. Impulsiveness, difficulty with self-control, and sensation-seeking—characteristic of all adolescents to some degree, but of some more than others—also seem to be associated with most risk behaviors. Risk behaviors themselves also
tend to cluster together, several participants and discussants noted, with young people who experiment with substance use being more likely to engage in risky sex, for example. However, it is equally important to note that there are significant variations among and between groups of youth (e.g., by culture and ethnicity) in the way risk behaviors cluster and that various risk behaviors have both common and unique correlates.
It seems likely that other variables, such as personality and innate temperament, cultural norms, and brain development, may also play a part in determining how individual adolescents behave, and these factors are discussed in the following chapters. One hypothesis put forward several times was that some young people are predisposed by a range of factors to take more risks than others. It is their own combination of traits and the contexts in which they live that point them toward particular risk behaviors and shape their outcomes. A number of participants cited this view as reason for supporting early interventions that have the potential to counteract risk factors, perhaps even before it is clear which young people will struggle.


