
6
Transitioning to a Sustainable Energy Economy
A sustainable energy economy is one that reliably meets demand at reasonable cost and accounts for externalities that are not reflected in the current cost of fossil-fuel energy (e.g., NRC, 2010a; Tester et al., 2005). No single technology, renewable or otherwise, will be sufficient to satisfy these conditions on its own, so we will need a portfolio of energy options. Moreover, new technologies must be incorporated into society, and so, beyond conversion efficiency and price per kWh, there are several factors to consider in attempting to increase the share of renewable power in both countries’ generation portfolios.
In this chapter, we examine U.S.-Chinese cooperation in the context of integrating a variety of technologies into a cohesive energy system. We will also discuss some of the “enablers” of renewable power and identify barriers to the proliferation of renewables that will have to be overcome in the medium (2020 to 2035) and long term (to 2050).
MOVING TOWARD INTEGRATED SYSTEMS
Aligning Energy Efficiency and Renewable Energy Goals
For the next decade, deploying energy efficiency technologies will be the lowest-cost option for moderating energy demand (NAS/NAE/NRC, 2009a; 2010b), that is, reducing the amount of energy input required to deliver an expected level of service. Improvements in energy efficiency might even make it possible to delay, or eliminate, the need for new generation in some regions (NAS/NAE/NRC, 2010b). In the context of an integrated, sustainable energy
economy, energy efficiency can offset the typically higher costs of energy from cleaner, mostly renewable, generation technologies.
Consider for example, the state of Hawaii, which intends to reduce electricity usage by 30 percent by 2030 while providing 40 percent of the remaining generation through renewable resources. If current energy use is 14,300 GWh, the 2030 goal would be met by reducing annual consumption by 4,300 GWh, and by serving 40 percent of the remaining load (4,000 GWh of 10,000 GWh total) through renewable power generation. Aligning energy efficiency strategies with longer term renewable energy goals effectively increases the share of renewables in the generation portfolio. Unless the rising demand for energy is addressed, increases in renewables and other clean energy options could be offset by even more rapid increases in primary energy demand, with the balance being met by fossil fuels.
China has put energy efficiency at the forefront of its policies to improve energy security, alleviate pressure on domestic resources (particularly coal and water for thermal power generation), and reduce environmental impacts as its economy expands. Energy efficiency and conservation are now a top priority in its energy planning and industrial development strategies, as reflected in its goals to reduce energy intensity (energy consumed per unit of GDP) by 20 percent from 2005 by the year 2020. Each province and major municipality has been assigned a reduction target ranging from 12 to 30 percent.
China has recognized that more efficient use of energy at the household and company levels translates into financial savings over time. Such savings could offer a significant offset to the higher cost of generating renewable energy (NAS/ NAE/NRC, 2010a). In other words, if energy efficiency technologies can capture cost savings in the near term, they can act as a bridge to the deployment of more costly renewable energy technologies that could ultimately supplant conventional fossil-fuel generation.
Modernizing the Grid
A modernized grid is widely considered an essential component of a sustainable energy infrastructure (see Chapter 3 for a technical discussion of devices that comprise a modernized grid). The existing grids in both the United States and China are typically considered impediments to the accelerated deployment of renewables, because it is expensive to upgrade them in order to accept and balance large shares of electricity from variable-output sources like solar and wind energy. Both countries continue to make sizeable public investments (more than $7 billion each for 2010 [Zprýme, 2010]) in next-generation grid technologies, and China is spending nearly 10 times that amount ($70 billion from its economic recovery package) on new high-voltage transmission infrastructure (Robins et al., 2009). In addition, because a substantial portion of China’s electricity grid has yet to be built, certain regions in China could potentially “leapfrog” to a modern
grid system and effectively become experimental sites that would inform grid retrofitting efforts in the United States.
A modernized grid would have three distinct advantages for the integration of renewables. Most important, it would lead to more effective demand management by enabling load-shifting or dispatchable demand to smooth out peaks or take advantage of off-peak wind generation. Second, a modernized grid could facilitate the proliferation of distributed power generation, which would enable local and on-site generation (e.g., even for a single building) based on clean energy. As discussed below, distributed generation has the advantage of allowing for rapid deployment of renewables while minimizing the challenges associated with the zoning or new transmission lines required to integrate these sources directly into the existing distribution system. Third, a modern grid would make it easier to incorporate energy storage technologies and other integration services into the system itself to help optimize overall system performance. Utilities will not necessarily have to add storage for variable-output generation (e.g., backup for every wind turbine) as long as there are other options in the system to balance variability and maintain reliability. Cost-effective energy storage would also allow a utility to optimize available resources and dispatch electricity to correspond with demand, enhancing the value of installed wind turbines and other variable-output generators, as well as the value of the transmission lines.
The Tehachapi Wind Resource Area provides an example of how some of these elements would need to come together to support large-scale wind farms. Current estimates for wind power development in the Tehachapi region total 4,500 MW. Roughly 13.5 GW of storage capacity would be needed to capture three hours of generation if the region’s wind resources are fully developed, and the wind farms are operating at full capacity. Alternatively, demand might be dispatched to use available wind. Finally, as a last resort, some of the turbines may need to be curtailed if alternate options are not in place to make use of the power when it is generated.
Distributed Generation
A major benefit of many renewable power generation technologies is that they are modular, which means they can be deployed at small scales (e.g., on individual buildings) and within existing distribution networks, provided that they include appropriate controls to maintain voltage. They are also appropriate for small, off-grid applications. Because most of China’s early experience with the deployment of renewable energy systems has been to supply remote rural areas, the country has become a leader in small-scale hydropower, solar water heating, biogas digesters, and micro-turbines for wind energy conversion. Despite rapid urbanization in China, the population is still nearly 60 percent rural, and a substantial portion of that population has limited access to electricity. Thus, distributed generation will continue to be a priority in the countryside, and renewable power
technologies will enable rural communities to harness locally available, clean energy resources.
Most current off-grid systems in China are powered by a single resource, such as wind, and many of these systems include energy storage. As China builds and maintains these systems, there will be opportunities to (1) build hybrid systems that draw on more than one resource to optimize electricity availability, (2) incorporate storage capabilities, and (3) develop appropriate controls to maintain reliability. Given the unique attributes of these off-grid systems (including sustained national and international investment), they might even be preferable to grid interconnections (which are constrained by prevailing electricity rates and possible disruptions to the grid) as proving grounds for hybrid systems and storage technologies.
Solar technologies are good candidates for distributed generation. China is the world leader in the manufacture and deployment of solar water heaters, which are now often more cost effective than gas water heaters—these technologies are not used for generation, but the lessons in terms of incentivizing deployment at a household- or individual consumer-level may transfer to rooftop PV. In the United States, utilities have offered programs (e.g., net metering) to encourage households to deploy rooftop PV systems. Recently, utilities have worked directly with commercial and industrial sites to lease rooftops and open areas to deploy PV systems; this helps utilities in warm climates to meet peak demand and can delay or eliminate the need to build new natural-gas peaking plants. China has been a leader in combined heat and power (CHP) technologies, although so far these have typically been coal- or gas-based systems. An area for future research will be to develop renewable-energy-powered systems that can provide heating, cooling, and electricity on a building or neighborhood scale. Fuel cells are already used in CHP applications and can use renewable fuel, and solar technologies are another suitable candidate for CHP.
Distributed generation can play an important part in the transition to a sustainable energy infrastructure. It offers advantages for utilities, which will be able to incorporate new renewable capacity without the challenges associated with zoning and permitting an entirely new site for development. In addition, the close proximity of electricity generators to electrical loads will reduce some of the costs associated with renewables, such as transportation costs and transmission line power losses. For example, in China today, electricity is relatively expensive along the coasts because of the high costs of transporting coal from distant locations. Finally, distributed generation could make the electrical system more resilient, which is a desirable quality for both utility operators and customers. This will depend on the specific technology and the local distribution grid characteristics. Distributed systems tend to be more costly, on a per watt basis, than central station or bulk renewable supplies, but this is highly dependent on the existing infrastructure, retail rates for electric power, and other factors. Ultimately, cost effectiveness and reliability concerns will dictate the deployment of
renewable distributed generation and storage, vis-à-vis fossil-fueled alternatives or extensions to existing transmission and distribution networks.
Electricity-Powered Transportation
Both the United States and China have shown an interest in electricity-powered vehicles as a means of reducing harmful mobile source emissions, gaining a competitive edge in the growing market for manufacturing vehicles, and reducing dependence on petroleum. Electrifying transportation systems could also reduce some of the volatility associated with fuel prices. Although retail electricity prices would still fluctuate based on the time of day, aggregate demand, and other factors, producing a larger share of energy domestically could reduce some of the risks associated with dependency on a complex, global value chain for oil imports.
Electricity-powered transportation systems also have distinct advantages for an integrated, sustainable energy economy. Although vehicle-to-grid storage is not possible with today’s electric vehicles, batteries, and grid infrastructure, a network of electric vehicles can (1) act as a network of distributed charging loads that can be turned on and off, and (2) through proper communications systems take advantage of wind resources, which tend to be more prevalent at night (when many vehicles should be more optimally recharging).
As many studies have shown, because disruptive technologies, such as renewable power generators, do not necessarily follow the standard evolutionary path (e.g., Christensen, 1997; NRC, 2009b) they may gain traction in new markets before they actually displace incumbent technologies. Electrifying the transportation system in the United States or China that includes personal vehicles (e.g., plug-in electric vehicles [PEVs]), public transit, and other transportation modes (e.g., electric-powered bicycles, which are already widely used in Chinese cities), would create a potentially enormous market for power generation. Whether this new electricity demand would cause reliability issues and significant cost increases depends on charge management. Therefore, it will be important to develop rates and programs that encourage vehicle charging when it is optimal for the system. Otherwise, PEVs could add additional peak load, increasing burdens on infrastructure and overall costs.
There are numerous economic and technical challenges to electrifying the existing transportation infrastructure in the United States (NRC, 2010c) and the large and rapidly expanding transportation infrastructure in China. There are also competing alternatives to electrified transportation, including improved internal combustion engines and hydrogen fuel cells. Thus a diversified portfolio of transportation technologies may be a more likely scenario (NRC, 2008, 2010c) than a wholly electrified system. An NRC (2010c) study estimates that, by 2030, 13 to 40 million PEVs could be part of the U.S. vehicle fleet of 300 million and that the costs and deployment of PEVs will depend largely on battery costs
(although charging vehicles at night to reduce grid congestion and use off-peak power generation and other considerations would become increasingly important). Additional factors such as government incentives, oil prices, and environmental legislation will likely affect the deployment of PEVs.
According to Huo et al. (2010), widespread electric vehicle use in China, in the absence of corollary efforts to reduce air pollution from the power generation sector, could have unintended environmental impacts, even though electric vehicles would contribute to improvements in urban (i.e., local and regional) air quality where vehicle exhaust from internal combustion engines is now a major pollutant. Nevertheless, the authors suggest that China proceed with electrification programs in regions where clean, low-carbon energy sources are available. They also recommend that power-sector and transportation-sector policies be coordinated, even though power-sector reform tends to be slower than changes in the transportation sector because of the comparatively long lifespan of existing capital stock. Reforming these two sectors concurrently, they argue, would link the potential benefits to human health and the environment.
Urban Development
More than 80 percent of the U.S. population is urban, and U.S. cities consume approximately 75 percent of the nation’s energy and are responsible for a similarly large share of greenhouse gas (GHG) emissions (Grimm et al., 2008). China now has more than 500 million urban residents, and that number is increasing rapidly. Cities are “concentrations of buildings and associated infrastructure, and the built environment, a key consumer of materials and energy, offers many opportunities for savings” (WRI, 2005). Thus efforts to build a sustainable energy economy can make considerable progress by addressing the needs of cities.
Although the effects of conventional energy use are felt on a regional and global scale, many opportunities to reduce the impact of energy consumption, in part by incorporating more renewable energy, will be on the local level (NAE/ NRC/CAE/CAS, 2007). In addition to growing concerns about human contributions to climate change, cities must respond to concerns about air quality, rising energy costs, traffic congestion, and many other issues that can be addressed, at least in part, by pursuing a more sustainable energy strategy.
Technology-based solutions will be important for changing this scenario, but behavioral changes are also a major potential source of improvement, and cities can be catalysts for these changes. Cities are already making changes through policies for purchasing renewable power, the judicious use of incentives and regulations to engage the private sector in developing renewables, and land-use decisions that can impact a city’s energy profile.
Rizhao, China, is an example of a city where some of these factors—local and provincial government financial support for solar R&D, local industries availing themselves of these incentives, and political leadership committed to deploying
the new technologies—have converged. This northern Chinese city of 3 million inhabitants uses solar technologies for almost all of its heating (buildings and water) and much of the city’s outdoor lighting (Bai, 2007). In the United States, Austin, Texas, Berkeley, California, and Madison, Wisconsin, also have very aggressive renewable energy programs, policies, and incentives that have greatly accelerated renewable energy development. The U.S. Department of Energy (DOE) Solar America Cities Program is working with many city governments to expand urban renewable energy development.
Cities are also well positioned to educate their communities on sustainable energy use. Public education can build support for local strategies and pressure state and national officials to adopt policies that promote sustainable energy use. Local projects to develop renewable energy can show what is possible, at what cost, and with what trade-offs (IEA, 2009). Studies have shown that cross-city learning is very important for spreading knowledge about developing cleaner energy systems (Campbell, 2009). Thus the systematic accumulation and generation of transferable knowledge from successful experiments can be extremely effective in moving toward a sustainable energy economy (Bai et al., 2010).
TRANSFORMING THE ENERGY SYSTEM
The relationship between technology and society, referred to as a sociotechnical system (Emery and Trist, 1965), has significant implications for increasing the presence of renewable energy technologies. Although substantial progress has been made in renewable-energy-related technologies, studies show that changes in the energy system as a whole are a “slow, painful and highly uncertain process” (Jacobsson and Johnson, 2000). Meaningful transformation will only be made when technologies that change current practices are actually adopted and accepted by society.
The high cost of renewables (e.g., capital requirements for generation technology, the need for new transmission lines, or the price per kWh) is often cited as an impediment to their growth and is often compared to the cost of coal-fired baseload generation. For both China and the United States, hydropower, and more recently, wind power and geothermal, are the most economic renewable power sources. In China, biopower is 20 percent more expensive than coal, and solar power can be up as much as 10 times as expensive. In this section we look into the interrelated roles of governments, public and private research, and society in transforming energy systems in the United States and China.
Shaping a Clean Energy Market
Market mechanisms alone cannot transform the existing energy system, and technological solutions are insufficient unless they are accepted or incorporated into society. Arguably, a fundamental challenge for both the United States and China is
that, because of past subsidies and abundant domestic reserves of fossil fuels, the public continues to expect “cheap” energy, which puts almost every less-established technology at a disadvantage (IEA, 2010c; Weiss and Bonvillian, 2009). Chapter 5 described one approach to addressing this, by mandating a specific amount of renewables be included in the generation portfolio. The following section details some other, economy-wide reforms that would impact renewables.
Intervening in Energy Pricing
The rationale for government intervention in energy prices is that businesses make decisions based on the market price of energy, which may not include the costs associated with environmental damage, climate change, energy security, and other externalities (NRC, 2010a). As a result, most businesses opt not to implement technologies that are socially efficient because, they argue, the private return is too low. The primary mechanisms to adjust for this, or “to level the playing field” for clean energy options (including energy efficiency), are direct energy taxes, cap-and-trade or cap-and-dividend programs, and targeted subsidies (or reductions in subsidies for less desirable forms of energy). All of these mechanisms affect the proliferation of renewables in the marketplace, but to varying degrees.
Carbon Taxes. Taxes involve setting a price signal and letting industry choose the means of reducing energy consumption. A carbon tax affects the use of equipment and systems already in place and provides incentives for the adoption of new technology and operational efficiencies. Taxes send a clear, transparent, policy message that the purpose of the additional costs is to accomplish societal goals. The response to such a tax, however, is uncertain, and empirical estimates of elasticities (the ratio of change in price to change in demand) are not precise enough to predict the resultant energy savings.
A carbon tax may not provide sufficient incentives for technology development, particularly given the political difficulties associated with implementing a high enough tax to provide a significant incentive. In addition, although a carbon tax may lead to immediate savings if owners of existing plants and equipment reduce their energy consumption, it will nonetheless impose costs that were not anticipated when the investments in technology and vehicles were put in place, raising issues of equity. These issues could be addressed by phasing in the tax on a preannounced schedule.
Cap-and-Trade Systems. As of July 2010, Congress is considering enacting a “cap-and-trade” system to cap GHG emissions1 at a predetermined level and
issue a number of permits equal to that cap. Controlled entities, such as electric utilities and oil refineries, would have to surrender a permit for each ton of CO2 emitted. Because the permits could be traded, an entity could choose to reduce its own emissions or buy permits from a permit holder willing to sell, depending on the average total cost. The market price of permits will be reflected in the cost of production and ultimately passed on to the consumer. In some sectors, the permit price would have the same effect as an energy tax.
Targeted Subsidies. Both China and the United States have a precedent—sulfur dioxide (SO2) pollution—for correcting market failures in the energy sector (NAE/NRC/CAE/CAS, 2007). The United States used targeted technological solutions (mostly SO2 scrubbers and fuel switching) to force dramatic reductions in emissions, a pattern China is now following.
Subsidies, either in the form of direct price supports for renewable energy, or indirect supports through reductions in subsidies for other forms of electrical generation, are another pricing tool. The U.S. federal government already uses subsidies to affect prices. Over the course of seven years, 2002 to 2009, there were $72 billion in subsidies for fossil fuels and $29 billion for renewables (ELI, 2009). The difference in magnitude is important, but as was pointed out in Chapter 5, another crucial aspect of subsidies is their consistency over the long term. In this case, that consistency, or lack of it, deepens the divide between the subsidies. Many of the largest subsidies for fossil fuels were written into the U.S. tax code, while subsidies for renewables were passed as temporary initiatives2 (Bezdek and Wendling, 2006, 2007). It is also significant that about half of the subsidies for the renewable sector were for corn-based ethanol.
China has a similar history of subsidies for coal, electricity, and petroleum. The central government regulates all energy prices, and these subsidies have been upheld as indirect support for energy-intensive heavy industries in China as well as a way to moderate consumer inflation. In 2008, some price controls were relaxed, these subsidies continue to be a subject of debate and, to the extent that they keep fossil fuel-derived power prices artificially low, they will continue to put new renewable power generation at a disadvantage.
Bringing Clean Energy into the Mainstream
There are several contemporary examples of renewable energy technologies that struggle in the marketplace for non-technical reasons. For example, wind farm developments have been delayed because of aesthetic concerns, and waste-to-energy facilities have been opposed on the basis of environmental injustice.
|
2 |
For example, federal tax subsidies for intangible drilling expenses for oil and natural gas have been a permanent fixture of the U.S. tax code for more than 60 years. Subsidies for renewables, such as the production and investment tax credits (see also Chapter 5 discussion) have lapsed and been reinstated several times in the past decade. |
Historically, the siting and construction of transmission projects have aroused a great deal of public and political opposition, and the debate has been reopened in the context of new transmission primarily for renewable power projects.
For renewables to achieve a substantial share of overall electricity generation, the industry will have to penetrate the mainstream energy markets in both the United States and China. However, until very recently, renewable power was typically referred to as a niche industry. Renewables might achieve mainstream status by steadily increasing market share. In the meantime, advocacy groups, professional societies, and industry associations in the United States and China are working to accelerate this trend by convening groups, disseminating information, lobbying policy makers, and sometimes conducting R&D (e.g., the Electric Power Research Institute [EPRI] in the United States).
In the United States, every major source of renewable power has a trade organization with tens of thousands of members. In China, the two largest industry associations are the Chinese Wind Energy Association and its parent organization, the Chinese Renewable Energy Society. The American Council on Renewable Energy (ACORE), established in 2001, now has almost 1 million paying members and recently created a U.S.-Chinese program as its flagship international effort to promote direct links between industry leaders in both countries. The impact of these organizations is difficult to quantify, but their rapid growth is an indicator of the increasingly prominent role that renewable energy is playing in matters of economic development and energy policy.
Strengthening Innovation
United States
Innovation in renewable energy has generally been linked to energy prices (Weiss and Bonvillian, 2009). In the United States, energy R&D in general has been greatly influenced by the prevailing price of oil (and thus the perceived need for innovation in energy efficiency and alternative sources). The decline in U.S. federal spending on energy R&D has been well documented (e.g., Dooley, 2008; Kammen and Nemet, 2005; Margolis and Kammen, 1999). Dooley (2008) notes that since the mid-1990s, energy R&D has accounted for only 1 percent of federal R&D expenditures. Margolis and Kammen (1999) suggested that cutbacks, which began around 1980 following the energy crisis in the late 1970s, would undermine innovation capacity in the energy sector.
Various reviews of federal investments in clean energy R&D have advocated dramatic increases, on the order of $15 to $30 billion per year (Duderstadt et al., 2009; Kammen and Nemet, 2005; Nemet and Kammen, 2007). As a reference point, in 2009, even with the one-time infusion of funding from the American Recovery and Reinvestment Act, the Department of Energy’s R&D budget totaled about $9.5 billion. Moreover, this budget is split among defense (~37 percent),
basic science (~42 percent), and energy (~21 percent), with applied energy R&D totaling $2.27 billion for the fiscal year 2010 (AAAS, 2010). Overall, investment in renewable energy research has not been sufficient to support massive deployment at sufficiently low-cost (NRC, 2000; NSB, 2009). In some industries, such as chemicals and electronics, private companies fund most R&D—in the United States, federal R&D funding in these sectors represents ~1 percent and ~0.5 percent, respectively (NSB, 2010). Private companies in these and other industries have typically exhibited higher R&D spending/sales ratios (~8-10 percent) than energy utilities (~0.5 percent). Direct government funding cannot make up for this shortfall, but governments can provide leverage directly (through additional investment in pre-commercial R&D) and indirectly (e.g., tax credits for private R&D spending).
Public and private R&D has tended to emphasize incremental improvements in commercialized or ready-to-be-commercialized renewable energy technologies. Government support has also tended to be technology-specific, focusing on advancing wind turbines, for example, along a cost/watt curve. Because of the abundance of solar energy, it has typically been considered the most promising renewable resource for new disruptive technologies (Lewis and Nocera, 2006).
However, for every technology commercially available and ready for accelerated deployment, several others on the drawing board could potentially be “game changers” in the sense that they could point the way down a dramatically different path to cost-effective clean energy. Although existing technologies are expected to continue to improve and governments and private industry will continue to invest in applied research in support of this, it is also critical that R&D be oriented toward long-term goals for sustainable energy (NSB, 2009).
Innovation in the United States is increasingly being influenced by university-industry partnerships, which, in turn, tend to emerge from and be influenced by government actions (Feller, 2009). The rationale for public-private partnerships in R&D is to address the funding gap for entrepreneurs attempting to commercialize scientific inventions; the rationale for government support for this sort of R&D is that the social rate of return (the benefits to society) are greater than private rates of return (material benefits to a particular firm) (Shipp and Stanley, 2009). These have been the underlying principles of U.S. government investments in renewable energy technologies since the 1970s.
Government investments continue to be directed toward public-private partnerships in an effort to leverage additional resources (financial, intellectual, and in-kind) and accelerate innovation. In 2009, DOE provided support for 46 Energy Frontier Research Centers, disbursing $100 million (augmented by $277 million in stimulus funds) for collaborative research in basic energy sciences. DOE also administers a Technology Commercialization Fund, which supports collaborations by several national laboratories and private industry to advance prototypes. For these “post-research, pre-venture capital” projects, the national labs make matching funds available to any private-sector partner willing to support deployment.
The National Renewable Energy Laboratory (NREL), the primary laboratory for research, development, and demonstration (RD&D) in renewables and energy efficiency, has a strategic focus on accelerating the commercialization of clean energy technologies. To further this goal, NREL has established a Clean Energy Entrepreneur Center, primarily to educate its own staff on commercialization issues, and a Venture Capitalist Advisory Board to provide external advice to the lab, identify additional capital, and form startup companies (NREL, 2010a). NREL also participates in the Solar Technology Acceleration Center (SolarTAC), a collaborative venue for research, demonstration, testing, and validation of near-market solar products and services.
As part of the Rising Above the Gathering Storm (NAS/NAE/IOM, 2007) report, the study committee found a serious lack of either government or industry mechanisms for exploring long-term, high-risk, but potentially very high-payoff energy research, development, and innovation directed specifically toward deploying new energy technologies. The committee thus concluded that creation of an “ARPA-E” (Advanced Research Projects Agency-Energy, modeled after the successful DARPA, Defense Advanced Research Projects Agency) was important to develop a base of “transformational research that could lead to new ways of fueling the nation and its economy.” ARPA-E’s mission would, in the committee’s view, complement but not replace other mechanisms in the nation’s energy R&D portfolio.
ARPA-E was thus authorized in 2007 and became operational in 2009, receiving an initial budget of $400 million. The goal of ARPA-E is to reinforce U.S. economic security by identifying technologies with the potential to reduce energy imports from foreign sources; cut energy-related GHG emissions; and improve efficiency across the energy spectrum. Although ARPA-E will indirectly support conventional energy research, its focus will be exclusively on high (market) risk, high-payoff concepts with the goal of encouraging the United States to remain a technological and economic leader in the development and deployment of advanced energy technologies.
China
China has made great strides in recent years in increasing its innovation capacity in general, and in renewable and alternative energy technologies more specifically. Investments in clean energy R&D have increased year on year, particularly in strategic areas such as high-voltage transmission, and a suite of policies has been developed to make China a global leader in these technologies (Tan and Gang, 2009). Still, there is considerable room for improvement, particularly in establishing a comprehensive innovation system that joins basic research capabilities to enterprises focused on commercializing and deploying these technologies.
Research institutions in China have had comparatively little interaction with the private sector. But, as demonstrated by universities contracting with companies and research institutes establishing startups, this model is changing. China’s Ministry
of Finance has proposed several policies to encourage private-sector investment in innovation, via partnerships, and the Ministry of Education has provided incentives to universities to turn their research results into practical products (Tan and Gang, 2009). Some of China’s state-run research institutes (such as GIEC and the CAS-BP Institute in Dalian) have also tried to focus their efforts on commercializing technologies, a departure from their previous focus exclusively on research. China will have to continue investing in all facets of its innovation system if it wants to rely on domestic or “indigenous” innovation in the future.
By some accounts, China’s current innovation system is characterized by insufficient investment, an unbalanced allocation of resources, and too little R&D (Mu, 2007). Only a little more than 6 percent of gross expenditures in R&D are devoted to basic research, industrial R&D is weak (in terms of output), and there is a general lack of integration among research components, coordination among government agencies, and linkages between academia and enterprises (Fang, 2008). Although Chinese companies have successfully improved foreign-developed innovations in renewable energy technologies, particularly in manufacturing products at scale and reducing costs, they do not typically leverage domestic research capacity. Multinational companies are increasingly locating their R&D facilities in China, so over the longer term this may have an influence, but at present China has not demonstrated that it is prepared to be a leader in innovative, high-technology industries like renewables.
To address these concerns, the national government administers two programs intended to accelerate China’s progress in becoming a high-technology leader—the 863 Program, which focuses on national high-technology development and demonstration, and the companion 973 Program, which supports basic research. Both programs are managed by the Ministry of Science and Technology (MOST), and both are directed toward China’s evolving national priorities. Thus, in the 11th Five Year Plan (2006–2010), renewable energy technologies are one of four energy-related priorities. However, funding for renewables is modest, even in comparison to funding for the other energy areas: 29 million yuan (~$4.5 million) annually in renewable energy technologies under the 863 Program, compared to 75 million yuan (~$11.5 million) for hydrogen and fuel cell technologies (Tan and Gang, 2009).
The 973 Program currently targets certain areas relevant to the deployment of renewables, such as grid modernization and utility-scale renewable resource development. Funds are also being channeled to programs such as the Chinese Academy of Sciences Solar Energy Action Plan to research technology and equipment for utility-scale (50–100 MW) solar thermal power plants. Again, only modest resources (approximately $143 million over a 10-year period, 1998–2008) were designated for energy research.
The 2006 Medium- to Long-Term Science and Technology National Plan establishes the government’s central role in determining the direction of China’s R&D until 2020. Government intervention to spur innovation can be critical in a country like China, which does not have a long-established R&D infrastructure (Tan and Gang, 2009). MOST has adopted numerous policies to stimulate more
private-sector investment in R&D, ranging from preferential taxes (e.g., increasing the deduction for R&D expenses) to protections of intellectual property rights (IPRs); the latter adopts a holistic approach that includes a legal system respecting IPR, the development of technology standards, and active participation in setting international standards.
Finally, in late 2007 MOST and National Development and Reform Commission (NDRC) jointly established the International Science and Technology Cooperation Program on New and Renewable Energy, a program that identifies priorities for international cooperation on solar power integration, biofuels, biopower, and wind power generation. The approach is in line with recommendations by the U.S. National Science Board to the National Science Foundation to promote collaboration with developing countries to encourage the adoption of sustainable energy technologies (NSB, 2009). As a next logical step, the United States and China have agreed to establish the U.S.-China Clean Energy Research Center, which is expected to become operational in 2010 and will provide funding of up to $150 million from both countries over a period of five years for joint R&D on clean coal, building efficiency, and clean vehicles.
FUTURE SCENARIOS
Forecasts of the energy futures of the United States and China are necessarily filled with uncertainty. Both countries use energy-economic models to analyze different scenarios—government forecasts are provided by the DOE Energy Information Administration (EIA) in the United States and by the NDRC Energy Research Institute (ERI) in China. Although these scenarios are not prognostications of the future, they can be useful for exploring possible effects of different policy options as both countries develop energy R&D portfolios and as industries plan investments (Holmes et al., 2009; NRC, 2009a). The following section focuses on economy-wide reference cases provided by EIA (to 2035) and, where available, by ERI (to 2050). In this section we also consider some ambitious technology-specific forecasts. These forecasts may not offer a clear path forward, but taken together they measure the distance to be traveled.
Government Forecasts
The latest forecasts by EIA (Figures 6-1 and 6-2) predict that the share of renewable energy in the U.S. energy supply will double in the next two decades, reaching nearly 14 percent by 2030 (EIA, 2009a). EIA forecasts that biofuels will show the greatest absolute growth through 2030 and that solar/PV energy will grow the fastest. China’s official forecasts (often interpreted as goals, but not mandates) are even more ambitious. China predicts renewables will be able to fulfill more than 30 percent of energy demand by 2050 and that hydro and other renewables together should meet 10 percent of China’s energy demand for 2010, increasing to 15 to 20 percent by 2020; as non-hydro renewables become dominant, they are projected
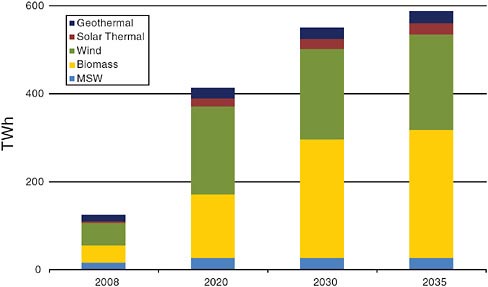
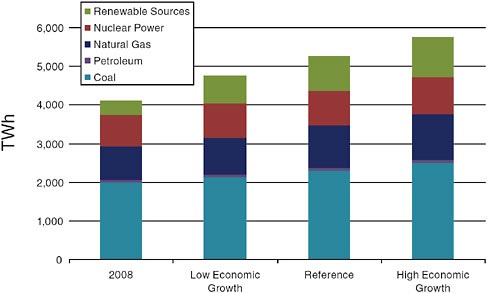
to provide 26 to 43 percent by 2050 (NDRC, ERI 2009). EIA projections extend to 2035 but not beyond, at least not officially. However, the current administration has a stated goal of reducing GHG emissions by 83 percent by 2050.
Recent EIA analyses present an interesting perspective on U.S. electricity sources over the past 40 years and projected through 2030 (Table 6-1):
-
Coal remains the dominant fuel for U.S. electricity generation. In terms of kW, coal-fueled electricity production is projected to increase more than three-fold from 1970 to 2030, from 704 billion kW to 2.3 trillion kW. However, its share of electricity generation is forecast to be nearly the same in 2030 as it was in 1970—slightly less than 46 percent.
-
The share of petroleum will decrease the most, from 12 percent of total electricity generation in 1970 to about 1 percent in 2030.
-
Nuclear power will increase the most, from a little more than 1 percent in 1970 to slightly less than 18 percent in 2030.
-
Natural gas will drop from 24 percent in 1970 to 19 percent in 2030.
-
Renewables will contribute the same percentage—slightly more than 16 percent—in 1970 and 2030. However, the distribution among types of renewables will change significantly. In 1970, virtually all renewable energy was from conventional (large) hydroelectric facilities, whereas in 2030 these facilities will contribute only about one-third of the renewables total.
ERI scenarios for China, which are based on goals set by the government, are slightly different. Because China has a central-planning approach, ERI sce-
TABLE 6-1 Total U.S. Electrical Production by Major Energy Source: History and Forecast
|
Million Kilowatts |
1970 |
1990 |
2007 |
2020 |
2030 |
|
Coal |
704.4 |
1,594.0 |
2,020.6 |
2,197.6 |
2,310.8 |
|
Petroleum |
184.2 |
126.6 |
65.7 |
49.0 |
50.2 |
|
Natural gas |
372.9 |
372.8 |
893.2 |
714.3 |
976.4 |
|
Nuclear electric power |
21.8 |
576.9 |
806.5 |
876.3 |
890.1 |
|
Conventional hydroelectric power |
251.0 |
292.9 |
248.3 |
298.7 |
299.9 |
|
Other (including other renewable) |
0.9 |
78.4 |
132.2 |
437.2 |
527.1 |
|
TOTAL |
1,535.2 |
3,041.6 |
4,166.5 |
4,573.1 |
5,054.5 |
|
Share of Total |
Percent Share |
||||
|
Coal |
45.9 |
52.4 |
48.5 |
48.1 |
45.7 |
|
Petroleum |
12.0 |
4.2 |
1.6 |
1.1 |
1.0 |
|
Natural gas |
24.3 |
12.3 |
21.4 |
15.6 |
19.3 |
|
Nuclear electric power |
1.4 |
19.0 |
19.4 |
19.2 |
17.6 |
|
Conventional hydroelectric power |
16.3 |
9.6 |
6.0 |
6.5 |
5.9 |
|
Other (including other renewable) |
0.1 |
2.6 |
3.2 |
9.6 |
10.4 |
|
Source: EIA, 2007a, 2009a. |
|||||
TABLE 6-2 Summary of China’s Renewable Energy Resource Potential for Power Production in 2050
|
Type |
Theoretical Potential (100 GW) |
Technically Available Potential (100GW) |
Energy Production (100 Mtce/a) |
|
Wind |
43 |
7~12 |
5~8 |
|
Solar energy |
4.5*107 |
22 |
11~14 |
|
Biomass |
— |
— |
9.8 |
|
Hydro |
6 |
5 |
8.6 |
|
Geothermal |
462.6 Btce |
0.2 |
0.5 |
|
Ocean |
142 |
14.4 |
5.5 |
|
TOTAL |
— |
55.7 |
40–46 |
|
Source: CREDSRG, 2008. |
|||
narios also function as road maps, or at least guideposts, for the development of specific renewable energy industries. By contrast, EIA provides independent, impartial analyses based on energy information and statistics. DOE and its affiliate laboratories conduct separate analyses, including aggressive scenarios for specific technologies (e.g., DOE, 2008a). NREL also facilitates renewable power technology roadmaps for industry, which identify targets for costs, timeframes for commercialization, and policy needs to achieve these goals. But the United States does not currently have official roadmaps, which would authorize the requisite funding and policies to help realize specific goals. The Solar Technology Roadmap Act of 2009 was pending approval by Congress as of June 2010.
ERI scenarios focus on the near term (by 2010), medium term (by 2020), long term (by 2030), and a “future perspective” (to 2050—see Table 6-2). Figure 6-3 illustrates the goals for renewables to 2050. Figures 6-4 and 6-5 show technology road maps for wind and solar PV, complete with interim goals and targets. The Chinese Academy of Sciences (CAS) produced a report in 2007 assessing how the country could transition from its dependence on fossil-fuel, energy-intensive infrastructure to a cleaner, more sustainable energy system. This report posited that, even if nuclear, conventional hydro, and renewables development were accelerated, coal would still provide about 42 percent of the country’s primary energy supply in 2050. However, the market could be shaped so that low-emissions and domestically produced energy would be favored (CAS, 2007). Under this scenario, with enough investments to bring down the costs of solar energy conversion, cellulose conversion for bio-derived fuels, and energy storage, renewables could meet approximately 25 percent of primary energy demand.
Industry Assessments
Some assessments attempt to forecast the size of all or parts of the renewable energy industry. Studies of this kind have been conducted for the United States (e.g., ASES, 2009; NCI, 2010; Pew Charitable Trusts, 2010), but the committee is not aware of any comprehensive forecasts for the renewable energy industry
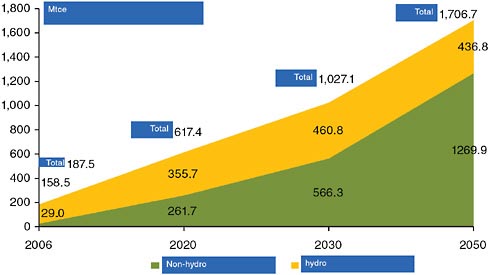
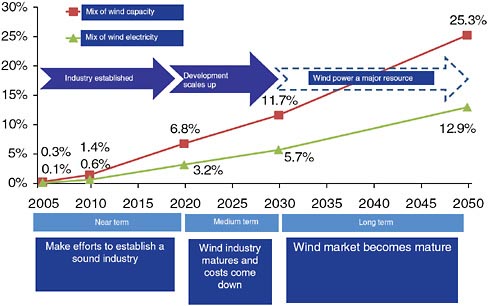
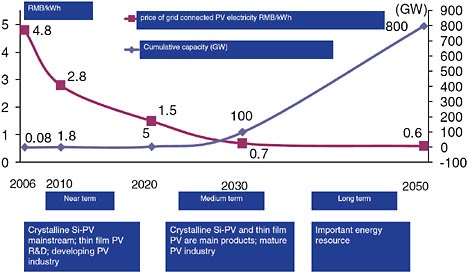
FIGURE 6-5 Solar PV technology roadmap for China. Source: CREDSRG, 2008.
in China. There are, however, recent analyses of some parts of China’s energy market (e.g., Crachilov et al., 2009; McKinsey & Company, 2009).
Table 6-3 summarizes some of the results for the ASES (2009) scenario forecasts for 2030. The size of the industry in 2030 in the “Advanced Scenario” is nearly six times as large as in the “Base Case.” More important, in the “Advanced Scenario,” some renewable energy sectors grow much more than others: wind is 16 times larger; geothermal is 14 times larger; fuel cells is 9 times larger; biodiesel is 6 times larger; biomass power is 5 times larger; and PV and ethanol are more than 3 times larger.
Table 6-4 shows wide variations in jobs creation between the “Base Case” and “Advanced Scenario.” The biggest differences in numbers are in the ethanol, biomass power, and wind sectors. The biggest differences in percentage increases are in the solar thermal, geothermal, and wind sectors.
The High Costs of Delay
In the aggressive scenario developed for the ASES (2009) report, the 2008 predictions for renewable energy/electrical energy industry in 2030 are significantly lower than the 2007 predictions:3
TABLE 6-3 The U.S. Renewable Energy Industry in 2030 (billions of 2007 dollars)
|
Industry Segment |
Base Case |
Moderate Scenario |
Advanced Scenario |
|
Wind |
$5.6 |
$22 |
$89 |
|
Photovoltaics |
13.5 |
27 |
45 |
|
Solar thermal |
0.2 |
0.9 |
29 |
|
Hydroelectric power |
4.8 |
5.1 |
6.8 |
|
Geothermal |
2.9 |
8.2 |
40 |
|
Biomass |
|
|
|
|
Ethanol |
22.6 |
45 |
82 |
|
Biodiesel |
1.3 |
2.7 |
7.6 |
|
Biomass power |
32.3 |
68 |
160 |
|
Fuel cells |
5.2 |
14.1 |
45 |
|
Hydrogen |
4.1 |
12.2 |
36 |
|
Total, Private Industry |
92.4 |
205.2 |
540.4 |
|
Federal government |
0.8 |
1 |
2.8 |
|
DOE laboratories |
2.3 |
2.6 |
7.8 |
|
State and local government |
1.5 |
2.2 |
5.7 |
|
Total Government |
4.6 |
5.8 |
16.3 |
|
Trade & professional associations & nongovernmental ogranizations |
0.8 |
1.5 |
3.6 |
|
TOTAL, ALL SECTORS |
$97.8 |
$212.5 |
$560.3 |
|
Source: ASES, 2009. |
|||
-
Projected real renewable energy revenues in 2030 are about 10 percent ($55 billion) smaller.
-
The total number of jobs projected for the renewable energy industry in 2030 is about 8 percent (591,000 jobs) lower.
-
Real electric energy revenues in 2030 are about 8 percent ($317 billion) lower.
-
The total number of jobs generated by renewable energy in 2030 is about 7 percent (2.3 million jobs) lower.
All renewable energy/electrical energy initiatives take years to be implemented and then ramped up. Thus the largest gains in deployment are made in the years immediately preceding the target year, 2030. Therefore, a delay of just one year in the early years translates into a substantial loss in future deployment. The aggressive 2007 scenario was based on the assumption that the extremely ambitious, large-scale federal, state, and local government incentives, policies, and mandates would be implemented beginning in 2008. This did not occur, however, so the 2008 forecast moved the implementation date up to 2009. This one-year delay explains the significant differences between the 2007 and 2008
TABLE 6-4 U.S. Jobs Created by Renewable Energy in 2030
|
Industry Segment |
Base Case |
Moderate Scenario |
Advanced Scenario |
|
Wind |
66,200 |
257,000 |
1,040,000 |
|
Photovoltaics |
206,000 |
415,000 |
700,000 |
|
Solar thermal |
3,800 |
17,000 |
540,000 |
|
Hydroelectric power |
22,400 |
24,200 |
32,300 |
|
Geothermal |
29,000 |
85,000 |
415,000 |
|
Biomass |
|
|
|
|
Ethanol |
530,000 |
1,050,000 |
2,000,000 |
|
Biodiesel |
25,100 |
56,900 |
160,000 |
|
Biomass power |
282,000 |
603,000 |
1,420,000 |
|
Fuel cells |
68,600 |
158,000 |
505,000 |
|
Hydrogen |
47,200 |
143,000 |
420,000 |
|
Total, Private Industry |
1,280,300 |
2,809,000 |
7,232,300 |
|
Federal government |
3,000 |
3,100 |
8,550 |
|
DOE laboratories |
11,000 |
12,300 |
36,100 |
|
State and local government |
7,000 |
11,800 |
29,400 |
|
Total Government |
21,000 |
27,200 |
74,050 |
|
Trade & professional associations & nongovernmental ogranizations |
4,700 |
9,400 |
21,300 |
|
TOTAL, ALL SECTORS |
1,305,400 |
2,845,700 |
7,327,650 |
|
Source: ASES, 2009. |
|||
scenarios. The lesson here is that the longer the United States (or China or any other nation) delays in implementing ambitious renewable programs and incentives, the more difficult it will be to achieve the goals for 2030—or any other target year.
The same is true for the ERI road maps, which are based on considerable acceleration from 2030 to 2050. These projections will have to be scaled back if early targets for 2020 and 2030 are not met. Every year of delay at the front end (e.g., 2009, 2010) has a highly disproportionate negative impact on the achievement of long-term goals. Thus, time is of the essence, and time lost in the next several years will be very difficult to make up.
FINDINGS
The scale and diversity of the energy system in terms of existing infrastructure and economic importance, in the United States and China, should not be underestimated. Transforming the existing model of fossil-fuel combustion into a low-carbon energy infrastructure will require the active involvement of a wide range of actors beyond the energy and technology sector. No single factor is motivating
either country to push toward a more sustainable energy economy, and no single technology, renewable or otherwise, will wholly meet demand.
Meeting electricity demand sustainably is an important driver for the development of renewable power, but it is not the only one. The complex, systems challenge ahead will involve trade-offs and some missteps. Manufacturing, deploying, and operating renewable power generators represent a potential new pillar of economic growth. So far, China has embraced this opportunity more rapidly than the United States.
As both countries move forward to integrate renewable energy technologies, there will be many opportunities for U.S.-Chinese cooperation in areas with medium- to long-term impacts. Collaboration may not focus directly on renewable power generation technologies but may instead focus on key “enablers” of a sustainable energy economy. Successful projects might be considered experiments, and the United States and China could document and analyze them and then support similar projects in other cities. Assessments of local costs, benefits, and the impacts of energy use would also be valuable to local decision makers, as would an understanding of the main leverage points in implementing sustainable energy strategies.
China may have the benefit of hindsight, learning from earlier efforts in the United States and elsewhere, but its timetable continues to be compressed at the same time that international scrutiny is increasing. China is pursuing nearly 10 percent annual economic growth while rapidly reducing its GHG emissions profile. In any circumstances, progress on laying the groundwork for a future, sustainable energy economy will benefit both the United States and China over the longer term and could show other countries how to stimulate the development of their own sustainable energy infrastructure. For both countries, delaying deployment will push back of some of the clean energy and emissions-reduction targets for 2030 and beyond.
In the United States, research on clean energy is conducted at a variety of government and academic institutions, but NREL integrates these efforts into a coherent national overview. In China, the Energy Bureau has established a number of renewable energy research and development centers. Although both the United States and China have recently increased investments in energy R&D, both are still severely underinvesting, which will make it difficult to achieve goals for 2050 and beyond. Consistent, long-term public investments in clean energy RD&D would send private industry a clear signal of a commitment to change, which should leverage more industry investment in both applied research and commercialization.
RECOMMENDATIONS
-
China should conduct a nationwide inventory of research centers and their capabilities in various aspects of renewable energy and related fields. Based on
-
assessed capabilities, some facilities could be designated as technical centers of excellence in their major competencies. One option is to integrate some of the existing entities and to establish a research institute, under the National Energy Administration, that is responsible for the renewable energy sector. A new institution would not need to be the center of excellence for all technologies, but for the integration of technologies and understanding of the RD&D pipeline from resource base through to commercialization. It should also be a facility for investing in capital equipment that is otherwise too costly for individual research centers.
-
China and the United States should cooperate on developing the standards and infrastructure for systems that optimize vehicle charging behavior, renewable power generation, and reduced emissions from the transportation sector. Developing and implementing these complex systems at scale will require substantial investments, and so joint pilot projects and demonstrations could be more efficient, in terms of expenditures and diffusion of technological learning.


