
Appendix C
Life Cycle Assessment of Biomass Power in China
As a renewable energy, biomass is generally considered CO2-neutral. This is particularly the case with regard to agricultural residues, which are periodically planted and harvested. During the growth, these plants have removed CO2 from the atmosphere for photosynthesis, which is released again during combustion. Although the direct emissions of SO2 and NOx at generation stage are smaller than from fossil fuels because of the relatively low nitrogen and sulfur content of biomass, its environmental impact cannot be ignored from the perspective of life cycle assessment. The main reason is that cultivation, harvesting, transportation, and pre-treatment of biomass are energy-consuming processes that are accompanied by significant emissions.
At present, there are three mature technologies of biomass power generation: direct-combustion, gasification, and co-firing. The environmental capacity and energy consumption at all stages of generation process could be understood comprehensively using life cycle assessment methodology, thereby considering adopting measures to conserve resources and protect the environment. Figure C-1 presents a simplified process-flow diagram for power generation using biomass, beginning with plant cultivation and ending at the generation stage.
Throughout the life cycle assessment process, the energy consumption and pollutant emissions depend on a number of factors, which mainly include the biomass feedstock, type of technology used, and the boundary conditions chosen for the system. When it comes to the assessment of power generation from agricultural residues, whether the life cycle assessment includes the plant cultivation process may have a significant impact on the results. In the following assessment, the energy consumption and pollutant emissions from cultivation were included. Figures C-2 and C-3 show the assessment results for a 25 MW biomass power plant using direct-
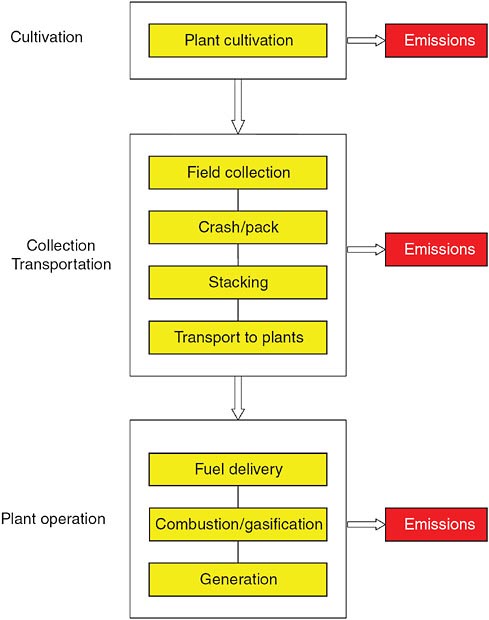
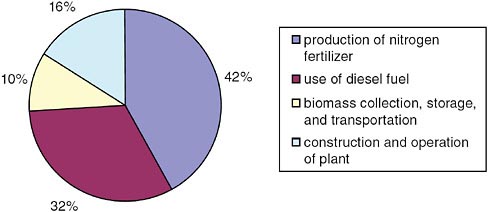
FIGURE C-2 Life cycle CO2 emissions for biomass power generation in China.
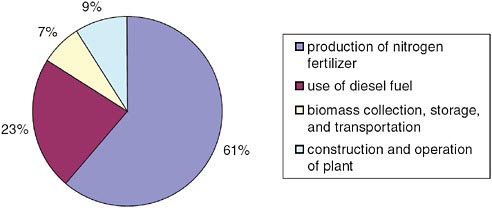
FIGURE C-3 Life cycle energy consumption for biomass power generation in China.
combustion. We can see that biomass cultivation is the main stage responsible for emissions, producing more than 70 percent of the CO2, while the emissions in the collection, transportation, and pre-treatment stages are much lower. Considering the consumption of fossil fuel, the cultivation stage still dominates, due mainly to fuel used in the production of nitrogen fertilizer and the use of diesel.
As mentioned above, there are three technology routes for biomass power generation. In China, direct-combustion generation currently is the most developed technology. Due to lack of policy support, co-firing only accounts for a very small share. In addition, most gasification power generation projects are only in the demonstration phase. Different biomass generation systems were compared with respect to energy conversion efficiency and CO2 emissions. As shown in Figure C-4,
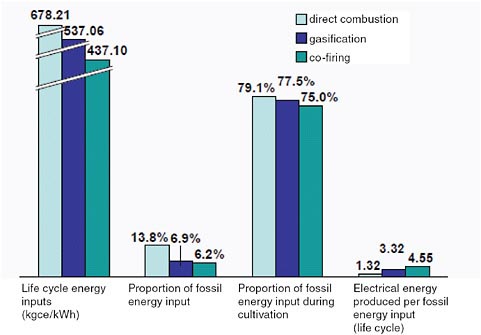
FIGURE C-4 Relative efficiencies for direct-combustion, gasification, and biomass co-firing power plants.
the co-firing has the highest energy efficiency, followed by gasification and direct-firing. The scale of power generation is a key factor for energy efficiency. For direct-combustion and gasification, the scale of power plant is limited because of low density of biomass. In China, the largest installed capacity is 25 MW for direct-combustion power plants and 6 MW for gasification. The generation efficiency of both is less than 30 percent. In contrast, the scale of co-firing plants is not significantly influenced by biomass resources because only part of the coal is substituted by biomass. Values shown in Figure C-4 reflect operating experience with a 140 MW co-firing power plant for which the generation efficiency reached 36.13 percent, which is much higher than the efficiency of direct-combustion and gasification. Because the 6 MW gasification power plant studied in Figure C-4 included a heat recovery and generation system, the system efficiency is a little higher than that of the 25 MW direct-combustion plant. The CO2 reduction rates of all three systems (relative to the coal they displace) are more than 95 percent, suggesting that the CO2 reduction effect of biomass power generation is considerable.
In comparison to fossil-fuel and nuclear power plants, renewable power sources also require a large amount of land for a given amount of generating capacity. Land-use requirements for large-scale hydropower and concentrating
solar thermal power are especially high. On the other hand, some renewable technologies, such as photovoltaics, can be deployed in locations such as residential and warehouse roofs, where they create little interference with other land uses and are close to the point of use of the electricity. Although producing power from cultivated feedstock is very land intensive, land-use requirements are much lower if waste biomass is used. Land use can serve as a rough proxy for other impacts of new development, including impacts on ecosystems, cultural and historical resources, scenery, and loss of agricultural lands. Because of relatively high land-use intensity for most renewable electricity generating technologies, careful assessment of local environmental, cultural, and aesthetic impacts should be required before large projects are developed.


