
2
Views of the U.S. NAS and NAE on WRC-12 Agenda Items
The following pages provide a discussion of the committee’s consensus opinion on the potential impact and relevance of certain agenda items at issue at the upcoming World Radiocommunication Conference (WRC) in 2012.
AGENDA ITEM 1.3: SAFE OPERATION OF UNMANNED AIRCRAFT
To consider spectrum requirements and possible regulatory actions, including allocations, in order to support the safe operation of unmanned aircraft systems (UAS), based on the results of ITU-R studies, in accordance with Resolution 421 (WRC 07).
The relevant band is 5030-5150 MHz Aeronautical Radionavigation Service (ARNS) (microwave landing systems).
The primary concern for radio astronomy is the potential for out-of-band emission from transmitters in the 5030-5150 MHz band causing interference in the primary RAS allocation 4990-5000 MHz and the secondary Radio Astronomy Service (RAS) allocation 4800-4990 MHz. Nearly all centimeter-wavelength radio telescopes operate in the 4800-5000 MHz band to study the continuum radio emission from stars, galaxies, quasars, gamma-ray bursts, and other sources of galactic and extragalactic thermal and nonthermal continuum radiation. Aircraft pose a special problem for ground-based radio astronomy facilities because there is a line-of-sight path out to hundreds of kilometers.
A one-watt equivalent isotropically radiated power (EIRP) transmitter located 25 km (line of sight) from a radio astronomy facility needs to have its total out-of-band emissions in the RAS band under –72 dBc to conform to the continuum level specified in Recommendation ITU-R RA.769—that is, an average power density of less than –171 dBW/m2 in 10 MHz. It must also limit narrow band spurs to peaks no more than 11 dB above this average level in any 50 kHz channel within the RAS band, in order to conform to the corresponding spectral line level of –230 dBW/m2/Hz specified in Recommendation ITU-R RA.769.
Recommendation: Transmissions in support of unmanned aircraft in the 5030-5150 MHz band should have sufficiently low level of unwanted emissions to avoid interference in the adjacent Radio Astronomy Service bands, in accord with Recommendation ITU-R RA.769.
AGENDA ITEM 1.4: UNWANTED EMISSIONS INTO 4990-5000 MHZ
To consider, based on the results of ITU R studies, any further regulatory measures to facilitate introduction of new aeronautical mobile (R) service (AM(R)S) systems in the bands 112-117.975 MHz, 960-1 164 MHz and 5 000-5 030 MHz in accordance with Resolutions 413 (Rev.WRC 07), 417 (WRC 07) and 420 (WRC 07).
The primary concern for radio astronomy is the potential for out-of-band emission from transmitters providing surface applications at airports in the 5000-5030 MHz band that would cause interference in the primary RAS allocation, 4990-5000 MHz, and the secondary RAS allocation, 4800-4990 MHz. Nearly all centimeter-wavelength radio telescopes operate in the 4800-5000 MHz band to study the continuum radio emission from stars, galaxies, quasars, gamma-ray bursts, and other sources of galactic and extragalactic thermal and nonthermal continuum radiation.
A one-watt EIRP transmitter located 25 km (line of sight) from a radio astronomy facility needs to have its combined excess path loss and out-of-band emissions under -72 dBc to conform to the level specified in Recommendation ITU-R RA.769 that is, of a power density of less than -171 dBW/m2 for continuum observations in the 5 GHz RAS band. The corresponding value in Recommendation ITU-R RA.769 for spectral-line observations is a spectral power density of less than -230 dBW/m2/Hz, so that if the one watt transmitter has a bandwidth of 10 kHz the combined excess path loss and out-of-band emissions need to be less than -91 dBc.
Recommendation: Transmitters providing surface applications at airports in the 5000-5030 MHz band should have sufficient suppression of out-of-band emissions to avoid interference in the adjacent 5 GHz Radio Astronomy Service band in accord with Recommendation ITU-R RA.769.
To review No. 5.565 of the Radio Regulations in order to update the spectrum use by the passive services between 275 GHz and 3 000 GHz, in accordance with Resolution 950 (Rev.WRC 07), and to consider possible procedures for free-space optical-links, taking into account the results of ITU R studies, in accordance with Resolution 955 (WRC 07).
The current Table of Frequency Allocations does not allocate bands above 275 GHz. Footnote No. 5.565 provides for the use of these bands up to 1000 GHz for all services and includes provisions meant to protect passive services until, and if, such time as the table is extended. Protection of the bands 275-1000 GHz for passive use is considered to be highly desirable; there is less emphasis on the range 1000-3000 GHz. Specific bands requiring protection are listed below in Tables 2.1 and 2.2.
Recommendation: Administrations should protect the bands given in Tables 2.1 and 2.2 from harmful interference so they may be used by the Radio Astronomy Service and Earth Exploration-Satellite Service, respectively.
Radio Astronomy Service
Due to recent technological achievements, the exploration of the universe using the spectrum between 275 and 3000 GHz has greatly expanded over the past decade. Extraordinary opportunities exist to study the universe using this band, including those of the early universe, astrochemistry, planetary and star formation, and supermassive black holes.1 The current and future activities in the 275-1000 GHz regions are substantial, as evidenced by the work of instruments such as the James Clark Maxwell Telescope (JCMT), the Caltech Submillimeter Observatory (CSO), the Submillimeter Telescope (SMT) of the Arizona Radio Observatory, the Submillimeter Array (SMA) and the South Pole Telescope (SPT), and the ongoing construction of the Atacama Large Millimeter/submillimeter Array (ALMA). The 275-3000 GHz band also contains regions that are currently used for passive measurements for NASA missions (mainly in the 1-3 THz band) such as the Herschel Space Observatory and the Stratospheric Observatory for Far-Infrared Astronomy (SOFIA) and the future space project, the Single Aperture Far-Infrared Observatory (SAFIR). Because of high atmospheric absorption of signals due to water vapor above 1 THz, ground-based observations can only be made from extremely high sites, usually above 3 km. Exploratory observations have been made in this band, primarily around 1.5 THz. Because of the high horizontal opacity, interference from active services located more than 10 km away is unlikely. In light of these developments it is worthwhile to reexamine Footnote 5.565 in the Table of Frequency Allocations.
The 275-3000 GHz region, known as “submillimeter,” encompasses various spectral windows that can be used for ground-based astronomy. These are illustrated in Table 2.1. It is a prime region for spectroscopy and for studying continuum emission from dust. In this frequency range, many of the common interstellar molecules such as CO, HCN, HCO+, and CS have their higher energy rotational transitions (see Table 2.1).2 These spectral lines are important probes of the interstellar medium where stars form because they trace relatively hot (T > 200 K) and dense (n > 107 cm-3) gas. These transitions also trace circumstellar gas close to the stellar photosphere and can be used to elucidate the physical processes including mass loss and photospheric shocks associated with evolved (i.e., giant) stars. This
_________________
1 NRC, Spectrum Management for Science in the 21st Century, The National Academies Press, Washington, D.C., 2010.
2 The theory of quantum mechanics dictates that the rotational motion of molecules is characterized by discrete energy levels. When a molecule changes energy levels, it makes a transition, either emitting or absorbing a photon at a frequency proportional to the energy difference between the two levels.
TABLE 2.1 Some Important Spectral Lines Between 275 and 3000 GHz
| Spectral Line | Transition | Frequency (GHz) | Significance |
| CO | 3-2 4-3 5-4 6-5 7-6 8-7 Etc.a |
345 461 576 691 807 922 |
Important tracer of galactic and extragalactic structure Probe of star-forming regions and protoplanetary disks |
| CI | Fine structure | 492 809 |
Tracer of the ionized dense interstellar medium, photon-dominated regions, planetary nebulae |
| HCO+ | 4-3 5-4 6-5 7-6 |
356 446 535 624 |
Probe of high density regions, protostellar cores |
| HCN | 4-3 5-4 6-5 7-6 8-7 |
354 443 531 620 709 |
Probe of high density regions, protostellar cores, Inner shells of evolved stars |
| CS | 7-6 8-7 9-8 |
342 392 440 |
Dense protostellar cores, evolved stars, planetary nebulae |
| H2O | 1(1,0)-1(0,1) 2(1,1)-2(0,2) 1(1,1)-0(0,0) |
556 752 1113b |
Indicator of star formation, tracer for life, maser emission |
| H3O+ | 0(0,0)-1(0,1) 1(1,0)-1(1,1) 2(0,0)-1(0,1) |
984 1655 2972 |
Important tracer of ion-molecule chemistry |
| H2D+ | 1(1,0)-1(1,1) 3(2,1)-3(2,2) |
372 646 |
Probe of D/H isotope ratio, chemical fractionation |
| CH | 1-0 2-1 |
537 1477 |
Important chemical building block, tracer of diffuse gas |
| OH | 1-0 | 2560 | Star formation, O-rich evolved stars |
| Metal hydrides (SiH, LiH, MgH, NaH, AlH) | 1-0 2-1 3-2 Etc. |
Various | Interstellar coolants Building blocks of interstellar chemistry |
a Higher excitation lines occur throughout this band at intervals of 115.27 GHz, e.g., 922 GHz and 1037 GHz. Higher frequency transitions are excited by regions of increasingly high temperatures.
b The atmosphere is highly opaque at these frequencies and protection would only be needed for measurements above the atmosphere where satellite interference is possible.
NOTE: To observe the listed transitions, fractional bandwidths of 1% are required for Galactic observations. Larger bandwidths are needed for extragalactic measurements on the low-frequency side because of the Doppler shift caused by the recessional velocities of distant objects in the universe—for example, a ten percent bandwidth is required to cover the nearby clusters of galaxies of which our galaxy is a member.
TABLE 2.2 Representative Passive Sensing Bands and Their Associated Measurements in 275-1000 GHz
| Frequency (GHz) | Total Bandwidth Required (MHz) | Spectral Line(s) (GHz) | Measurement (GHz) | Existing or Planned Instrument(s) |
| 275-285.4 | 10 400 | 276.33 (N2O), 278.6 (ClO) | Window (276.4-285.4)for N2O, ClO, NO | |
| 296-306 | 10 000 | Window for 325.1, 298.5 (HNO3), 300.22 (HOCl), 301.44 (N2O), 303.57 (O3), 305.2 (HNO3), 304.5 (O17O) | Wing channel for temperature sounding Window (296-306) for N2O, O3 , O17O, HNO3, HOCl | MASTER |
| 313.5-355.6 | 42 100 | {318.8, 345.8, 344.5} (HNO3), 313.8 (HDO), {321.15, 325.15} (H2O), {321, 345.5, 352.3, 352.6, 352.8} (O3), {322.8, 343.4} (HOCl), 345.8 (CO), {345.0, 345.4} (CH3Cl), 345.0 (O18O), 354.5 (HCN), 349.4 (CH3CN), {315.8, 346.9, 344.5, 352.9} (ClO), 351.67 (N2O), 346 (BrO) | Water vapor sounding, cloud ice, wing channel for temperature sounding Window (339.5-348.5) for H2O, CH3Cl, HDO, ClO, O3 HNO3, HOCl, CO, O18O, HCN, CH3CN, N2O, BrO | PREMIER, CIWSIR, MASTER, MWI, GOMAS, GEM |
| 361-365 | 4 000 | 364.32 (O3) | Wing channel for water vapor sounding for O3 | GOMAS |
| 369.2-391.2 | 22 000 | 380.2 (H2O) | Water vapor sounding | GEM, GOMAS |
| 397-399 | 2 000 | Water vapor sounding | GOMAS | |
| 409-411 | 2 000 | Temperature sounding | ||
| 416-433.46 | 17 460 | 424.7 (O2) | Temperature sounding | GEM, GOMAS |
| 439.1-466.3 | 27 200 | {443.1, 448} (H2O), 443.2 (O3), 442 (HNO3) | Water vapor profiling, cloud ice Window (458.5-466.3) for O3, HNO3, N2O, CO | MWI, CIWSIR |
| 477.75-496.75 | 19 000 | 487.25 (O2) | Temperature sounding | Odin |
| 497-502 | 5 000 | 497.9 (N218O), {497.6, 497.9} (BrO), 498.6 (O3) | Wing channel for water vapor sounding Window (498-502) for O3, CH3Cl, N218O, BrO, ClO | SOPRANO, MASTER, Odin |
| 523-527 | 4 000 | Window for 556.9 | Wing channel for water vapor sounding Window (523-527) | |
| 538-581 | 43 000 | {541.26, 542.35, 550.90, 556.98} (HNO3), 556.93 (H2O), {544.99, 566.29, 571.0} (O3), 575.4 (ClO) | Water vapor sounding Window (538-542) for HNO3, O3, ClO | Odin |
| Frequency (GHz) | Total Bandwidth Required (MHz) | Spectral Line(s) (GHz) | Measurement (GHz) | Existing or Planned Instrument(s) |
| 611.7-629.7 | 18 000 | 620.7 (H2O), 624.27 (ClO2), {624.34, 624.89, 625.84, 626.17} (SO2), {624.48, 624.78} (HNO3), 624.77 (81BrO), 624.8 (CH3CN), 625.04 (H2O2), 625.37 (O3), 624.98 (H37Cl), 625.92 (H35Cl), 627.18 (CH3Cl), 627.77 (O18O), {625.07, 628.46} (HOCl), 625.66 (HO2) | Water vapor sounding for ClO2, SO2, BrO, O3, H35Cl, CH3Cl, O18O, HOCl, HO2, HNO3, CH3CN, H2O2 | MLS, SMILES, SOPRANO |
| 634-654 | 20 000 | 635.87 (HOCl), 647.1 (H218O), 649.45 (ClO), 649.24 (SO2), 649.7 (HO2), 650.18 (81BrO), 650.28 (HNO3), 650.73 (O3), 651.77 (NO), 652.83 (N2O) | Wing channel for water vapor sounding Window (634.8-651) for H218O, HOCl, ClO, HO2, BrO, HNO3, O3, NO, N2O, SO2 | MLS, SMILES |
| 656.9-692 | 35 100 | 658 (H2O), 660.49 (HO2), 688.5 (CH3Cl), 691.47 (CO), 687.7 (ClO) | Water vapor sounding, cloud ice Window (676.5-689.5) for HO2, ClO, CO, CH3Cl | CIWSIR, MWI, MLS |
| 713.4-717.4 | 4 000 | 715.4 (O2) | O2 | |
| 729-733 | 4 000 | 731 (HNO3), 731.18 (O18O) | O18O, HNO3 | |
| 750-754 | 4 000 | 752 (H2O) | Water vapor | |
| 771.8-775.8 | 4 000 | 773.8 (O2) | O2 | |
| 823.15-845.15 | 22 000 | 834.15 (O2) | O2 | |
| 850-854 | 4 000 | 852 (NO) | NO | |
| 857.9-861.9 | 4 000 | 859.9 (H2O) | Water vapor | |
| 866-882 | 16 000 | Cloud ice | CIWSIR | |
| 905.17-927.17 | 22 000 | 916.17 (H2O) | Water vapor | |
| 951-956 | 5 000 | 952 (NO), 955 (O18O) | O18O, NO | SOPRANO |
| 968.31-972.31 | 4 000 | 970.3 (H2O) | Water vapor | |
| 985.9-989.9 | 4 000 | 987.9 (H2O) | Water vapor | |
NOTE: The atmosphere is highly opaque above 1000 GHz, and protection would only be needed for measurements where satellite interference is possible.
SOURCE: Adapted from ITU, Working Party 7C, “Preliminary Draft New Report, ITU-R RS.[Above 275] Passive bands of Interest to EESS/SRS from 275 to 3000 GHz: Annex 1313 to Working Party 7C Chairman’s Report,” September 30, 2009.
region also contains the two fine-structure lines of neutral carbon (CI). The CI lines are used to study photon-dominated regions, planetary nebulae, and HII regions. This range is also of great significance for the investigation of protoplanetary disks and their role in the origin of solar systems and life. In addition, the 275-3000 GHz region is the only spectral band containing the fundamental transitions of simple hydride species, such as CH, OH, SiH, LiH, and SH. This is because the moments of inertia of these
molecules are quite small, resulting in large rotational energy splittings. Hydride molecules are extremely important for astronomy for several reasons. First, the large energy difference between the rotational levels makes them efficient coolants in dense gas. Also, because hydrogen is the most abundant element, hydride compounds are common in diffuse and dense clouds. Moreover, hydride species are the basic building blocks of interstellar chemistry. Understanding their abundances and distribution is key to chemical modeling. But not all hydride species are known interstellar molecules primarily because their exact transition frequencies have not yet been measured.
Future research in this largely unexplored spectral region is likely to yield additional spectral transitions and continuum bands of interest to the passive services. Administrations are urged to protect the passive services from harmful interference, particularly those bands to be used by ALMA (275-375 GHz, 385-500 GHz, 602-720 GHz, and 787-950 GHz).
Table 2.1 lists some important submillimeter molecular tracers, their frequencies, and their significance for astronomy.
Earth Exploration-Satellite Service
EESS (passive) currently uses spectrum in the range between 275 and 3000 GHz for several important measurements focusing on improving our understanding of the atmosphere and providing information needed by policy makers. A list of a few of these uses is given in Table 2.3. Table 2.2 gives a corresponding list of representative bands associated with these measurements. The list in Table 2.2 is not exhaustive. As in the case of radio astronomy, these measurements cannot be made in other bands because pressure-broadened transitions of different atmospheric constituents are being observed. In light of this and recent advances in relevant technologies, EESS use of this portion of the spectrum is expected to increase significantly. It is therefore important to protect EESS use in this region of the spectrum.
TABLE 2.3 Typical EESS Uses of Spectrum from 275 to 3000 GHz
|
|
|
| Use/Measurement/Target | Significance |
|
|
|
| Mapping of ozone, polar stratospheric clouds, chlorine sources | Three-dimensional (3D) mapping of ozone in the stratosphere to understand current ozone distribution and mechanisms for its depletion |
| Cloud ice and frozen precipitation | Key variable in the understanding of the water cycle, Earth’s energy budget, and the effect of cloud feedback on the climate, viewed in window regions around absorption features from gaseous constituents |
| Upper troposphere and stratospheric water vapor | Key aspect of the water cycle and important for determining climate feedback effects on radiative forcing in the presence of increasing greenhouse gases. Because multiple bands are used with varying sensitivity to water vapor, this use has varying applicability as a function of instrument scan type (nadir vs. limb) and water vapor distribution |
| Stratospheric temperature | Three-dimensional (3D) mapping of stratospheric temperature for understanding atmospheric dynamics |
| Upper tropospheric pollution | Understanding of distribution and transport of pollutants in the upper troposphere |
| Trace gases | Three-dimensional (3D) mapping of key atmospheric constituents (e.g., CO, SO2, HCl, BrO, N2O) tied to carbon cycle, global climate, pollution, and atmospheric transport |
|
|
|
NOTE: This list presents some significant uses of the spectrum but is not exhaustive.
To consider the results of ITU R studies in accordance with Resolution 222 (Rev.WRC 07) in order to ensure long-term spectrum availability and access to spectrum necessary to meet requirements for the aeronautical mobile-satellite (R) service, and to take appropriate action on this subject, while retaining unchanged the generic allocation to the mobile-satellite service in the bands 1,525-1,559 MHz and 1,626.5-1,660.5 MHz.
The primary concern for Radio Astronomy is the passive band from 1660 to 1670 MHz, which is shared with other services and is used to investigate phenomena associated with the formation of stars marked by maser emission from the hydroxyl radical (OH) in the stars’ atmosphere. Signals from OH “megamasers” seen in some galaxies are also observed in this band and provide information on the magnetic fields in these galaxies as well as their evolution over cosmic time.
Recommendation: Aeronautical mobile-satellite (R) service transmissions in the overlapping and adjacent bands should have out-of band emissions below -237 dBW/(m2Hz) at registered Radio Astronomy Service sites, in accordance with Recommendation ITU-R RA.769 for spectroscopic observations.
Agenda Item 1.8 is the consideration of the progress of ITU R studies concerning the technical and regulatory issues relative to the fixed service in the bands between 71 GHz and 238 GHz, taking into account Resolutions 731 (WRC 2000) and 732 (WRC 2000). The millimeter wave spectrum above 70 GHz has become the subject of increasing interest for fixed wireless services due to its propagation characteristics and the wide bandwidth available for carrying communications traffic. New technology is now emerging that offers the possibility of using these higher bands for fixed wireless applications. Therefore, it is important the use of this frequency range for passive scientific observation be recognized.
Recommendation: Administrations are urged to protect the passive services from harmful interference in 71-238 GHz. Per Tables 2.4 and 2.5, this band is extremely important for a wide range of scientific problems, both for Radio Astronomy Service and Earth Exploration-Satellite Service.
Radio Astronomy Service
This spectral region, which contains the 3 mm, 2 mm, and a large section of the 1.2 mm atmospheric windows, is extremely important for studies of virtually every aspect of the dense interstellar medium.1 In fact, almost any given interstellar molecule has favorable transitions in this frequency band. Thus, this region is rich in spectral lines and high spectral resolution can be achieved, as shown in Figure 2.1.
Millimeter molecular lines in the 71-238 GHz bands serve as important probes of dense gas in a wide variety of astronomical settings. High resolution spectroscopy and the Doppler effect allow the velocity structure of an astronomical source to be readily discerned through spectral line measurements. Millimeter transitions of molecules such as CO and H2CO have been used to trace galactic structure and the distribution of dense gas in our Galaxy and in external galaxies. Because stars form in dense molecular clouds, molecular lines in these bands are very useful probes of star formation, and have been used to locate young protostars and protostellar disks. Molecules are also common constituents of dying (or evolved) stars, and are present in large quantities in stellar ejecta of red giant and asymptotic giant branch stars. Molecular spectra have been successfully used to study the mass loss mechanisms from such stars and how they develop into white dwarfs and planetary nebulae. The low energy transitions of many molecules have also been used to examine the structure and chemical composition of diffuse clouds and cold, dense globules. Because multiple transitions of a given molecule can be observed in many of these objects, radiative transfer modeling can be done to accurately determine gas temperatures and densities, important physical quantities. Gaseous vapors emitted by comets are also investigated by observations of spectral lines at these wavelengths, and the climatology of planetary atmospheres in our solar system as well. Isotope ratios are also successfully probed in a wide variety of environments using mm molecular lines, such as 13CO and 12CO, HC14N and HC15N, and even Na35Cl and Na37Cl. Such ratios
_________________
1 This frequency range takes on this prominence because of fundamental quantum mechanics, and the nature of the dense interstellar medium. Dense interstellar gas (n ~ 103 to 107 cm-3) is typically cold, with temperatures in the range T ~ 10-100 K. Under such conditions, atomic energy levels are not populated, and only the very lowest energy levels of molecules can be accessed, namely, the rotational levels, as opposed to vibrational or electronic. Rotational energies of any given molecule are proportional to 1/ I, where I is the moment of inertia. Most simple molecules containing the cosmically-abundant elements H, C, N, O, and S have moments of inertia that place their rotational spectra in the 1-3 mm region (about 71-300 GHz). For example, the fundamental rotational transitions (i.e., J = 1 → 0) of the most abundant interstellar molecules, including CO (115 GHz), HCN (88 GHz), HCO+ (89 GHz), N2H+ (93 GHz), CN (113 GHz), NO (150 GHz), H2CO (72 GHz) and H2S (169 GHz) occur in these bands. The 71-238 GHz band also contains the next higher transitions (2 → 1, 3→ 2) of many of these molecules, as well.
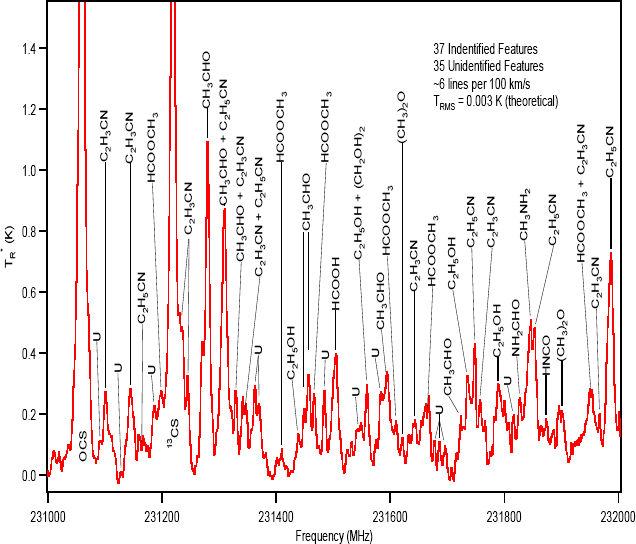
FIGURE 2.1 Typical spectrum of a dense molecular cloud, Sgr B2(N), obtained in a portion of the 71- 238 GHz band, using the Sub-Millimeter Telescope (SMT) of the Arizona Radio Observatory using a single-sideband (SSB) receiver covering a 1 GHz band. Integration time is 2 hours. A large fraction, but not all, of the molecular lines have been labeled on the spectrum. “U” indicates unidentified lines. Because radio telescopes use heterodyne receivers with multiplexing spectrometers, spectral resolution as high as 1 part in 108 can be achieved, particularly in cold, quiescent astronomical sources. This resolution is invaluable for chemical identification of molecules, and for investigations of velocity structure in astronomical objects. SOURCE: Lucy Ziurys, University of Arizona.
are invaluable in investigating galactic chemical evolution and nucleosynthesis in stars. Maser action often occurs in certain molecules in star-forming regions and in envelopes of evolved stars, such as in SiO or CH3OH. Observations of maser lines provide information on small-scale structure and time variability of emitting sources.
The 71-238 GHz region also covers the premier spectral windows for astrochemistry. Many new interstellar molecules are discovered by observations at these frequencies, as illustrated by the recent identification of CCP, PO, HSCN, AlO, and AlOH. It is naturally difficult to predict a priori the transition frequencies of any possible new molecule. Therefore, protecting given lines does not fully cover the science that comes from observations in these bands.
TABLE 2.4 Important Astronomical Uses of the 71-238 GHz Bands
|
|
||
| Scientific Topic | Common Molecular Probes | Frequencies (GHz) |
|
|
||
| Star formation, mass loss from young proto-stars, protostellar disks | CO, HCN, HCO+, N2H+, CS, H2CO, HC3N, CH3OH, CH3CN, SO2 | 115, 230, 88,a 89,b 93, 96, 144, 234, 72, 142, 218, 72, 91,100, 109, 136, 145, 154 , multiple lines for CH3OH, CH3CN, SO2 |
| Galactic structure, molecular clouds | CO, H2CO, HCO+, HCN | 115, 230, 72, 141, 89, 88c |
| External galaxies, molecules at high red shift | CO, HCN, HCO+, CH3OH | 115, 230, 88,d 89,e multiple lines for CH3OH |
| Evolved stars, planetary nebulae | CO, HCN, HCO+, SiS, SiO, SiC2, CCH, C4H, HC5N, SO2, HC3N | 115, 230, 88,f 89, 73, 91, 109, 142, 87, 174, multiple for C4H through HC3N |
| Diffuse clouds | CO, HCN, HCO+, SO, CN, CCH, C3H2 | 115, 88, 89, 100, 113, 87, 88 |
| Comets, planetary atmospheres | HCN, HCO+, CS, H2CO | 88,g 89,h 96, 144, 234, 144, 218 |
| Astrochemistry | Numerous molecules | |
| Interstellar masers | SiO, H2O, CH3OH, HCN | 86, 130, 217, 107, etc |
| Isotope ratios | CO, HCN, CN, H2CO, MgNC, NaCl | 113/115, 88/86, 110/113, multiple for CH3OH, MgNC, NaCl |
| Astrobiology | PO, CP, PN, H2CO, all organics | 109, 152, 174, 95, 97, 143, 238, 97, 140, 234, 71, 142, 218, various |
|
|
||
a The J = 3 → 2 transition of HCN is at 265 GHz.
b The J = 3 → 2 transition of HCO+ is at 267 GHz.
c HCN has an important transition frequency at 265 GHz.
d Ibid.
e HCO+ has an important transition frequency at 267 GHz.
f HCN has an important transition frequency at 265 GHz.
g Ibid.
h HCO+ has an important transition frequency at 267 GHz.
NOTE: Important transitions also exist in the frequency range 238-275 GHz, for example, the J = 3 → 2 transitions of HCN and HCO+.
This region is used for both filled aperture spectroscopy and imaging, and covers several of the prime bands for ALMA: Band 3 (84-115 GHz) and Band 6 (210-275 GHz).
Finally, this spectral region is important for astrobiology, and the study of life in the universe. It is commonly thought that Earth lost its original carbon in the form of a methane atmosphere. The carbon on this planet today had to come from exogenous delivery via comets, meteorites, and interplanetary dust particles, which appear to carry debris from the original molecular cloud in which the solar system was created. Observations of organic molecules in molecular clouds are enabling the link to be made between the carbon inventory on planets and that of the presolar nebula.
Summarized below in Table 2.4 are some of the important astronomical uses of this spectral region.
Earth Exploration-Satellite Service
EESS (passive) spectrum in the range between 71 and 238 GHz is used operationally for several vital measurements of Earth and its atmosphere for weather and climate applications. Global water vapor profiles are essential to the numerical weather prediction of rainfall and drought and help constrain such predictions in general.2 Water vapor is the primary mechanism for energy storage and its movement within the atmosphere as it drives extreme weather events. Combined microwave and infrared spectral data can yield what is nearly all-weather global observations, even in most cloudy conditions, of water vapor and air temperature profiles.3 The critical importance of the oxygen and water vapor lines at 115-122 and 176-190 GHz cannot be over emphasized: due to the unique molecular properties of oxygen and water vapor, atmospheric temperature and humidity in particular cannot be measured in bands other than those currently allocated. A list of additional scientific applications is given in Table 2.4 and Table 2.5 gives a list of corresponding applicable frequencies. Given the importance of weather forecasting and climate monitoring to the public, it is important that we protect this region of the spectrum for continued successful EESS use.
TABLE 2.5 EESS Uses of Spectrum from 71 to 238 GHz
|
|
||
| Use/Measurement/Target | Significance | Frequencies (GHz) |
|
|
||
| Atmospheric humidity and temperature profiles | Used operationally in numerical weather prediction, forecasting of severe storms, and monitoring climate | 115-122, 176-190 |
| Cloud ice content | Forecasting of severe storms, and monitoring climate | 8585-92, 150-160 |
| Precipitation | Planning operations and monitoring climate | 8585-92 |
| Land surface type | Monitoring climate | 8585-92 |
| Trace gases | Mapping of key atmospheric constituents (HCN, NHO3, N2O, ClO, CO, O3) tied to carbon cycle, global climate, ozone depletion, pollution, atmospheric transport | 177.26, 181.59, 200.98, 204.35, 206.13, 230.54, 233.95, 235.71 |
| Sea ice extent and concentration | Monitoring climate | 8-92 |
|
|
||
SOURCE: Adapted from Tables 2.1 and 2.2 found in National Research Council, Spectrum Management for Science in the 21st Century, The National Academies Press, Washington, D.C., 2010, pp. 137-138.
_________________
2 National Research Council, Spectrum Management for Science in the 21st Century, The National Academies Press, Washington, D.C., 2010, pp. 29-30.
3 Ibid.
AGENDA ITEM 1.11: 23 GHZ SPACE RESEARCH SERVICE UPLINK
Agenda Item 1.11 seeks to consider a primary allocation to the space research service (Earth-to-space) within the band 22.55-23.15 GHz, taking into account the results of ITU R studies, in accordance with Resolution 753 (WRC 07).
The primary concern is the 22.21-22.5 GHz band, which has a co-primary allocation between the EESS and RAS passive services and the fixed and mobile services, except for aeronautical mobile services. To protect EESS satellite observations from interference, ITU-R RS.1029 recommends a maximum interference level in the 22.21-22.5 GHz band of -249 dBW/Hz, with this interference level not to be exceeded for more than 0.1 percent of the sensor viewing area or measurement time. In this band, ITU Radio Regulations Footnote 5.149 states that “administrations are urged to take all practicable steps to protect the radio astronomy service from harmful interference. Emissions from spaceborne or airborne stations can be particularly serious sources of interference to the radio astronomy service.” The proximity of the proposed communication uplink to the allocated 22.21-22.5 GHz band increases the risk that out-of-band emissions will interfere with EESS and RAS passive services. The chance of interference depends upon the density of the communication transmitters and their locations.
In this context, a recent paper submitted to US Working Party 7B (US WP7B/062, Update to WRC-12 Agenda Item 1.11 CPM Text) predicts, “The number of SRS earth stations transmitting in the 22.55-23.15 GHz band will be small. … The number of SRS earth station sites capable of supporting Lunar and/or L2 missions is not expected to exceed eight or nine on a global basis. A similar number of SRS earth stations may support low Earth orbiting (LEO) missions, also on a global basis. These earth stations are typically located in rural, isolated areas at mid latitudes.” However, EESS passive observations from satellites are made on a global basis and could experience interference from even one earth station, regardless of its geographic location. Microwave radiometers from the U.S. Air Force, Navy, DOD, NOAA, NASA and other federal agencies have been making space-borne observations near 22 GHz since the Nimbus E Microwave Spectrometer was launched in 1972. EESS satellite sensors shown in Table 2.6 are currently observing in the allocated 22.1-22.5 GHz band.
Passive microwave observations of water vapor are important in part because weather radars measure only the reflectivity of water/ice droplets in the atmosphere. Extraction of useful information from radar reflectivity measurements relies greatly on knowledge of the droplets’ size distribution, which requires complex and costly multiband radar measurements to directly measure. Passive microwave instruments, on the other hand, directly measure the total quantity of liquid water as well as water vapor and other variables. Such radiometers can herald impending weather events by measuring the presence of water vapor in advance of cloud formation, and then detect the formation of liquid water droplets well in advance of detection by rain radars. Moreover, when used in conjunction with weather radars, passive radiometers provide a high degree of precision in the measurement of the path- or area-averaged quantities being observed that serve to calibrate the radar’s signal. In this manner the radiometer is able to facilitate the radar’s capability to provide high resolution measurements.1
TABLE 2.6 EESS Passive Sensors Using the Spectrum between 22 and 24 GHz
| Sensor | Satellites (currently on orbit) | Agencies | Minimum Frequency (GHz) | Maximum Frequency (GHz) |
| SSMIS | DMSP F16 | U. S. Air Force | 22.04 | 22.44 |
| SSM/I | DMSP F13 and F15 | U.S. Air Force | 22.11 | 22.36 |
_________________
1 National Research Council, Spectrum Management for Science in the 21st Century, The National Academies Press, Washington, D.C., 2010, p. 24-25.
Passive measurements from EESS satellites near the water vapor absorption line at 22.2 GHz are essential not only for measuring atmospheric water vapor but also for reducing error in other geophysical parameters due to the presence of water vapor, especially in moist atmospheres. For example, the accuracy in measuring sea surface wind speed, sea surface temperature, liquid cloud water or precipitation would significantly degrade if the 22 GHz water vapor channel was not present or unusable due to RFI contamination.
Conclusion: The primary concern regarding a possible space research service (Earth-to-space) uplink within the band 22.55-23.15 GHz is the EESS primary allocation at 22.21-22.5 GHz. To protect EESS satellite observations from interference, ITU-R RS.1029 recommends a maximum interference level in the 22.21-22.5 GHz band of -249 dBW/Hz, with this interference level not to be exceeded for more than 0.1% of the sensor viewing area or measurement time.
To protect the primary services in the band 37-38 GHz from interference resulting from aeronautical mobile service operations, taking into account the results of ITU R studies, in accordance with Resolution 754 (WRC 07).
The primary concern is the continued protection of the 36-37 GHz EESS (passive) allocation used by microwave radiometers from the U.S. Air Force, Navy, NOAA, and NASA, which have been making space-borne observations near 37 GHz since Scanning Multichannel Microwave Radiometer was launch in 1978. The passive EESS sensors shown in Table 2.7 are currently on orbit, measuring at frequencies either in or directly adjacent to the 37-38 GHz band. In addition to the current sensors, two missions currently in development will operate in this frequency band: NASA’s Global Precipitation Measurement’s (GPM) Microwave Imager (GMI) and the Joint Polar Satellite System (JPSS) Microwave Imager Sounder (MIS).
Based upon scientific requirements expected to be achieved in 2008-2013, to protect EESS satellite observations from interference, ITU-R RS.1029 (2003) recommended a maximum interference level in the 36.0-37.0 GHz band of -246 dBW/Hz, with this interference level not to be exceeded for more than 0.1% of the sensor viewing area or measurement time. In the specific part of the band from 36.43-36.5 GHz, ITU Radio Regulations Footnote 5.149 states that “administrations are urged to take all practicable steps to protect the radio astronomy service from harmful interference. Emissions from spaceborne or airborne stations can be particularly serious sources of interference to the radio astronomy service.”
This band is needed to distinguish between water vapor content and liquid cloud content and also constitutes an essential part of measurements of ocean wind speed, snow cover depth on land, as well as sea ice type, age and temperature. Measurement of these geophysical parameters is critically important to weather prediction, climate monitoring and understanding changes in the global water cycle. Performing such passive microwave measurements at a suite of frequencies is essential to separate the effect of water vapor, clouds, and/or precipitation from changes in the radiance of the land, ocean or ice below. The suite of frequencies most often used for this includes a subset of 18.7, 19.35, 22.2, 23.8, 31.4, 36.5, 37.0, 85.5 and 89 GHz.1
TABLE 2.7 EESS Passive Sensors Using the Spectrum Between 36 and 38 GHz
| Sensor | Satellites | Agencies | Minimum Frequency (GHz) | Maximum Frequency (GHz) |
| SSMIS | DMSP F16 | U. S. Air Force | 36.25 | 37.75 |
| SSM/I | DMSP F13 and F15 | U.S. Air Force | 36.5 | 37.5 |
| WindSat | Coriolis | U.S. Navy | 36.0 | 38.0 |
| AMSR-E2 | EOS Aqua | NASA and JAXA | 36.0 | 37.0 |
| GMI | GPM | NASA | 36.0 | 37.0 |
| MIS | JPSS | DOD | 36.0 | 37.0 |
| TMI | TRMM | NASA | 36 | 38 |
_________________
1 National Research Council, Spectrum Management for Science in the 21st Century, The National Academies Press, Washington, D.C., 2010, p. 29.
2 AMSR-2 on GCOM-W1, set for launch in early 2012, is a follow-on to AMSR-E and is planned to operate at a center frequency of 36.5 GHz. SOURCE: http://sharaku.eorc.jaxa.jp/AMSR/AMSR2_RA/documents/GCOM_RA1_E.pdf; last accessed on June 18, 2010.
Conclusion: The primary concern is the continued protection of the 36-37 GHz EESS (passive) allocation used by current and future microwave radiometers from the U.S. Air Force, Navy, NOAA, and NASA, which have been making space-borne observations near 37 GHz since Scanning Multichannel Microwave Radiometer was launch in 1978. Based upon scientific requirements expected to be achieved in 2008-2013, to protect EESS satellite observations from interference, ITU-R RS.1029 (2003) recommended a maximum interference level in the 36.0-37.0 GHz band of -246 dBW/Hz, with this interference level not to be exceeded for more than 0.1% of the sensor viewing area or measurement time.
To consider the results of ITU-R studies in accordance with Resolution 551 (WRC-07) and decide on the spectrum usage of the 21.4-22 GHz band for broadcasting-satellite service (BSS) and the associated feeder-link bands in Regions 1 and 3.
Recommendation: Satellite transmissions in the 21.4-22.0 GHz band should have low enough out-of-band emissions to avoid interference in the 22.21-22.5 GHz Radio Astronomy Service band based on Recommendation ITU-R RA.769.
Radio Astronomy Service
The primary concern for Radio Astronomy is that direct broadcast satellites in the 21.4-22.0 GHz band could result in out-of-band emissions from the satellites spilling into the 22.21-22.5 GHz RAS band.
The power flux density (pfd) proposed for the BSS in the band 21.4-22.0 GHz in Recommendation ITU-R BO.1776 is -165 dBW/m2/Hz. The limit specified in Recommendation ITU-R RA.769 for interference with radio astronomy continuum observations is -231 dBW/m2/Hz; thus, more than 6665 dB rejection of out-of-band emissions are required to avoid interference in the passive band. For radio astronomy spectral line observations, the recommended limit is –216 dBW/m2/Hz; thus, more than 5140 dB rejection of out-of-band emissions are required within any 250 kHz bandwidth to avoid interference in the passive band. In summary, satellite transmissions in the adjacent band need to have low enough out-of-band emissions to avoid interference with radio astronomy based on Recommendation ITU-R RA.769.
Earth Exploration-Satellite Service
The primary concern for EESS is that the proximity of 21.4-22.0 GHz to the 22.21-22.5GHz 5band increases the risk that out-of-band emissions will interfere with Earth observation of atmospheric water vapor. To protect EESS satellite observations from interference, ITU-R RS.1029 recommends a maximum interference level in the 22.21-22.5 GHz band of –249 dBW/Hz, with this interference level not to be exceeded for more than 0.1% of the sensor viewing area or measurement time.
Microwave radiometers from the U.S. Air Force, Navy, DOD, NOAA, NASA and other federal agencies have been making space-borne observations near 22 GHz since the Nimbus E Microwave Spectrometer was launched in 1972. EESS satellite sensors shown in Table 2.8 are currently observing at frequencies very close to the upper edge of the 21.4-22.0 GHz band. In addition to the current sensors, a number of microwave radiometers are planned for launch aboard future satellites, including the NASA Global Precipitation Measurement’s (GPM) Microwave Imager (GMI) and the JPSS Microwave Imager Sounder (MIS) and Advanced Technology Microwave Sounder (ATMS).
TABLE 2.8 EESS Passive Sensors Using the Spectrum Between 22 and23 GHz
| Sensor | Satellites (currently on orbit) | Agencies | Minimum Frequency (GHz) | Maximum Frequency (GHz) |
| SSMIS | DMSP F16 | U. S. Air Force | 22.04 | 22.44 |
| SSM/I | DMSP F13 and F15 | U.S. Air Force | 22.11 | 22.36 |
Performing such passive microwave measurements at a suite of frequencies is essential to separate the effect of water vapor from those of clouds, precipitation or changes in the radiance of the land, ocean or ice below. Scientifically, global water vapor profiles are essential to the numerical weather prediction of rainfall and drought, and help constrain such predictions in general. Two different types of microwave observations are used, those in transparent bands within which the water vapor absorption stands out (1) against the colder ocean background (ocean partially reflects the extremely cold cosmic background radiation), or (2) against that of cold, low-emissivity land. No profile information is usually retrieved, only an estimate of the column integrated abundance. The suite of frequencies most often used for this includes a subset of 18.7, 19.35, 22.2, 23.8, 31.4, 36.5, 37.0, 85.5 and 89 GHz.1
Additionally, passive microwave observations of water vapor are important because weather radars measure only the reflectivity of water/ice droplets in the atmosphere. Extraction of useful information from radar reflectivity measurements relies greatly on knowledge of the droplets’ size distribution, which requires complex and costly multiband radar measurements to directly measure.
Passive microwave instruments, on the other hand, directly measure the total quantity of liquid water as well as water vapor and other variables. Such radiometers can herald impending weather events by measuring the presence of water vapor in advance of cloud formation, and then detect the formation of liquid water droplets well in advance of detection by rain radars. Moreover, when used in conjunction with weather radars, passive radiometers provide a high degree of precision in the measurement of the path- or area-averaged quantities being observed that serve to calibrate the radar’s signal. In this manner the radiometer is able to facilitate the radar’s capability to provide high resolution measurements.2 Passive measurements from EESS satellites near the water vapor absorption line at 22.2 GHz are essential not only for measuring atmospheric water vapor but also for reducing error in other geophysical parameters due to the presence of water vapor, especially in moist atmospheres. For example, the accuracy in measuring sea surface wind speed, sea surface temperature, liquid cloud water or precipitation would significantly degrade if the 22 GHz water vapor channel was not present or unusable due to RFI contamination.
_________________
1 National Research Council, Spectrum Management for Science in the 21st Century, The National Academies Press, Washington, D.C., 2010, p. 29.
2 Ibid, pp. 24-25.
AGENDA ITEM 1.14: 30-300 MHZ RADAR
To consider[s] the requirements for new applications in the radiolocation service and reviews allocations or regulatory provisions for implementation of the radiolocation service in the range 30-300 MHz, in accordance with Resolution 611 (WRC-07).
The primary concern for radio astronomy is that additional radiolocation service allocations being considered by Agenda Item 1.14 should avoid the 37.50-38.25 MHz, 73.00-74.60 MHz and 150.05-153.0 MHz passive Radio Astronomy Service (RAS) bands, and those new allocations should provide suppression of unwanted emissions in these RAS bands to meet the requirements of ITU-R RA Rec.769 in these bands at registered RAS low-frequency observing sites. Signals in the 30-300 MHz band can propagate up to 2000 km by sporadic E and meteor scatter and up to about 800 km by tropospheric scattering and refraction.
Radio astronomy observations in this frequency range include the study of the early universe for which new arrays are currently under construction. For example, the Murchison Widefield Array (MWA) is being built in the radio quiet zone of the Western Australian outback. One of the major goals of the MWA is to study the hydrogen in the cosmic background for redshifts from about 6 to 17 (frequency range of 80-200 MHz) to study the structure of the early universe through the period known as the “Epoch of Reionization” when the primordial hydrogen becomes ionized as star formation starts.1
PROPAGATION BY SPORADIC E AND METEOR SCATTER
Sporadic E propagation is the occasional reflection of radio waves at frequencies up to about 200 MHz by thin clouds of intense ionization in the “E” layer of the ionosphere at an altitude of 90 km to 120 km. Sporadic E events may last for just a few minutes to several hours. The causes of the ionization enhancement is an active area of study. Recent research indicates that high altitude lightning, wind-shear and gravity waves may be involved in the concentration of metal ions thought to dominate the thin sporadic E clouds. Research also shows a correlation with the deposition of metal ions from meteor sources in the ecliptic plane which might explain the increased frequency of sporadic E during the summer months. Typical distances of propagation range from about 900 km up to about 2500 km. For correlation with deposition of metal ions from meteor sources, see C. Haldoupis, D. Pancheva, W. Singer, C. Meek, and J. MacDougall, 2007, An explanation for the seasonal dependence of midlatitude sporadic E layers, J. Geophys. Res. 112:A06315, doi:10.1029/2007JA012322. For wind shear gravity waves, see J.D. Mathews, 1998, Sporadic E: Current views and recent progress, simultaneous measurements of meteoric influx and Es, J. Atmos. Sol. Terr. Phys. 60:413. For lightning, see C.J. Davis and C.G. Johnson 2005, Lightning-induced intensification of the ionospheric sporadic E layer, Nature 435:799-801.
Meteor scatter is a mode of propagation used for low data rate communications up to distances of 2000 km. It is routinely the mode of reception of distant FM stations in remote areas and is characterized by its “bursty” nature. Billions of meteors enter Earth’s atmosphere each day and produce ionization at altitudes from about 80 to 100 km. The region of mutual visibility between two Earth stations extends out to about 2000 km. At this distance the typical path loss due to scattering is about 195 dB at 73 MHz.
Recommendation: Additional radiolocation service allocations in the 30-300 MHz band being considered should avoid the 37.50-38.25 MHz, 73.00-74.60 MHz and 150.05-153.0 MHz passive bands, and should provide suppression of unwanted emissions in these radio astronomy service bands to meet Recommendation ITU-R RA Rec.769.
_________________
1 National Research Council, Spectrum Management for Science in the 21st Century, The National Academies Press, Washington, D.C., 2010, pp. 112-113.
AGENDA ITEM 1.15: 3-50 MHZ, OCEANOGRAPHIC RADAR
To consider possible allocations in the range 3-50 MHz to the radiolocation service for oceanographic radar applications, taking into account the results of ITU R studies, in accordance with Resolution 612 (WRC 07).
Earth Exploration-Satellite Service
Agenda Item 1.15 seeks to provide a formal allocation for oceanographic radars which have operated on an experimental basis between 3 and 50 MHz in the past. A number of systems are deployed along the U.S. coast that support oceanographic observations of winds and currents.1 The frequencies and power levels of these wave radar (WERA) systems vary (see Table 2.9). Bandwidths of WERA systems depend on resolution and typically are 50 kHz or 125 kHz, though 500 kHz is desired for high resolution applications.2 The systems could potentially be used for tsunami warnings and sea ice motion. They are also used for monitoring oil spills, ship movements and search and rescue applications and have become essential for both safety and meteorological applications. A formal allocation is sought to continue to support these uses.
TABLE 2.9 Example Systems with Center Frequencies and, where available, Transmit Power Levels
|
|
||
| WERA System | Location | Frequency and Transmit Power Levels (where applicable) |
|
|
||
| OSCR | U.S. | 24.5 MHz |
| NASA | U.S. | 50.0 MHz |
| NiCT | Japan | 9.25 MHz |
| WERA | Germany | 29.85 MHz, 27.65 MHz, 16.045 MHz, 12.50 MHz (30 W) |
| WERA | Florida | 12 MHz 16 MHz (30 W) |
| WERA | South Carolina | 8.3 MHz (30 W) |
|
|
||
Conclusion: Oceanographic radars operating in 3-50 MHz do not adversely affect any other known EESS bands and are thus not of concern for EESS(passive), so long as out-of-band RFI is maintained at levels compatible with Recommendation ITU-R RS.1029.
Radio Astronomy Service
The primary concern for Radio Astronomy is the Radio Astronomy Service (RAS) bands in the 3-50 MHz range (which include 13.36-13.41, 25.56-25.67 and 37.50-38.25 MHz) should be protected from unwanted emissions due to new allocations.
Use of 10-50 MHz is important to current and future radio astronomy. Features essential to understanding the earliest cosmic structures (redshifted hydrogen from the “Dark Ages” before the first generation of quasars) are expected to appear in the lowest frequencies accessible through the ionosphere. Signals in this frequency range propagate on continental to global scales due to ionospheric refraction and other mechanisms. Every effort should be made to ensure that the oceanographic radars do not impact the radio telescopes operating between 3-50 MHz.
Scientific frontiers in this frequency range include: (1) The periodic or transient universe such as the emission from extra-solar planets, gamma-ray bursts, ultra-high energy cosmic rays, and new sources
_________________
1 See http://sampit.geol.sc.edu/radar.html.
2 See http://ifmaxp1.ifm.uni-hamburg.de/WERA_Guide/WERA_Guide.shtml.
of unknown origin; (2) The high-redshift (z) universe, including distant black-hole-powered radio galaxies and clusters—tools for understanding proto-galaxy collapse in the early Universe and the cosmological evolution of Dark Matter and Dark Energy, respectively—and path-finding studies of the Dark Ages at z > 30 (í < 50 MHz), before stars turned on or galaxies formed; and (3) Acceleration, propagation, and turbulence in the interstellar medium, including the space distribution of galactic cosmic rays and supernova remnants together with scattering- and absorption-based probes of the magnetized interstellar plasma.
Meteor scatter and sporadic E can have path loss as low 160 dB (for distances in the 800-2000 km range) at 30-50 MHz so that an EIRP of about –30 dBW will be at the interference (approx. –190 dBW sensitivity of the LWA) threshold levels of the LWA. If the radars radiate +20 dBW EIRP (100 watts) out to sea they will need to be sure their antenna backlobe is down by 50 dB to avoid interfering with the LWA in New Mexico.
Recommendation: Unwanted emissions due to new radar allocations the 3-50 MHz range should be low enough to meet the levels of Recommendation ITU-R RA.769 in the Radio Astronomy Service bands at 13.36-13.41, 25.56-25.67 and 37.50-38.25 MHz.
AGENDA ITEM 1.18: SECOND HARMONIC EMISSIONS INTO 4800-5000 MHZ
Agenda Item 1.18 considers extending the existing primary and secondary radiodetermination-satellite service (space-to-Earth) allocations in the band 2 483.5-2 500 MHz in order to make a global primary allocation, and to determine the necessary regulatory provisions based upon the results of ITU R studies, in accordance with Resolution 613 (WRC 07).
The primary concern for Radio Astronomy is second harmonic emissions into the 4800-4990 and 4990 to 5000 MHz bands. Nearly all centimeter wavelength radio telescopes operate in the 4800-5000 MHz band to study the continuum radio emission from stars, galaxies, quasars, gamma-ray bursts and other sources of galactic and extragalactic thermal and non thermal continuum radiation. If enacted in full, this agenda item could impact radio astronomy in the 4800-5000 MHz band as a result of second harmonic radiation. So, second harmonic radiation should be kept below the level given in Recommendation ITU-R RA.769 in the band 4800 MHz to 5000 MHz as addressed in 5.402:
The use of the band 2483.5-2500 MHz by the mobile-satellite and the radiodetermination-satellite services is subject to the coordination under No. 9.11A. Administrations are urged to take all practicable steps to prevent harmful interference to the radio astronomy service from emissions in the 2483.5-2500 MHz band, especially those caused by second-harmonic radiation that would fall into the 4990-5000 MHz band allocated to the radio astronomy service worldwide.
Recommendation: Second harmonic radiation emissions into the 4800-5000 MHz band should be kept below the level given in Recommendation ITU-R RA.769 as addressed in 5.402.
AGENDA ITEM 1.19: SOFTWARE-DEFINED RADIO AND COGNITIVE RADIO SYSTEMS
To consider regulatory measures and their relevance, in order to enable the introduction of software-defined radio and cognitive radio systems, based on the results of ITU R studies, in accordance with Resolution 956 (WRC 07).
Resolution 956 (WRC-07), the impetus for WRC Agenda Item 1.19, considers implementation of software-defined and cognitive radio technologies.
The primary concern with respect to this item is that any changes to spectrum regulation to implement these technologies must account for the unique requirements of RAS and EESS. RAS and EESS are receive-only services that require consistently and extraordinary low levels of interference in order to function productively;1 these requirements are documented in multiple ITU Recommendations.2
Recommendation: Any modification to existing methods of allocating or managing spectrum should not result in higher levels or additional instances of harmful interference in spectrum already allocated for Radio Astronomy Service and Earth Exploration-Satellite Service.
Recommendation: Great care should be taken prior to enactment of new regulations in order to ensure that new uses of spectrum—especially those in frequencies adjacent to or harmonically-related to existing Radio Astronomy Service (RAS) or Earth Exploration-Satellite Service (EESS) allocations—do not result in increased levels of interference to RAS or EESS through unwanted emission.
Recommendation: Representatives of the Radio Astronomy Service and Earth Exploration-Satellite Service spectrum management communities should be included in deliberations that might lead to the establishment of universal “beacon” or “pilot” channels, “dynamic databases,” and other technologies intended to facilitate “dynamic spectrum access” or dynamic changes in other emission characteristics including modulation type, bandwidth, and power levels.
As noted in Resolution 956 (WRC-07), RAS and EESS facilities do not transmit, thus it is impossible for a radio system to discover these users of the spectrum without additional means. Engagement of the RAS and EESS communities early in the development of these technologies (and associated regulatory developments) will be important to identify these additional means, and will also increase the chances of identifying mutually-beneficial solutions.
_________________
1 National Research Council, Handbook of Frequency Allocations and Spectrum Protection for Scientific Uses, The National Academies Press, Washington, D.C., 2010, pp. 79-90.
2 See ITU-R Recommendation RA-769; ITU-R Recommendation RS-1029; and other Recommendations are given in National Research Council, Handbook of Frequency Allocations and Spectrum Protection for Scientific Uses, The National Academies Press, Washington, D.C., 2010, pp. 105-108.
AGENDA ITEM 1.20: HAPS LINKS IN 5850 TO 7075 MHZ
To consider[s] the results of ITU R studies and spectrum identification for gateway links for high altitude platform stations (HAPS) in the range 5 850-7 075 MHz in order to support operations in the fixed and mobile services, in accordance with Resolution 734 (Rev.WRC 07).
RADIO ASTRONOMY SERVICE
The primary concern for Radio Astronomy is the presence of two important spectral lines within this frequency range: Methanol at 6668.518 MHz and OH at 6035.093 MHz. Additionally, there is concern that HAPS-like satellites will be line-of-sight to a very large area. For example at 22 km altitude the radius of the line of sight coverage is about 530 km in radius and consequently unwanted emissions need to be low enough to meet the levels of Recommendation ITU-R RA.769 if HAPS platforms are deployed within range of radio astronomy observatories.1
Observations of the spectral line of the methanol molecule at a rest frequency of 6668.518 MHz are critically important in the understanding of the structure of our galaxy. This structure is very difficult to determine because we live in the plane of our galaxy and view it edge on. The methanol line radiates as maser emission from the envelopes of newly formed massive stars throughout the galaxy. These maser stars act as precise beacons whose three dimensional coordinates and velocity vectors can be determined by high precision astrometry with very long baseline interferometry. Such precision astrometry cannot be achieved by optical space missions because of the effects of dust absorption in the galactic plane.
Another spectral line in this band is the OH transition at 6035.093 MHz. It also radiates as a maser in the envelopes of massive stars and is particularly useful in measuring the magnetic field strengths in the envelopes of these stars.
Recommendation: Unwanted emissions should be low enough to meet the levels of Recommendation ITU-R RA.769 in Radio Astronomy Service frequency allocations if high-altitude platform stations are deployed within range of radio astronomy observatories.
Earth Exploration-Satellite Service
The primary concern for EESS is Earth remote sensing satellites currently use, and will continue to use, spectrum near 6.8 GHz to measure soil moisture (SM) and sea surface temperature (SST).2 NASA’s EOS Aqua carries the Japanese AMSR-E radiometer that observes a bandwidth of 350 MHz at 6.925 GHz (soon to be accompanied by the Japanese GCOM-W1’s AMSR-2 that also observes a bandwidth of 350 MHz at 6.925) and the Navy’s WindSat radiometer that observes a bandwidth of 130 MHz at 6.8 GHz. The U.S. Joint Polar-orbiting Satellite System (JPSS) will use band(s) between 5-8 GHz to monitor SST and SM, both of which strongly affect the weather and climate. Because of the microwave physics this frequency range is the best for measuring SST and is very practical for measuring soil moisture. International Footnote 5.458 urges “Administrations [to] bear in mind the needs of the Earth exploration-satellite (passive) and space research (passive) services in their future planning” of this frequency range. Indeed, actions affecting this frequency range should be considered carefully so its use by EESS (passive) is preserved.
_________________
1 Rygl, K, Brunthaler, A., Reid, M.J., Menten, K, van Langelde, H.J., and Xu, Y., “Trigonometric Parallaxes of the 6.7 GHz Methanol Masers,” Astronomy and Astrophysics, 2010, 511, A2; and Menten, K., “The Discovery of a new, very strong and widespread methanol maser line,” Astrophysical Journal, 1991, 380, L75.
2 National Research Council, Spectrum Management for Science in the 21st Century, The National Academies Press, Washington, D.C., 2010.
AGENDA ITEM 1.21: 15.4-15.7 GHZ RADAR
To consider a primary allocation to the radiolocation service in the band 15.4-15.7 GHz, taking into account the results of ITU-R studies, in accordance with Resolution 614 (WRC-07).1
Radio Astronomy Service
The primary concern is radar in the 15.4-15.7 GHz band could spill into the 15.35-15.40 GHz RAS/EESS band. The RAS band at 15.35-15.40 GHz is used extensively to study the origins of high energy jets driven by black holes in the centers of galaxies, which radiate copiously by the synchrotron process in this band. The nature of these jets and their connection to the evolution of galaxies is an important issue in modern astrophysics. If the radar has a peak power of +30 dBW EIRP then the received signal at 20 km is –67 dBW/m^2, so that the out-of-band emissions of the radar need to be below –89 dBc to meet the limit specified in Recommendation ITU-R RA.769 to avoid the radar causing direct interference in the RAS/EESS band. Airborne transmitters coming closer than 20 km would require even more stringent limits on unwanted emissions into the adjacent passive band.
Recommendation: Radar in the 15.4-15.7 GHz band should have a sufficiently low level of unwanted emissions to avoid interference in the adjacent 15.35-15.40 GHz Radio Astronomy Service/Earth Exploration-Satellite Service band in accordance with the limits specified in Recommendation ITU-R RA.769.
_________________
1 Resolution 614 is to study, as a matter of urgency, the technical characteristics, protection criteria, and other factors to ensure that radiolocation systems can operate compatibly with systems in the aeronautical radionavigation and fixed-satellite services in the band 15.4-15.7 GHz, taking account of the safety nature of the aeronautical radionavigation service; to study, as a matter of urgency, the compatibility between the radiolocation service in the band 15.4-15.7 GHz and RAS in the adjacent band 15.35-15.40 GHz.
AGENDA ITEM 1.25: ADDITIONAL MOBILE-SATELLITE SERVICE IN THE BANDS 4-16 GHZ
To consider[s] possible additional allocations to the mobile-satellite service, in accordance with Resolution 231 (WRC 07).
ITU-R studies are focusing on the following frequency bands for which detailed technical compatibility or sharing analysis are yet to be made (see Table 2.10).
Radio Astronomy Service
The primary concern for Radio Astronomy is that the frequency range 4-16 GHz contains the following RA bands: 4800-4990 MHz (secondary), 4990-5000 MHz (primary), 10.6-10.7 GHz (primary) and 15.35-15.4 GHz (primary). Nearly all centimeter wavelength radio telescopes operate in the 4800-5000 MHz band to study the continuum radio emission from stars, galaxies, quasars, gamma-ray bursts and other sources of galactic and extragalactic thermal and non thermal continuum radiation. The downlink in the 5150-5250 MHz band is close to the 4990-5000 MHz passive band used for continuum studies of galactic and extragalactic sources.
Recommendation: Satellite downlink transmissions should have low enough out-of-band emissions to minimize interference with radio astronomy based on Recommendation ITU-R RA.769. This applies to uplinks as well, though if well separated from observatory sites, uplinks are unlikely to cause interference.
Earth Exploration-Satellite Service
The primary concern for Remote Sensing is that the frequency range 4-16 GHz contains the 10.6- 10.7 GHz EESS (passive) allocation as well as the bands near 7 GHz in use by current assets. These bands are used for a number of EESS applications including observations of soil moisture, sea surface temperature, sea surface height, sea ice, snow, and precipitation. Measurement of these geophysical parameters is critically important to weather prediction, climate monitoring and understanding changes in the global water cycle. Current spaceborne radiometers observing Earth in 10.6-10.7 GHz suffer from interference making the data unusable in certain areas, e.g., over the Mediterranean Sea, due to satellite s-E transmissions reflected off the ocean surface.1 Additional passive bands of interest include the spectrum near 6.8 GHz to measure soil moisture (SM) and sea surface temperature (SST). (See also agenda item 8.2) NASA’s EOS Aqua carries the Japanese AMSR-E radiometer measuring in 350 MHz at 6.925 GHz and the Navy’s WindSat radiometer measures in 130 MHz at 6.8 GHz. The U.S. Joint Polar-orbiting Satellite System (JPSS) will use band(s) between 5-8 GHz to monitor SST and SM, both of which strongly affect the weather and climate. Because of the microwave physics this frequency range is the best for measuring SST and is very practical for measuring soil moisture. International Footnote 5.458 urges “Administrations [to] bear in mind the needs of the Earth exploration-satellite (passive) and space research (passive) services in their future planning” of this frequency range. Indeed, actions affecting this frequency range should be considered carefully so its use by EESS (passive) is preserved.
_________________
1 National Research Council, Spectrum Management for Science in the 21st Century, The National Academies Press, Washington, D.C., 2010, pp. 67-72.
TABLE 2.10 Data from WMO Preliminary Position Paper, September 28, 2009
|
|
||
| Frequency Band | MSS Direction | Meteorological Applications Concerned |
|
|
||
| 4 400-4 500 MHz | DL or UL | |
| 4 800-4 990 MHz | UL | |
| 5 150-5 250 MHz | DL | |
| 7 055-7 250 MHz | DL | Passive sensing |
| 7 750-7 900 MHz | UL | MetSat |
| 8 400-8 500 MHz | UL | |
| 10.5-10.6 GHz | DL, but UL might also be considered | Passive sensing (adjacent band) |
| 13.25-13.4 GHz | DL | Active sensing |
| 14.8-15.35 GHz | DL or UL | |
|
|
||
NOTE: DL, downlink, UL, uplink.
There are a number of active applications of EESS in the frequency range of interest, including 5.4 GHz which is used by the ESA ASCAT for ocean wind and ocean current measurement, and 13.4 GHz which has been used by NASA for ocean wind sensing. These sensors are used operationally in weather and storm prediction. Interference degrades the measurement accuracy, resulting in loss of coverage and adversely impacting forecasting capability. Other examples of active applications are spaceborne synthetic aperture radars (SARs) such as RADARSAT2 (5.355-5.455 GHz) and TerraSAR-X (9.05-10.05 GHz).
Recommendation: Per International Footnote 5.458, “Administrations [are urged to] bear in mind the needs of the Earth exploration-satellite (passive) and space research (passive) services in their future planning” of this frequency range to protect current and future spaceborne observatories.
AGENDA ITEM 8.1.1C: SOCIETAL BENEFIT
Agenda Item 8.1.1C deals “with improving the recognition of the essential role and global importance of Earth observation radiocommunication applications and their societal benefits.”
Humanity takes advantage of the natural emissions of terrestrial and astrophysical sources to increase understanding of our environment and our place in the Universe. Access to these faint tracers of key physical parameters is vital to our safety and insight. These incredibly sensitive passive sensors require protection from interference. The ITU has provided protection through its Regulations and Recommendations. It needs to continue (and improve) this recognition of the vital role of the passive observing services (RAS and EESS) into the future.
The exponential growth of remote sensing technology in the recent past has collectively provided an enormous amount of information and insight. This has become a key means to understand the effects of changes in both the natural and artificial environment and to provide information for effective decision-making and resource management in many areas of our society and lives. In addition, remote sensing science and technology have economic benefits, both in job creation and in early warning of potentially disastrous and disruptive situations. As remote sensing observations continue, they are expected to yield revolutionary insights about our environment and serve as a catalyst to increase effective use of natural resources. The fields that benefit from Earth remote sensing are broad based and varied. Some of the key applications include the following:
• Critical public safety needs are addressed using aviation, maritime, defense, and anti-collision radars.
• Weather prediction and climate change benefit from global monitoring of clouds, precipitation, surface winds, moisture, temperature, aerosols, trace gasses and changes in glaciers and Earth’s vegetation canopy (biomass).
• Weather forecasting and climate monitoring are vital for human health, welfare and security. They are also beneficial in daily outdoor activities, transportation, agriculture, and defense. They have reduced the impact on property and human life of extreme weather events such as hurricanes, droughts, tornados, and wildfires.
• Detection of forest fires reduces both response time and damage.
• Data on land use, planning and coastal monitoring benefits both developed and developing countries.
• More effective management of natural resources is enabled by remote sensing data.
• Spectral monitoring and management yield improved utilization and reduction in frequency interference for scientific, governmental, defense and commercial applications.
• The availability of Earth remote sensing data increases the capabilities of scientific, government and commercial users.
• Research and development efforts supporting observations in the passive spectral bands have and will likely continue to produce high-tech spinoffs that benefit our society.
Astronomical observations transform our understanding of fundamental physics, the origin and evolution of the universe, and the place of humanity in the universe. To achieve these goals, astronomers, physicists and engineers have developed sensitive instruments and sophisticated software. In many instances these push the state of the art, not only for science but for practical applications in health, safety and commercial applications. As noted in the CORF Handbook, the ability to determine redshift, for example, “is directly related to the ability to cover the widest possible bandwidth in a search; therefore, it
is important to preserve portions of the spectrum to allow this fundamental information to be measured.”1,2,3,4
Preservation of access to faint, naturally occurring signals found in the terrestrial and astrophysical environments through formal recognition of the passive observing services remains a vital role of humanity, through the ITU.
Conclusion: Earth observation using radiocommunication frequencies has become a key means to understand the effects of changes in both the natural and artificial environment, and to provide information for effective decision-making and resource management in many areas of society and life. In addition, Earth science and observation technology have economic benefits, both in job creation and in early warning of potentially disastrous and disruptive situations. These benefits will continue, and increase as technology pushes humankind’s understanding of its environment even further.
_________________
1 National Research Council, Handbook of Frequency Allocations and Spectrum Protection for Scientific Uses, The National Academies Press, Washington, D.C., 2010, pp. 26.
2 See also National Research Council, Spectrum Management for Science in the 21st Century, The National Academies Press, Washington, D.C., 2010, pp. 90-105.
3 National Research Council, Handbook of Frequency Allocations and Spectrum Protection for Scientific Uses, The National Academies Press, Washington, D.C., 2010, pp. 26.
4 See also National Research Council, Spectrum Management for Science in the 21st Century, The National Academies Press, Washington, D.C., 2010, pp. 90-105.
Recommend[s] to the Council items for inclusion in the agenda for the next WRC, and to give its views on the preliminary agenda for the subsequent conference and on possible agenda items for future conferences, taking into account Resolution 806 (WRC 07).
Secondary Allocation to EESS (passive) of a 200 MHz Bandwidth Located Between 6.425 and 7.250 GHz
Recommendation ITU-R RS.1029 states that 200 MHz of bandwidth between 6.425 and 7.250 GHz is required for sea surface temperature and soil moisture remote sensing. Radio Regulations footnote 5.458 recognizes the current use of this frequency range for remote sensing of sea surface temperature and states, “Administrations should bear in mind the needs of the Earth exploration-satellite (passive) and space research (passive) services in their future planning of the bands 6.425-7.025 MHz and 7.075-7.250 MHz.”
Recommendation: A secondary allocation for Earth Exploration-Satellite Service (passive) between 6.425 and 7.250 GHz should be sought to normalize the radio regulations with the current and planned practical passive use of the spectrum for Earth observation.
Following the launch of NASA’s EOS Aqua in 2002 and Navy’s WindSat in 2003, radiometers have been passively using the spectrum near 7 GHz to measure soil moisture and sea surface temperature on a global basis. Table 2.11 lists current and future U.S. EESS passive sensors using this band. The satellites in Table 2.11 will have benefits that reach far beyond the countries that funded them.
Soil moisture is a key factor in evaporation and transpiration at the land-atmosphere boundary. Due to the large amount of energy required to vaporize water, soil moisture has a large influence on both surface energy and carbon fluxes at Earth’s land surface. Sea surface temperature provides critical information on the ocean surface thermal state, which plays an important role in the transpiration of gases at the air-sea boundary. Such air-sea interactions are important in climate studies. Furthermore, since the density of water is determined by its temperature and salinity, sea surface temperature is a key determinant of waves and currents in response to external forces. Passive microwave measurements of sea surface temperature in the 7-GHz band “see through” nearly all clouds and precipitation. Such all-weather coverage permits measurement of the ocean surface during and after hurricanes and tropical cyclones, which often spawn cirrus clouds that block geostationary weather satellites from viewing the surface at visible and infrared wavelengths from 1 day to about a week.
TABLE 2.11 EESS Passive Sensors Using the Spectrum Between 6.425 and 7.250 GHz
| Sensor | Satellites | Minimum Frequency (GHz) | Maximum Frequency (GHz) |
| WindSat | Coriolis | 6.737 | 6.863 |
| AMSR-Ea | EOS Aqua | 6.750 | 7.100 |
| MIS | JPSS (under development) | 6.450 | 6.800 |
aAMSR-2 on GCOM-W1, set for launch in early 2012, is a follow-on to AMSR-E and is planned to operate at two center frequencies of 6.925 and 7.3 GHz. See http://sharaku.eorc.jaxa.jp/AMSR/AMSR2_RA/documents/GCOM_RA1_E.pdf; accessed on June 18, 2010.


