
1
The Growth of University Technology Transfer
INTRODUCTION
By most accounts, the Bayh-Dole Act of 1980 (P.L. 96-517, the Patent and Trademark Act Amendments of 1980) together with a number of important changes in the patent system2 has stimulated extensive patenting and licensing activity among research universities in the United States. Although a substantial amount of research has centered on this means of transferring technology developed by university scientists and engineers, there is a lack of consensus about the intended and unintended effects of university management of technology transfer and the lessons learned from more than three decades of experience. In response to these issues, the Board on Science, Technology, and Economic Policy and the Committee on Science, Technology, and Law of the National Research Council conducted a consensus study to distill lessons from both research and experience regarding the acquisition, licensing, defense, and sale of intellectual property (IP) arising from publicly and privately sponsored research at U.S. academic institutions.
The committee’s work was informed by commissioned papers synthesizing existing research, a commissioned survey of university technology managers, and a series of open sessions featuring presentations from diverse participants. Armed with this background information, the committee conducted a series of deliberations focused on evaluating the various objectives of technology transfer and recommending good practices for research institutions and research sponsors (public and private). The results of those deliberations are presented in this report. This first chapter provides a background to the report by placing IP-based university technology transfer in the context of the many ways that knowledge from academic research is disseminated to and used in the private sector and by discussing the forms of technology transfer that involve IP transactions.
UNIVERSITY MANAGEMENT OF TECHNOLOGY TRANSFER IN PERSPECTIVE
Universities have a lengthy track record of providing dynamic environments for generating new ideas and spurring innovation, and for moving advances in knowledge and technology into the commercial stream where they can be put to work for the public good; these endeavors collectively are referred to as “technology transfer.” Given that public investment in research has been an explicit national priority for more than six decades, and given the level of that investment, universities arguably have an obligation to organize themselves effectively to facilitate the transition of knowledge into practice. This transition takes place through a variety of mechanisms,3 including but not limited to
-
movement of highly skilled students (with technical and business skills) from training to private and public employment;4
-
publication of research results in the open academic literature that is read by scientists and engineers in all sectors;5
-
personal interaction between generators and users of new knowledge (e.g., through professional meetings, conferences, seminars, industrial liaison programs, and other venues);
-
firm-sponsored (contract) research projects involving firm-institution agreements;
-
multi-firm arrangements such as university-industry cooperative research centers; and
-
personal individual faculty and student consulting arrangements with individual private firms
-
entrepreneurial activity of faculty and students occurring outside the university without involving university-owned IP, and
-
licensing of IP to established firms or to new start-up companies.
Many industries critical to the U.S. economy have relied on basic and applied academic research in the past century, including agriculture, biotechnology, chemicals, pharmaceuticals, software, microelectronics,
|
3 |
For a discussion of these mechanisms, see W.M. Cohen, R.R. Nelson, and J.P. Walsh. 2002. Links and impacts: The influence of public research on industrial R&D. Management Science 48:1-23; L. Branstetter and K.H. Ug. 2004. The restructuring of Japanese research and development: The increasing impact of science on Japanese R&D. RIETI Discussion Paper Series 04-E-021; and R.K. Lester. 2005. Universities, innovation, and the competitiveness of local economies. MIT Industrial Performance Center Working Paper MIT-IPC-05-0101. |
|
4 |
See, e.g., National Academy of Engineering. 2003. The Impact of Academic Research on Industrial Performance. Washington, D.C.: National Academies Press. Also, the Kauffman Foundation’s survey of Massachusetts Institute of Technology (MIT) alumni found that an estimated 6,900 MIT alumni companies with worldwide sales of approximately $164 billion are located in Massachusetts alone and represent 26 percent of the sales of all Massachusetts companies, and 4,100 MIT alumni-founded firms are based in California and generate an estimated $134 billion in worldwide sales. Kauffman Foundation. 2009. Entrepreneurial Impact: The Role of MIT. Available at: http://www.kauffman.org/uploadedFiles/MIT_impact_full_report.pdf. |
|
5 |
R. Lester, op. cit. |
computers, telecommunications, and aerospace. In 2008, U.S. companies spent $2.5 billion out of their total $219.6 billion R&D investment at U.S. colleges and universities, representing 5 percent of university R&D spending.6 Directly sponsored research is just a small part of the web of intricate academic-industrial interaction that characterizes the U.S. innovation system.
Of the eight mechanisms of technology transfer listed above, the first seven offer significant contributions to the economy, yet it is the eighth (licensing of IP7) that is more often discussed, measured, quantified, and debated than the other mechanisms combined.8 There are several reasons for this. First, patenting and licensing activities by universities are easier to observe and measure than several of the other mechanisms, for example, movement of students and consulting arrangements. Second, in contrast with scholarly publications and most professional interactions, patenting and licensing activities are characterized by readily apparent economic value or distinct potential revenue streams for businesses, universities, and faculty inventors. Third, there has been a dramatic upsurge in patenting and licensing since 1980, which is primarily associated with a change in federal policy brought about by passage of the Bayh-Dole Act. Although the economic value of licensing is readily apparent, the social value of licensing activities (i.e., the net societal benefit of commercialization of a particular IP) is more difficult to estimate and is expected to be larger than the economic value recorded.
|
6 |
National Science Board. 2008. Science and Engineering Indicators. See Table 4-1, U.S. R&D expenditures, by funding and performing sectors: 2006. Available at: http://www.nsf.gov/statistics/seind08/c4/tt04-01.htm. |
|
7 |
See Cohen et al., op. cit., which surveys U.S. manufacturing firms and finds that patents and licensing are relatively unimportant as mechanisms of knowledge transfer. These authors’ survey data were collected in 1994 and confined to manufacturing firms. The growing importance of service sector firms and changes in the use of mechanisms since 1994 may affect the interpretation of these results. See also A. Agrawal and R. Henderson. 2002. Putting patents in context: Exploring knowledge transfer from MIT. Management Science 48:44-60, which reports results of qualitative interviews with MIT professors in mechanical engineering, electrical engineering, and computer science and finds similarly low relative importance of patents and licensing as channels of knowledge transmission. The Agrawal and Henderson data were collected in 2000 and are confined to two specific engineering fields. |
|
8 |
The use of mechanisms apart from patenting and licensing have been documented using (1) survey responses from manufacturing firms (see Cohen et al., op. cit.); (2) survey responses from university scientists and engineers (see A.N. Link, D.S. Siegel, and B. Bozeman. 2007. An empirical analysis of the propensity of academics to engage in informal university technology transfer. Industrial and Corporate Change 16(4):641-655); (3) structured interviews with academics, technology transfer officers, administrators, and managers (see D.S. Siegel, D. Waldman, D.L. Atwater, and A.N. Link. 2004. Toward a model of the effective transfer of scientific knowledge from academicians to practitioners: Qualitative evidence from the commercialization of university technologies. Journal of Engineering and Technology Management 21:115-142); and (4) industry-specific case studies (see National Academy of Engineering. 2003. The Impact of Academic Research on Industrial Performance. Washington, D.C.: National Academies Press). Cohen et al. and the National Academy of Engineering studied the effect of academic research on industrial R&D, although using distinctly different methods (survey responses and industry-specific case studies, respectively). |
THE BAYH-DOLE ACT
The Act established a uniform patent policy among federal agencies funding research conducted by small businesses and nonprofit organizations (including universities) largely enabling them to retain title to inventions made under federally funded research programs. For universities, the legislation shifted the incentive structure for commercialization by clarifying that taking ownership of inventions arising from federally funded research and licensing those inventions on terms enabling their commercial development could be standard practice for academic institutions.
Prior to passage of Bayh-Dole, the U.S. government had accumulated 30,000 patents, of which only approximately 5 percent were commercially licensed.9 As federal funding to support research in military, defense, and medical technologies increased following World War II, the government did not have a unified patent policy. Starting with the Kennedy administration, attempts were made to develop a consistent government-wide policy, but the policies put forth directed title to the agencies and not to the public.
Nonprofit organizations, led by the University of Wisconsin–Madison, sought even more favorable policies and successfully entered into Institutional Patent Agreements (IPA), which, among other things, allowed universities and nonprofits with approved patent policies to retain title to their inventions. While an improvement over the practice at the time, the IPA only applied to federally funded inventions supported by the National Institutes of Health (NIH) and the National Science Foundation (NSF). With all other agencies, universities would need specific approval or approval on a case-by-case basis.
With agencies disagreeing on a uniform technology transfer policy, no simple consistent mechanism existed for universities to move academic research to the marketplace. Agencies varied widely in whether they allowed university ownership of inventions and in the speed with which they handled requests to transfer title to inventions. Consequently, very little federally funded research was commercialized prior to 1980. As Senator Birch Bayh noted at the time, “What sense does it make to spend billions of dollars each year on government-supported research and then prevent new developments from benefitting the American people because of dumb bureaucratic red tape?”10
One purpose of the Act was to provide consistency within federal agencies with respect to inventions developed with federally funded research. The broader purpose of the Act was to ensure that publicly funded inventions should, whenever possible, enhance the public welfare through commercialization of technology to contribute to public health, government missions, job creation, international competitiveness, economic growth, and other public goods.
The Act was by no means the first statute intended to use higher education institutions to contribute to economic welfare. More than a century earlier, the Morrill Act of 1862 (7 U.S.C. Sec 301 et seq.) made it possible for the states to establish “land-grant institutions” emphasizing the teaching and advancement of agricultural science and the mechanical arts. The Morrill Act land grants laid the foundation for a national system of state colleges and universities. Such institutions not only opened the door to higher education to thousands of farmers and working people, but also stimulated interaction with agricultural producers and food and equipment manufacturers.
The Bayh-Dole Act was intended to minimize the likelihood that government-funded inventions would languish for lack of incentives or government capacity to license them to private firms that could develop them into products and services. It also aimed to establish a more uniform policy that would reduce the transaction costs to institutions, give them incentives to acquire and license rights, and limit the risks to firms of investing in and commercializing inventions developed with federal funds.11
In giving universities the right to retain title, the government imposed a number of balancing conditions and limitations that do not apply to patent holders more generally and that would shape implementation of this ownership scheme. First, the Act stipulated that universities give a preference in licensing to small businesses and firms (whether large or small) that develop and manufacture domestically. Second, the statute retained a royalty-free paid-up license for government use of inventions. Third, the Act allowed a research sponsoring agency to assert a Declaration of Exceptional Circumstances (DEC), precluding the grantee or contractor institution from taking title, and to cancel an institution’s existing patent rights (“march-in”) in one of four specified circumstances, the most important being the institution’s or licensee’s failure to develop and commercialize the invention.12 Another provision required the university to share royalties with faculty inventors and devote the balance of any income to research and education. In short, through these conditions, Congress sought to protect important public interests rather than leave them entirely to the discretion of inventors or their institutions. The Act also obligated universities to establish policies requiring disclosure of inventions by faculty, initially to the institution and, within two months, to the federal agency sponsoring the research. Universities were granted periods within which to elect or waive title and to file a patent application. Apart from these conditions and procedural requirements, universities were given broad latitude in how to organize themselves to implement technology transfer.
The combined effects of Bayh-Dole—institutional responsibilities and incentives for patenting and licensing—may have led more universities to enter
into technology transfer activities than otherwise would have been the case, and even establish technology transfer offices, although the latter was a growing trend even prior to 1980.13
The Bayh-Dole Act applies only to the results of federally funded research, not research financed by state and local governments, philanthropic organizations, for-profit entities, or by institutions themselves. In 2007, approximately 62 percent of all R&D spending at universities and colleges came from the federal government—a substantial majority—but the remaining 38 percent of research funding constitutes a considerable amount of research not covered by the legislation.14 Although higher education institutions are free to enter agreements conferring title to inventions to other partners and sometimes do so, in practice most universities try to follow a uniform policy of acquiring and exercising title irrespective of the source of research funding. This is, in part, because of the undesirability of hindering the management of IP resulting from research activities with multiple funding sources, but also because of other reasons, such as the requirements of tax-exempt facilities financing or as partial compensation for institutional under-recovery of true overhead costs on sponsored research.
At the time the Bayh-Dole legislation was debated and enacted, there was considerable controversy, but not on grounds that retention of title by the government more effectively promoted the commercialization of research results. The government’s poor track record in this respect was apparent to all close observers. Nor was there a great deal of concern expressed about the effects of technology ownership on the culture of the university. Rather, some members of Congress and some critics outside government were philosophically opposed to the transfer of ownership of taxpayer-funded assets to non-government entities for exploitation and profit. They argued that this obliged taxpayers to pay twice—first for the research and again for the products developed from that research.15 After passage of the Act, opposition on these grounds dissipated over time. In 1983, President Ronald Reagan issued a memorandum extending the Bayh-Dole policy to all government contractors.16 Nearly 30 years later, that remains federal policy without significant modification or variation from one federal program or agency to another.
|
13 |
D.C. Mowery and B.N. Sampat. 2005. The Bayh-Dole Act of 1980 and university-industry technology transfer: A model for other OECD governments? The Journal of Technology Transfer 30(1):115-127. |
|
14 |
National Science Foundation, Division of Science Resources Statistics. 2008. Academic Research and Development Expenditures: Fiscal Year 2007. Detailed Statistical Tables NSF 09-303. Arlington, VA. Available at: http://www.nsf.gov/statistics/nsf09303/. |
|
15 |
A.J. Stevens. 2004. The enactment of Bayh-Dole. The Journal of Technology Transfer 29(1):93-99; H.G. Rickover. 1978. Government patent policy. Journal of the Patent Office Society 60(1):14-26. |
|
16 |
The memorandum did not change the policy in the Department of Energy and NASA, whose organizational statutes required government ownership of inventions developed by large for-profit contractors and grantees. There is a residual issue that occasionally arises but has not gained broad support—an argument that the government should be able to recoup some portion of university revenue from licensing or corporate profits from marketing a government-funded invention. |
Since 1980, most of the questions concerning university ownership of patented technology arising from federally sponsored research have centered on the effectiveness of university policies and practices and whether the academic environment is experiencing deleterious effects attributable to commercially motivated or related secrecy; delays in publication of research results; changes in faculty hiring, promotion, and tenure criteria; and redirection of research efforts away from curiosity-driven topics toward applications with the prospect of financial returns.17 In short, concerns center on whether aggressive pursuit of commercialization undermines the traditional mission of universities with respect to the pursuit and dissemination of fundamental knowledge.18 These questions are examined further in Chapter 2.
MEASURING UNIVERSITY PATENTING AND LICENSING AND THEIR RESULTS
Coincidental with the growth and professionalization of technology transfer as a component of the administrative structure of academic research institutions has been growing focus on the formal aspects of IP-based technology transfer—that is, invention disclosures, patents, licenses, new enterprises spun out of university research, and revenues.19 These outcomes are relatively easy to count, are reported annually by most institutions, and are taken by some as real or proxy measures of the effectiveness of Bayh-Dole policy and universities’ contributions to the economy. These metrics show steady increases in patenting and licensing activity over time.
According to a series of annual surveys begun in Fiscal Year 1991 by the Association of University Technology Managers (AUTM),20 among 109 U.S. non-profit institutions responding in both 1996 and 2004, inventions disclosed by faculty increased from an average of 66.9 per institution in 1996 to 115.4 in 2004 (a growth of 72.5 percent).21 New patent applications filed increased from an average of 22.8 per institution in 1996 to an average of 73.4 per institution in 2004 (a growth of 222 percent per institution). In Fiscal Year 2007, 193
|
17 |
J. Boyle. 2008. The Public Domain: Enclosing the Commons of the Mind. New Haven, CT: Yale University Press. |
|
18 |
S. Krimsky. 2004. Science in the Private Interest: Has the Lure of Profits Corrupted Biomedical Research? Lanham, MD: Rowman & Littlefield Publishers, Inc. |
|
19 |
Almost all studies focusing on the relationship between academic research and innovation are based on manufacturing sectors. For a rare study of the services industry, see the case study on the financial services industry in Chapter 6 of Report of the Panel on the Financial Services Industry. National Academy of Engineering. 2003. The Impact of Academic Research on Industrial Performance. Washington, D.C.: National Academies Press. |
|
20 |
Trends from the AUTM survey data should be interpreted with caution. Participation in the AUTM survey varies year by year, and it is possible that non-participation in a particular year is not random (e.g., a university choosing not to respond to the survey in a year of weak licensing activity). The cross-sectional data reported for a particular year (e.g., 3,633 issued patents in Fiscal Year 2007) is more reliable. |
|
21 |
AUTM U.S. Licensing Activity Survey, FY2007. R. Tieckelmann, R. Kordal, and D. Bostrom (eds.). Available at: http://www.autm.net/Content/NavigationMenu/Surveys/LicensingSurveysAUTM/FY2007LicensingActivitySurvey/AUTMUSLS07FINAL.pdf. |
institutions reported receiving 19,827 disclosures, an increase of 953, or 3 percent per institution compared with the 18,874 disclosures received from 189 institutions in 2006 (see Figure 1).22 In addition, respondents reported 3,633 issued patents. There has been a steady increase in the ratio of new patent filings to disclosures received—from 26 percent in 1991 to about 60 percent in 2007. However, there is uneven distribution in this activity, with most institutions filing fewer than 100 new applications in 2007, and averages can be misleading. There are vast differences among institutions, and the range of activity is quite broad, from 4 to 661 disclosures.
Overall licensing activity also has increased. In 2007, respondents to the AUTM survey reported executing 4,391 licenses, of which 1,805 were exclusive and 2,586 were nonexclusive. Respondents also reported 30,351 active licenses/options for Fiscal Year 2007, an increase from 27,322 active licenses/options reported by respondents for Fiscal Year 2005.
This activity is not evenly distributed across research fields and technologies. The AUTM survey ceased to collect field data years ago,23 but work supported by this committee indicates a high concentration in the life sciences in general and health biotechnology in particular. The 2009 survey of technology transfer offices by Maryann Feldman, University of North Carolina School of Public Policy, and Janet Bercovitz, University of Illinois at Urbana-Champaign, found that the life sciences accounted for 52.5 percent of the licensing activity among respondent offices (66), followed by material science (11.9 percent), software (9.3 percent), electronics (7.5 percent), and chemicals (4.0 percent). Write-in categories of “engineering” and “other” accounted for 9.3 and 5.4 percent, respectively. Naturally, the distribution differed by institution, but six universities with medical schools and one institution without a medical school reported that the life sciences accounted for 100 percent of their licenses.24
In an ongoing study of all of the invention disclosures reported to technology transfer offices in the University of California system (12 universities and laboratories in all) during the five-year period July 1, 1992, to June 30, 1997, Brian Wright and colleagues found that the life sciences and medical and pharmaceutical categories accounted for nearly 75 percent of the invention disclosures with a field identification, followed by electronics, software, and communication (10 to 12 percent combined) and chemicals (3.5 percent). The same life science categories also dominated the licenses associated with the disclosures filed during that period.25
|
22 |
Twenty-five percent of the disclosures were in the therapeutics/medical devices industry. |
|
23 |
A question about field of technology was reinstituted in the 2007 AUTM survey but drew a poor response rate. |
|
24 |
M. Feldman and J. Bercovitz. 2010. Organizational Structure as a Determinant of Academic Patent and Licensing Behavior: A Survey of American Research Universities. Report to the National Academy of Sciences Committee on Management of University Intellectual Property: Lessons from a Generation of Experience, Research, and Dialogue, pp. 4-5. Available at: http://www.nationalacademies.org/STEP. |
|
25 |
B. Wright, K. Drivas, and Z. Lei. 2009. A Preliminary View of UC Data on Disclosures, Licensing, and Patenting. Available at: http://www.nationalacademies.org/STEP. |
These distributions should not be surprising. In part they reflect the relevance of university research to industrial R&D. In part they reflect the relative importance of patent protection in different industries. The pharmaceutical industry, whose development costs are substantial and whose products are long-lived yet easily copied, has relatively few patents per product, and places a much higher premium on patents than do the semiconductor and electronic hardware industries, whose products have relatively short life cycles and typically incorporate many patented inventions.
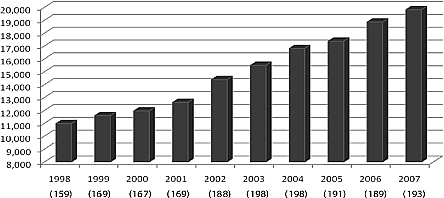
FIGURE 1 Number of disclosures reported as received in the year indicated by universities participating in the annual AUTM survey (number of respondents shown in parentheses). Source: AUTM U.S. Licensing Activity Survey: Fiscal Year 2007.
It is equally true that there is great variation in resources, effort, and outcomes across institutions. Fifty-nine respondents to the Feldman-Bercovitz survey provided annual technology transfer office expenditures for Fiscal Year 2007, ranging from $200,000 to $23 million (mean was $3 million, median $1.7 million). The number of technology transfer office employees ranged from 0 to 77 full-time equivalents (mean 6.4, median 4, 27 percent reported 2 employees or fewer); 2007 invention disclosures ranged from 4 to 1,411 (mean 130.5, median 83.5); patent applications ranged from 0 to 959 (mean 82); patent grants ranged from 0 to 331 (mean 26.3, median 18.5); licenses from zero to 231; and licensing income from $6,000 to $136 million.26
Licensing income can be impressive for some institutions, and this phenomenon has attracted attention and raised some controversy; some have expressed concern that the prospect of receiving income from licenses has shifted the emphasis of technology transfer activity away from careful consideration of broad dissemination and impacts on overall social welfare, an issue further explored in Chapter 2.
In Fiscal Year 2007, several universities generated significant licensing income.27 According to the AUTM data, New York University (NYU) led the
university community with more than $794 million in revenues. However, the licensing income reported by NYU can be misleading. The reported NYU revenue, and similar very large revenue reports from universities in recent years, is almost wholly attributable to the sale of an entire royalty stream from one commercially successful drug, not a single year’s annual royalties from a portfolio of inventions.28 Most inventions that individually have yielded in excess of $1 million of income to universities are in the pharmaceutical area. In 2007, Northwestern University sold a portion of its worldwide royalty interest in Lyrica to Royalty Pharma. The arrangement provided Northwestern with an immediate payout of $700 million and the potential for more since it only sold a portion of its royalty interest.29 The great majority of inventions generate modest revenues and many generate none; a handful of universities and a small fraction of all inventions are responsible for a large fraction of the revenues received. Trend data are also vulnerable to inconsistencies in survey participation. Some institutions have been reluctant to report single-year windfall events, and a few major research institutions do not participate in the AUTM survey at all.
Two decades of data collected from institutions by AUTM have shown that only 0.5 percent of license agreements generate more than $1 million in royalty income, suggesting that on average an institution would need at least 200 active license agreements to have one that generated more than $1 million. With about 10 licensing agreements concluded each year, an average academic institution could expect a return on that order once every 20 years.30 In addition, it is worth noting that while only one out of every 200 license agreements is expected to generate more than $1 million in royalty income, all 200 license agreements involve associated staffing, operating, patenting, and licensing costs. To be complete, any discussion of the returns to universities from licensing would have to include the related costs of all agreements.
Further, the reported revenues must be considered in context, as some universities are high performers and others have received little if any licensing revenue. For example, in 2007, Stanford University ranked 10th among U.S. universities in licensing income, at $50 million from 986 active licenses. Stanford’s research expenditures in 2007 were $700 million and its total budget for 2007-2008 was $3.8 billion, excluding the capital budget and the budget for hospital and clinical services. Thus, in 2007, licensing income was 1.3 percent of the budget. Similarly, MIT’s licensing income was 2.8 percent of its budget and the University of Washington’s licensing income was 2.3 percent of its budget.31 The numbers are far more modest for a majority of institutions, many
of which are struggling to generate additional revenues through a variety of means. While the AUTM survey does not provide total university budgets, median and mean licensing income were equivalent to 0.9 and 4.1 percent, respectively, of research expenditures for reporting institutions. This reflects the skew of the distribution by a few high-income institutions (see Figure 2).
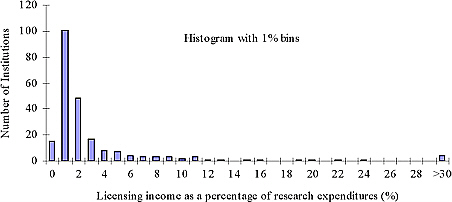
FIGURE 2 Histogram of licensing income as a percentage of university research expenditures, based on data from the AUTM U.S. Licensing Activity Survey: Fiscal Year 2007. While the mean value is 4.1 percent, the median is 0.9 percent. Three institutions were extreme outliers with values greater than 30 percent (65, 69, and 266 percent), illustrating the wide range of the data.
Moreover, most inventions—even those that have high social value when put into practice—do not generate significant licensing revenue. For example, in the past 40 years, Stanford’s Office of Technology Licensing has received more than 8,000 invention disclosures. Half of these have resulted in patents, and one-half of those have been licensed. However, less than 1 percent of the Stanford disclosures have generated $1 million or more in cumulative royalties. Furthermore, many highly successful “Stanford startups” involved the participation of Stanford faculty, staff, and students, but not the licensing of any university intellectual property in order to launch the start-up. Examples include CISCO, Sun Microsystems, Rambus, Yahoo!, and VMWare.32
An analysis of the AUTM licensing activity surveys of 1995-2004 indicates that the annual income generated by licensing university inventions was 1.7 percent of total research expenditures in 1995 and 2.9 percent in 2004.33 A 2006
analysis of academic licensing revenues from 1998 through 2002 found that net revenues were “on average, quite modest.”34
Although licensing income is distributed in various ways (i.e., to the institution, department, center, laboratory, and individual), it does, in the aggregate, increase the pool of research funds available to the university, departments, and investigators. Some institutions or departments within institutions do have a meaningful fraction of their research supported by licensing income derived from patents,35 but, within an institution, patenting and licensing activity may vary among departments. For example, Azoulay et al. reported that “patenting is concentrated among a relatively small number of departments and faculty members within medical schools. In particular, clinical faculty members were much less likely to be patent holders than their counterparts in basic science departments. In part, this difference reflects the fact that a substantial number of clinical faculty members are primarily engaged in clinical work.”36 Moreover, technology licensing income is highly skewed among institutions; a small number of technology transfer operations generate substantial net income, but for a very large number the costs incurred (e.g., salaries, legal fees) are a net drain on university resources.37
Although there are notable exceptions (e.g., discoveries instrumental to the development of new blockbuster drugs and royalty streams or other payments to universities), in the large scheme of things, licensing transactions have not been of high near-term economic value to either universities or businesses.38 Surveys of university technology transfer offices suggest that, for the majority, the costs of patenting, licensing negotiations, and defense of IP exceed the revenues from licensing, buyouts, or legal settlements.39 Moreover, one study has found that the returns to the institution from receiving equity in exchange for licensing IP are, on average, higher than those where the license provides only for cash royalties, although the data used in that study were largely from the 1990s, when the stock market and technology stocks in particular had positive performance.40 Universities are likely to seek equity as they gain experience in licensing, but
|
34 |
H. Bulut and G. Moschini. 2006. U.S. Universities’ Net Returns from Patenting and Licensing: A Quantile Regression Analysis. Center for Agricultural and Rural Development at Iowa State University Working Paper 06-WP 432. Available at: www.card.iastate.edu/publications/DBS/PDFFiles/06wp432.pdf. |
|
35 |
B.N. Sampat. 2006. Patenting and U.S. academic research in the 20th century: The world before and after Bayh–Dole. Research Policy 35(6):772-789. |
|
36 |
P. Azoulay, R. Michigan, and B.N. Sampat. 2007. The anatomy of medical school patenting. New England Journal of Medicine 15:357(20):2049-2056. |
|
37 |
J.G. Thursby and M.C. Thursby. 2007. University licensing. Oxford Review of Economic Policy 23(4):620-639. |
|
38 |
See, for example, NIH Response to the Conference Report Request for a Plan to Ensure Taxpayers' Interests are Protected. 2001. Available at: http://www.nih.gov/news/070101wyden.htm#execsum. |
|
39 |
Thursby and Thursby, op. cit. |
|
40 |
F.T. Rothermael, S.D. Agung, and L. Jiang. 2007. University entrepreneurship: A taxonomy of the literature. Industrial and Corporate Change 16:691-791. |
the pattern reverses when an institution has executed a large number of licenses; in those cases, the frequency of licenses that involve taking equity declines.41
In the AUTM survey in 2007, 191 respondents reported the formation of 555 new start-up companies based on university technology. During the previous year 554 companies were formed by 183 reporting institutions. Some institutions have focused their technology transfer efforts more on incubating start-ups than on patenting and licensing. Licensing by universities to newly formed companies is a growing phenomenon, but one for which few data are available except for the number of companies started. Data are not collected by AUTM, or a similar group, on how arrangements with universities are structured, how long university involvement lasts, or how much money universities make from start-ups.
Discussions about technology transfer have been skewed by the abundance of data regarding licensing and lack of reliable data about other forms of technology transfer. Despite the evidence that patenting and licensing are important modes of commercializing the results of academic scientific research,42 there has been growing concern about relying solely on invention disclosures, patent applications, patents granted, and licenses as measures of the commercialization of university research, which “could lead to a systematic underestimation of commercialization and innovation emanating from university research.”43 Other modes of technology transfer are far less easily quantified, except in laborious studies such as that sponsored by the Kauffman Foundation of MIT alumni.44 Moreover, some especially effective mechanisms of technology transfer—for example, the flow of students and trainees into industry and faculty consulting agreements—are not reported at all. Finally, the different mechanisms of technology transfer (publications, conferences/meetings, informal interactions, and consulting) tend to complement one another. Hence, if one means of technology transfer resulted in, for example, restrictions on publications or the public presentation of research results at meetings, the restrictions could adversely affect the transfer of results via the other relatively more important channels.45
Free exchange of information and presentation of knowledge through conferences and publications are critical to innovation; in particular cases, patenting and licensing can also play an important role. According to one study, faculty consulting, student recruitment, publications, and collaborative research
|
41 |
See M.J. Bray and J.N. Lee. 2000. University revenues from technology transfer: Licensing fees vs. equity positions. Journal of Business Venturing 15(5-6):385-392; M. Feldman, I. Feller, J. Bercovitz, and R. Burton. 2002. Equity and the technology transfer strategies of American research universities. Management Science 48(1):105-121. |
|
42 |
S. Shane. 2004. Encouraging university entrepreneurship? The effect of the Bayh-Dole Act on university patenting in the United States. Journal of Business Venturing 19(1):127-151. |
|
43 |
D.B. Audretsch, T. Aldridge, and A. Oettl. 2006. The Knowledge Filter and Economic Growth: The Role of Scientist Entrepreneurship. Prepared for the Ewing Marion Kauffman Foundation. March 29, 2006. p.7. |
|
44 |
E.B. Roberts and C.E. Eesley. 2009. Entrepreneurial Impact: The Role of MIT. Available at: http://entrepreneurship.mit.edu/sites/default/files/files/Entrepreneurial_Impact_The_Role_of_MIT.pdf. |
|
45 |
Cohen et al. 2002 |
rank higher than patenting and licensing activity as significant means of technology transfer from the perspective of MIT patent holders.46 Despite faculty members generally being required to disclose to their institutions47 inventions made using university resources—including grant funding—studies of technology transfer offices observe limited effectiveness in exploiting faculty inventions with commercial potential.48 Reasons for this apparent ineffectiveness might include the fact that many inventions are very early stage, failure by faculty inventors or industry to perceive commercial potential, preference by inventors for results to remain open, faculty distaste for restrictions that might result from commercialization efforts (e.g., publication delays or failure to publish), lack of faculty interest in commercialization activity, or desire by faculty to pursue commercialization independent of the university. Another explanation is that the disclosed faculty inventions may not actually have much commercial potential.49
University efforts to commercialize patent-protected technology occur against a backdrop of an innovation system that more than ever involves collaboration among firms of all sizes as well as between industry and academia via various arrangements, many of them informal. A study of leading U.S. innovations over the past few decades found that the sources of these innovations have changed in two important ways.50 First, large firms acting alone produce a smaller share of successful, award-winning innovations, while a much larger share comes from spin-offs from universities and federal laboratories. Second, the number of innovations arising from federally funded research has increased dramatically. The authors concluded that the U.S. innovation system has become much more collaborative and attribute this phenomenon to
-
growing global competition, which is shrinking technology life cycles;
-
the complexity of emerging technologies, which is beyond the internal R&D capabilities of even the largest firms;
|
46 |
Agrawal and Henderson, op. cit. |
|
47 |
As part of Bayh-Dole, universities require faculty to notify the university of inventions with potential commercial applications. This obligation was enforced by the courts in Fenn v. Yale Univ., 2006 U.S. App LEXIS 12479, where the U.S. Court of Appeals for the Second Circuit affirmed a district court order determining that Dr. John B. Fenn, a Nobel Laureate, had breached his contract with Yale University for failure to disclose in a timely manner. |
|
48 |
P.M. Swamidass and V. Vulasa. 2009. Why university inventions rarely produce income? Bottlenecks in university technology transfer. The Journal of Technology Transfer 34(4):343-363. |
|
49 |
J.G Thursby and M.C. Thursby. 2009. Chapter 6 Knowledge Creation and Diffusion of Public Science with Intellectual Property Rights, in Professor Hamid Beladi, Professor E. Kwan Choi (ed.) Intellectual Property, Growth and Trade (Frontiers of Economics and Globalization, Volume 2), Emerald Group Publishing Limited. p.199-232. |
|
50 |
F. Block and M.R. Keller. 2008. Where Do Innovations Come From? Transformations in the U.S. National Innovation System, 1970-2006. The Information Technology & Innovation Foundation. Available at: http://www.itif.org/files/Where_do_innovations_come_from.pdf. The study examined winners of the R&D Magazine “R&D 100” awards. |
-
the expansion of R&D capability in more industries, which is causing R&D investment to spread vertically in high-technology supply chains; and
-
the priorities of other countries to improve their R&D capacity and competitiveness.
In addition, although the U.S. innovation system today is much more collaborative than it was several decades ago and the federal government is playing a much more supportive and important role in innovation, total industry spending is now twice that of the federal government.
Chapter 2 examines issues that have dominated discussion of the influence of IP-based university technology transfers on university research norms and quality since the current system of institutional ownership and centrally administered licensing became the norm. Chapter 3 briefly addresses university implementation of the Bayh-Dole Act and federal oversight. Chapter 4 presents the committee’s findings and recommendations.


