
INTERNATIONAL OFFSETS USAGE IN PROPOSED U.S. CLIMATE CHANGE LEGISLATION
Allen A. Fawcett65
Abstract
International offsets play a central role in the cost containment strategies of both the Clean Energy and Security Act of 2009 (H.R. 2454), proposed by Congressmen Waxman and Markey and passed by the U.S. House of Representatives in 2009, and the Clean Energy Jobs and American Power Act of 2009 (S. 1733) proposed by Senators Kerry and Boxer and reported out to the Senate Environmental and Public Works Committee in 2009. Both bills allow over one billion tons of international offsets to be purchased each year to demonstrate compliance in lieu of purchasing domestic emissions allowances. The effectiveness of international offsets at controlling the cost of a domestic cap-and-trade policy is dependent on the cost and availability of international offsets. This paper explores how EPA has modeled the international offset market in its analyses of H.R. 2454, and how various uncertainties about the international offset market impact costs estimates for H.R. 2454.
JEL Classification Numbers:: C68, Q43, Q54, Q58
Keywords: Climate Change, Environmental Policy, CGE, Offsets
Introduction
The U.S. Environmental Protection Agency has produced several analyses of the American Clean Energy and Security Act of 2009, H.R. 2454 sponsored by Congressmen Waxman and Markey in the 111th Congress, and an assessment of the economic impacts of the Clean Energy Jobs and American Power Act of 2009, S. 1733 sponsored by Senators Kerry and Boxer in the 111th Congress. The analyses use two computable general equilibrium models (the Applied Dynamic Analysis of the Global Economy model, and the Intertemporal General Equilibrium Model), and focus on the impacts of H.R. 2454 on greenhouse gas emissions, national and regional macroeconomic indicators, specific sector characterizations, electricity generation technologies, trade implications, and markets for domestic offsets and international credits. The analyses have shown that the cost and availability of offsets, particularly international offsets, are one of the most important factors in determining the cost of a cap-and-trade policy. This paper describes how EPA has modeled the market for international offsets, and explores how sensitive allowance price estimates for H.R. 2454 are to various assumptions about international offsets.
The first section of this paper focuses on the legislative basis for offsets exploring the specific provisions that allow offsets in H.R. 2454 and S. 1733. This section focuses on how the offsets provisions differ between the two bills and the consequences of those differences.
The second section describes the data and models used by EPA to analyze the supply and demand of international GHG abatement in the context of EPA analyses of proposed climate legislation. The demand for international GHG abatement is characterized by the assumed international reference case GHG emissions, and the climate policies that are assumed to be adopted by other countries. This section also describes the international marginal abatement cost curves, including the data sources and adjustment processes used in their construction. Finally this section describes how the reduced-form Intertemporal General Equilibrium Model (IGEM) is used to integrate estimates of GHG abatement supply and demand to model the offsets market.
The third section of the paper presents EPA projections of international offsets usage under H.R. 2454. This section focuses on results from EPA’s January 29, 2010 analysis of H.R. 2454 using the IGEM model. This section describes how non-binding limits on international offsets change how estimates of domestic allowance prices are interpreted under various sensitivities. The section then turns to sensitivities on the availability of international
|
65 |
U.S. Environmental Protection Agency, 1200 Pennsylvania Ave. NW (6207J), Washington, DC 20460. Email: fawcett.allen@epa.gov. The views of the author do not necessarily represent the views of the U.S. Government or the Environmental Protection Agency. |
TABLE C.6 Summary of Key Offset Provisions
|
|
H.R. 2454 |
S. 1733 |
|
Overall offset limits |
2 billion tonsa |
2 billion tons |
|
Source level offset limits |
Does not aggregate to the overall limit |
Aggregates to the overall limit |
|
Domestic and international offset limits |
International: 1 billion tons Domestic: 1 billion tons |
International: 0.5 billion tons Domestic: 1.5 billion tons |
|
Criteria for adjusting international offset limit |
Domestic offset usage below 0.9 billion tons |
Domestic offset usage below 0.9 billion tons |
|
Revised international offset limit |
1.5 billion tons |
1.25 billion tons |
|
Performance standards |
Landfill and coal mine CH4 covered by performance standards, reducing their ability to supply offsets. |
Landfill and coal mine CH4 are not covered by performance standards. |
|
a Note that all references to tons in this paper refer to metric tons. |
||
offsets under H.R. 2454. Finally, this section describes how post-2050 caps can be modeled by assuming a terminal bank of emission allowances must be held at the end of a model run in 2050.
The final section of this paper describes EPA modeling of the market for international GHG abatement that supplies international offsets to the United States. This section quantifies the sources of international GHG abatement supply by region and type, and describes demand for abatement by region. This section then examines the effects of alternative reference emissions projections and alternative cap levels for other countries. Finally this section explores how the availability of reduced emissions from deforestation and degradation (REDD) affect the international GHG abatement market.
International Offsets in Proposed U.S. Climate Legislation
H.R. 2454 and S. 1733 both establish offsets credits as an additional method for entities to comply with the requirement to hold an emissions allowance for each ton of greenhouse gas emissions (see Table C.6).66 Instead of purchasing an emissions allowance for each ton of emissions, entities may also demonstrate compliance by purchasing an offset credit that represents reductions in greenhouse gas emissions (or increased sequestration of greenhouse gases) from a non-covered source (e.g., reduced emissions from landfill CH4, increased CO2 sequestration from changed agricultural tillage practices, or increased CO2 sequestration from afforestation). The non-covered sources providing offset credits can either be domestic or international.
Both H.R. 2454 and S. 1733 limit annual offset usage to 2 billion tons, 67 and then specify how the overall offset limit should be calculated on a per covered source basis to generate source level limits on the use of offsets.68 The formula for establishing the source level offset limit in H.R. 2454 does not add up to the overall 2 billion ton limit.69 S. 1733 corrects this problem so the source level limit is now consistent with the overall 2 billion ton limit
on offset usage.70 For the purposes of economic analysis or modeling, this change is not likely to have any impact on allowance prices, as the limits on offset usage were not binding in EPA’s analysis of H.R. 2454, and the revised limits in S. 1733 would also not be constraining.
In addition to the overall limits placed on the amount of offsets a covered entity can use, both H.R. 2454 and S. 1733 place limits on the amount of offsets that can come from either international or domestic sources. H.R. 2454 states that not more than one-half of offsets can come from domestic offset credits and not more than one-half can come from international offset credits. S. 1733 differs from H.R. 2454 in that not more than three-quarters of offsets can come from domestic offset credits and not more than one-quarter can come from international offset credits.71
After placing limits on domestic and international offset usage, both H.R. 2454 and S. 1733 state conditions under which those limits are modified. In both bills, if the estimated usage of domestic offsets is expected to be below 0.9 billion tons in any year, the limits on international offsets usage are modified. When this condition is met, H.R. 2454 allows additional international offset credits equal to the difference between 1 billion tons and the amount 1 billion tons exceeds the estimated domestic offset usage, up to an additional 0.5 billion tons of international offset credits. This has the potential to increase the limit on international offset credits in H.R. 2454 to 1.5 billion tons per year. In contrast, when this condition is met, S. 1733 allows additional international offset credits equal to the difference between 1.5 billion tons and the amount 1.5 billion tons exceeds the estimated domestic offset usage, up to an additional 0.75 billion tons of international offset credits. This can potentially increase the limit on international offset credits in S. 1733 to 1.25 billion tons per year, 0.25 billion tons less than in H.R. 2454.72
The 0.9 billion ton domestic offset trigger for allowing additional international offsets has the potential to create an unintended threshold effect, particularly in S. 1733. Consider the following hypothetical example, domestic offset usage in a particular year is 899 million tons, since this is below the 0.9 billion ton trigger, the limit on international offset usage under S. 1733 would be adjusted upwards 601 million tons (the difference between the 1.5 billion ton limit on domestic offsets and actual usage) from 0.5 billion tons to 1.101 billion tons. Now if domestic offset usage were to increase by one million tons from 899 to 900 million tons, then the limit on international offsets would fall by 601 million tons from 1.101 billion to 0.5 billion tons. In this situation a small change that would ordinarily lead to a small increase in allowance prices and small increases in offsets demand, has the potential to have a disproportionately large effect on allowance prices because of the discontinuous change in the international offsets limit. This issue also exists in H.R. 2454, but to a lesser degree as the 0.9 billion ton trigger for allowing extra international offsets is only 0.1 billion tons below the domestic offset limit, so the international offsets limit would only fall by 101 million tons in the analogous situation.
In EPA’s analysis of H.R. 2454, estimated usage of domestic and international offsets are below the limits established in H.R. 2454, and below the limits established in S. 1733 in all scenarios that do not place constraints on technology. Thus the changed language on offsets limits will not impact the costs of the bill as estimated by EPA in scenarios that do not place limits on technology. However, in scenarios with limits on the availability of technologies such as nuclear, biomass, and CCS, the limits on international offset usage would be reached. In these scenarios, when the limit on domestic offsets is not met, H.R. 2454 adjusts the limit on international offset usage to allow approximately 1.5 GtCO2e per year, while S. 1733 adjusts the limit on international offset usage to allow 1.25 GtCO2e per year. The fewer international offsets allowed by S. 1733 compared to H.R. 2454 in these limited technology scenarios would require an extra 9.5 GtCO2e of abatement from covered sources cumulatively over the 2012 to 2050 time frame, and would result in higher allowance prices.
International Offsets Modeling
In order to model international offsets, it is necessary to have information on both supply and demand for international greenhouse gas abatement. Since the United States is not acting unilaterally in any of our policy simulations, the price and availability of international offsets will be influenced by both the potential for GHG abatement, and the amount of GHG abatement demanded by other countries. This section discusses the reference projections of international greenhouse gas emissions and assumed international greenhouse gas policies, which together determine the international demand for greenhouse gas abatement. This section also covers the marginal abatement cost curves that represent the supply of greenhouse gas abatement available from various international sources at different carbon prices. Finally this section discusses how these projections of international GHG abatement supply and demand are integrated into the Intertemporal General Equilibrium Model (IGEM).
International Reference Emissions
The first part of projecting international demand for GHG abatement is projecting reference case GHG emissions internationally. Table C.7 describes the two broad country groupings used in this paper and in EPA modeling of H.R. 2454 and other legislative cap-and-trade proposals. Group 1 countries are those that are likely to adopt policies on climate change concurrently with the United States, and group 2 countries are those that are likely to delay their adoption of climate policies.
Figure C.18 depicts reference case GHG emissions for group 1 and group 2 countries as projected by the MiniCAM model. In this paper, and in EPA modeling of legislative cap-and-trade proposals, international reference emissions are based on the MiniCAM Climate Change Science Program Synthesis and Assessment Product 2.1a reference case (Clarke et al., 2007). As a sensitivity case, an alternate reference emissions projection is used based on the MiniCAM Energy Modeling Forum 22 (EMF 22) reference case emissions projection (Calvin et al., 2009).
While group 1 emissions are similar in the EMF and CCSP reference cases, group 2 emissions grow at a faster rate in the EMF reference case than under the CCSP reference case. The implication is that for equivalent cap levels, there will be greater demand for GHG abatement under the EMF reference case than under the CCSP reference case. The implications of this difference will be explored in a later section of this paper.
Assumed International GHG Policy—The G8 Agreement
With international reference emissions specified, the next step required to generate international demand for greenhouse gas abatement is to make an assumption about the climate policies adopted by other countries. The
TABLE C.7 Group 1 and 2 Countries
|
Group 1 |
Group 2 |
|
Canada |
Former Soviet Union |
|
Western Europe |
Eastern Europe |
|
Japan |
China |
|
Australia, New Zealand |
Southeast Asia |
|
|
Korea |
|
|
India |
|
|
Middle East |
|
|
Africa |
|
|
Latin America |
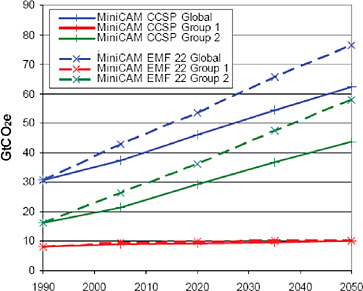
FIGURE C.18 International reference GHG emissions.
international policy assumed in EPA’s January 29, 2010 supplemental analysis of H.R. 2454, and the policy assumed for this paper, is based on the July 9, 2009 Major Economies Forum, where “the G8 leaders agreed to reduce their emissions 80% or more by 2050 as its share of a global goal to lower emissions 50% by 2050.” Specifically the international action assumed is as follows: group 1 countries follow an allowance path that is falling linearly from the reference emissions levels in 2012 to 83% below 2005 in 2050; group 2 countries adopt a policy beginning in 2025 that caps emissions at 2015 levels, and linearly reduces emissions to 26% below 2005 levels by 2050.
The combination of U.S., group 1, and group 2 actions cap 2050 emissions at 50% below 2005 levels. Figure C.19 depicts the cap levels consistent with the G8 agreement.
Marginal Abatement Cost Curves—Data Sources and Construction
A number of models are used by EPA to generate marginal abatement cost (MAC) curves for international offsets. The 2006 U.S. EPA report, “Global Mitigation of Non-CO2 Greenhouse Gases,” provides marginal abatement cost curves for the various sources of non-CO2 abatement. The Global Timber Model (Sohngen and Mendelsohn, 2006) generates the marginal abatement cost curves for international forest carbon sequestration. And the GCAM model (formerly known as the MiniCAM model) generates the energy related CO2 marginal abatement cost curves (Clarke et al., 2007). Table C.8 lists all of the mitigation categories along with model used to generate the data.
For each of these mitigation categories in Table C.8, marginal abatement cost curves are generated for two groups of countries: the first group, consisting of Annex I countries excluding the United States, is assumed to adopt market-based emissions policies immediately; and the second group, consisting of non-Annex I countries, is assumed to adopt market-based emissions policies in 2025 (see Table C.7 above).
An adjustment process is applied to the mitigation information from these models to represent the amount of abatement that would actually be available to the market either as an offset purchase or under a foreign market-
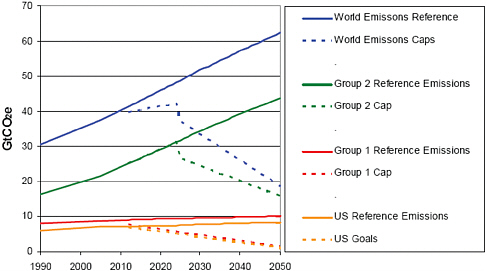
FIGURE C.19 G8 international assumptions.
TABLE C.8 Mitigation Categories and Data Sources for International MAC Curves
|
Mitigation Category |
Data Source |
|
CH4 from landfills |
U.S. EPA (2006) |
|
CH4 from coal mines |
U.S. EPA (2006) |
|
CH4 from the natural gas sector |
U.S. EPA (2006) |
|
CH4 from the oil sector |
U.S. EPA (2006) |
|
N2O from adipic acid production |
U.S. EPA (2006) |
|
N2O from nitric acid production |
U.S. EPA (2006) |
|
CH4 and N2O from livestock manure management |
U.S. EPA (2006) |
|
CH4 from livestock enteric fermentation |
U.S. EPA (2006) |
|
CH4, N2O, and soil carbon from paddy rice |
U.S. EPA (2006) |
|
N2O and soil carbon from cropland |
U.S. EPA (2006) |
|
F-Gases (11 source categories) |
U.S. EPA (2006) |
|
International forest carbon sequestration |
Sohngen and Mendelsohn (2006) |
|
International energy related CO2 |
Clarke et al. (2007) |
based emissions policy. For most of the above mitigation categories (excluding international energy-related CO2, CH4 from the natural gas sector, and CH4 from the oil sector), each mitigation option within each mitigation category was evaluated and a determination was made if it should be eligible to provide abatement from a country with a market-based emissions policy, and if it should be eligible to provide abatement from a country without a market-based emissions policy.
A uniform adjustment was applied to all mitigation options within the CH4 from the natural gas sector, and the CH4 from the oil sector mitigation categories. For these mitigation categories, a 50 percent reduction was applied for international regions assumed to have a market-based emissions policy, and a 75 percent reduction was applied for the periods before a market-based emissions policy is assumed to be in place. For international energy related CO2 emissions, no adjustments were made when a region is assumed to have market-based emissions policy in place. Before 2020, a 90 percent reduction is applied, and a 75 percent reduction is applied thereafter to
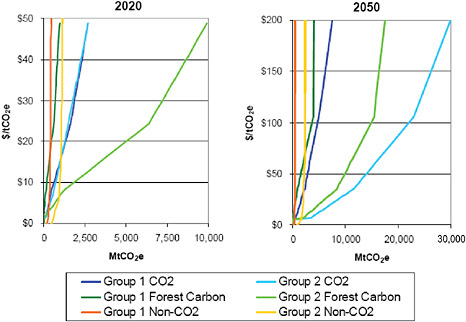
FIGURE C.20 2020 and 2050 marginal abatement cost curve comparisons.
the energy-related CO2 abatement potential in countries that have not adopted market-based emissions policies. These adjustments were meant to take into account the difficulties in measuring, monitoring, and verifying offset reductions in countries without a market-based greenhouse gas emissions policy, as well as the lack of a clear market signal that the allowance price in the model run assumes (U.S. EPA, 2007).
Marginal Abatement Cost Curves—Characterization
It is useful to plot the various marginal abatement cost curves to see how different abatement sources compare to each other, how abatement sources evolve over time, and how they compare across the country groups. Figure C.20 depicts the energy-related CO2, forest carbon sequestration, and the aggregate non-CO2 MAC curves for group 1 and 2 countries in 2020 and 2050.73
At very low prices, below approximately $5/tCO2e, non-CO2 abatement sources in group 1 and particularly in group 2 countries supply the majority of abatement. As prices increase, the non-CO2 MAC curves become vertical, and forest carbon and energy-related CO2 begin to dominate. In 2020, forest carbon sequestration in group 2 is the largest source of abatement at higer prices. The energy related CO2 MAC curves for group 1 and 2 in 2020 are very similar, even though actual CO2 emissions are much higher in group 2, due to the 75% reduction applied to the underlying energy-related CO2 MAC curve for group 2 estimated by the MiniCAM model. In 2050, after all regions are assumed to have adopted market-based climate policies, energy-related CO2 from group 2 is the largest source of abatement, closely followed by group 2 forest carbon sequestration.
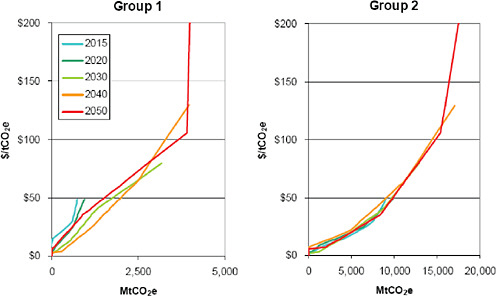
The non-CO2 MAC curves for group 1 and 2 in various years are presented in Figure C.21. The result of the adjustment process is evident in the group 2 curves. The 2015 and 2020 non-CO2 MAC curves for group 2 contain considerably less abatement potential than the MAC curves for later years, due to the reduced number of mitigation options eligible to supply abatement before group 2 is assumed to have adopted a market-based climate policy. In general, the non-CO2 MAC curves provide most of their abatement at relatively low carbon prices, and approach vertical at prices above approximately $60/tCO2e.
The forest carbon sequestration marginal abatement cost curves in Figure C.22 were generated by modeling a series of rising carbon price paths, as opposed to constant carbon price paths, in order to capture the important investment behavior associated with price expectations. In a dynamic model, the abatement potential available in 2050 at a carbon price of $100/tCO2e could be different depending on if the 2020 price were $25/tCO2e or $100/tCO2e. In all years, group 2 forest carbon sequestration abatement potential is considerably greater than the potential in group 1. In this set of MAC curves, reduced emissions from deforestation and degradation (REDD) are allowed from all regions in all years. In the policy experiments discussed below, the impact of not allowing REDD offsets is explored.
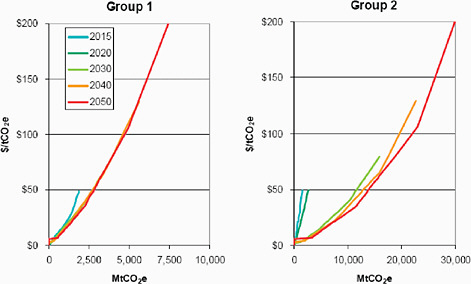
As with the forest carbon sequestration marginal abatement cost curves, the energy-related CO2 marginal abatement cost curves depicted in Figure C.23 were generated using a series of rising carbon price model runs. The adjustment process that was evident in the group 2 non-CO2 MAC curves is again evident in the group 2 energy-related CO2 MAC curves. The full energy-related CO2 abatement estimated by the MiniCAM model is reduced by 90% in the 2015 MAC curve and by 75% in the 2020 MAC curve. Starting with the 2030 MAC curve, the abatement potential is considerably larger for group 2 compared to group 1.
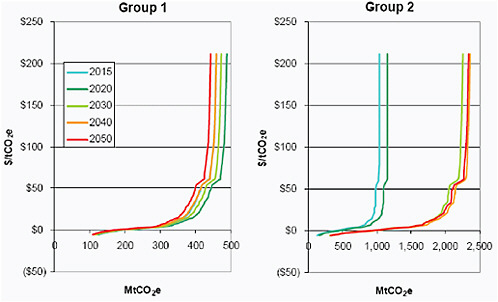
FIGURE C.21 Group 1 and group 2 non-CO2 MACs.
Use of MAC Curves in IGEM
The reference international greenhouse gas emissions projections combined with the assumed climate policies for group 1 and group 2 countries generate the international demand for GHG abatement, but in order to fully represent the demand for international GHG abatement, we need an estimate of U.S. demand for international offsets. This is accomplished by using a reduced-form representation of the Intertemporal General Equilibrium Model (IGEM). IGEM is a dynamic computable general equilibrium (CGE) model of the growth and structure of the U.S. economy and has been used in a variety of efforts related to climate change and climate change policy (e.g., see Jorgenson et al., 2000, 2008, 2009; Goettle and Fawcett, 2009; U.S. EPA, 2009a; U.S. EPA, 2009b; and U.S. EPA, 2010). The reduced-form version of IGEM represents reference GHG emissions covered under H.R. 2454, the H.R. 2454 emissions caps, domestic offset marginal abatement cost curves, domestic covered non-CO2 marginal abatement cost curves, a marginal abatement cost curve representing covered CO2 abatement potential in IGEM, and a marginal abatement cost curve representing end-of-pipe abatement associated with carbon capture and sequestration from advanced coal-fired power plants.
The reduced form version of IGEM, representing the U.S. cap-and-trade system and the U.S. demand for international offsets, is combined with a simple spreadsheet model that includes the assumptions about international GHG abatement demand, as described above, and the international marginal abatement cost curves described above. This system can be solved iteratively to generate a U.S. allowance price, U.S. GHG emissions path, U.S. demand for international offsets, international carbon price (which may systematically differ from the U.S. allowance price if international offsets are subject to a turn-in-ratio as in H.R. 2454), and international supply of GHG abatement. The model assumes a constant growth rate for U.S. allowance prices and international carbon prices to represent the effect of banking. The U.S. allowance prices determined by the model can then be fed into the full version of IGEM in order to determine the full general equilibrium response to the policy.
Note that while this model uniquely determines the total amount of GHG abatement supplied by each source represented by the GHG marginal abatement cost curves, it is not possible to uniquely specify which country is purchasing the abatement. Therefore, the model does not determine the source of international offsets purchased by the United States. Additionally, while the amount of banking occurring globally is uniquely determined, the model does not specify where that banking takes place. For each region (group 1, group 2, and U.S. international offset purchases), the cumulative amount of abatement demanded over the entire time frame is solved for, and for each year the sum of abatement across the three regions is determined. The result is that multiple time paths of international offset purchases are consistent with the cumulative international offset usage determined by the model.
Projected U.S. Usage of International Offset Under H.R. 2454
Analyses of H.R. 2454 have universally shown that the availability of international offsets is one of the most important determinants of the cost of the policy (e.g. CBO, 2009; EIA, 2009; Paltsev et al., 2009; Ross et al., 2009; U.S. EPA, 2009; U.S. EPA, 2010). Some analyses handle offsets by exogenously setting the amount of offsets allowed in the model. For example the MIT analysis of H.R. 2454 using the EPPA model (Paltsev et al., 2009) presents three scenarios: no offsets; full offsets, allowing the full 2 billion tons of offsets each year; and medium offsets, which exogenously sets the path of offset usage to grow from zero in the first year to 2 billion tons by 2050. While this approach appropriately demonstrates the range of possible outcomes given the uncertainties about offset availability, it distorts how the model responds to other sensitivities that affect the cost of covered GHG abatement by not allowing corresponding changes in the offset market. This section of the paper examines the usage of international offsets under H.R. 2454 as analyzed in the EPA supplemental analysis of H.R. 2454 (U.S. EPA, 2010), how international offset usage varies in response to technology availability, and how different assumptions about international offset availability impacts the cost of H.R. 2454.
Non-Binding International Offsets Limits and Sensitivity Scenarios
The overall limits on offset usage in H.R. 2454 are set at two billion tons annually, or 78 billion tons cumulatively from 2012 through 2050, split evenly between domestic and international offsets. Because of the mechanism for sharing the offset limits among covered entities discussed in the “Legislation” section above, and the provisions for allowing extra international offsets when the domestic limits are non-binding, the actual limits are somewhat different. In the core IGEM scenario from EPA’s supplemental analysis of H.R 2454, the limit on domestic offset usage ends up at 34.7 billion tons cumulatively from 2012 through 2050, and the cumulative limit on international offsets is 51.7 billion tons. These limits are non-binding in the core policy scenario.
Figure C.24 depicts reference and policy 2012–2050 cumulative covered U.S. GHG emissions, offset usage, and covered GHG abatement across five scenarios. The first scenario represents H.R. 2454 as modeled in scenario 8 of EPA’s supplemental analysis of H.R. 2454. The next four scenarios vary the 2020 cap level from the 17% reduction specified in H.R. 2454 to either a 20% reduction as specified in the Kerry-Boxer bill (S. 1733), or a lower 14% reduction. These scenarios then either hold offset usage fixed to the level estimated in the first H.R. 2454 scenario, or endogenously determine offset usage.
In Figure C.24, the total height of each bar represents the 246 GtCO2e of cumulative 2012–2050 covered GHG emissions in the IGEM reference scenario. The bottom segment of each bar represents the cumulative number of GHG allowances that must be held by covered entities. This is equal to the cumulative cap, or the cumulative amount of covered GHG emissions after subtracting offset purchases. The next two segments of each
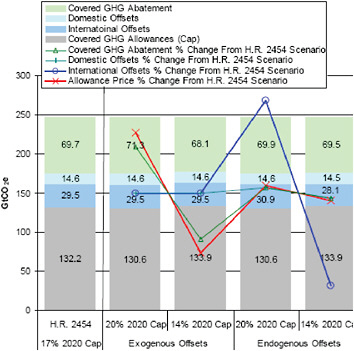
FIGURE C.24 IGEM 2012–2050 cumulative covered U.S. GHG emissions and abatement—cap level and exogenous offset sensitivities.
bar represent international and domestic offset purchases, which are well below the limits placed on offset usage in all scenarios. The sum of the bottom three segments of each bar is the cumulative covered GHG emissions in the policy case. This amount exceeds the cap because of the availability of offsets. The topmost segment of each bar represents the cumulative amount of GHG abatement from covered entities. Each of the lines represents a percentage change from the core H.R. 2454 scenario. The red line represents the percentage change in the allowance price, and the other lines represent percentage changes in the various sources of abatement compared to the core H.R. 2454 scenario.
Figure C.24 demonstrates that the impact that changes to the cap level have on allowance prices is dependent on how offsets are treated. Changing the 2020 cap level from a 17% reduction from 2005 levels to a 20% (or 14%) reduction represents a 1.2% (or −1.2%) change in the cumulative cap. If offset purchases are not allowed to change, then these changes to the cap will raise allowance prices by 3% (or −3%), as required covered sector GHG abatement is raised by 2.3% (or −2.3%). Alternatively, when offset usage is endogenously determined, then the marginal cost of abatement will equalize across covered sectors and domestic and international offsets. The result is that changing the 2020 cap to a 20% reduction (or 14%) results in a 0.4% (or −0.4%) increase in allowance prices, as international offset usage increases by 4.7% (or −4.7%), domestic offset usage increases by 0.3% (or −0.3%), and covered GHG abatement falls by 1.2% (or −1.2%).
The effect of endogenous offsets with non-binding offset limits shown here on cap level sensitivities also applies to any sensitivity that alters the marginal cost of abatement within covered sectors. For example, a technology sensitivity that limits the availability of nuclear and CCS will show a smaller impact on allowance prices if offsets are allowed to endogenously adjust to equalize the new marginal cost of covered sector abatement with the marginal cost of offsets abatement. Similarly, non-cap-and-trade policies such as a renewable portfolio standard or energy efficiency subsidies will change the marginal cost of abatement within covered sectors and show a smaller impact on allowance prices if offset usage is allowed to endogenously adjust.
Impacts of Limiting U.S. Purchases of International Offsets
As discussed in the section above, “Use of MAC Curves in IGEM,” the model solves for the cumulative amount of international offset usage, but the exact time path of international offset usage is not uniquely determined. Previous EPA analyses of H.R. 2454 have generally assumed a relatively constant amount of international offset usage; however a path that gradually ramps up international offset usage over time, resulting in the same cumulative amount, is equally valid so long as the annual limits on international offset usage are not exceeded. Figure C.25 presents the results of several sensitivities that limit the ability of the United States to purchase international offsets. The limitation on international offsets is formulated as a delay in the date at which the United States is allowed to purchase international offsets, after which international offsets are allowed to be purchased up to the limit. The impact on the model is primarily due to the reduction in the cumulative international offsets allowed.
Not allowing international offset purchases for the first 10 years of the policy has a relatively modest impact, because international offset usage can be increased in subsequent years, and cumulative international offset usage only falls by 4%. Domestic offset usage increases by 2% and covered GHG abatement increases by 1% to make up for the decline in international offsets, and allowance prices increase by 4%.
A 20-year delay in international offset availability has a slightly greater impact, decreasing cumulative international offset usage by 12%. This increases domestic offset usage and covered GHG abatement by 4% each, raising allowance prices by 5%.
Delaying international offset availability 30 years to 2042 has much larger effects. Cumulative international offset usage falls 62%, forcing a 25% increase in domestic offsets and a 21% increase in covered GHG abatement. Allowance prices in this scenario increase by 31%.
Completely eliminating international offsets has the largest impact, as domestic offsets increase by 42% and covered GHG abatement increases by 33% to make up for the 29.5 billion tons of lost international offsets. Allowance prices must increase by 54% in order to induce this extra domestic GHG abatement. It is important to note that the impact of eliminating international offset on allowance prices is dependent on how many international offsets are used in the first place. In EPA’s supplemental analysis of H.R. 2454, the Applied Dynamic Analysis of
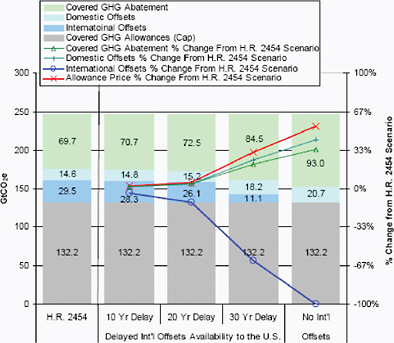
FIGURE C.25 IGEM 2012–2050 cumulative covered U.S. GHG emissions and abatement—international offset availability sensitivities.
the Global Economy (ADAGE) model estimated that eliminating international offsets would increase allowance prices by 148% instead of the 54% estimated by IGEM. This was in part due to the greater usage of international offsets in the core ADAGE H.R. 2454 policy scenario, which meant that covered GHG abatement had to increase by a greater amount in response to the removal of international offsets.
Banking and International Offsets
The previous section discussed how delaying the availability of international offsets affected other sources of GHG abatement and allowance prices. This section examines how international offset availability affects allowance banking. H.R. 2454 allows for unlimited banking of allowances. As a result the allowance prices in both models grow at the exogenously set 5% interest rate. In all modeled scenarios, a bank of allowances is built up in early years, and drawn down in later years so that the cumulative covered emissions (net of offsets) over the 2012–2050 period is equal to cumulative emissions allowed under the cap.
Before exploring how delayed international offset availability impacts banking, it is important to note again that the reduced form IGEM model used in this paper solves for the cumulative amount of international offsets required, but does not distinguish between alternative pathways of international offset usage that add up to that cumulative amount, so long as the annual limits are not exceeded. Figure C.26 depicts the cumulative GHG allowance bank from the primary IGEM scenario in EPA’s supplemental analysis of H.R. 2454, which assumed international offset
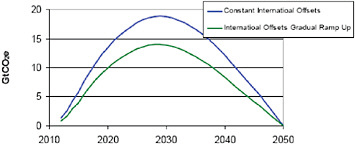
FIGURE C.26 Cumulative GHG allowance bank—constant versus gradually increasing international offsets.
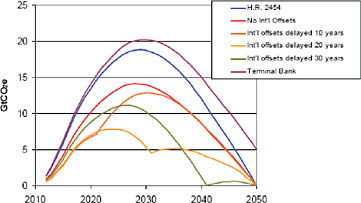
FIGURE C.27 Cumulative GHG allowance bank—international offsets delay and terminal bank.
usage was constant over time at 757 MtCO2e per year; and an alternative scenarios in which international offset usage increases linearly from 265 MtCO2e in 2012 to the limit of 1,273 MtCO2e in 2050. These two scenarios are identical in allowance prices, cumulative international offset usage, and abatement pathways for covered GHG’s and domestic offsets. The only impact of changing the international offsets pathway is to change the amount of allowances that are banked. In the constant international offsets scenario, the extra international offsets available in the early years are submitted for compliance, freeing more allowances to be banked. If instead international offset usage ramped up gradually, then fewer allowances would be banked in the early years, and with a smaller bank to draw down in later years, more international offsets would be used for compliance.
The allowance banks in the scenarios delaying international offset availability are depicted in Figure C.27. All scenarios that limit international offsets reduce the amount of banking in early years. When international offsets are delayed, more allowances must be used for compliance in the early years, and international offset usage can increase in the later years to make up for not having a large bank to draw down. When international offsets are completely eliminated, the increased allowance price induces more abatement in the early years and a larger bank compared to the scenarios where international offset availability is simply delayed.
The last scenario represented in Figure C.27 is one that requires the model to hold a terminal bank of allowances in 2050. The allowance bank in the scenarios discussed to this point all go to zero in 2050. However, H.R. 2454 specifies a constant emissions cap past 2050. The banking behavior predicted by the models is dependent on the complete credibility of the caps. Firms bank allowances beginning in 2012 in anticipation of rising allowance prices that are driven in part by the out-year caps. If firms believe that Congress may revise the caps upward, then the incentive for banking is diminished, as an upwardly revised cap would reduce the value of banked allowances. However, if the post 2050 caps are credible, then a positive bank would still be held in 2050 at the end of the model run, and allowance prices would accordingly be higher than without a terminal bank.
As a proxy for constant post 2050 caps, domestically and internationally, we run a scenario in the reduced-form version of IGEM that requires a positive terminal bank in 2050. In order to determine the size of the terminal bank needed, we extrapolate U.S. and international policy case emissions past 2050, and calculate the cumulative amount by which the post-2050 cap is exceeded before emissions fall to the cap level. We then iteratively solve the reduced-form IGEM model to converge on a new allowance price path and required 2050 bank. This process results in the following terminal banks: in the United States the required 2050 bank is 5.1 GtCO2e. The bank is exhausted and the post-2050 cap is met exactly by 2061; in the international market the required 2050 bank is 5.3 GtCO2e. The bank is exhausted and the post 2050 cap is met exactly in 2055.
Requiring the U.S. and the international market to hold these banks in 2050 increases the allowance price by 2% over the IGEM allowance price estimated for H.R. 2454; and international offsets usage in the United States increases by 13%. After the bank is exhausted, the allowance price would be expected to grow at a rate less than 5% per year as the caps are met exactly in each year and there is no longer any incentive to bank allowances.
The Market for International GHG Abatement
While the previous section focused on U.S. usage of international offsets, and how the availability of international offsets impacts the cost of climate policy in the United States, this section explores the global market for GHG abatement. Specifically, this section examines how the international GHG abatement market is impacted by altering assumptions about reference emissions, policy, and abatement potential.
It is not possible to specify the mix of GHG abatement sources that supply international offsets to the United States; however, it is possible to specify the amount of abatement each source supplies to the global market for GHG abatement. Figure C.28 depicts supply and demand of international GHG abatement in the core policy scenario, as projected using the reduced-form IGEM model, assuming international reference emissions based on the CCSP (see Figure C.18), and assuming that the United States adopts H.R. 2454 and other countries adopt climate policies consistent with the G8 agreement (see Figure C.19).
Each bar in Figure C.28 is divided into segments representing the various sources of abatement characterized by the marginal abatement cost curves described above. The size of each segment represents the amount of abatement supplied by that source at the market-clearing price. The dots in Figure C.28 represent demand for GHG abatement calculated as the difference between reference emissions and the cap level.74 The difference between the height of each bar and the height of the dot representing total world demand for GHG represents allowance banking.
Figure C.29 compares the market for international GHG abatement as depicted in Figure C.28 under the core policy scenario using the CCSP reference international GHG emissions, with a scenario that assumes identical policies, but uses the EMF reference international GHG emissions (see Figure C.18). Cumulative 2012–2050 group 1 GHG emissions are 4% higher, and cumulative group 2 GHG emissions are 28% higher in the EMF reference scenario compared to the CCSP reference scenario. The increase in cumulative global GHG emissions is 19%, and the resulting cumulative global demand for GHG abatement rises by 24%. The United States use of international offsets falls by 69% and the U.S. allowance price increases by 35% due to the greater demand for global GHG
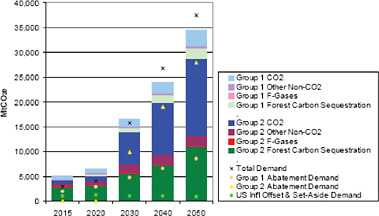
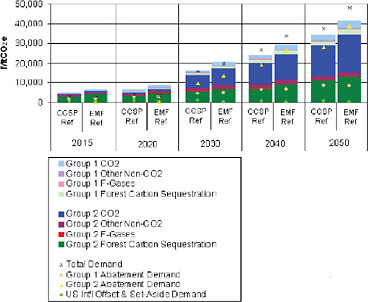
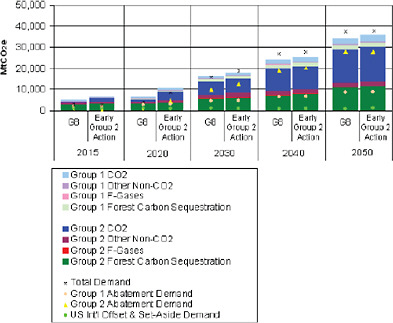
FIGURE C.30. International supply and demand of GHG abatement—the effects of alternative assumptions about international GHG caps—early group 2 action.
abatement (see Figure C.34 below).75 With the higher price of carbon, all GHG abatement sources supply more abatement in this scenario.
As with the sensitivity above, the next sensitivity examines increased international demand for GHG abatement, but instead of varying the reference emissions, this sensitivity varies the assumed policy. Figure C.30 shows the result of assuming that group 2 countries adopt climate policy in 2020, setting cap levels equal to 2015 GHG emissions levels, and linearly reduce emissions to the same 2050 target as in the G8 international assumptions used in the core policy scenario.
The early group 2 adoption of climate policy decreases the cumulative emissions allowed under the group 2 cap by 8%, which increases global demand for GHG abatement by 9%. This increase in the demand for GHG abatement from group 2 countries results in an 8% increase in U.S. allowance prices, and a 16% reduction in cumulative U.S. use of international offsets (see Figure C.34 below). The supply of GHG abatement from all international sources increases slightly in response to the higher carbon prices.
The next sensitivity case again varies the assumed group 2 climate policy, this time assuming that group 2 does not cap GHG emissions before 2050 (see Figure C.31). Without group 2 caps on GHG emissions, the global demand for GHG abatement falls by 56%. This has profound effects on the international carbon market. First, without a market-based climate policy in group 2 countries, their marginal abatement cost curves are subject to a stricter adjustment process, as described in the section “Marginal Abatement Cost Curves—Data Sources and
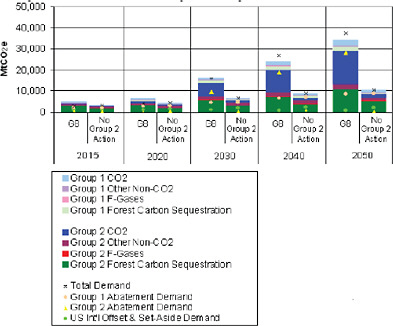
FIGURE C.31 International supply and demand of GHG abatement—the effects of alternative assumptions about international GHG caps—no group 2 action.
Construction” above. This inward shift of the GHG abatement supply curve is overwhelmed by the reduction in demand, and the price of carbon falls globally.
In the United States, the demand for international offsets increases by 73% up to their limit. The substantial increase in international offset usage reduces abatement required from covered GHG emissions by 26%, and results in a 32% fall in U.S. allowance prices (see Figure C.34 below).76
The changes in the assumed climate policies and reference GHG emissions levels in the previous sensitivities all examined changes to the demand for GHG abatement. The final sensitivity scenario in this section looks at a change to the supply of GHG abatement. Figure C.32 depicts the marginal abatement cost (MAC) curves generated by the Global Timber Model (GTM) for group 2 countries with and without reduced emissions from deforestation and degradation (REDD). The largest differences arise in the 2015 and 2020 MAC curves, which do not provide GHG abatement at any price when REDD is not available. In years after group 2 is assumed to have adopted climate policy, options such as afforestation and forest management begin to provide some forest carbon sequestration abatement in the MAC curves without REDD. At high prices in the later years (above $80/tCO2e in 2040, above $65/tCO2e in 2050), GTM indicates that more abatement is available when REDD is not allowed. This is the case because the afforestation that occurs in the early years at high prices in scenarios without REDD
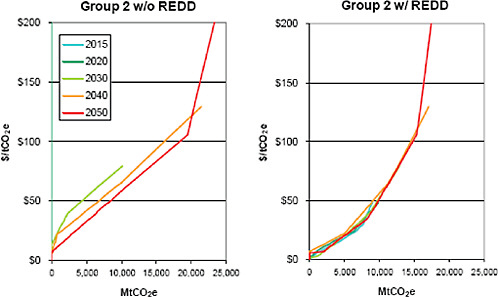
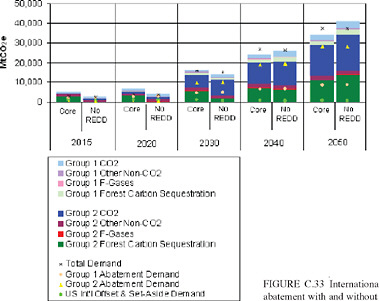
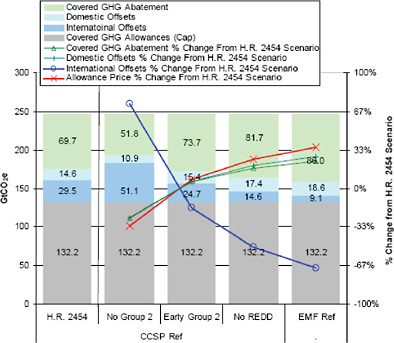
FIGURE C.34 The effects of alternative assumptions about the international GHG market on the United States.
as an option sequesters more carbon in the later years after those trees mature. In the scenario with REDD and all other options available, the net present value of the market and carbon offset returns are greater than the scenario without REDD, even if carbon sequestration is not greater in each year.
Figure C.33 shows the effect that removing REDD from the forest sequestration MAC curves has on the composition of international GHG abatement supply. Compared to the core policy scenario, in 2015 and 2020, total GHG abatement is sharply reduced as forest carbon sequestration from group 2, which had been the largest source of GHG abatement, no longer supplies any GHG abatement. By 2030, some forest carbon sequestration has returned in the scenario without REDD, and by 2040 and 2050, prices have risen to the point that forest carbon sequestration provides a similar amount of abatement in the scenarios with and without REDD. Within the United States, the allowance price increases by 25% in the scenario without REDD abatement, as shown in Figure C.34. In order to equalize the marginal cost of abatement across sources, cumulative international offset usage falls by 51%, domestic offset usage increases by 20%, and domestic covered GHG abatement increase by 17% when REDD abatement is not available.
Conclusion
International offsets are one of the most important cost containment features of both the House-passed American Clean Energy and Security Act of 2009 (H.R. 2454), and the Clean Energy Jobs and American Power Act of 2009 (S. 1733), which was passed out of the Senate Environment and Public Works Committee, as both of these bills potentially allow the use of over one billion tons of international offsets each year. Estimates of the cost and
availability of international offsets are one of the most important factors determining estimates of the cost of these bills. This paper has described how international offset usage was modeled in EPA’s analysis of H.R. 2454, and how assumptions about available sources of greenhouse gas abatement, reference case greenhouse gas emissions, and climate policies in other countries can have major impacts on the cost of the bill. This highlights the importance of future research to update and improve estimates of marginal abatement cost curves for international sources of greenhouse gas abatement; to revisit the difference in greenhouse gas abatement potential from countries with market-based climate policies versus abatement in the form of offsets or sectoral credits from countries without market-based climate policies; to continually update reference greenhouse gas emissions projections; and represent the broad range of climate policies that could be adopted in the future.
References
Calvin KV, JA Edmonds, B Bond-Lamberty, LE Clarke, SH Kim, GP Kyle, SJ Smith, AM Thomson, and MA Wise. 2009. “2.6: Limiting Climate Change to 450 ppm CO2 Equivalent in the 21st Century,” Energy Economics 31(S2): S107-S120.
CBO. 2009. “Congressional Budget Office Cost Estimate: H.R. 2454 American Clean Energy and Security Act of 2009, As ordered reported by the House Committee on Energy and Commerce on May, 21, 2009.” www.cbo.gov/doc.cfm?index=10262.
Clarke, L., J. Edmonds, H. Jacoby, H. Pitcher, J. Reilly, and R. Richels. 2007. CCSP Synthesis and Assessment Product 2.1, Part A: Scenarios of Greenhouse Gas Emissions and Atmospheric Concentrations. U.S. Government Printing Office, Washington DC.
EIA. 2009. “Energy Market and Economic Impacts of H.R. 2454, the American Clean Energy and Security Act of 2009.” www.eia.doe.gov/oiaf/servicerpt/hr2454/index.html.
Goettle, R.J., Fawcett, A.A.2009. “The structural effects of cap and trade climate policy,” Energy Economics, doi:10.1016/j.eneco.2009.06.016.
Jorgenson, D.W., Goettle, R.J., Wilcoxen, P.J., Ho, M.S.2000. “The Role of Substitution in Understanding the Costs of Climate Change Policy.” Pew Center on Global Climate Change, Arlington, VA. September.
Jorgenson, D.W., Goettle, R.J., Wilcoxen, P.J., Ho, M.S.2008. “The Economic Costs of a Market-based Climate Policy.” Pew Center on Global Climate Change, Arlington, VA. June.
Jorgenson, D.W., Goettle, R.J., Wilcoxen, P.J., Ho, M.S.2009. “Cap and trade climate policy and U.S. economic adjustments.” The Journal of Policy Modeling 31 (3), 362-381 (May/June).
Paltsev, S., J.M. Reilly, H.D. Jacoby and J.F. Morris. 2009. “The Cost of Climate Policy in the United States,” MIT Joint Program on the Science and Policy of Global Change, Report 173.
Ross, M.T., A.A. Fawcett, C.S. Clapp. 2009. “U.S. climate mitigation pathways post-2012: Transition scenarios in ADAGE,” Energy Economics, doi:10.1016/j.eneco.2009.06.002.
Sohngen, B. and R. Mendelsohn. 2006. “A SensitivityAnalysis of Carbon Sequestration.” In Human-Induced Climate Change: An Interdisciplinary Assessment. Edited by M. Schlesinger. Cambridge: Cambridge University Press.
U.S. EPA. 2006. Global Mitigation of Non-CO2 Greenhouse Gases, U.S. Environmental Protection Agency, EPA 430-R-06-005, Washington, D.C., June 2006.
U.S. EPA. 2007. “EPA S.280 mitigation cost schedules for capped sectors and domestic and international offsets,”Memo to EIA. March, 2007. Available in “Data Annex to Supplemental H.R. 2454 Analysis” www.epa.gov/climatechange/economics/economicanalyses.html.
U.S. EPA. 2009a. “EPA Preliminary Analysis of the Waxman-Markey Discussion Draft.” April 20, 2009. www.epa.gov/climatechange/economics/economicanalyses.html.
U.S. EPA. 2009b. “EPA Analysis of the American Clean Energy and Security Act of 2009: H.R. 2454 in the 111th Congress.” June 23, 2009.www.epa.gov/climatechange/economics/economicanalyses.html.
U.S. EPA. 2009c. “Economic Impacts of S. 1733: The Clean Energy Jobs and American poser Act of 2009.” October 23, 2009. www.epa.gov/climatechange/economics/economicanalyses.html.
U.S. EPA. 2010. “Supplemental EPA Analysis of the American Clean Energy and Security Act of 2009: H.R. 2454 in the 111th Congress.” January 29, 2010. www.epa.gov/climatechange/economics/economicanalyses.html.


