
UNCERTAINTIES IN TECHNOLOGY EXPERIENCE CURVES FOR ENERGY-ECONOMIC MODELS
Sonia Yeh28and Edward S. Rubin29
Abstract
The use of log-linear experience curves (or learning curves) relating reductions in the unit cost of energy and environmental technologies to their cumulative production or installed capacity has become a common method of representing endogenous technical change in energy-economic models used for policy analysis. Yet, there are significant uncertainties in such formulations whose impact on key model results have been insufficiently examined or considered. This paper characterizes and discusses the major types of uncertainties and their implications. We first review the literature on theoretical and empirical foundations for the log-linear experience curve formulation and its implied causality. We then review the recent literature presenting other models of causality and evidence for other (non-linear) shapes of an experience curve. The latter includes data on historical cost trends in the early deployment of environmental technologies for power plants, which depart substantially from the log-linear model. Ignoring these and other types of uncertainties that are discussed can result in erroneous or misleading model conclusions with policy implications. Suggestions are offered on ways to improve the characterization and reporting of uncertainties and their impact on the results of energy-economic models.
Keywords: Experience curve, learning curve, learning-by-doing, uncertainties, endogenous technological change, energy-economic models.
Introduction
Assumptions concerning the nature and rates of technological change are arguably among the most critical assumptions for assessments of long-term energy and environmental issues such as global climate change. In the past, large-scale modeling efforts commonly treated technological change as an autonomous process in which factors like the efficiency of energy production and utilization improved with the passage of time at a specified rate, independent of other factors [1-4]. More recently, however, many (but not all) long-term integrated assessment models for energy and climate policy analysis have incorporated some mechanism of endogenous technological learning in which the rate of technological improvement and/or cost reduction depends on other parameters in the model. The influences of experience from learning-by-doing, knowledge spillovers from other industries and the level of research and development (R&D) expenditures are among the factors that have been most often modeled [5-8].
Models of learning-by-doing are most often presented in the form of a learning curve or experience curve. Technology experience curves relate changes in specific investment cost (or other cost measure) to the cumulative installed capacity of the technology. While this is regarded as an important step toward more realistically representing the dependency of cost reductions on other variables, experience curves remain an imperfect representation of technical change. It is argued, for example, that the statistical correlation between a reduction in unit cost and the cumulative installed capacity of an energy technology offers little explanation for the underlying process of technological change and the causality between these two variables [6, 8-10].
Aside from the issue of causality, the use of experience curves for forecasting or modeling future cost trends in energy-related technologies is beset by a number of other uncertainties. For example, for the models currently in use, what is the “correct” learning rate for a new energy or environmental technology, or for a currently mature technology at some time in the future? More generally, what is the appropriate functional form of an experience curve for a
|
28 |
Corresponding author, slyeh@ucdavis.edu, Research Scientist, Institute of Transportation Studies, University of California, Davis, CA 95616, USA; tel: 1+(530)754-9000; fax: 1+(530)752-6572. |
|
29 |
Rubin@cmu.edu, The Alumni Professor of Environmental Science and Engineering, Department of Engineering and Public Policy, Carnegie Mellon University, Pittsburgh, PA 15213, USA. |
selected technology? Does the learning rate remain constant over time, or does it change over the modeling period? Do costs always decline, or might they also increase and if so, why or how? Because there are still no definitive answers to such questions, it is important to recognize that these are sources of uncertainty that can significantly influence the results of energy-economic models. In this paper we explore the nature of these uncertainties.
In the second section, we briefly review the origins of technology experience curves used most widely for modeling and forecasting. In the third section we survey alternative functional forms of an experience curve and the theoretical and empirical basis for these formulations and the choice of explanatory variables. In the fourth section, we focus on uncertainties in the shape of experience curves, especially as they apply to environmental technologies in the early stages of commercialization. Finally, in the fifth section we summarize and discuss the implications of these uncertainties for large-scale integrated assessments and energy-economic modeling.
Origins of the Technology Experience Curve
In 1936, the aeronautical engineer Thomas P. Wright published a landmark paper in which he observed that the average direct man-hours required to manufacture a given model of Boeing aircraft dropped systematically with each unit produced [11]. Wright captured this phenomenon with an equation representing what he termed a “progress curve”:
(Equation 1)
where Y is the estimated average direct man-hours per unit for x units; a is the direct man-hours needed to manufacture the first unit; and b (b<0) is a parametric constant. Wright demonstrated that the labor input, Y, dropped by 20 percent for every doubling of cumulative output, x—an 80 percent “progress ratio,” where the exponent b was −0.32.
Wright’s work remained relatively obscure until it was revisited a decade later by a group of economists at the then recently founded RAND Corporation (a “think tank” created by the U.S. Air Force in 1946 to develop a complete “science of warfare” during the Cold War era). The RAND economists became vitally interested in the application of Wright’s work to the production of war materials—a phenomenon they would eventually call “learning-by-doing.” When later applied to an industry or class of product (rather than to a specific manufacturing process), Wright’s “learning curve” equation became referred to as an “experience curve.”
Subsequent work by the Boston Consulting Group [12] applied Wright’s equation to the relationship between the average unit price and cumulative output of 24 selected industrial products. Since then, this formulation (Equation 1) has been adopted in empirical studies to characterize learning phenomena in a wide range of sectors [13-15], including manufacturing [16], ship production [17, 18], consumer products [19], energy supply technologies [20-28], fuel technology [29-34], energy demand technologies [35], and environmental control technologies [36-38].
Equation 1 can be re-written as:
(Equation 2)
Today, this log-linear form of the experience curve remains the most popular equation used to represent the expected cost improvements of a technology. Studies of conventional and renewable energy systems also have employed this equation to calculate technology progress ratios based on cumulative installed capacity [20, 39-41]. Any nonlinearities in the underlying empirical data are most often ignored, however, and only the “best fit” progress ratio (the value of 2−b in Equation 1) or learning rate (the value of one minus the progress ratio) is typically reported. On this basis, Dutton and Thomas [42] surveyed 100 empirical and theoretical studies of progress functions in industrial engineering, economics and management. Reported progress ratios generally fell in the range of 60% to 94% (i.e., learning rates of 6% to 40%). However, studies showing price increases were not included in their analysis. For energy-related technologies, McDonald and Schrattenholzer [43] found a range of learning rates varying from 14% to 34% with a median value of 16%. In all energy-related studies, the cumulative installed capacity of a technology is most commonly used as the independent variable and the reported progress ratio typically applies to a period after the technology is commercialized.
Alternative Models of Causality
When applied to a class of technology like a particular energy or environmental control system, experience curves based on Equation 1 say that cost reductions depend solely on increased deployment of the technology. Clearly, that is an oversimplification. While Wright’s initial formulation of a one-parameter model may have accurately explained observed decreases in the time needed to manufacture a particular airplane, extension of that learning curve model to experience curves for a class of technology is certainly not as simple. At best, the parameter of cumulative installed capacity of a technology serves only as a surrogate for a combination of factors that contribute to cost reductions—including not only learning-by-doing and learning-by-using, but also continued investments in R&D, spillovers from other activities, and a host of other possible factors.
Despite several decades of research, our understanding of the factors that contribute to technological learning and cost reductions is still rather limited. Various theories have been proposed to explain observed reductions in unit cost as cumulative output increases. Generally, they fall into three categories: (1) costs fall due to changes in production that include process innovations, worker familiarity in the use of tooling, improved management and economies of scale; (2) costs fall due to changes in the product itself including product innovations, re-design and standardization; and (3) costs fall due to changes in input prices. While intuitively satisfying, most of these explanations are only qualitatively descriptive and provide little quantification of the direct relationships or contributions of each factor to overall learning or cost reductions.
Some researchers also suggest that the overall learning rates derived from empirical experience curves many overestimate the actual contribution of true learning-by-doing. Others present theoretical arguments that the feedback mechanisms between cost reduction and cumulative production can be explained by other factors including R&D (or learning-by-researching) [6, 44-46], knowledge spillovers [6], increased capital investments [47, 48], and economies-of-scale [25, 49, 50]. Studies suggest that ignoring such variables provides a false sense of precision and overestimates the true contribution of learning [6, 10, 46]. A particular concern voiced by Nordhaus [6] is that models that “miss critical pathways or ascribe influence inappropriately could potentially arrive at erroneous, incomplete, or misleading policy conclusions.”
To take into account additional factors that contribute to learning, alternative models have been developed. Here we review several of these formulations, focusing on their applications to energy and environmental technologies and policies.
Two-Factor Learning Curve Models
Two-factor learning curve models describe a relationship in which cumulative R&D expenditures as well as cumulative production or capacity are assumed to be the main drivers of technology cost reductions [46]. R&D contributes to an expanded knowledge base, which in turn can stimulate further technological innovation, cost reductions and technology diffusion. The relative importance of these two factors may vary, depending on the stage of product development: R&D may play a larger role at early stages of development, while learning-by-doing may dominate as the product or technology matures. The model of Equation 2 is now expanded to include an additional factor:
(Equation 3)
where:
bLBD = learning-by-doing parameter
bLBR = learning-by-researching (R&D) parameter
RD = cumulative R&D investment or knowledge stock
α = specific cost at unit cumulative capacity and unit knowledge stock.
There has been some work to validate this formulation with empirical data [46, 51-53]. Jamasb [46] examined the impact of R&D spending on technology cost reductions using estimates of the combined government and private
R&D expenditures in the United Kingdom. This was coupled with cumulative installed capacity data (representing learning-by-doing) for twelve power generation technologies for the period 1980 to 2001. These included mature technologies (e.g., pulverized coal plants, natural gas combined cycle gas plants, large hydropower), reviving technologies (e.g., new combined cycle plants, combined heat and power, small hydropower), evolving technologies (e.g., nuclear power and wind power) and emerging technologies (e.g., solar thermal power and offshore wind turbines). R&D expenditures were estimated from a broad survey of sources including government R&D databases, R&D expenditure estimates for specialized companies, plus several indirect methods of estimating private R&D investments [54]. The results show that the importance of R&D versus learning-by-doing varied across the different categories of technology, but in general, R&D contributed more to cost reductions than learning-by-doing in all stages of technological development. In addition, the study found very little elasticity of substitution between the two factors; i.e., R&D expenditure and capacity expansion were distinctly different and non-interchangable. Other studies also found significant correlations between time-lagged cost reductions and cumulative R&D expenses and/or R&D-based knowledge stock [46, 51-53].
Two-factor experience curves have been used in models including MERGE [55], ERIS [56], and other simulation-based tools [57]. In general, studies found that incorporating these two factors tended to lower the cost of environmental policies and achieve higher emission abatement levels than with no learning model or with only one of the factors alone [45, 57-60]. It was also found that the incorporation of R&D may lead to less aggressive near-term actions due to the increased level of near-term societal costs [56].
While the concept of a two-factor learning curve is theoretically appealing, others have noted two significant problems with this approach. The first is data availability. Reliable data on public and (especially) private-sector R&D spending is hard to collect and the quality of available data is often an issue [54]. The use of such data to estimate a “knowledge stock” (time lagged and depreciated R&D investment) is approximate at best and sensitive to the assumed rate of knowledge depreciation [56].
The second major shortcoming is the high degree of co-linearity between the two variables. That is, both R&D investments and cumulative production or capacity may respond to the same drivers and/or directly influence one another [53, 56]. An increase in product sales, for example, may stimulate R&D spending to further improve the product. In addition, from a policy point of view there is a distinct difference between government-funded and private-sector R&D. Since these funding sources can have very different impacts on the cost and performance of a specific technology [61], R&D policy conclusions based on a single (combined public/private) R&D indicator can be quite misleading.
Three-Factor or Multi-Factor Learning Curve Models
Several studies have used regression analysis or decomposition techniques to estimate unit cost reductions for a technology. Explanatory variables in addition to cumulative production or capacity have included economies-of-scale [25, 51, 62], input prices for materials [25, 51, 62], labor costs [62], efficiency improvement [25, 62], and other factors. Not surprisingly, these studies typically find smaller learning rate impacts for cumulative installed capacity compared with studies using the one-factor learning curve. Multi-factor models of this type offer improved explanations of the processes that contribute to cost reductions for the technology under study. Thus, they provide greater precision in projecting the effect of a given factor change on the future cost of that technology. A key drawback, however, is that the formulation and results from these models cannot be easily extrapolated or used to make cost projections for other technologies with different characteristics.
Component-Based Learning Curves
Component-based learning curves are essentially an extension of the one-factor model, in which the overall cost of a technology at any given point is the sum of the costs of individual components or sub-systems of the technology. Thus:
(Equation 4)
where:
n = a given technology component
an = specific cost at unit cumulative capacity for cost component n
bn = learning parameter characterizing cost component n.
In this case, the capacity or experience base, x, is usually a projected future value rather than an observed historical value. This method of estimating the future cost of a technology has been applied to cost projections for several types of power plants with carbon capture systems [63], as well as to micro-cogeneration of heat and power [35]. In each case, the overall plant is disaggregated into a number of sub-sections (such as boilers, gasifiers and air pollution control systems for power plants). The cost of each sub-section is then projected based on the historical learning rate for the same or similar technology components. The future cost of each component (after some specified increment of cumulative capacity) is then summed to obtain the future cost of the overall plant. The rationale for this approach is that for complex technologies like a coal-fired power plant, different components are currently at different levels of maturity. Thus, the cost of newer components like a carbon capture system may fall more rapidly than the cost of mature component like boilers or steam turbines. Disaggregation is thus believed to give the best estimate of a learning rate for the overall system.
Uncertainties at the component level give rise to uncertainties in the overall result. Such uncertainties derive from the same set of questions that apply to any application of a one-factor experience curve: When does learning begin (and end)? What is the appropriate learning rate or progress ratio? What is the appropriate measure of capacity or experience? The latter question, in turn, raises the additional issue of “spillover” effects, i.e., the extent to which learning is shared across a range of technologies or applications. For example, experience with carbon capture systems in the oil and gas industries may directly benefit similar applications in the electric utility industry. This concept of “clustered learning” has been used in integrated assessment models such as found in Seebregts et al. [64].
Another type of component-level learning model [65] projects the cost of gas turbine technology based on learning vs. non-learning for different types of costs. Here, some cost components such as raw materials and labor may experience no learning or even become more expensive over time. As in all cases where projections are based on past rates of technological change, there is inherent uncertainty as to whether past experience is indeed the best indicator of future rates of change in complex systems.
Other Models of Technological Learning
Other recent approaches to modeling technological change incorporate time in the experience curve formulation so as explicitly separate the effect of true learning from that of progress that occurs exogenously over time [10, 46, 65, 66]. Such an approach argues that there is a constant rate of exogenous technological change that is independent of learning-by-doing, such as inter alia spillovers from outside the industry, returns to research and development, economies of scale or scope and exogenous fundamental inventions. The incorporation of these factors implies a much smaller rate of true learning for a technology [10]. To date, this model has been tested only at a high level of technological aggregation (economic sectors). As with other multi-variate formulations, empirical data to develop and test such models for specific technologies (or classes of technology) is currently limited or unavailable.
Another more recent development is the integration of technical growth (diffusion) into the experience curve—the so-called endogenous learning-diffusion model [9, 46, 53, 56]. This model accounts for the fact that reductions in unit cost can increase the diffusion and adoption of a technology in the marketplace [46]. In turn, faster adoption of the technology may stimulate higher learning rates and vice versa. This approach provides a greater ability to explain changes in the learning rate over time (or with cumulative production), controlled by the rates of growth and cost reduction. We discuss this further and offer empirical examples of variable learning rates in the following section of this paper.
Uncertainty in the Shape of an Experience Curve
Historically, a number of authors have suggested alternative models for the shape of an experience curve, especially deviations from log-linearity (Equation 2) at the beginning and tail end of the curve. Here we review some of the earlier literature on that topic as well as evidence of deviations from a log-linear model in a number of cases.
The S-Shaped Learning Curve
Long ago, Carr [67] argued that based on empirical observations the cumulative average learning curve for airplane production was best represented by an “S-shaped” curve in which slow initial improvements were followed by a more rapid rate of improvement, followed by an eventual leveling off. Concavity in the initial phase of a learning curve also was recognized independently by the Boeing Airplane Company [68] and the Stanford Research Institute (SRI) [69, 70]. The SRI researchers proposed adding a term, called the “B” factor, to the conventional formula (Equation 1) to represent the equivalent units of experience available at the start of a manufacturing program. The SRI studies claimed that the revised formula, Y = a (x+B)b, described the empirical production data better than the conventional log-linear function. Other recent studies also show significant deviation from linearity at the beginning of a learning curve, where much lower learning rates were observed [29, 30].
Prior studies of environmental technologies at coal-fired power plants [36], also found that experience curves with initial concavity best fit the data for two widely used technologies—flue gas desulfurization (FGD) systems for sulfur dioxide (SO2) control and selective catalytic reduction (SCR) systems for nitrogen oxides (NOx) control (see Figure C.11) [32]. We hypothesize that these low initial learning rates resulted in large part from the rapid deployment of “first generation” technology in response to new environmental regulatory requirements, with little
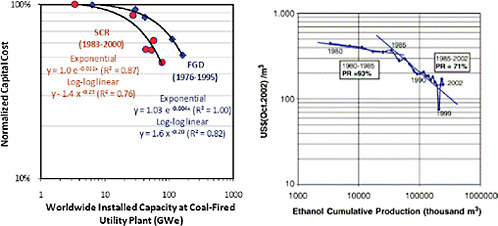
FIGURE C.11 Best-fit experience curves for capital costs of flue gas desulfurization (FGD) and selective catalytic reduction (SCR) systems at standardized U.S. coal-fired power plants (as defined in Figures 2 and 3) (E.S. Rubin, et al., Estimating the Future Trends in the Cost of CO2 Capture Technologies. Report No. 2006/6. 2006, IEA Greenhouse Gas R&D Programme (IEA GHG): Cheltenham, UK). Also shown on the right is the experience curve for Brazilian ethanol production (J. Goldemberg, et al., Ethanol learning curve-the Brazilian experience. Biomass and Bioenergy, 26 (2004) 301-304), which exhibits similar characteristics.
time for learning. This was followed by improvements in succeeding generations of the technology based on factors including continued R&D and experience with existing installations, as documented by Taylor, et al. for FGD systems [71, 72] and by Yeh et al. for SCR systems [32, 38].
Others have challenged the log-linearity assumption for the latter part of an experience curve. Guibert [73] viewed the progress curve as having a horizontal asymptote that was approached after a large number of aircraft units had been produced. A study by Boeing of cost reductions on the L-15 airplane concluded that the unit cost curve became flat (exhibiting “level-off”) at large cumulative output. They believed this was due to limitations imposed by a given set of tooling. They also found that the level-off point seemed to occur sooner for processes exhibiting steeper learning rates prior to level-off and for the manufacture of small aircraft compared to large planes. Similarly, Asher [74] analyzed data for nine models of fighter aircraft and found that the learning curve began to level off after about 125 units; extrapolating from 100 units out to 1000 units would result in an error of about 25%.
An extensive survey by Conway and Schultz [75] studied the existence of learning in four firms manufacturing products with complex as well as simple designs and cumulative production quantities from fifty to two hundred million units. Their survey also found leveling-off, or a decrease in the learning curve slope, when large cumulative production quantities were reached. More recently, Klepper and Graddy [76] assembled data on the number of firms, outputs and prices for 46 new products from their initial introduction through the year 1972. They developed both quantitative and qualitative measures characterizing the evolution of new industries. They found that all products appeared to follow a similar pattern over time, though with considerable quantitative variations. The study found that during both the growth and shakeout stages, the number of firms and total output grew while prices fell. However, once the number of firms stabilized, the rates of price reduction and increase in output leveled off and remained constant over time, typically after 30 to 40 years.
In the case of energy technologies, some have proposed that resource, market and theoretical technical constraints eventually put a floor on technology-specific costs [21, 65]. Many large-scale energy-economic models, which project costs many decades into the future, have imposed long-run price floors for specific energy technologies, below which learning curve projections cannot fall [7, 77]. This, in essence, changes the assumed shape of the long-run experience curve.
Cost Increases During Early Commercialization
For many large-scale technologies such as power plants and their environmental control systems, initial cost estimates for new technologies based on experience from smaller-scale projects or pilot plants are typically lower than the costs subsequently realized for the initial set of full-scale commercial plants. Thus, costs often increase rather than decrease in the early phase of commercial deployment. The reasons for such increases are typically linked to shortfalls in performance and/or reliability resulting from insufficient data for scale-up and detailed design, or from new problems that arise during full-scale construction and operation.
Although this phenomenon has been long recognized and often described qualitatively [78], there are relatively few empirical studies that document such trends for energy and environmental technologies. One recent study, however, reported an experience curve progress ratio above 100 percent for natural gas combined cycle (NGCC) systems for the period 1981-1991 [79]. This was followed by subsequent cost declines. Studies of British and German wind power [41] and photovoltaic technologies [80] also found progress ratios above 100 percent (i.e., cost increases) during early deployment. Though no explanations were provided in the original studies, these cost increases are consistent with the observation that the total cost of new technology often cannot be reduced as quickly as costs are added through design changes and product performance improvements in the early stages of commercialization [22].
Analysis of past experience for power plant FGD and SCR systems also revealed cost increases during early commercialization. We present this data below, along with reported cost estimates for CO2 capture at coal-fired power plants—a technology that has been widely studied but is not yet commercially deployed at power plants.
Cost Trends for FGD Systems
Under provisions of the Clean Air Act, the U.S. federal government funded research and development on SO2 removal processes from power plant flue gases starting in the 1960s, including several conceptual design and cost studies [71]. Early cost evaluations for those technologies involved many assumptions since technical data were limited. Most vendors had yet to fabricate and erect the large gas scrubbing devices required for full-scale systems and very little data were available to properly select materials of construction for the service involved. In many cases, the “technological optimism” of process developers tended to maximize process potential and minimize problem areas such as corrosion, scaling, solids disposal, sulfite oxidation, mist elimination, gas reheat, operational turndown and pH control. Cost estimates in the early 1970s were subject to further uncertainties in scale-up factors based on experimental and prototype installations. Despite some commercial applications on oil-fired power plants in Japan, there was no established basis to accurately assess the full-scale performance and cost of FGD installations on U.S. coal-fired plants. Thus, early FGD costs were considerably lower than later costs due to the optimistic view that system unknowns would be readily controlled and that inexpensive materials of construction could be utilized [81, 82]. As early FGD installations subsequently proved to be unreliable and unable to perform as required, the cost of re-designed systems increased considerably [83, 84]. Thus, in the 1970s, the two issues of greatest concern to the utility industry regarding FGD systems were their reliability and cost [85, 86].
Figure C.12 shows the historical trend of FGD costs for a typical coal-fired plant. The cost of early installations increased by as much as a factor of five as designs were modified to achieve the system reliability and performance needed to comply with regulatory requirements. After a decade of experience and learning, costs finally began to decline in the 1980s.
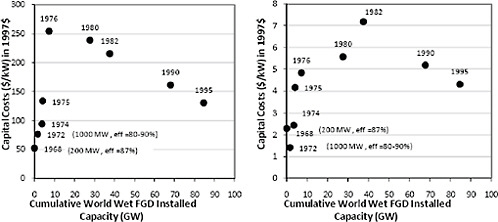
FIGURE C.12 Capital and annualized operating and maintenance (O&M) costs of a wet limestone FGD system for a standardized new coal-fired power plant (500 MW, 3.5% sulfur coal, 90% SO2 removal) as of 1980. Many earlier plants did not achieve the high levels of availability and reliability required for utility operations, leading to more costly designs in later years (E.S. Rubin, et al., Estimating the Future Trends in the Cost of CO2 Capture Technologies. Report No. 2006/6. 2006, IEA Greenhouse Gas R&D Programme (IEA GHG): Cheltenham, UK; M. Taylor, The Influence of Government Actions on Innovative Activities in the Development of Environmental Technologies to Control Sulfur Dioxide Emissions from Stationary Sources, in Department of Engineering and Public Policy. 2001, Carnegie Mellon University: Pittsburgh, PA; E.S. Rubin, et al., The Effect of Government Actions on Environmental Technology Innovation: Applications to the Integrated Assessment of Carbon Sequestration Technologies, Final Report of Award No. DE-FG02-00ER63037 from Carnegie Mellon University, Pittsburgh, PA to Office of Biological and Environmental Research, U.S. Department of Energy, Germantown, MD, 2004).
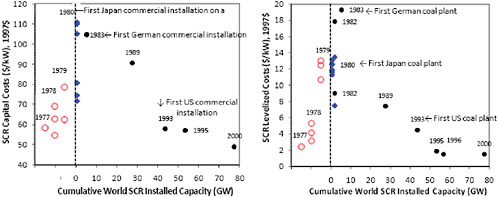
FIGURE C.13 Capital cost and total levelized costs of SCR for a standardized new coal-fired power plant (500 MW, medium sulfur coal, 80% NOx removal), as of 1983. Solid diamond symbols are earlier studies based on low-sulfur coal plants, which have lower SCR capital cost. Empty circles are studies evaluated prior to any commercial SCR installation on a coal-fired utility plant (E.S. Rubin, et al., Estimating the Future Trends in the Cost of CO2 Capture Technologies. Report No. 2006/6. 2006, IEA Greenhouse Gas R&D Programme (IEA GHG): Cheltenham, UK; S. Yeh, et al., Technology innovations and experience curves for NOx control technologies. Journal of the Air and Waste Management Association, 55 (2007) 1827-1838).
Cost Trends for SCR Systems
Early economic evaluations of SCR costs for U.S. coal-fired power plant showed a trend similar to FGD systems, although in this case SCR technology was not actually deployed at U.S. coal plants until nearly two decades later. The earliest cost estimates were based on extrapolations of Japanese experience with SCR on oil and gas-fired plants [88]. Differences in plant operating conditions and fuel characteristics (such as sulfur and heavy metals content) were recognized, but not factored into these early estimates. Subsequent studies projected higher costs, which included contingencies for lack of experience with SCR systems and high-sulfur U.S. coals [89, 90].
Figure C.13 shows the historical trend in SCR cost estimates for a typical U.S. coal-fired plant. Note the initially optimistic assessments prior to the first commercial SCR installations. Cost estimates for U.S. facilities eventually declined after a decade of Japanese and German experience, together with U.S. pilot programs. These facilities demonstrated increasingly lower capital and operating costs, longer catalyst lifetimes and lower catalyst prices than assumed in earlier studies (the results of learning and competition in both non-U.S. and U.S. markets) [38].
Cost Trends for CO2Capture Systems
Environmental technologies that capture and sequester CO2 from power plant flue gases are of growing worldwide interest as a potential climate change mitigation measure [91]. Experience curves for CO2 capture technologies already have been incorporated into some large-scale energy-economic models [92, 93]. Current commercial technology for separating CO2 from flue gas streams utilize an amine-based absorption system of the type used worldwide for other gas purification applications, mainly in the petroleum and chemical industries. Flue gas scrubbing systems employing monoethanolamine (MEA) are thus among the leading technologies proposed to control greenhouse gas emissions at fossil fuel power plants [94]. The earliest studies of CO2 capture costs at coal-fired plants [95, 96] were motivated by the demand for CO2 for enhanced oil recovery (EOR) at a time when world oil prices were at their peak (around 1976-1985). It was not until the 1990s that capturing CO2 at electric power plants (in conjunction with geological storage) gained serious attention as a greenhouse gas abatement option.
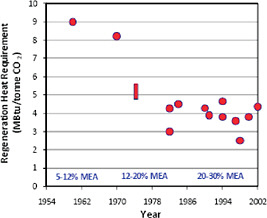
FIGURE C.14 Decreasing trend of regeneration heat requirement with increasing concentration of MEA solvent in CO2 capture systems (E.S. Rubin, et al., The Effect of Government Actions on Environmental Technology Innovation: Applications to the Integrated Assessment of Carbon Sequestration Technologies, Final Report of Award No. DE-FG02-00ER63037 from Carnegie Mellon University, Pittsburgh, PA to Office of Biological and Environmental Research, U.S. Department of Energy, Germantown, MD, 2004). Because of its corrosive nature, MEA is typically mixed with water, which also must be heated to regenerate the solvent, thus adding to the energy penalty. New developments such as “inhibited” amines have permitted higher solvent concentrations in commercial systems.
The main challenge facing post-combustion CO2 capture technology is to reduce both capital and operating costs, especially the energy requirement for regenerating the amine solvent [94]. Toward this end, new amine formulations commercialized over the past several decades allowed the use of increasingly higher solvent concentrations (Figure C.14). This, in turn, significantly reduced the energy penalty associated with this technology. At the same time, requirements for corrosion-resistant materials contributed to higher capital costs during this period (Figure C.15). By the early 2000s, however, improvements in overall system design led to a decline in the estimated capital cost of an MEA capture unit [94, 97-99]. It is anticipated that continued technology advances will lead to further long-term reductions in capital and operating costs [100, 101], although other factors, such as the recent worldwide escalation in raw materials cost, could offset gains from technology innovation.
Interestingly, the capital cost trend in Figure C.15 shows an initial increase followed by a gradual decline, much like the earlier trends for FGD and SCR systems. However, unlike FGD and SCR systems, no CO2 capture systems have yet been built at coal-fired plants at the 500 MW scale (the basis for Figure C.15). While a number of demonstration projects are currently planned, to date only a few commercial projects have captured CO2 from a small portion of the flue gas at coal-fired units, selling it as a commodity used in food processing [94]. Thus, all cost estimates shown in Figure C.15 have yet to be validated by actual CO2 capture projects. The potential for cost increases with scale-up and early commercialization cannot be ruled out based on the experience with other power plant environmental technologies.
Discontinuities and Forgetting
Another uncertainty in the use of experience curves is the potential for organizational “forgetting” in which the knowledge acquired through learning-by-doing may decay or depreciate over time [16, 102, 103]. For example, Argote found that the unit production cost of the Lockheed L-1011 TriStar aircraft fell as production increased from 1972-1975, but increased after a production cut in late 1975, after which costs rose to exceed price. This “forget-
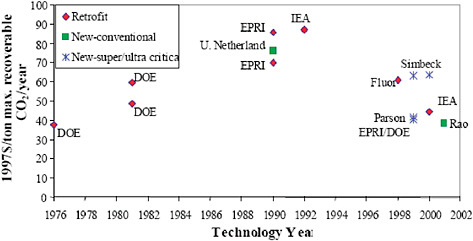
FIGURE C.15 Estimated capital cost of an amine (MEA) carbon capture system at a standardized coal-fired power plant (500 MW, 90% CO2 removal). These costs include the cost of CO2 compression (to about 2000 psia) and drying but do not include the cost of power plant capacity needed to supply the energy required for capture plant operation (E.S. Rubin, et al., The Effect of Government Actions on Environmental Technology Innovation: Applications to the Integrated Assessment of Carbon Sequestration Technologies, Final Report of Award No. DE-FG02-00ER63037 from Carnegie Mellon University, Pittsburgh, PA to Office of Biological and Environmental Research, U.S. Department of Energy, Germantown, MD, 2004).
ting-by-not-doing” was attributed to the loss of knowledge associated with laying off many experienced workers, leading to shortages of personnel and parts and a lack of experienced workers when production later resumed.
Similarly, Sturm [104] analyzed the operating experience of nuclear power plants in Eastern and Western Europe, the former Soviet Union and the United States from 1981 to 1991. He found that while all western countries reduced their unplanned outages, the former Soviet Union and all countries in Eastern Europe experienced increases in unplanned outages and a decrease in plant availability. He suggested this might have resulted from political and economic reorganizations that caused labor turnover, difficulties in maintaining plants or obtaining spare parts and a lack of incentives for adequate training programs—additional illustrations of organizational forgetting.
Social, Economic and Political Factors
The shape of an experience curve also can be affected by societal factors that influence the cost of a technology. For example, changes in work rules, or new environmental, health and safety standards can increase the cost of a technology even though the unit cost of wages, materials and equipment may be static or declining. Thus, Cantor and Hewlett [105] found that despite significant learning-by-doing benefits at the firm or constructor level, new regulations imposed by the Nuclear Regulatory Commission (NRC) contributed to unprecedented increases in construction costs for U.S. nuclear power plant from 1979-1988.
Similarly, Hewlett [106] found that real O&M costs for U.S. nuclear plants escalated at an annual rate of about 11 percent from 1975-1987, primarily because of new safety regulations imposed by the NRC. In a study of U.S. coal-burning power plants, Joskow and Rose [62] found that the real construction cost per unit of plant capacity declined during the early and mid-1960s, stabilized in the late 1960s, then climbed substantially during the 1970s and 1980s. The latter increases appeared to reflect the added costs of responding to new environmental, health
and safety regulations during that period, coupled with increased construction times and a decline in construction productivity.
Finally, societal factors such as public opposition to a technology also can strongly influence rates of technology diffusion and learning, hence, the shape of an experience curve. Perhaps the most well-known example is nuclear power, where public opposition has effectively halted the diffusion of this technology in many countries (e.g., no new plants constructed in the United States since 1978) [107]. Even renewable technologies are not immune to this phenomenon: in a number of countries (including Norway and the United States), the siting of new wind energy systems has been opposed on aesthetic and other grounds. Because the importance and nature of societal influences on technology experience curves can vary considerably across (as well as within) different countries, it is arguably one of the most uncertain sources of uncertainty.
Discussion and Conclusion
It is widely recognized that long-term cost projections for energy and environmental technologies are uncertain and highly sensitive to assumed rates of technological change—whether specified exogenously as a function of time, or endogenously in the form of a learning curve or experience curve. For the commonly used log-linear form of an experience curve (Equation 2), uncertainties in future technology costs are reflected by uncertainties in the learning coefficient, b, and the appropriate value of cumulative production or capacity of a technology (or cluster of technologies), x. Strictly speaking, the latter parameter represents only the influence of learning-by-doing. When used to derive an experience curve, however, it is a surrogate for all factors that influence technology costs.
Efforts to better understand and explain the causes of observed cost reductions have led to a number of more complex formulations of experience curves, as reviewed in the third section of this paper. Notwithstanding these important efforts, future costs based on new model formulations remain highly uncertain [35, 63, 65].
In this paper we also examined (in the fourth section) empirical evidence that calls into question the common assumption of a log-linear shape of an experience curve, particularly during the early commercialization stage of a new technology. This was especially evident in case studies of environmental technologies for power plants, where the market for such technology was driven by the need to comply with new environmental regulations. The literature reviewed also showed that technology learning rates tended to decline at the later stages of technology development and diffusion, in essence putting a floor on the cost of a particular technology. This too contributes to non-linearities in the experience curve. The overall result in many cases is an “S-shaped” experience curve rather than a log-linear form. Further studies applying new models developed in recent years, such as component-based experience curves and endogenous learning-diffusion models, may help explain some of the non-linear features of experience curves discussed in this paper.
The cost increases often observed for newly commercialized technologies and also seen in cases of institutional forgetting, are additional sources of uncertainty that can affect the outcomes of energy-economic models. To date, no large-scale models have yet incorporated such cost increases, though some have incorporated slow-downs or limits in technology diffusion rates to control the growth of emerging technologies. In contrast, a slow initial learning rate for a new technology (characteristic of an S-shaped experience curve) can discourage the early adoptions and investments needed for long-term growth and innovation relative to competing technologies with more “optimistic” cost reduction profiles (such as the prevailing log-linear shape). As a result, some technologies may be “locked-out” of the longer-term picture, affecting the overall cost, technology mix and other outcomes of policy interest, including the role of R&D expenditures [108]. The latter factor is explicitly incorporated in some experience curve formulations (two-factor models) to distinguish the effects of R&D from those of learning-by-doing. In principle, these models can be used to address such questions as the amount and “persistence” of public and private-sector R&D spending needed to achieve a proposed climate goal at minimum cost. These models too, however, are beset with significant uncertainties, as discussed in the third section of this paper.
So what are energy modelers to do in the face of all these uncertainties? In the near term, a broader set of sensitivity studies could be helpful to assess the impacts of different types of uncertainties on key model results. Although computationally more demanding, the use of input distributions of learning rates and other experience curve parameters would better represent our limited understanding of the processes underlying technological
progress. For example, Grubler and Gritsevskii [109] used a simple optimization model with endogenous technological change represented by a traditional log-linear experience curve, but added uncertainty in the learning rate, represented by a lognormal distribution function around the mean value. They showed that when the rate of learning was certain (i.e., perfect foresight), the optimal solution was to invest heavily and early in the “winning” technology. Barreto and Klaassen [59] found similar results. However, when learning rates were uncertain (as in the real world), the optimal solution also became less certain. As a result, there were broader investments in a portfolio of technologies, with slower diffusion and market entry of any particular technology. Messner et al. [110] also incorporated uncertainties in future technology performance and found that it tended to spread risk over a larger number of options to cope with uncertainties in technology development paths.
Over the longer term, continued research into the underlying factors that govern or influence technological innovations may yield improved models that can reliably forecast the implications of proposed energy and environmental policy measures. In the meantime, more concerted efforts are needed to explore, understand and display the consequences of uncertainties in current formulations of technology experience curves (or other models) used to project the future cost of technology in energy-economic modeling and policy analysis.
Acknowledgments
We gratefully acknowledge the contributions of our colleagues Profs. Margaret Taylor (University of California, Berkeley) and David Hounshell (Carnegie Mellon University) to an earlier version of this paper (available at <http://ssrn.com/abstract=1154762>), as well as to several of the references cited below, which were invaluable to the foundations of this paper.
References
[1] S. Kypreos, CO2 emission control in Switzerland using mathematical programming. INFOR, 30 (1992) 194-206.
[2] A. Manne and R. Richels, Buying Greenhouse Insurance: The Economic Costs of CO2 Emission Limits. MIT, Cambridge, MA, 1992.
[3] W.D. Nordhaus, Managing the Global Commons: The Economics of Climate Change. MIT Press, Cambridge, 1994.
[4] R. Prinn, et al., Integrated global system model for climate policy assessment: Feedbacks and sensitivity studies. Climatic Change, 41 (1999) 469-546.
[5] C. Azar and H. Dowlatabadi, A review of technical change in assessment of climate policy. Annual Review of Energy and the Environment, 24 (1999) 513-544.
[6] L. Clarke, J. Weyant and A. Birky, On the sources of technological change: Assessing the evidence. Energy Economics, 28 (2006) 579-595.
[7] B.C.C. van der Zwaan, et al., Endogenous technological change in climate change modeling. Energy Economics, 24 (2002).
[8] K. Gillingham, R. G.Newell and W.A. Pizer, Modeling endogenous technological change for climate policy analysis. Energy Economics, 30 (2008) 2734-2753.
[9] F. Ferioli and B.C.C. van der Zwaan, Learning in Times of Change: A Dynamic Explanation for Technological Progress. Environmental Science and Technology, 43 (2009) 4002-4008.
[10] W. Nordhaus, The Perils of the Learning Model For Modeling Endogenous Technological Change. 2009, National Bureau of Economic Research Working Paper Series.
[11] T.P. Wright, Factors affecting the cost of airplanes. Journal of Aeronautical Sciences, 3 (1936) 122-128.
[12] Boston Consulting Group, Perspectives on Experience. Boston Consulting Group Inc., 1968.
[13] K. Arrow, The Economic Implications of Learning-by-doing. Review of Economic Studies, 29 (1962) 155-173.
[14] L.E. Yelle, The Learning Curve: Historical Review and Comprehensive Survey. Decision Sciences, 10 (1979) 302-328.
[15] J.M. Dutton and A. Thomas, Treating Progress Functions as a Managerial Opportunity. Academy of Management Review, 9 (1984) 235-247.
[16] L. Argote and D. Epple, Learning curves in manufacturing. Science, 247 (1990) 920-924.
[17] R.A. Thornton and P. Thompson, Learning from experience and learning from others. An exploration of learning and spilllovers in wartime shipbuilding. The American Economic Review, 91 (2001) 1350-1368.
[18] R.M. Bell and D. Scott-Kemmis, The mythology of learning-by-doing in World War II airframe and ship production. 1990, Science Policy Research Unit, University of Sussex.
[19] F.M. Bass, The relationship between diffusion rates, experience curves and demand elasticities for consumer durable technological innovations. The Journal of Business, 53 (1980) S51-S67.
[20] IEA/OECD, Experience Curves for Energy Technology Policy. 2000, International Energy Agency: Paris, France.
[21] A. McDonald and L. Schrattenholzer, Learning rates for energy technologies. Energy Policy, 29 (2001) 255-261.
[22] L. Neij, Use of Experience Curves to Analyze the Prospects for Diffusion and Adoption of Renewable Energy Technology. Energy Policy, 23 (1997) 1099-1107.
[23] L. Neij, Cost dynamics of wind power. Energy, 24 (1999) 375-389.
[24] L. Neij, P.D. Andersen and M. Durstewitz, Experience curves for wind power. International Journal of Energy Technology and Policy, 2 (2004) 15-32.
[25] G.F. Nemet, Beyond the learning curve: factors influencing cost reductions in photovoltaics. Energy Policy, 34 (2006) 3218-3232.
[26] B.C.C. van der Zwaan and A. Rabl, Prospects for PV: a learning curve analysis. Solar Energy, 74 (2003) 19-31.
[27] N.L. Rose and P.I. Joskow, The diffusion of new technologies: evidence from the electricity utility industry. RAND Journal of Economics, 21 (1990) 354-373.
[28] S. Yeh and E.S. Rubin, A centurial history of technological change and learning curves for pulverized coal-fired utility boilers. Energy, 32 (2007) 1996-2005.
[29] W.G. Hettinga, et al., Understanding the reductions in U.S. corn ethanol production costs: An experience curve approach. Energy policy, 37 (2009) 190-203.
[30] J. Goldemberg, et al., Ethanol learning curve-the Brazilian experience. Biomass and Bioenergy, 26 (2004) 301-304.
[31] M. Junginger, et al., Technological learning in bioenergy systems. Energy Policy, 34 (2006).
[32] E.S. Rubin, et al., Estimating the Future Trends in the Cost of CO2 Capture Technologies. Report No. 2006/6. 2006, IEA Greenhouse Gas R&D Programme (IEA GHG): Cheltenham, UK.
[33] C.O. Wene, I. Ellersdorfer and U. Fahl, Technology learning and investments needs for upstream oil and the LNG chain, in Proceedings Ansätze zur Modellierung von Innovation in der Energiewirtschaft, Mensch und Buch Verlag, Berlin, 2005.
[34] K. Schoots, et al., Learning Curves for Hydrogen Production Technology: an Assessment of Observed Cost Reductions. Int. J. Hydrogen Energy, 33 (2008) 2630-2645.
[35] M. Weiss, et al., A review of experience curve analyses for energy demand technologies. Technological Forecasting and Social Change, 77 (2010) 411-428.
[36] E.S. Rubin, et al., Experience curves for power plant emission control technologies. International Journal of Energy Technology and Policy, 2 (2004) 52-69.
[37] M. Taylor, E.S. Rubin and D.A. Hounshell, The effect of government actions on technological innovation for SO2 control. Environmental Science and Technology, 37 (2003) 4527-4534.
[38] S. Yeh, et al., Technology innovations and experience curves for NOx control technologies. Journal of the Air and Waste Management Association, 55 (2007) 1827-1838.
[39] P. Ostwald and J. Reisdoft, Measurement of technology progress and capital-cost for nuclear, coal-fired and gas-fired power-plants using the learning curve. Engineering and Process Economics, 4 (1979) 435-453.
[40] U. Claeson Colpier. Using the experience curve to analyze the cost development of the combined cycle gas turbine. in Proceedings of the IEA International Workshop Experience Curves for Policy Making: The Case of Energy Technologies. 1999. Stuttgart, Germany.
[41] K. Ibenholt, Explaining Learning Curves for Wind Power. Energy Policy, 30 (2002) 1181-1189.
[42] J.M. Dutton, A. Thomas and J.E. Butler, The History of Progress Functions as a Managerial Technology. Business History Review, 58 (1984) 204-233.
[43] A. McDonald and L. Schrattenholzer, Learning curves and technology assessment. International Journal of Technology Management, 23 (2002) 718-745.
[44] W.M. Cohen and S. Klepper, Firm size and the nature of innovation within industries: The case of process and product R&D. Review of Economics and Statistics, 78 (1996) 232-243.
[45] C. Watanabe, A. Nagamatsu and C. Griffy-Brown, Behavior of technology in reducing prices of innovative goods—an analysis of the governing factors of variance of PV module prices. Technovation, 23 (2003) 423-436.
[46] T. Jamasb, Technical change theory and learning curves: patterns of progress in electricity generation technologies. The Energy Journal, 28 (2007) 51-72.
[47] W. Cohen, Empirical Studies of Innovative Activity, in Handbook of Economics of Innovation and Technological Change, P. Stoneman, Editor. Blackwell, Cambridge, Mass, 1995.
[48] S. Klepper and K. Simons, The making of an oligopoly: Firm survival and technological change in the evolution of the U.S. tire industry. Journal of Political Economy, 108 (2000) 728-760.
[49] G. Sinclair, S. Klepper and W. Cohen, What’s experience got to do with it? sources of cost reduction in a large specialty chemical producer. Management Science, 46 (2000) 28-45.
[50] S. Yeh and E.S. Rubin, A centurial history of technological change and learning curves for pulverized coal-fired utility boilers. Energy, (2007) forthcoming.
[51] P. Söderholm and T. Sundqvist, Empirical challenges in the use of learning curves for assessing the economic prospects of renewable energy technologies. Renewable Energy, 32 (2007) 2559-2578.
[52] G. Klassen, et al., The Impact of R&D on Innovation for Wind Energy in Denmark, Germany and the United Kingdom. Ecological Economics, 54 (2005) 227-240.
[53] P. Söderholm and G. Klassen, Wind power in Europe: a simultaneous innovation-diffusion model. Environmental and Resource Economics, 36 (2007) 163-190.
[54] P. Capros, et al., System Analysis for Progress and Innovation in Energy Technologies for Integrated Assessment. 2005.
[55] O. Bahn and S. Kypreos, Incorporating different endogenous learning formulations in MERGE. International Journal of Global Energy Issues, 19 (2003) 333-358.
[56] L. Barreto and S. Kypreos, Endogenizing R&D and market experience in the “bottom-up” energy-systems ERIS model. Technovation, 24 (2004) 615-619.
[57] C. Fischer and R. Newell, Environmental and technology policies for climate mitigation. Journal of Environmental Economics and Management International Review, 55 (2008) 142-162.
[58] C. Watanabe, K. Wakabayashi and T. Miyazawa, Industrial dynamism and the creation of a “virtuous cycle” between R&D, market growth and price reduction—The case of photovoltaic power generation (PV) development in Japan. Technovation, 20 (2000) 299-312.
[59] L. Barreto and G. Klaassen, Emissions trading and the role of learning-by-doing spillovers in the “bottom-up” energy-systems ERIS model. International Journal of Energy Technology and Policy, 2 (2004) 70-95.
[60] M. Grubb, C. Carraro and J. Schellnhuber, Endogenous Technological Change and the Economics of Atmospheric Stabilisation. The Energy Journal, (2006) 1-16.
[61] C.O. Wene, Energy technology learning through deployment in competitive markets. The Engineering Economist, 53 (2008) 340-364.
[62] P.I. Joskow and N.L. Rose, The effects of technological change, experience and environmental regulation on the construction cost of coal-burning generating units. RAND Journal of Economics, 16 (1985) 1-27.
[63] E.S. Rubin, et al., Use of experience curves to estimate the future cost of power plants with CO2 capture. International Journal of Greenhouse Gas Control, 1 (2007) 188-197.
[64] A. Seebregts, et al., Endogenous learning and technology clustering: analysis with MARKAL model of the Western European energy system. International Journal of Global Energy Issues, 14 (2000) 289-319.
[65] F. Ferioli, K. Schoots and B.C.C. van der Zwaan, Use and limitations of learning curves for energy technology policy: A component-learning hypothesis. Energy policy, 37 (2009) 2525-2535.
[66] M. Papineau, An economic perspective on experience curves and dynamic economies in renewable energy technologies. Energy policy, 34 (2006) 422-432.
[67] G.W. Carr, Peacetime cost estimating requires new learning curves. Aviation, 45 (1946) 76-77.
[68] Boeing, The Experience Curve and Improvement Curve Study. n.d., Boeing Airplane Company: Wichita, Kansas.
[69] SRI, Relationships for Determining the Optimum Expansibility of the Elements of a Peacetime Aircraft Procurement Program. 1949, Stanford Research Institute, Prepared for Air Materiel Command, USAF: Stanford, California.
[70] SRI, An Improved Rational and Mathematical Explanation of the Progress Curve in Airframe Production. 1949, Stanford Research Institute: Stanford, California.
[71] M. Taylor, The Influence of Government Actions on Innovative Activities in the Development of Environmental Technologies to Control Sulfur Dioxide Emissions from Stationary Sources, in Department of Engineering and Public Policy. 2001, Carnegie Mellon University: Pittsburgh, PA.
[72] M.R. Taylor, E.S. Rubin and D.A. Hounshell, Control of SO2 Emissions from Power Plants: A Case of Induced Technological Innovation in the U.S.Technological Forecasting and Social Change, 72 (2005) 697-718.
[73] P. Guibert, Mathematical Studies of Aircraft Construction. Central Air Documents Office, Wright-Patterson Air Force Base, Dayton, Ohio, 1945.
[74] H. Asher, Cost-Quantity Relationships in the Airframe Industry. The RAND Corporation, Santa Monica, CA, 1956.
[75] R.W. Conway and A. Schultz, Jr., The manufacturing progress function. The Journal of Industrial Engineering, X (1959) 39-54.
[76] S. Klepper and E. Graddy, The Evolution of New Industries and the Determinants of Market Structure. RAND Journal of Economics, 21 (1990) 27-44.
[77] L. Barreto and S. Kypreos, Emission trading and technology development in an energy-systems “bottom-up” model with technology learning. European Journal of Operational Research, 158 (2004) 243-261.
[78] E.W. Merrow, L. McDonnell andR.Y. Argüden, Understanding the Outcomes of Megaprojects : a Quantitative Analysis of Very Large Civilian Projects. 1988, RAND Corp: Santa Monica, CA.
[79] U. Claeson Colpier and D. Cornland, The Economics of the Combined Cycle Gas Turbine—an Experience Curve Analysis. Energy Policy, 30 (2002) 309-316.
[80] G.J. Schaeffer. Experience curves as policy tool - the case of PV. in EXCETP-EXTOOL workshop. 2003. Paris.
[81] A. Skopp, ed. Fluid Bed Studies of the Limestone Based Flue Gas Desulfurization Process. 1969, Esso Research and Engineering Company prepared under contract No. PH 86-67-130 for National Air Pollution Control Administration.
[82] The M. W. Kellogg Company, Evaluation of SO2 - Control Processes. Task #5 Final Report. Submitted to Environmental Protection Agency, Office of Air Programs. Contract No. CPA 70-68. 1971, The M. W. Kellogg: Piscataway, NJ.
[83] Battelle, Stack Gas Treatment. 1973, Batelle Columbus Laboratory: Columbus, OH.
[84] P.W. Spaite, SO2 control: status, cost and outlook, in Power Engineering. 1972. p. 34-37.
[85] U.S. EPA, Flue Gas Desulfurization Installations and Operations. 1974, Office of Enforcement and General Counsel, U.S. Environmental Protection Agency: Washington, D.C.
[86] U.S. EPA, National Public Hearings on Power Plant Compliance with Sulfur Oxide Air Pollution Regulations. 1974, U.S. Environmental Protection Agency: Washington, D.C.
[87] E.S. Rubin, et al., The Effect of Government Actions on Environmental Technology Innovation: Applications to the Integrated Assessment of Carbon Sequestration Technologies, Final Report of Award No. DE-FG02-00ER63037 from Carnegie Mellon University, Pittsburgh, PA to Office of Biological and Environmental Research, U.S. Department of Energy, Germantown, MD, 2004.
[88] J.D. Mobley, ed. Status of EPA’s NOx flue gas treatment program. Proceedings: Second NOx Control Technology Symposium. Denver, Colorado, EPRI, ed. J.E. Cichanowicz. 1978.
[89] J.D. Maxwell, T.A. Burnett and H.L. Faucett, Preliminary Economic Analysis of NOx Flue Gas Treatment Processes. EPA/600/7-80/021. 1980, U.S. Environmental Protection Agency: Washington, D.C.
[90] J.D. Maxwell and L.R. Humphries, Evaluation of the Advanced Low-NOx Burner, Exxon and Hitachi Zosen DeNOx Processes. Report # EPA-600/7-81-120. 1981, U.S. Environmental Protection Agency, Office of Research and Development.
[91] IPCC, IPCC Special Report on Carbon dioxide Capture and Storage, O.D. B. Metz, et.al, Editor. 2005, Intergovernmental Panel on Climate Change: Geneva, Switzerland.
[92] K. Riahi, et al., Technological Learning for Carbon Capture and Sequestration Technologies. Energy Economics, 26 (2004) 539-564.
[93] K. Riahi, et al. Towards Fossil-Based Electricity Systems with Integrated CO2 Capture: Implications of an Illustrative Long-Term Technology Policy. in Proceedings of 7th International Conference on Greenhouse Gas Control Technologies, Volume I: Peer-Reviewed Papers and Overviews, 2005: Elsevier.
[94] A.B. Rao and E.S. Rubin, A Technical, Economic and Environmental Assessment of Amine-Based CO2 Capture Technology for Power Plant Greenhouse Gas Control. Environmental Science and Technology, 36 (2002) 4467-4475.
[95] A.W. Pappano, J.T. Sears and W.R. Parr, Availability and Economics of CO2 for Enhanced Oil Recovery in Appalachia. 1976, Department of Chemical Engineering, West Virginia University: Morgantown, West Virginia.
[96] H.R. Anada, et al., Feasibility and Economics of By-Product CO2 Supply for Enhanced Oil Recovery. Final Report, DOE/MC/08333-3, Vol. 1: Technical Report. 1982, U.S. DOE: Springfield, Virginia.
[97] D. Chapel, J. Ernst and C. Mariz. Recovery of CO2 from Flue Gases: Commercial Trends. in Canadian Society of Chemical Engineers Annual Meeting. 1999. Saskatoon, Saskatchewan, Canada.
[98] M.R. DeLallo, et al. Evaluation of innovative fossil cycles incorporating CO2 removal. in 2000 Gasification Technologies Conference. 2000. San Francisco, California.
[99] D.R. Simbeck and M. McDonald. Existing Coal Power Plant Retrofit CO2 Control Options Analysis. in Fifth Conference on Greenhouse Gas Control Technologies (GHGT-5). 2000. Cairns, Australia.
[100] A.B. Rao, A Technical, Environmental and Economic Assessment of Amine-Based Carbon Capture Technologies for Greenhouse Gas Control, in Department of Engineering and Public Policy. 2003, Carnegie Mellon University: Pittsburgh, PA.
[101] A.B. Rao, et al., Evaluation of potential cost reductions from improved amine-based CO2 capture systems. Energy Policy, 34 (2006) 3765-3772.
[102] L. Argote, Organizational Learning Curves: Persistence, Transfer and Turnover. International Journal of Technology Management. Special Publication on Learning and Unlearning, 11 (1996) 759-69.
[103] L. Argote, Organizational Learning: Creating, Retaining and Transferring Knowledge. Kluwer Academic Publishers, Norwell, Massachusetts, 1999.
[104] R. Sturm, Nuclear-power in eastern Europe—learning or forgetting curves. Energy Economics, 15 (1993) 183-189.
[105] R. Cantor and J. Hewlett, The economics of nuclear-power. Further evidence on learning, economics of scale and regulatory effects. Resources and Energy, 10 (1988) 315-335.
[106] J. Hewlett, Economic and regulatory factors affecting the maintenance of nuclear power plants. Energy Journal, 17 (1996) 1-31.
[107] U.S. NRC, Information Digest 2003 Edition (NUREG-1350, Vol. 15). 2003, U.S. Nuclear Regulatory Commission: Washington, D.C.
[108] J.P. Weyant and T. Olavson, Issues in modeling induced technological change in energy, environmental and climate policy. Environmental Modeling and Assessment, 4 (1999) 67-85.
[109] A. Grubler and A. Gritsevskii. A model of endogenous technological change through uncertain returns on learning (R&D and investments). in Conf. Induc. Technol. Change Environ. 1997. Laxenburg, Austria: International Institute of Applied System Analysis.
[110] S. Messner, A. Golodnikov and A. Gritsevskii, A stochastic version of the dynamic linear programming model MESSAGE III. Energy, 21 (1996) 775-784.


