
3
Uses and Abuses of Learning, Experience, and Knowledge Curves
Marilyn Brown of the workshop planning committee introduced the second session by noting its focus on learning curves or experience curves or knowledge curves, and pointing out that there is disagreement as to what the correct term even is (presenters at this workshop tended to use the term “learning curve”). Learning, experience, and knowledge curves are used for simulating performance improvements and cost reductions for technologies over time. In the absence of observed cost trajectories for a particular technology, modelers often use aggregate surrogates derived from other suites of technologies. The black-box nature of the learning curve results from not understanding the pathways through which technology improvements occur, how long the learning process will continue, and what specific policies might stimulate technological progress. In assessments of the economic impacts of greenhouse gas mitigation, technologies typically are assumed to compete on a cost basis. Thus, it is very important to have good cost-trajectory information. However, often it is not known how much potential a technology might have for reducing costs or how mature a technology already is.
Brown went on to state that the goal of this session wass to distill insights and obtain guidance regarding the proper interpretation and use of learning curves. She observed that it is more useful to be approximately right than definitely wrong by assuming the absence of learning. Thus, the hope for this session was to figure out how to be at least approximately right in representing learning in technological cost curves in energy and climate models.
The first speaker, Nebojsa Nakicenovic from the International Institute for Applied Systems Analysis, discussed moving beyond the black box of learning curves to focus on their use and misuse in assessments of technological change. Nakicenovic stated that the actual mechanisms represented by learning curves are unknown and that there is not a formal theoretical basis for measuring the fundamental processes characterized by such curves. He noted that it is thus not surprising that some of the uses of learning curves are very productive and some lead to more trouble than they resolve. Nakicenovic began with examples of technological progress that are ascribed to learning. Using lighting as an example, he showed how, as the source of lighting moved from kerosene to gaslights and finally to electricity, the cost of providing the service of lighting became a small fraction of what it was a century ago. A second example, shown in Figure 3.1, is the overall reduction in the cost of transporting passengers. And if one focuses on just the stagecoach, it is clear that even technologies not viewed today as having a high degree of technological sophistication can reflect enormous amounts of learning over time. However, Nakicenovic also presented a counter-example to the existence of learning as seen in the declining carbon intensity of the U.S. economy. He argued that the decline in the amount of carbon per dollar of gross domestic product did not demonstrate technological learning because this trend was the result of large structural changes to the economy. So the
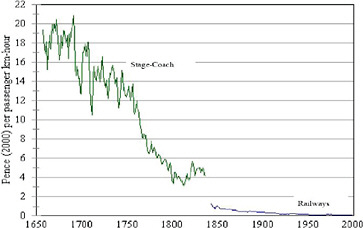
FIGURE 3.1 Price of passenger transportation in cost per passenger kilometer (km)-hour.
issues embodied in learning curves include understanding the specific processes that lurk behind the black box of technological improvement over time and, more precisely, the question of “who learns what?”
At the most general level, technological progress results from cumulative experience, but the magnitude of this progress for an individual technology or service is hugely uncertain, and there is almost nothing deterministic about the learning phenomenon. A wide range of examples shows a fairly consistent set of results indicating that cost reductions of 10 to 30 percent for a technology might be expected from a doubling of cumulative production. However, Nakicenovic reminded the workshop audience that the deterministic appearance of many of the learning curves is deceptive and that we are essentially dealing with a probabilistic phenomenon. One can find many examples of negative learning and cost escalations, including the case of the Lockheed Tristar aircraft, as well as U.S. and French nuclear reactors. In exploring learning for specific technologies, he noted that for solar photovoltaics in Japan, cost reductions were very marginal during the basic research and development phase, and costs declined rapidly only when significant funding went into applied research. Analysis of other renewables technologies shows that increasing the scale of production, the size of the manufacturing facilities, the size of devices, and the size of installations contributes to cost reductions.
In his talk William Nordhaus of Yale University focused on the perils of the learning model for representing endogenous technological change in energy-economic models. He discussed the question of the mechanisms of learning, who learns, and how learning is transmitted from one generation to the next. He stated a belief that learning is driven by cumulative production, and noted the inherent difficulties in disentangling the effects of learning from other sources of productivity growth such as research and development; economies of scale; and technologies that are imported from outside the boundaries of the firm, the industry, or even the country. Nordhaus also discussed a study of the semiconductor industry by Irwin and Klenow (1994) that showed learning was three times more powerful within firms than across firms and that also found insignificant learning effects from one generation of a technology to the next; if a technology grew rapidly in one generation or slowly in one generation, the effect on the next generation of the product was insignificant.
Nordhaus expressed his concern about using learning in models. He noted that learning has become a favorite tool for representing technological change in many models of the energy sector and global warming. He attributes this to its being one of the few “theories” of technological change that can be included easily in models because of its simple specification. Nordhaus concluded that the modeling of learning is a dangerous technique, however,
because the estimated learning rates are inherently biased upward. The bias occurs if the demand function has non-zero price elasticity or if there are other (non-learning) sources of productivity growth such as improvements arising from research and development, economies of scale, or diffusion from abroad or other industries. Because estimated learning rates are biased upward, Nordhaus concluded that these approaches can seriously underestimate the marginal cost of output and can lead to overinvestment in technologies that have learning incorporated into their cost estimates.
Edward Rubin of Carnegie Mellon University focused his presentation on technologies employed solely for the purpose of reducing or eliminating emissions to the environment. These environmental technologies are different because no markets for them would exist without government regulations that require or make it economical to use these technologies to achieve compliance. His focus was on carbon capture and storage (CCS), a technology that could potentially be used to eliminate most of the atmospheric carbon dioxide (CO2) emissions from coal-fired and gas-fired power plants or other large industrial facilities. In the modeling and policy communities, CCS is widely viewed as a critical technology for achieving the kinds of climate policy goals that are being discussed. However, CCS has not been demonstrated at full scale in fossil-fuel electricity plants, where it would be most widely used for climate change mitigation.
Rubin presented results of prior case studies of cost trajectories for post-combustion sulfur dioxide and nitrogen oxide emissions control technologies at coal-powered electricity plants. These and other case studies showed that the cost of installations often increased significantly over the course of the first few projects before eventually declining in accord with traditional learning curves. Figure 3.2 shows the results of a cost projection model for a coal-fired integrated gasification combined cycle power plant with CCS together with learning rate analogues for each major plant component based on experience with similar technologies. Models also were developed for three other types of power plants with CCS. A sensitivity analysis showed that the overall cost reductions after the equivalent of about 20 years varied by factors of 2 to 4. Rubin noted that results over such a wide range are not often expressed in many of the models that use learning curves. He concluded by discussing key factors that are
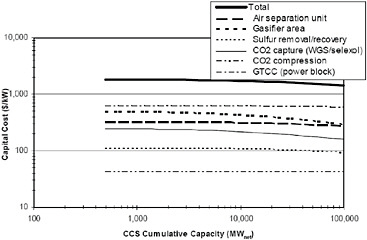
FIGURE 3.2 Estimated cost reductions for a new coal-fired integrated gasification combined cycle (IGCC) power plant with carbon capture and storage (CCS) using best-estimate learning rates for major plant components and then aggregating these to estimate a learning curve for the overall plant. Sensitivity studies yield a range of results.
typically not included in learning curve models and some improved model formulations for representing learning and uncertainty.
The remainder of the session included a panel discussion and questions from the audience. The panel of three discussants was composed of Jae Edmonds of Pacific Northwest National Laboratory (PNNL); Greg Nemet of the University of Wisconsin; and David Greene of Oak Ridge National Laboratory. Edmonds began by observing that the state of technology and assumptions made about the rate of learning are some of the largest determinants of cost in meeting any greenhouse gas emissions goal. Using differing technology assumptions alone allowed a single model, the PNNL Global Change Assessment Model (GCAM), to bracket the range of carbon prices across all 10 integrated assessment models used in a recent Energy Modeling Forum activity that looked at the costs for meeting multiple climate change stabilization goals. Edmonds also noted that the GCAM model does not include endogenous technological change, although the model does tend to show declining technology costs with increasing cumulative production due to other fundamental processes represented within the model. Nemet focused his remarks on two points that the speakers summarized. One was that if learning curves are going to continue to be central to modeling, there needs to be much more explicit characterization of the reliability of the forecasts that result from them. The second point was that there is a need to develop a more fully representative picture of the drivers of technological change. Greene concluded the discussion session by noting that learning curves encompass the “can’t forecast with them, can’t forecast without them” dichotomy. There is no rigorous method for predicting future learning rates, and history can serve as a guide but not a guarantee. However, he concluded by noting that we will have a much higher level of certainty for 10 to 15 years in the future, and 10 to 15 years is the planning horizon for actually executing policy. And so we can look at whether a technology (such as CCS) is developing the way we thought, and adopt policies depending upon whether it is or is not.
The session ended with comments and questions from the audience. Steve Smith of PNNL asked about the panel’s perspective on selection bias when it comes to this learning curve because, when we look at examples and plot learning rates, the technologies that never got beyond zero production are not included. Nakicenovic agreed and stated that he thinks that the fact that technology losers are not included in the analysis is one of the biggest drawbacks to using historical analogies for estimating learning rates. Robert Marlay of DOE made the observation that, based on listening to the speakers, one would get the impression that learning curves have very little predictive power beyond just a very short period into the future. Marlay went on to note that policy makers need to see out further than that, or at least have some insights about the future. He questioned how we can move forward to address some of these issues. Nordhaus responded by noting that he is particularly concerned about the use of learning curves when they are used for policy purposes in situations where the models are basically driving portfolio selection among policies or technologies based heavily on assumptions concerning technology learning. Nordhaus’ solution was to try different assumptions and even different models of learning to see how critical the assumptions are and whether the policy conclusions are robust to the particular assumptions. Nakicenovic was less pessimistic about the use of learning curves in modeling because he felt that quite a lot of progress has been made in their application. However, he thought that because so much of the insight comes on the basis of case studies that have been underway for years, there have to be more generic foundations for these models.


