
2
Dropout Rates, Graduation Rates, and Public Policy
There is widespread agreement that failure to earn a high school diploma is a serious problem in this country. A considerable body of research has documented the individual and societal costs associated with dropping out and demonstrates the many hardships that dropouts face. Most people agree that the nation’s dropout rate is too high and the graduation rate is unacceptably low. However, determining the full extent of the problem has been difficult due to disagreements about how to calculate the rates: it is difficult to remediate a problem when its exact nature is still in dispute. Numerous policy measures have been targeted at improving the educational attainment of young people in this country, but it is hard to evaluate their effectiveness without accurate, consistent estimates of graduation and dropout rates.
In this chapter, we explore a series of issues intended to provide context for the report. The chapter is separated into three sections. It begins with a brief summary of the literature on the social and economic outcomes experienced by individuals who fail to earn a high school diploma in order to document why it is important to have accurate and consistent estimates of the rates that provide a clear sense of the problem. In the second section, we discuss some of the discrepancies in the rates that have been reported, beginning with a description of the data sources used to produce the rates and the differences among them that contribute to these discrepancies. The chapter concludes with a discussion of the policy attention the rates have received, with a focus on their use in the accountability system established by the No Child Left Behind (NCLB) Act of 2001. We close the chapter with our recommendation for the ways that dropout and completion rates should be incorporated into accountability policy.
At the Workshop on Improved Measurement of High School Dropout and Completion Rates: Expert Guidance on Next Steps for Research and Policy, a series of presentations discussed why it is important to report dropout and graduation rates and how they are used for public policy. These presentations serve as the basis for the information in this chapter, particularly papers by Dan Losen, with the Civil Rights Project (Losen, 2008), and Richard Rothstein, with the Economic Policy Institute (Rothstein, 2008). We supplemented these presentations with our own review of the relevant literature, as further explained in each section of this chapter.
SOCIAL AND ECONOMIC OUTCOMES ASSOCIATED WITH EDUCATIONAL ATTAINMENT
There is a wide body of research on the social and economic outcomes associated with educational attainment. A review of these studies reveals that individuals who fail to earn a high school diploma are clearly disadvantaged in many aspects of life—from the jobs they obtain and the wages they earn to their sense of physical and emotional well-being. Society is also disadvantaged when students drop out, since studies show that dropouts are less likely than graduates to contribute to the social and economic well-being of the country.
For the most part, this literature consists of studies that are descriptive in nature, documenting the differences in outcomes for individuals with and without a high school diploma. It is important to note that most of them do not support inferences about the factors that cause individuals who dropout to experience economic and social hardships. Attributing cause in this line of research is difficult for several reasons. One complexity is that the factors that cause students to drop out are also factors that cause people to not do well in other aspects of life. That is, students who drop out often have low achievement and low motivation, factors that contribute to poor performance in school and poor functioning in society (Rumberger, forthcoming). These and other personal attributes may be the underlying cause of the poor social and economic outcomes experienced by this group; dropping out may be a symptom of the problem rather than the cause.
Another complexity stems from the fact that it is difficult to design the kinds of studies that allow one to attribute cause, such as by conducting experiments that make use of random assignment. Clearly, individuals cannot be randomly assigned to be dropouts or graduates. Studies that employ advanced techniques, such as model fitting or regression discontinuity analyses, also can support causal inference; however, only a few studies have used these techniques.1
Nevertheless, a number of negative outcomes associated with dropping out are consistently reported in this body of research. The fact that these findings are corroborated by multiple independent studies permits a certain degree of confidence in the conclusions that can be drawn, even though they are based primarily on descriptive rather than experimental studies.2 Below we discuss these findings, specifically comparing social and economic outcomes for graduates, dropouts, and individuals who receive a General Educational Development (GED) credential. This review is not intended to be an exhaustive examination of the literature but simply an overview designed to give the reader a general sense of the differences in outcomes for individuals with and without high school diplomas.
OUTCOMES FOR GRADUATES AND DROPOUTS
Earning a high school diploma is one of the most important factors associated with social and economic success in America. A high school diploma signifies that the bearer has both the cognitive and noncognitive attributes important for success in adulthood. It is usually a minimum requirement for engaging in further training and serves as the gatekeeper for higher education and higher paying jobs. Research shows that high school graduates fare better than dropouts in many aspects of life (Belfield and Levin, 2007). Dropouts are more likely to become teenage parents and have nonmarital births (Manlove, 1998; McLanahan, 2009). They are less likely to vote or engage in civic activities (Bartels, 2008; Uslaner and Brown, 2005). They have poorer prospects for intergenerational mobility (McLanahan, 2009).
Graduates and dropouts differ markedly in their labor market outcomes, although, as noted above, it cannot always be inferred that these differences are caused by the education credential. Graduates are more likely to be employed than dropouts, and their wages are higher. Government data show that 58.9 percent of students who dropped out of school in the 2006-07 school year were not working (unemployed or not in the labor force) the following October (http://nces.ed.gov/programs/digest/d08/tables/dt08_389.asp). Among all 16-to 24-year-olds in October 2007, the unemployment rate for dropouts was 17.3
percent, compared with 11.6 percent for high school graduates and 5.5 percent for 4-year college graduates (http://nces.ed.gov/programs/digest/d08/tables/dt08_382.asp). Even if they find a job, dropouts earn substantially less than high school graduates. In 2007, the median annual earnings of high school dropouts were 29 percent less for men and 33 percent less for women, compared with the earnings of high school graduates (http://nces.ed.gov/programs/digest/d08/tables/dt08_384.asp). The U.S. Census Bureau estimates that over their working lives, dropouts will earn about $200,000 less than high school graduates (Day and Newburger, 2002, Figure 3).
High school graduates also tend to live a longer and healthier life than dropouts. Research shows that, on average, a high school graduate lives 6 to 9 years longer than a dropout (Wong et al., 2002) and that there appears to be a positive relationship between educational attainment and health status (Currie, 2009; Cutler and Lleras-Muney, 2006; Pleis and Lucas, 2009; Ross and Wu, 1995). A number of factors may contribute to this. For one, individuals with low educational attainment may have difficulty understanding doctor’s instructions and health-related literature, and consequently may be more likely to make poor health decisions. In addition, smoking is more prevalent among individuals with lower income and education levels. According to a survey conducted by the National Institutes of Health (NIH) in 2007, 28.1 percent of adults who are poor and 25.4 percent of adults who are near poor are smokers, compared with 17.7 percent of individuals who are not poor (Pleis and Lucas, 2009, Table 25). The researchers also found that adults with at least a bachelor’s degree were less likely to be current or former smokers than those with less education.
Dropouts are also less likely than high school graduates to report that they exercise regularly, and they are more likely to be obese. In a recent survey, Pleis and Lucas (2009, p. 12) found that 84 percent of adults with less than a high school diploma reported that they “never engage in periods of vigorous leisure-time physical activity as compared with 46 percent of adults with a bachelor’s degree or higher.” Roughly 29 percent of high school dropouts are considered to be obese, compared with 20 percent of college graduates (Centers for Disease Control and Prevention, 2008). Cardiovascular disease, respiratory disease, and diabetes are all higher among less educated people (Muennig, 2005; Pleis and Lucas, 2009).
There is also evidence of a relationship between emotional well-being and educational attainment. Pleis and Lucas (2009) report that feelings of sadness, hopelessness, and worthlessness are most prevalent among adults with less education than a high school diploma.
Studies also show that educational attainment appears to be related to participation in criminal behavior, in that those with higher levels of education are less likely to commit crimes, get arrested, or become incarcerated (Farrington, 2003; Levin et al., 2007). The relationship between dropout status
and incarceration appears to be quite strong: although dropouts constitute less than 20 percent of the overall population, they make up 41 percent of the incarcerated population (Harlow, 2003, reporting data for 1997). In contrast, although those with a high school diploma make up roughly 33 percent of the population, they make up only 23 percent of the incarcerated population. There is also a striking relationship between race, education, and incarceration. For example, Western and Wildeman (2009) found that the risk of imprisonment was three to four times higher for white and black male dropouts compared with high school graduates, with the risk of imprisonment for black dropouts at 69 percent. In addition, dropouts are about three and a half times more likely than high school graduates to be arrested (Coalition for Juvenile Justice, 2001). These data underscore the point that although many dropouts do not participate in criminal behaviors, individuals who are arrested or are incarcerated are more likely to be dropouts than to have earned a diploma.
OUTCOMES FOR GENERAL EDUCATIONAL DEVELOPMENT RECIPIENTS
Students who leave school but earn a GED credential generally do not do as well as those who earn a high school diploma. Some studies find that dropouts who earn a GED credential generally have a higher income than dropouts who do not (Murnane, Willett, and Tyler, 2002; Tyler, 2003; Tyler, Murnane, and Willegg, 2003), and there may be more of a payoff for dropouts who left school with weak skills than those who left with higher skills (Murnane et al., 2002; Tyler, 2003). GED recipients do not realize the social and economic benefits that come with a high school diploma, however (Cameron and Heckman, 1993; Heckman and LaFontaine, 2008; Heckman, Humphries, and Mader, 2010). GED recipients make less money than high school graduates (Heckman and Rubenstein, 2001).
The reasons for these differences between graduates and GED recipients are not fully understood (Rothstein, 2008), although some speculate that there are a number of nonacademic attributes—such as motivation, time management, persistence, interpersonal skills, having an orientation toward long-term planning—that contribute to an individual’s ability to stay in high school and earn a diploma. These attributes are likely to be related to subsequent performance in college and on the job (Heckman, Humphries, and Mader, 2010; Heckman and Rubinstein, 2001). For instance, Laurence (2008) reports that GED recipients and dropouts have similar attrition rates from the military. Also, Heckman and LaFontaine (2008, forthcoming) report that degree attainment rates are similar for GED recipients and dropouts who pursue postsecondary schooling.
DETERMINING THE EXTENT OF THE DROPOUT PROBLEM
Identification of the extent of the dropout problem is the first step in addressing it and working toward remedies to keep students in school. Any attempt at remediation requires accurate, consistent estimates of these rates. However, the data and methods for calculating the rates differ, and there are considerable differences of opinion about the appropriate procedures (e.g., Greene and Winters, 2002; Heckman and LaFontaine, 2008, 2010; Mishel and Roy, 2006). The resulting rates can differ dramatically and portray different pictures of educational attainment in this country. Below we briefly describe several key data sources, highlight some of the challenges associated with calculating the rates, and discuss the discrepancies in rates that have been reported. Chapters 3 and 4 discuss these issues in more depth.
Data Sources
One source for dropout and graduation rates is nationally collected data. For more than 50 years, information about educational attainment has been available through the Current Population Survey (CPS), conducted by the U.S. Census Bureau. The CPS is a monthly household survey established to provide a direct measurement of monthly unemployment. The CPS includes a series of questions on school enrollment, college attendance, and high school graduation that can be used to calculate an overall dropout rate for the country. One commonly used dropout rate based on these data is the percentage of 16- to 24-year-olds who are not enrolled in school and who have not earned high school credentials. These data cannot be reliably disaggregated below the regional level on an annual basis, however, and there is no way to connect the rates to the schools that the respondents attended. For many years, the CPS was the primary source for calculating dropout rates.
Since the late 1960s, data have also been collected through the State Nonfiscal Survey from the Common Core of Data (CCD), administered by the U.S. Department of Education’s National Center for Education Statistics (NCES). The CCD collects data from all public elementary and secondary schools and school districts in the country. The CCD was designed to “provide basic information and descriptive statistics on public elementary and secondary schools and schooling” (Thurgood et al., 2003, p. 19). CCD data are obtained primarily from administrative records in state education agencies. The information collected by the CCD allows estimation of high school completion and dropout rates and can be calculated at the state and local levels. Because they are based on aggregate data, rather than individual student records, however, the rates can become distorted, because student mobility and grade retention cannot be taken into consideration in calculating the rates.
States also publish their own rates based on data they collect themselves, using a variety of different measures and procedures, some of which have the
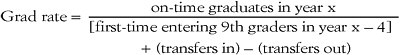
potential to produce upward or downward biases in the rates. Until recently, there were few efforts to understand the differences in these measures or to bring uniformity to the procedures. For instance, in the past, some states reported a graduation rate based on dividing the aggregate number of graduates at the end of the year by the aggregate number of students who started the year in the senior class. This approach misses the majority of dropouts who leave school before grade 12 and can result in an overestimate of the graduation rate. Others have divided the aggregate number of graduates by the aggregate number of students enrolled in grade 9 four years earlier, an approach that may inflate the size of the cohort because of students repeating grade 9. Thus, this approach can produce an underestimate of the graduation rate.
Some states have longitudinal unit-record data systems, are able to track individual students as they move from school to school, and know whether they drop out or continue on to earn a diploma. Yet decisions about how to treat special categories of students can affect the rates. Classifying students who earn a GED credential or special education students who earn a certificate of attendance as graduates exaggerates the success of states in ensuring that students have successfully completed high school coursework and produces overestimates of graduation rates. Removing students from the cohort when they fail the state exit exam or are expelled can also inflate graduation rates. States also have different approaches for dealing with the time it takes a student to complete high school. Some calculate a 4-year rate, and some make no distinction between students who graduate in four years and students who take longer. Some of these problems may result because of inadequate record-keeping systems; others are the result of deliberate efforts to keep official dropout rates low and graduation rates high.
Discrepancies in the Reported Rates
For years, the most frequently reported rate was the CPS national dropout rate. This rate portrayed a rather positive picture about educational attainment in this country, suggesting that the incidence of dropping out was steadily diminishing, from about 15 percent in 1965 to less than 9 percent in 2000 (Cataldi, Laird, and KewalRamani, 2009:Table 7). Based on these reported rates, one might expect a high school completion rate of about 90 percent. However, as data and methods were developed to calculate national, state, and regional completion rates from the CCD, a contrasting picture became apparent. National completion rates based on the CCD appeared to be much lower than the expected 90 percent, showing that high school graduation rates were stable or declining—not increasing—from about 78 percent in 1975 to about 72 percent in 2002 (cited in Warren and Halpern-Manners, 2007).
The discrepancies between the CPS-based and CCD-based rates, as well as the negative findings from the CCD-based estimates, have triggered
considerable public attention to measuring the true extent of noncompletion of high school in this country (see, e.g., the cover story in Time, April 17, 2006, by Thornburgh). One report that garnered significant public attention was published by Greene (2001, revised in 2002) using CCD data, which found a national graduation rate of only 71 percent for the class of 1998 and much lower rates for minority youths at 56 percent for African American students and 54 percent for Latino students. These estimates were disputed by Mishel and Roy (2006), who, using CPS data, reported a higher overall graduation rate of 82 percent and graduation rates for African Americans and Hispanics of approximately 74 percent.
Greene also reported graduation rates for each state, revealing alarmingly low rates for some states. According to his analyses, Georgia had the lowest overall graduation rate (54 percent), with rates for minorities at 44 percent for African Americans and 32 percent for Latinos. The District of Columbia, Florida, and Nevada followed closely behind with graduation rates below 60 percent. Some of Greene’s rates differed markedly from those reported by the state itself. These discrepancies were highlighted in an analysis by the Education Trust (2003), which compared Greene’s estimates to states’ self-reported rates. In nearly half of the states (n = 24), the self-reported rate was 10 percentage points or more above Greene’s estimate. The largest discrepancy was for North Carolina, with a difference of 29 percentage points between the state self-reported rate (92 percent) and Greene’s estimate (63 percent).
These low rates and the discrepancies among the estimates have prompted a number of researchers to investigate the sources of the differences (e.g., Heckman and LaFontaine, 2010; Miao and Haney, 2004; Swanson, 2004; Swanson and Chaplin, 2003; Warren and Halpern-Manners, 2007). Differences in the CPS-based and CCD-based rates appear to be attributable to data collection methods (the CPS is a self-reported, sample-based survey; the CCD is a census of school administrative data); how GED recipients are treated (i.e., considered as graduates or not); whether the rate is for dropouts, completers, or graduates; whether rates include public and private school students; and the type of rate calculated (e.g., status, event, cohort). States’ rules for classifying students as graduates, completers, and dropouts appear to account for discrepancies in state self-reported rates. These differences are further discussed in Chapters 3 and 4.
GRADUATION RATES AND NCLB
Reports by Greene and others of such low graduation rates have brought renewed attention to the issue, both in the form of advocacy by groups who have worked to increase awareness of the problem and in the form of policy measures intended to help correct the problem. Groups, such as the Alliance for Excellent Education, the Education Trust, Education Week’s Editorial
Projects in Education, and the Gates Foundation, have sponsored conferences, research, and programs and have published a multitude of articles intended to bring the problem to the forefront and encourage action. Losen (2008) described one early effort, jointly led by the Civil Rights Project, a think tank based at Harvard University, and Achieve, a nonprofit organization located in Washington, DC. The groups convened a conference in 2001 that Losen believes led to some provocative insights (Losen, 2008, p. 1):
One of the more profound understandings to come from the conference was how little we knew about who was graduating from high school and who was dropping out. The research also revealed that the prevalent methods for estimating dropout and school completion rates were not very accurate, and likely underestimated the outcomes for minority dropout levels. A third revelation was that hundreds of schools, concentrated in the 35 largest cities in the U.S., graduated less than 50 percent of their freshman class.
Losen noted that, as a result of the increased attention to the dropout problem, findings from such efforts as the conference sponsored by the Civil Rights Project and Achieve, and intense lobbying by a number of groups, lawmakers addressed graduation rates in NCLB. At the time, efforts to hold schools and states accountable for student performance chiefly targeted improvements in achievement test scores. Some states and school districts had routinely provided estimates of their graduation and dropout rates, and the Goals 2000 Educate America Act called for increasing the graduation rate to 90 percent by 2000, but there were no previous mandates for reporting these rates or any common standards for such reports.
Initial NCLB Regulations
NCLB placed new emphasis on graduation rates, requiring that states report these rates as part of the adequate yearly progress (AYP) accountability measures. When the law passed, only 8 states collected data on graduation rates, and only 13 used those rates for accountability purposes (Swanson, 2004). This requirement was new to the states, and few had the data systems to support such calculations.
NCLB’s guidance about graduation rates has changed over time and has not been entirely in line with the test-based accountability provisions in the law. According to Losen, the language signed into law defines graduation rates as “the percentage of students who graduate from secondary schools with a regular diploma in the standard number of years” (Losen, 2008). In guidance issued in May 2002, the U.S. Department of Education highlighted graduation as a performance goal for states, districts, and schools and called for the rates to be disaggregated by race, ethnicity, gender, disability status, migrant status, English proficiency status, and status as economically disadvantaged. However,
when Secretary of Education Ronald Paige issued the final regulations, he said that graduation rates did not have to be disaggregated by minority subgroups for accountability purposes, except for the “safe harbor” provision.3
The dropout problem is considered by many to be a civil rights issue (Gutiérrez, 2008; Orfield, 2004), and reporting disaggregated rates is critical to revealing weak areas in the education system. As Maryland state legislator, Ana Sol Gutiérrez, put it at the workshop:
Every year, across the country, … disproportionately high percentages of poor and minority students disappear from the educational pipeline before graduating from high school…. Because of misleading and inaccurate reporting of graduation rates, the public remains largely unaware of this educational and civil rights crisis.
Many advocacy groups found the regulatory guidance to be inadequate (Losen, 2008). They were particularly concerned that states and districts were not required to report graduation rates disaggregated for key groups of students and were not held accountable for their improvement.
Others were concerned because states were not required to set annual progress goals on graduation rates for their students, even for the aggregate of all students (Losen, 2008). The legislation had added graduation rates to the test-based measures of AYP required of each school and district, but the administration’s regulations required yearly progress only for test scores. Accordingly, schools, districts, and states need only set a fixed goal for graduation rates, and it was up to the state to decide on the goal. Unlike the goals set for achievement test results, which require that 100 percent of students ultimately reach the proficient level, states could set much lower goals, even as low as 50 percent (Losen, 2008). Thus, while NCLB contained language intended to bring the dropout problem into the forefront, the regulatory guidance assigned it less priority than test-based progress indicators. Because the graduation rate provisions were so loosely defined, there were many concerns that the test-based mandates would lead schools to “push” low-performing students out of school in an effort to increase test scores.
A survey of the states conducted by the Civil Rights Project in fall 2003 revealed that no meaningful graduation rate accountability was in place. Only 10 states set a true floor for adequacy in graduation rates, whereby schools and districts that do not meet the state goals for 2 consecutive years are designated as having failed to make AYP. In 39 other states, falling short of the goal could be remedied by any improvement the following year (Losen, 2008). Other
reports further documented differences between the rates states reported to comply with NCLB and those estimated by Greene and others (e.g., Education Trust, 2003; Miao and Haney, 2004). These discrepancies spurred efforts to bring more uniformity to procedures for calculating the rates.
National Governors Association Compact
In 2005, the National Governors Association (NGA) formed the Task Force on State High School Graduation Data, charged with developing more accurate and consistent reporting of graduation rates. The NGA Compact, ultimately signed by all 50 governors, issued a set of five recommendations to help promote consistency in determining state graduation rates. Specifically (National Governors Association Task Force on State High School Graduation Data, 2005, pp. 7-8):
-
Immediately adopt, and begin taking steps to implement a standard 4-year adjusted cohort graduation rate (called the NGA graduation rate), as noted in equation 2.1:
(Eq. 2.1)
-
Build the state’s data system and capacity.
-
Adopt additional, complementary indicators to provide richer context and understanding about outcomes for students and how well the system is serving them.
-
Develop public understanding about the need for good graduation and dropout rate data.
-
Collaborate with local education leaders, higher education leaders, business leaders, and leaders of local community organizations.
These guidelines stimulated even greater awareness of the problem and paved the way for legislative change.
Initially, changes were evident at the state level. For instance, Gutiérrez described her efforts to have the NGA guidelines adopted by the state of Maryland. African American and Hispanic legislators in her state combined efforts to raise awareness about the problem. She highlighted for her colleagues the high cost to society of having such low graduation rates among poor and minority children, as well as the impact of having no standardized procedures for determining the extent of the problem. Her state enacted HB71 (2006), which requires the state education system to adopt and implement the NGA formula and to move toward establishing the needed tracking information systems.
Revised NCLB Regulations
In late October 2008, education secretary Margaret Spellings issued new NCLB regulations that established a uniform and comparable graduation rate. The regulations define a 4-year adjusted cohort graduation rate as “the number of students who graduate in 4 years with a regular high school diploma divided by the number of students who enter high school 4 years earlier, adjusting for transfers in and out, émigrés, and deceased students.” The regulations go on to say:
Students who graduate in four years include students who earn a regular high school diploma at the end of their fourth year, before the end of their fourth year, and, if the state so chooses, during a summer session immediately following their fourth year. (It does not include students who graduate with a modified diploma or certificate of attendance or through a General Educational Development [GED] program.) Students who graduate with a modified diploma or certificate of attendance or through a General Educational Development (GED) program are not included in the graduation rate.
The regulations also call for the state to establish a graduation rate goal that it expects all schools in the state to meet, to set annual graduation rate targets that reflect continuous and substantial improvement from the previous year, to report graduation rates disaggregated by subgroups, and to include the disaggregated rates in AYP determinations (http://www.ed.gov/policy/elsec/reg/proposal/uniform-grad-rate.html).
The rate called for by NCLB is generally in line with the rate endorsed by the NGA Compact. However, the NGA rate allows for modified diplomas (i.e., modified coursework and/or exit exams) and allows students with disabilities and English language learners extra time to graduate. Generally, the NGA rate leaves it to the state to determine which types of diplomas are counted in the rates and which are not, whereas the NCLB rate does not permit these flexibilities.
CONCLUSIONS AND RECOMMENDATIONS
Research findings document that there is a clear association between educational attainment and social and economic outcomes. The findings demonstrate that those with a high school diploma fare much better than those without. We find this evidence to be compelling: a high school diploma is essential for doing well in this country. We think that this research makes a strong case that all students need a high school diploma and that all schools should strive to ensure that all students complete the studies needed to earn this credential.
Public reporting of dropout and graduation rates is one way to bring attention to the problem and to identify schools and districts that need to make improvements. Requiring this reporting via accountability policy is one way to
accomplish this. We therefore endorse the idea that accountability measures, such as NCLB, should require schools to report their graduation and dropout rates, both aggregated for the full population of students and disaggregated by race/ethnicity, gender, socioeconomic status, English language learner status, and disability status. We further think that schools and districts should report a number of different dropout and graduation rates and complementary indicators to provide a comprehensive and accurate understanding of the problem and their progress toward addressing it. Examples include graduation and completion rates for all entering ninth graders, regardless of whether they transfer, and grade 9 promotion rates.
Although public airing of rates brings attention to the problem, more is needed to enact the kinds of changes that need to occur. We think that schools should also be required to set progress goals for improving their completion rates and should be held accountable for achieving those goals.
The formulas that are adopted for these rates should be structured so that students who transfer from one school to another are included in the graduation and/or dropout rates for at least one school. The methods of including students in the formula should be designed to minimize the potential for introducing bias in the rates as a result of systematic transfers into or out of a school (an issue taken up in detail in Chapter 3).
We therefore recommend:
RECOMMENDATION 2-1: Federal and state accountability policy should require schools and districts to report a number of types of dropout, graduation, and completion rates: for all students and for students grouped by race/ethnicity, gender, socioeconomic status, English language learner status, and disability status. Furthermore, accountability policy should require schools and districts to set and meet meaningful progress goals for improving their graduation and dropout rates. Rates that are used for accountability should be carefully structured and reported in ways that minimize bias resulting from student mobility and subgroup definitions.
In calculating graduation and dropout rates for disaggregated groups of students, it is important to remember that trends in the rates are susceptible to change as a result of definitional criteria (an issue described further in Chapter 3). That is, the rates may fluctuate simply as a result of the definitions used or policy about who is included in the subgroup. To the extent possible, criteria for inclusion in subgroups should be made uniform across states and districts. To help users interpret these rates, information on the number of students in the subgroups should be included along with the reported rates.
As alluded to in this chapter, there are multiple ways to report these rates and a variety of decisions to make about how they are calculated. The remaining chapters of this report describe these issues.


