
6
Tolerable Upper Intake Levels: Calcium and Vitamin D
The Tolerable Upper Intake Level (UL) is not a recommended intake. Rather, it is intended to specify the level above which the risk for harm begins to increase, and is defined as the highest average daily intake of a nutrient that is likely to pose no risk of adverse health effects for nearly all persons in the general population. As intake increases above the UL, the potential risk for adverse effects increases. In short, the UL is a reference value intended to guide policy-makers and scientists charged with ensuring a safe food supply and protecting the health of the U.S. and Canadian populations. It applies to intakes on a chronic basis among free-living persons. Those responsible for determining the appropriate dosages of nutrients to be studied in carefully controlled experimental trials conducted in clinical or community settings have the opportunity to bring other considerations into play when deciding on the acceptable levels of nutrients that are appropriate for subjects taking part in such studies. ULs are not designed to address experimental protocols in which safety monitoring occurs.
This chapter is organized to include hazard identification (indicator review and selection) and hazard characterization (intake–response assessment and reference value specification), the first two steps of the general risk assessment approach for Dietary Reference Intake (DRI) development. Therefore, compared with the discussions presented in the two chapters on reference values for adequacy (Chapters 4 and 5), the discussions for ULs are contained in a single chapter. This chapter addresses adverse effects of excess intakes of calcium and vitamin D. Although adverse effects are also associated with deficiencies of calcium and vitamin D, those concerns are
incorporated into the previous discussions focused on establishing reference values for adequacy.
There are often ethical issues associated with conducting clinical trials designed to study the adverse effects of substances that can limit the types of data available for DRI development. For this reason, the derivation of ULs for DRI purposes necessarily relies more heavily on observational data and information derived from animal models than does the approach for the determination of levels of intake for nutritional adequacy. Thus, the emphasis on causality and strength of evidence needed for establishing reference values for adequacy is difficult to apply to the derivation of ULs.
At the outset, it is important to distinguish between the relatively “acute” toxic effects of excess intake and the “chronic” adverse effects of high levels of intake that may manifest in other ways including disease risk. When the ULs for calcium and vitamin D were originally established in 1997, it was noted that the available data were limited relative to adverse outcomes and dose–response relationships (IOM, 1997). In that report, adverse effects from excess intakes of calcium and vitamin D were considered primarily in terms of acute toxicity, which was defined as the condition of hypercalcemia or, in some cases, hypercalciuria with or without hypercalcemia.
The conditions associated with the intoxication syndrome for calcium and vitamin D are informative, but avoiding acute toxicity is not the ideal basis for a UL, a reference value with the larger purpose of public health protection over a life time of chronic intake. Although information concerning chronic excess intakes remains limited, data have emerged recently that may warrant caution about the levels of vitamin D that are consumed and raise questions about the long-term effects of high intakes that are less than those associated with toxicity and that may result in an increase in serum 25-hydroxyvitamin D (25OHD) levels into upper ranges previously considered physiological. Caution may also be warranted in comparing the effects at these high physiological levels of 25OHD achieved through supplementation versus sun exposure, and further research is needed to clarify the relative adverse effects of different sources of vitamin D.
The model developed for UL derivation was summarized in 1998 (IOM, 1998), and it acknowledged that the lack of data would affect the ability to derive precise estimates. Specifically: “Several judgments must be made regarding the uncertainties and thus the uncertainty factor (UF) associated with extrapolating from the observed data to the general population.” Although a number of reports describe the underlying basis for uncertainty factors (Zielhuis and van der Kreek, 1979; Dourson and Stara, 1983), the strength of the evidence supporting the use of a specific UL undoubtedly varies. The summary of the 2007 workshop focused on enhancing DRI development (IOM, 2008) and pointed out the need for uncertainty fac-
|
BOX 6-1 Potential Indicators of Adverse Outcomes for Excess Intake of Calcium and Vitamin D Calcium
Vitamin D
|
tors, but also indicated that the scientific judgment involved should be described. In developing ULs for calcium and vitamin D, the limited nature of the data resulted in the committee using UFs to adjust for uncertainties in the data. These were necessarily qualitative adjustments rather than quantitative adjustments. As suggested repeatedly during the 2007 workshop on DRIs (IOM, 2008), an educated guess for a reference value is more useful to stakeholders than the failure to set a reference value in the face of uncertainty.
Discussions related to calcium ULs are provided first, and then vitamin D ULs are considered. At the start, the committee identified potential indicators to assess adverse effects for excess intakes of calcium and vitamin D based on the available literature, as described below. The potential indicators considered are presented in Box 6-1.
CALCIUM UPPER LEVELS: REVIEW OF POTENTIAL INDICATORS AND SELECTION OF INDICATORS
Excess calcium intake from foods alone is difficult if not impossible to achieve. Rather, excess intakes are more likely to be associated with the use of calcium supplements. However, the potential indicators for the adverse outcomes of excessive calcium intake are not characterized by a robust
data set that clearly provides a basis for a dose–response relationship. The measures available are confounded by a range of variables including other dietary factors and pre-existing disease conditions.
The “classic” toxicity state of hypercalcemia is seen with either calcium or vitamin D excess, although it appears that the symptoms of hypercalcemia are manifested at relatively lower intake of calcium compared with vitamin D, for which high intakes are required to reach a toxic state. In the discussions below, hypercalcemia, as well as, hypercalciuria is described first as general conditions associated with the toxicity of either nutrient, followed by a discussion of adverse outcomes associated with excess calcium intake.
The Toxic Condition of Hypercalcemia and Hypercalciuria
Hypercalcemia occurs when serum calcium levels are 10.5 mg/dL (also expressed as 2.63 mmol/L) or greater depending on normative laboratory values. It can be induced by excess intake of calcium or vitamin D, but it is more commonly caused by conditions such as malignancy and primary hyperparathyroidism (Moe, 2008). Clinical signs and symptoms of hypercalcemia may vary depending on the magnitude of the hypercalcemia and the rapidity of its elevation; they often include anorexia, weight loss, polyuria, heart arrhythmias, fatigue, and soft tissue calcifications (Jones, 2008). When serum calcium levels rise above 12 mg/dL, the kidney’s ability to reabsorb calcium is often limited; in turn, hypercalciuria can occur, particularly with increased calcium or vitamin D intake. Hypercalciuria is present when urinary excretion of calcium exceeds 250 mg/day in women or 275-300 mg/day in men. Often, urinary calcium excretion is expressed as the ratio of calcium to creatinine excreted in 24 hours (milligrams of calcium per milligram of creatinine). Values above 0.3 mg/mg creatinine are considered to be within the hypercalcuric range.
Hypercalcemia, in addition to leading to hypercalciuria, can cause renal insufficiency, vascular and soft tissue calcification including calcinosis leading to nephrocalcinosis, and nephrolithiasis. Nephrolithiasis, often referred to as kidney stones, can also be caused by hypercalciuria. Hypercalciuria may occur in the absence of hypercalcemia and is related to either hyperabsorption of calcium in the gut or a renal leak whereby calcium excretion is enhanced. Both etiologies can lead to nephrocalcinosis.
In the North American population, as many as 30 percent of persons ages 60 years or older have some degree of renal insufficiency (Coresch et al., 2005; Szczech et al., 2009). Decreased renal functioning may make persons more sensitive or susceptible to the effects of excess calcium or vitamin D intake. Urinary calcium excretion decreases in older adults, although it is not clear the extent to which this may be due to decreased
calcium intake as compared to decreased renal function. However, if due to decreased renal function, older persons may be at higher risk for adverse effects derived from excess intakes. Moreover, decreased renal function simultaneously increases cardiovascular disease (CVD) risk and impairs calciuric responses and calcium and phosphate homeostasis. Likewise, those using thiazide-based diuretics—a sizeable proportion of older adults—are more readily challenged by excess calcium and vitamin D due to reduction in calcium excretion from the kidney (Medarov, 2009).
Excess Calcium and Hypercalcemia Leading to Renal Insufficiency
Prior to the introduction of histamine-2 blockers and proton pump inhibitors, liquid formulations that contained high calcium levels and absorbable alkali were used to treat gastric and duodenal ulcers. High intake of these formulations, however, caused a variety of adverse effects including hypercalcemia and renal failure. The syndrome became known as “milk-alkali syndrome” or MAS (Hardt and Rivers, 1923; Burnett et al., 1949) and was originally associated with men with peptic ulcer disease. In this context, hypercalcemia causes emesis and natriuresis, which result in significant drops in extracellular blood volume. This contraction worsens the hypercalcemia. Decreases in blood volume also induce an alkalotic state that causes an increase in proximal tubular bicarbonate resorption. Also, high serum calcium levels worsen the alkalosis through suppression of parathyroid hormone (PTH), which physiologically enhances bicarbonate excretion. Although the availability of absorbable alkali in the diet may enhance the alkalotic state, it is not the major pathogenic factor in MAS.
Recently, Patel and Goldfarb (2010) suggested renaming MAS as “calcium-alkali syndrome” to better reflect the current understanding of the disorder, which now has shifted to be more prevalent in other groups including postmenopausal women. The earlier MAS presented with hyperphosphatemia after prolonged ingestion of phosphorus-containing milk with cream (Patel and Goldfarb, 2010). In contrast, the modern version of the syndrome is associated with hypophosphatemia or low-normal serum phosphorus levels as a result of the phosphorus-binding properties of calcium carbonate. The hypophosphatemia is more pronounced in elderly patients or those with eating disorders, who tend to have relatively low consumption of protein and therefore phosphorus (Picolos et al., 2005; Felsenfeld and Levine, 2006; Medarov, 2009). Confounding this, however, is the chronic renal insufficiency that often accompanies MAS; in that case, serum phosphorus levels may be normal or high. Available case reports tend to provide only serum calcium levels and do not specify calcium intakes per se, or serum phosphate, associated with the condition.
As shown in Table 6-1, a number of recent case reports have been iden-
TABLE 6-1 Case Reports of Calcium-Alkali Syndrome
tified for calcium-alkali syndrome. For these individuals, a calcium intake of 3,000 mg/day was associated with the onset of hypercalcemia. However, in every case except one, all outcomes were found in individuals with impaired renal function and high serum creatinine levels. The one exception (Nabhan et al., 2004) was a patient who was using hydrochlorothiazide as a diuretic and was hypoparathyroid. Although these data cannot be applied directly to the normal, free-living population, they are informative and indicate that calcium levels of 3,000 mg/day are problematic for these compromised persons.
Patel and Goldfarb (2010) suggested that the incidence of calcium-alkali syndrome is growing as a result of the widespread use of over-the-counter calcium and vitamin D supplements, particularly among older persons. The basis for the suggestion is that while healthy younger adults rely on the bone reservoir to buffer excess calcium, the net flux of calcium is out of the bone for older persons, thereby making the bone less functional as a reservoir. These older persons are more susceptible to the syndrome when they begin taking supplemental calcium. Patel and Goldfarb (2010) also noted that the excess ingestion of calcium with or without vitamin D is an integral feature of this syndrome, making it potentially relevant to the consideration of upper levels of calcium intake.
Excess Calcium and Soft Tissue Calcification
Associated with Hypercalcemia
Calcification of soft tissues—calcinosis—occurs as a result of long-standing hypercalcemia, increased serum phosphate levels, or local abnormality in the affected tissues. Clinically, the condition is linked to metabolic disorders such as hyperparathyroidism, sarcoidosis, or connective tissue disease such as scleroderma.1
Calcification of kidney tissues, or nephrocalcinosis, results in symptoms similar to those of renal dysfunction, ranging from painful and frequent urination to nausea, vomiting, and swelling. Although nephrocalcinosis has been reported to be induced by calcium intake in rats (Peterson et al., 1996), no data link calcium intake or the use of calcium supplements in humans to the onset of nephrocalcinosis. Nephrocalcinosis may be associated with calcium nephrolithiasis under particular conditions (Vervaet et al., 2009).
Relative to hypercalcemia and calcification of vascular tissue, there is
experimental evidence in humans and laboratory animals indicating that hypercalcemia can lead to vascular calcification in the setting of renal insufficiency as a result of elevated calcium and phosphate concentrations (Reynolds et al., 2004; Yang et al., 2004; Cozzolino et al., 2005). However, this has not been demonstrated clinically.
Associated with Calcium Supplements
Calcification of vascular tissues has been reported with high calcium intake (Goodman et al., 2000; Asmus et al., 2005; Block et al., 2005; Raggi et al., 2005); however, the reports are based on individuals with compromised kidney function. No link has been clearly established for a general population.
Bolland et al. (2008), in a recent randomized, placebo-controlled trial, found that cardiovascular events may be slightly more prevalent in older women on calcium supplementation. Reid and Bolland (2008), in a subsequent companion publication, suggested among other possibilities that vascular calcification may be relevant to their finding of an upward trend in cardiovascular event rates in healthy postmenopausal women supplemented with calcium. These findings were contrary to the purported benefits of calcium supplementation and CVD.
A more recent meta-analysis conducted by Bolland et al. (2010) examined 11 randomized controlled trials of calcium supplements in 12,000 older patients and found that there was a 30 percent increased risk of heart attack independent of age, gender, and type of supplement. Although this report is of concern, there are several relevant limitations. The studies included are small, the event frequency is low, and most outcomes have confidence intervals (CIs) that overlap. Moreover, cardiovascular events were not a primary outcome, the events may not have been well adjudicated, and renal function was not considered as a covariate. Many of the studies supplemented with 1,000 to 1,200 mg of calcium per day and did not report the total calcium intake (supplement plus diet). The events may therefore be associated with intakes higher than the supplemented dose, perhaps 2,000 mg of calcium per day or more, as reported, for example, by Jackson et al. (2006). Under these circumstances, it is difficult to conclude that calcium intakes per se in the range of 1,000 to 1,200 mg/day can be associated with cardiovascular events. In addition, some questions remain as to whether the addition of this amount of calcium to a baseline diet as a calcium supplement may have adverse consequences.
Excess Calcium and Nephrolithiasis (Kidney Stones)
More than 12 percent of men and 6 percent of women in the general population will develop kidney stones (Stamatelou et al., 2003). The mor-
bidity of kidney stones is not limited to the pain of stone passage; stones increase the risk of renal and urinary tract infections as well as renal insufficiency. A contributing factor in stone formation is hypercalciuria from any cause; another is hyperabsorption of calcium from the gut. Hypercalciuria increases the risk for nephrolithiasis (Pak and Holt, 1976). Hypercalciuria can be present in the absence of hypercalcemia and may reflect routine excretion of excess calcium intake.
Incidence rates for kidney stones vary by age and gender. The rates are highest in men, rising after age 20, peaking between 40 and 60 years, and then beginning to decline (Johnson et al., 1979; Hiatt et al., 1982; Curhan et al., 1993). For women, incidence rates seem to be higher in the late 20s, decreasing by age 50, and then remaining relatively constant (Johnson et al., 1979; Hiatt et al., 1982; Curhan et al., 1997, 2004).
Although calcium is present in approximately 80 percent of kidney stones (Coe et al., 1992), the role of calcium and other nutrients, acting alone or in concert as risk factors, is not completely understood and may be a function of physiological context. Various dietary and non-dietary factors are associated with stone formation, making data difficult to interpret. Rodent models that have been used to explore the effect of dietary factors on the propensity to form calcium oxalate and calcium phosphate stones suggest that the role of supplemental calcium in determining risk for nephrolithiasis varies by interaction with a given dietary component. One study in rats compared renal oxalate crystallization relative to the consumption of calcium-supplemented or oxalate-rich diets as well as control diets. The study found that rats fed the calcium-supplemented diet had enhanced calcium and oxalate accumulation as well as crystallization in renal tissues, even though urinary oxalate and citrate excretion was not significantly different in rats fed the control diet (Mourad et al., 2006). In this study, measures of renal function, including glomerular filtration rate, fractional excretion of urea, and fractional reabsorption of water and magnesium were not affected by the calcium-supplemented diet, and calciuria was only slightly increased.
Nephrolithiasis in Adults
Recently, a study using data from the Women’s Health Initiative (WHI) trial, which recruited more than 36,000 post-menopausal women ages 50 to 79 years (mean age 62 years), reported findings on the incidence of kidney stones (Jackson et al., 2006). Participants were randomly assigned to receive a placebo or 1,000 mg of elemental calcium (calcium carbonate) per day with 400 International Units (IU) of vitamin D3. The primary outcome focus was fractures and measures of bone density. Mean baseline intake of calcium was approximately 1,100 mg/day and the supplement added another 1,000 mg/day, for a total average calcium intake of about
2,100 mg/day for the experimental group. The mean baseline intake for vitamin D was about 365 IU/day, which, when combined with the vitamin D supplement, resulted in an approximate vitamin D intake of 765 IU/day for the experimental group. The rate of adherence (defined as use of 80 percent or more of the assigned study supplements) ranged from 60 to 63 percent during the first 3 years of follow-up, with an additional 13 to 21 percent of the participants taking at least half of their study pills. At the end of the trial, 76 percent were still taking the study supplements, and 59 percent were taking 80 percent or more of the supplements.
Among the healthy postmenopausal women in the WHI study, the doses of calcium and vitamin D resulted in an increased risk (17 percent) of kidney stones. Kidney stones were reported by 449 women in the supplemented group, compared with 381 women in the placebo group. With respect to the intention to treat, the reported hazard ratio (HR) was 1.17 (95% CI: 1.02–1.34). Although this study did not focus on calcium intake alone, the total vitamin D intakes were around 800 IU/day, a level that is not associated with either hypercalcemia or hypercalciuria. Therefore, it is reasonable to consider the possibility that total calcium intake of 2,100 mg per day were associated with increased kidney stones in this population. Although the kidney stone events were not adjudicated specifically, adjudication problems should be randomly distributed and thus not a contributing factor to the outcome.
The WHI reflects a large, well-designed cohort study. There is also a report from a small, short trial (covering 4 years) of 236 elderly women with a baseline calcium intake of 800 mg/day and with calcium supplementation of 1,600 mg/day for 1 year (total calcium intake of approximately 2,400 mg/day) (Riggs et al., 1998). In this study, 50 percent of subjects receiving supplemental calcium and 8 percent of placebo controls had urinary calcium levels exceeding 350 mg/day, but no subjects in the calcium group experienced nephrolithiasis, nephrocalcinosis, or a decrease in glomerular filtration rate. Other smaller trials among older subjects have shed little light on the issue of nephrolithiasis and calcium intake, either because the doses were relatively low or because subjects were recruited on the basis of having had previous incidence of kidney stones (Levine et al., 1994; Williams et al., 2001; Borghi et al., 2002).
Curhan et al. (1997) examined the risk for kidney stones in women 34 to 59 years of age, using data from the Nurses’ Health Study (NHS), a notably younger group of subjects than those included in the WHI study. They reported an inverse association between calcium intake from foods, but a positive relationship between risk and intake of calcium from supplements (Curhan et al., 1997). In a 2004 study, Curhan and colleagues (Curhan et al., 2004) prospectively examined data again from the NHS for an 8-year period relative to dietary factors and the risk for kidney stones in women 27 to 44 years of age. In this analysis, the inverse relationship between calcium
intake from foods and the risk of kidney stone formation remained, but there was no apparent relationship between supplement use and risk. In a study of 50,000 men 40 to 75 years of age (Curhan et al., 1993), the same relationship was evident: reduced risk with increased intake of calcium from food sources, but no association with use of calcium supplements.
The suggested discrepancy between the risks from food sources of calcium and from calcium supplements may in part be due to the timing of the supplement intake (Curhan et al., 2007). Calcium present in the food will bind oxalate, a known contributor to kidney stone formation, and prevent its absorption. If taken between meals, the calcium would have less opportunity to bind oxalate, and so oxalate absorption would be increased. These observations suggest that taking calcium supplements with meals should reduce the formation of kidney stones, but this has not been tested.
Overall, the data indicate that the calcium content of foods does not cause stone formation, but may be protective against it. On the other hand, calcium supplements are emerging as a concern based on observational data, at least for some groups under certain circumstances. Further, individuals with a history of kidney stones are at increased risk if they obtain their calcium from supplements rather than food sources. There is, however, limited evidence from small, short-term trials suggesting that supplemental calcium in moderate doses may not increase risk for stone recurrence. The most important evidence to date is from the WHI trial (Jackson et al., 2006), which indicated that a mean calcium intake from foods and supplements that totaled about 2,150 mg/day—plus a vitamin D supplement of 400 IU/day, a level low enough to avoid potential confounding effects for adverse events given the mean total vitamin D intake of approximately 750 IU/day—resulted in a 17 percent increased incidence of kidney stones among postmenopausal women, regardless of whether the subjects had experienced previous clinical events related to urinary calculi formation.
Nephrolithiasis in Children
Hypercalciuria, as a secondary outcome to high calcium intake, can occur in children as well as in adults. However, the incidence of kidney stones in children is rare. There is limited evidence concerning high calcium intakes in young children relative to calcium excretion. In a study of children ages 1 to 6 years and designed to test the effects of 1,800 mg/day total calcium (supplementation adjusted on the basis of dietary calcium questionnaire), the calcium intake of 1,800 mg/day calcium did not cause urinary calcium/creatinine ratios to differ significantly from those of placebo controls (Markowitz et al., 2004).
A study by Sargent et al. (1999) provides information relevant to infants and calcium excretion. This study supplemented the formula of full-term
infants with calcium glycerophosphate, providing 1,800 mg of calcium (and 1,390 mg of phosphate) per liter of formula. The mean calcium intake for infants receiving the supplemented formula was more than 4 times that of children in control groups at months 4 and 9, with a mean calcium intake of 1,563 ± 703 mg/day at 9 months. Although the focus of the study was lead absorption, the data demonstrated that total calcium intakes of about 1,550 to 1,750 mg/day did not affect urinary calcium excretion. The data are somewhat limited in that younger infants were not studied; further, the contribution from solid foods in older infants was not clearly tracked. With these limitations, the authors’ conclusion that this level of intake probably would not increase the likelihood of nephrolithiasis is reasonable.
Excess Calcium and Prostate Cancer
The vast majority of the data relating to prostate cancer and calcium intake are derived from observational studies, and the ability to sort the effect of dairy products from that of calcium is challenging. Some observational data suggest a role for dairy products as a risk factor for prostate cancer (Tominaga and Kuroishi, 1997; Grant, 1999). A recent case–control study examined associations between dairy products and dietary calcium and prostate cancer risk among men ages 35 to 84 years with a histological diagnosis of prostate cancer (Raimondi et al., 2010). Intake of dairy products, in particular milk consumption, was associated with a two-fold increased risk for prostate cancer, whereas consumption of other dairy products (cheese, yogurt, and cream) suggested no association for increased risk. Total calcium intake was not significantly associated with risk for prostate cancer (p = 0.09).
Other observational studies evaluating associations between milk or dairy product intake and overall risk for prostate cancer have suggested that supplemental calcium intake may be a stronger risk factor for prostate cancer than calcium from foods, particularly for aggressive prostate cancer with high mortality. Studies of associations between calcium supplement use and risk for incident prostate cancer provide mixed results. A small case–control study assessed men ages 40 to 64 years with newly diagnosed prostate cancer for multivitamin and supplement use by questionnaire (Kristal et al., 1999). Although about a third of both cases and controls reported using multivitamins, only 5 percent reported taking calcium supplements. No association was found between calcium supplement use and risk for incident prostate cancer in this relatively young and low-risk population. A prospective study of male participants ages 50-74 years from the Cancer Prevention Study II examined associations between calcium and dairy product intake and risk for incident prostate cancer (Rodriguez et al., 2003). This analysis of 65,321 men found a small increase in overall pros-
tate cancer risk for calcium intakes of 2,000 mg/day and higher compared with intakes less than 700 mg/day. High calcium intake (≥ 2,000 mg/day), however, was significantly associated with risk for advanced prostate cancer. When calcium supplements (≥ 500 mg/day) were analyzed, controlled for total calcium intake, a weak association was found for prostate cancer risk. Dairy product intake was not associated with risk for prostate cancer. The report from the World Cancer Research Fund/American Institute for Cancer Research (WCRF/AICR, 2007) concluded that the relationship between prostate cancer and milk and dairy product intake is inconsistent from both cohort and case–control studies, and there is limited evidence suggesting that milk and dairy products are a cause of prostate cancer. A food-use questionnaire administered at baseline to participants in the Alpha-Tocopherol, Beta-Carotene Cancer Prevention (ATBC) Study explored associations between intake of certain foods and nutrients and risk for incident prostate cancer in a large cohort of male smokers ages 50 to 69 years. This study analyzed intake of calcium and dairy foods and found no associations with development of prostate cancer (Chan et al., 2000). In a longitudinal follow-up of this cohort, Mitrou et al. (2007) found a graded positive association between increasing total calcium intake and total prostate cancer risk. A prospective study of male participants ages 40 to 75 years from the Health Professionals Follow-Up Study (HPFS) examined whether calcium and fructose intake were risk factors for prostate cancer (Giovannucci et al., 1998). Calcium intake exceeding 2,000 mg/day was found to be associated with higher risk for total, advanced, and metastatic prostate cancer. Further, supplemental calcium intake above 900 mg/day was associated with metastatic prostate cancer risk at all levels of total calcium intake. In a follow-up analysis of this cohort, Giovannucci et al. (2006a) found a significantly increased risk for advanced prostate cancer associated with increasing total calcium intake and for fatal prostate cancer associated with supplemental calcium intakes of 401 mg/day and above. The WCRF/AICR (2007) concluded that there is a probable association between diets high in calcium and prostate cancer.
In the case of intervention studies, one randomized controlled multicenter clinical trial based on 672 men (mean age 61.8 years) living in the United States examined risk for prostate cancer from supplemental calcium intake. Participants received either 3 g of calcium carbonate or placebo daily for 4 years and were followed for up to 12 years for prostate cancer diagnosis (Baron et al., 2005). Over the entire study period, risk for prostate cancer was lower in the calcium-supplemented group than in controls (relative risk [RR] = 0.83; 95% CI: 0.52–1.32) but was not statistically significant. For specific years in the study, increase in prostate cancer risk was statistically significant between baseline and year 6 (RR = 0.52; 95% CI: 0.28–0.98) and between years 2 and 6 (RR = 0.44; 95% CI: 0.21–0.94).
No significant differences were found for total calcium intake and prostate cancer risk.
The 2009 analysis from the Agency for Healthcare Research and Quality (Chung et al., 2009; hereafter referred to as AHRQ-Tufts) examined 12 cohort studies that reported on the association between calcium intake and the risk of prostate cancer (Schuurman et al., 1999; Chan et al., 2001; Rodriguez et al., 2003; Baron et al., 2005; Tseng et al., 2005; Giovannucci et al., 2006a; Koh et al., 2006; Mitrou et al., 2007; Park et al., 2007a,b; Rohrmann et al., 2007; Kurahashi et al., 2008). One of the studies also provided a post hoc analysis of a randomized controlled trial on calcium supplementation. The incidence of prostate cancer in these studies ranged from 0.008 to 0.10. Most of the studies were conducted in Europe or North America, and one study was conducted in Japan. The mean age of the subjects ranged from 53 to 67 years, but did include men 51 to 70 years of age. No study specifically targeted men older than 70 years of age. Total calcium intake ranged from less than 500 mg/day to at least 2,000 mg/day. The time between dietary assessment and the diagnosis of prostate cancer varied from 1 to 17 years. AHRQ-Tufts rated the studies for methodological quality as follows: four studies were rated A, seven studies were rated B, and one study was rated C. The studies included participants in the age range of 51 to 70 years. Seven studies did not find an association between calcium intake and the risk of prostate cancer (Baron et al., 2005; Koh et al., 2006; Mitrou et al., 2007; Park et al., 2007a,b; Kurahashi et al., 2008). The remaining five studies found that the risk was higher in the groups that took more calcium compared with those that took a lower amount; the higher amount ranged from 921 to at least 2,000 mg of calcium per day.
Overall, data in this area are at best emerging. Although observational studies suggest that total calcium intake of 2,000 mg/day or higher may be associated with increased risk for prostate cancer and particularly with advanced and metastatic cancer, these data are not sufficiently robust to serve as an indicator for a UL. The one available trial was negative. The observations, however, are notable for levels of intake that are less than those that produce hypercalcemia and hypercalciuria.
Excess Calcium and Nutrient Interactions: Iron and Zinc
Despite the absence of clinically or functionally significant depletion of relevant mineral nutrients, calcium interaction with other minerals in the diet has been considered a potential risk related to high calcium intakes. The 1997 DRI report (IOM, 1997) specifically called for increased study in this area. However, data remain limited.
With respect to iron, Ilich-Ernst et al. (1998) carried out a placebo-
controlled randomized trial assessing the effects of calcium supplementation on bone mass in adolescent girls ages 8 to 13 years (n = 354). A secondary analysis at year 4 of this 7-year trial found that girls in the supplemented group achieved a total calcium (food plus supplements) intake of 1,500 mg/day. When assessed for interactions between calcium and iron, measures of iron status—hemoglobin, hematocrit, and corpuscular indexes—were not significantly different from those of girls in the placebo group who reached a calcium intake of 800 mg/day. Ames et al. (1999) found no effect of a calcium intake of approximately 1,200 mg/day compared with 500 mg/day for 5 weeks on iron absorption in children 3 to 5 years of age.
With respect to zinc, McKenna et al. (1997) conducted a calcium and zinc balance study on a subset (n = 26) of participants in a longitudinal clinical trial of the effects of calcium supplementation on bone mass in girls with a mean age of 11 years. Trial participants received either 1,000 mg/day of supplemental calcium or a placebo. Mean calcium intake reached 847 ± 287 and 821 ± 224 mg/day from diet for placebo and intervention groups, respectively, at 6 months. With the additional supplement, the mean calcium intake in the intervention group exceeded 1,700 mg/day. The results of the balance study found no effect in the intervention group from intake of approximately 1,700 mg of calcium per day on net zinc absorption, zinc excretion, or zinc balance compared with intakes of approximately 800 mg/day in the placebo group.
Taken together, the studies suggest that calcium intakes of 1,500 to 1,700 mg/day do not interfere with iron or zinc absorption in adolescent girls. However, as calcium intakes among this age group could be higher than those studied, there is little evidence to shed light on the larger issue.
Excessive Calcium and Constipation
Calcium supplement intake has long been associated with constipation. In fact approximately 1 of every 10 participants in the WHI calcium–vitamin D supplementation trial reported moderate to severe constipation (Jackson et al., 2006). If a food source of calcium is the problem, the constipation is likely due to the components of dairy products (Anthoni et al., 2009) rather than to the calcium in food. Calcium supplements, which are regarded as “binding,” can cause side effects for some people, such as constipation and gas (Jackson et al., 2006; Prince et al., 2006), which varies greatly from person to person. Usually the constipation is alleviated by increasing intakes of water or fiber-rich foods, or by trying another form of supplement (calcium citrate may be less constipating than calcium carbonate, for example). Although such conditions warrant attention, the utility of constipation as an indicator for DRI development is doubtful.
Selection of Indicator for Calcium UL
The risk assessment framework, as described in Chapter 1, specifies that, in the case of ULs, the available data pertaining to adverse effects be first examined for evidence of a benchmark intake (BI). Alternatively, either a no observed adverse effect level (NOAEL) or a lowest observed adverse effect level (LOAEL) is considered. In the case of calcium, limited new information has become available since 1997. The indicators selected are calcium excretion for younger age groups, and kidney stone formation for older age groups. The calcium excretion data provide information for a group for which no data were available in 1997. The newer data on kidney stone formation form a basis for a UL that is more akin to conditions experienced by the normal, healthy population than is calcium-alkali syndrome, although the cautions expressed by Patel and Goldfarb (2010) concerning the vulnerability of older persons to calcium-alkali syndrome with the use of calcium supplements are worthy of note.
The available data could not offer a BI or be used to estimate a dose–response relationship. The basis for the ULs is a NOAEL for infants and a LOAEL for adults, as described further below for specific life stage groups.
CALCIUM UPPER LEVELS: INTAKE-RESPONSE ASSESSMENT AND SPECIFICATION OF UPPER LEVELS
The ULs for calcium established for the DRI life stage groups are shown in Table 6-2. These values suggest that the levels of intake regarded as consistent with a UL are relatively close to the levels of intake considered to be appropriate for nutritional adequacy.
ULs for Infants 0 to 12 Months of Age
|
In the previous 1997 DRI report (IOM, 1997), a UL for calcium for infants was not specified owing to lack of data. The 1997 report noted a small, randomized trial of 81 infants (103 at baseline, ages 2.5 to 5.0 months at entry) designed to examine the tolerance of calcium-supplemented infant formula through 9 months of age (Dalton et al., 1997). The data, as analyzed in 1997 (IOM, 1997), indicated only that infants fed calcium at up to approximately 1,750 mg/day experienced no adverse effect on iron status.
TABLE 6-2 Calcium Tolerable Upper Intake Levels (UL) by Life Stage
|
Life Stage Group |
UL |
|
Infants |
|
|
0 to 6 mo |
1,000 mg |
|
6 to 12 mo |
1,500 mg |
|
Children |
|
|
1–3 y |
2,500 mg |
|
4–8 y |
2,500 mg |
|
Males |
|
|
9–13 y |
3,000 mg |
|
14–18 y |
3,000 mg |
|
19–30 y |
2,500 mg |
|
31–50 y |
2,500 mg |
|
51–70 y |
2,000 mg |
|
> 70 y |
2,000 mg |
|
Females |
|
|
9–13 y |
3,000 mg |
|
14–18 y |
3,000 mg |
|
19–30 y |
2,500 mg |
|
31–50 y |
2,500 mg |
|
51–70 y |
2,000 mg |
|
> 70 y |
2,000 mg |
|
Pregnancy |
|
|
14–18 y |
3,000 mg |
|
19–30 y |
2,500 mg |
|
31–50 y |
2,500 mg |
|
Lactation |
|
|
14–18 y |
3,000 mg |
|
19–30 y |
2,500 mg |
|
31–50 y |
2,500 mg |
Using these same data, Sargent et al. (1999) later reported on calcium excretion measures, and this measure serves as the UL indicator for infants. This 1999 report has provided the ability to estimate a NOAEL for calcium intake for infants based on calcium excretion. Within the confines of the limitations of the data, they suggest that infants can tolerate approximately 1,750 mg of calcium per day with no noted adverse effects. A NOAEL of 1,750 mg/day is therefore established for infants on this basis.
Infants 0 to 6 Months of Age
The presumed sensitivity of the young infant to excess intakes of any substance, as well as the lack of direct evidence to clarify the nature of adverse effects for this group, warrants a cautious approach. Quantitative factors relative to metabolic differences between younger infants and older
infants in terms of handling excess calcium cannot be derived based on the literature, and little is available to inform the scientific judgment for public health protection except body weight. According to the Centers for Disease Control and Prevention (CDC) growth charts,2 infants should increase their weight between birth and 3 months of age from about 7.0 pounds (3.5 kg) to 13.0 pounds (6 kg), and then to about 17.5 pounds (8 kg) by 6 months of life. The NOAEL of 1,750 mg/day—which is derived from one study within the age range of 3 to 9 months (Sargent et al., 1999)—is reduced by an uncertainty factor of 2 to adjust for this weight difference and rounded to 1,000 mg of calcium per day to serve as the UL for this life stage group. This is admittedly a cautious approach but, by establishing a UL for infants, their safety is more readily ensured than would be the case in the absence of a UL, and the value is reasonable in view of the available data and current biological understandings. The 1997 IOM report on calcium DRIs did not establish a UL for infants (IOM, 1997).
Infants 6 to 12 Months of Age
The NOAEL of 1,750 mg/day is a reasonable starting point for the UL for older infants. Consistent with general principles of human physiology and toxicology, the committee considered that an infant’s capacity to handle excess nutritional substances is increased with increased body size. Presumably in the case of calcium, which is a critical requirement during these periods of bone development, the infant’s ability to tolerate higher levels of intake is greater as the infant grows and develops skeletal structure. Therefore, the NOAEL of 1,750 mg/day is not unreasonable as the basis for a UL. However, given the paucity of data, a slight uncertainty correction is warranted, and the UL is set at 1,500 mg/day for infants 7 to 12 months of age. No UL for this age group was established in 1997 (IOM, 1997).
ULs for Children and Adolescents 1 Through 18 Years
|
|
2 |
Available online at http://www.cdc.gov/growthcharts/ (accessed July 19, 2010). |
New data on adverse outcomes due to excess calcium intake among children and adolescents—specifically data that would identify a NOAEL or LOAEL—have not emerged since the last DRI report on calcium in 1997 (IOM, 1997). At that time, it was noted that the safety of excess calcium intake in children and adolescents had not been studied. A UL of 2,500 mg of calcium per day was established in 1997 for all children and adolescents in these life stage groups, largely on the basis of the UL established for adults (i.e., 2,500 mg/day) (IOM, 1997).
There is currently no evidence that the 1997 level is too low to provide public health protection for this group; further, when compared with the new UL set for infants, the level of 2,500 mg of calcium per day is a reasonable increase given the expected increases in body weight and metabolic capacities, especially for younger children between the ages of 1 and 8 years.
However, for older children it is also appropriate to take into account the likely increases in tolerated intakes as metabolic demands increase and the pubertal growth spurt associated with bone accretions sets in, primarily between 9 and 18 years of age. Again, there are no data to allow quantitative uncertainty factors to be developed to mathematically correct for the likelihood of increased capacities during the bone growth spurt, but to do so in some fashion is consistent with a general toxicological approach. An added level of 500 mg/day is reasonable, resulting in a UL of 3,000 mg of calcium per day for children 9 to 13 years of age and adolescents 14 to 18 years of age.
The UL for children 1 through 8 years of age is the same as that established for these life stage groups in 1997 (IOM, 1997). However, the UL has been increased by 500 mg/day for older children and adolescents compared with 1997 (IOM, 1997). This is based on a biologically reasonable adjustment intended to take into account increased need and therefore increased capacity to tolerate a slight increase in a UL value.
ULs for Adults 19 or More Years of Age
|
The onset of hypercalcemia is clearly an adverse outcome. However, it was not selected as an indicator for ULs for adults because it reflects an
extreme pathological condition, and the ability to consider other adverse events associated with sustained, high levels of intake has emerged. Specifically, kidney stone formation is an adverse outcome, notably among post-menopausal women. Although there is also evidence related to calcium-alkali syndrome among adults, most of the data relate to those with compromised kidney function. Vascular calcification in postmenopausal women has emerged as an interesting hypothesis, but available data are conflicting, and threshold levels for intake are unknown. Evidence related to prostate cancer, although concerning, was too confounded to allow this disease risk to serve as an indicator for establishing ULs for calcium intake. Further, neither constipation nor nutrient interactions were associated with data to suggest that these outcomes would serve as indicators for UL development.
Given the size and quality of the WHI trial, its outcome relative to the incidence of kidney stones (Jackson et al., 2006) results in the selection of kidney stones as the indicator for adults for DRI purposes. The levels of calcium intake that may cause kidney stones within a normal population cannot be specified with certainty and are known to be variable depending upon a number of factors, including baseline renal function, pre-existing disease conditions, and interactions with drugs. Based on the findings of Jackson et al. (2006), and with the understanding that the data are derived from women between the ages of 50 and 79 years, there is a concern for kidney stone risk at total calcium intakes of approximately 2,000 mg/day. Underpinning the concern is the recognition that intakes of calcium from food do not readily result in excess intakes and are not associated with adverse effects; rather, the adverse effects appear to be a function of calcium supplementation added to baseline intake. The level of 2,000 mg of calcium per day is established as the LOAEL for adults, including men, more than 50 years of age. The very limited data available for adults 19 to 50 years of age do not allow the specification of a LOAEL or NOAEL for this younger group and the UL for this group is derived from considerations used for the UL for persons above 50 years of age. For this reason the ULs for older adults are discussed first below, followed by adults 19 to 50 years of age.
Adults 51 Years of Age and Older
The committee considered the option of applying an uncertainty factor to lower the LOAEL, given the limited data. However, the unknowns surrounding the precision of the LOAEL coupled with the observation that the LOAEL is very close to intakes that are considered adequate and recommended, caused the committee to conclude that, until there are
better data related to calcium intakes from supplements and the incidence of kidney stones or other relevant health outcomes, establishing a UL of 2,000 mg of calcium per day is justified and provides a reasonable degree of public health protection without overly restricting the intake of calcium (notably from calcium supplements) for both men and women. There is no apparent reason to conclude that men in this age group are more sensitive than women. Although one 1993 observational study does not support the potential for increased kidney stone formation with supplement use among men, public health protection warrants caution for this older group. Moreover, the value of 2,000 mg of calcium per day is also somewhat below the 3,000 mg/day associated with calcium-alkali syndrome among persons with waning kidney function, the only other potential indicator with an estimate of threshold levels for effect.
The new UL of 2,000 mg of calcium per day for persons 51 to 70 years of age and for persons more than 70 years of age is lower than the 1997 UL of 2,500 mg/day for these groups (IOM, 1997). The newer data related to kidney stone formation are the primary basis for the new UL. It is extremely difficult to reach the UL on the basis of food sources of calcium. Rather, the excess intake comes about from the use of calcium supplements. Special considerations about the use of high level calcium supplements and the timing of supplement intake are discussed in Chapter 8.
Adults 19 Through 50 Years of Age
Although the LOAEL (which is also the UL, as described above) for older adults more than 50 years of age is established at 2,000 mg/day, it can only serve as a starting point for UL consideration for adults 19 to 50 years of age given the observations that kidney stone formation in younger adults does not appear to be driven by calcium supplement use, and, as a rule, calcium supplement use is not as prevalent among younger adults. However, kidney stone formation is notable among younger persons; as discussed previously, the incident rate is actually higher among younger adults than among older adults. Given the UL of 3,000 mg/day for calcium set for adolescents up to the age of 18 years (based on high rate of bone accretion) as well as the likelihood that younger adults are able to tolerate higher maximal levels of calcium than other adults for whom kidney function may be slowly decreasing, an interpolation approach is used to establish a UL of 2,500 mg/day for adults 19 to 30 and 31 to 50 years of age, based on the mid-point between the UL of 2,000 mg of calcium per day set for persons more than 50 years of age and the UL of 3,000 mg/day set for adolescents 14 to 18 years of age. Further, concerns about the
timing of calcium supplement intake would still be relevant to this group and are discussed in Chapter 8.
ULs for Pregnancy and Lactation
|
||||||||
Hypercalciuria is often present during normal pregnancy as a consequence of the doubling of intestinal calcium absorption that occurs, and pregnancy itself increases the risk of kidney stones. Consequently, excess intakes of calcium during pregnancy will aggravate hypercalciuria and possibly increase the risk of kidney stones. During lactation, the serum calcium (both ionized and albumin-corrected total calcium) level rises and usually remains within the normal range (although hypercalcemia can occur during normal lactation), and urinary excretion of calcium is reduced to the low-normal range or below. Consequently, higher intakes of calcium during lactation could potentially increase the risk of hypercalcemia. However, there is no evidence to suggest that the risk manifests itself at intakes lower than the UL for non-pregnant or non-lactating women, although it is acknowledged that relevant studies have not been rigorously carried out for pregnancy and lactation. Given that available evidence suggests that requirements for calcium among pregnant and lactating females are similar to those of non-pregnant and non-lactating females, and lacking data to suggest a basis for a different UL, the ULs for calcium for pregnancy and lactation have been kept the same as those for their non-pregnant and non-lactating counterparts.
VITAMIN D UPPER LEVELS: REVIEW OF POTENTIAL INDICATORS AND SELECTION OF INDICATORS
Few studies have been designed to specifically evaluate the safety of vitamin D intake, and there is not general agreement about the intake levels at which vitamin D may cause harm. A recent National Institutes of Health conference highlighted the lack of knowledge about mechanisms of action and toxic forms of the vitamin as well as the many limitations in the available evidence. Conference participants noted that available randomized controlled trials designed to illuminate health benefits likely
underestimate the true potential for risk because: (1) for ethical reasons, adverse outcomes are secondary outcomes, (2) studies are of relatively short duration, (3) adverse outcomes are not always adequately monitored or completely reported, and (4) adverse outcomes generally lack adequate statistical power for detection (Brannon et al., 2008). Further, inclusion and exclusion criteria prevent persons at greatest risk from being study participants (Yetley et al., 2009).
Over the years, excess intake of vitamin D has been considered in the context of “intoxication” or “hypervitaminosis D”; as such, the condition is perhaps best regarded as a relatively acute response. Symptoms can appear in less than 4 weeks of continual excess ingestion. The hallmark of vitamin D intoxication is hypercalcemia, which is associated with a rise in serum 25OHD levels. The conditions of hypercalcemia and hypercalciuria were described previously in the section on calcium. Vitamin D intoxication generally presents with non-specific symptoms that may vary and often include anorexia, weight loss, polyuria, and heart arrhythmias (Jones, 2008). The condition eventually leads to vascular and tissue calcification with subsequent renal and cardiovascular damage.
Although data about vitamin D intoxication are informative, avoiding this relatively acute toxicity is not the intended purpose of a UL. Rather, the UL reflects a long-term level of intake that will not cause harm to the normal, free-living population. The 2007 AHRQ analysis (Cranney et al., 2007; hereafter referred to as AHRQ-Ottawa) concluded that few adverse outcomes could be identified for intakes “above current recommended levels,” but it raised concerns about potential previously unrecognized adverse effects, including an increased risk of pancreatic cancer. The later AHRQ-Tufts analysis further identified all-cause mortality as an emerging concern, but the authors also pointed to the dearth of data.
Unfortunately, as pointed out in the earlier IOM report on DRIs for vitamin D, there continues to be a large uncertainty about the progressive health effects for regular ingestion of even moderately high amounts of vitamin D over several decades (IOM, 1997). Most available evidence is based on short-term exposures (less than 6 months). Generalization to long-term exposures—as would occur during a lifetime—is challenging. Also, most evidence is derived from adult populations with few data specific to children or vulnerable groups. For the purposes of an overview of the literature concerning adverse effects of excess vitamin D, the effects related to vitamin D intoxication (hypervitaminosis D) are discussed first and are based on a paper prepared for the committee by Hector DeLuca (DeLuca, 2009). They can provide a starting point for UL considerations. The emerging concerns about the adverse effects at higher intakes that are less than those associated with the toxicity are discussed next and are
examined in the context of the appropriateness of introducing caution into the specification of ULs for vitamin D.
Vitamin D Intoxication and Related Hypercalcemia
Etiology and Effects of Vitamin D Intoxication
Increased serum 25OHD levels and resulting hypercalcemia are the hallmarks of vitamin D toxicity (Jones, 2008). Although intakes of either vitamin D2 or vitamin D3 can cause toxicity, there is evidence that higher levels of vitamin D2 can be tolerated (Hunt et al., 1972; Stephenson and Peiris, 2009). Similarly, in laboratory animal experiments, vitamin D3 has been reported to be more toxic (Roborgh and de Man, 1960).
The hypercalcemia that occurs from a rise in serum 25OHD level is due to increased bone resorption (Jones, 2008). In the early stages of intoxication, hypercalcemia may be modest and the renal glomerular filtration rate (GFR) remains stable. As bone resorption continues, however, the increasing blood levels of calcium lead to suppression of PTH production. The function and activity of the parathyroid–kidney–bone axis have thus emerged as contributors to the “set point” for toxicity of excess vitamin D and calcium. Decreased renal function simultaneously increases CVD risk and impairs calciuric responses and calcium phosphate homeostasis. Thus, elderly people represent a high-risk group for both extant CVD and impaired parathyroid–kidney–bone interactions that preserve normal calcium–phosphate homeostasis. Eventually, there is a loss of urinary concentrating mechanisms of the kidney tubule as well as a decrease in GFR (Towler, 2009). Hypercalciuria results from the hypercalcemia and the disruption of normal reabsorption processes of the renal tubules (IOM, 1997). As renal function declines (as occurs in disease and, to a lesser extent, with aging), there is additional loss of homeostatic control of serum calcium and phosphorus levels. Failure of the kidney and cardiovascular system is likely the ultimate cause of death in vitamin D intoxication. The prolonged ingestion of excess amounts of vitamin D and the accompanying hypercalcemia can cause metastatic calcification of soft tissues (IOM, 1997). Calcification of vascular tissue has long been known to be associated with vitamin D toxicity (Taussig, 1966; Bajwa et al., 1971; Kamio et al., 1979). Major perturbations in calcium–phosphate homeostasis may increase the risk of CVD, related in part to arterial calcium deposition (Hruska et al., 2009). The hypothesis that excess vitamin D intake may be associated with kidney stone formation is not supported by the available data.
Animal models of vitamin D toxicity reveal symptoms that are almost identical to those described for humans and have provided useful information (Shephard and DeLuca, 1980; Littledike and Horst, 1982a,b;
Tryfonidou et al., 2003; Harmeyer and Schlumbohm, 2004). Rats, in particular, have been used to study vitamin D toxicity. The form of vitamin D that rises exponentially in plasma following overdose is 25OHD, not calcitriol (Vieth, 1990; Jones, 2008; Stephenson and Peiris, 2009). Shephard and DeLuca (1980) administered graded doses of either vitamin D3 or calcitriol to rats for a 2-week period. The results indicated that frank toxicity was achieved at 650 nmol of vitamin D3 per day or 50,000 IU/kg body weight, producing a blood 25OHD level of 1,607 nmol/L, while calcitriol levels were markedly reduced. These results support 25OHD and not calcitriol as the likely toxicant. In fact, in most species, vitamin D intoxication is accompanied by a decrease in plasma calcitriol level (Hughes et al., 1977; Shephard and DeLuca, 1980; Harrington and Page, 1983). Nonetheless, a case has been made that the “free” calcitriol level in the plasma—that is, the metabolite displaced from the plasma transport protein, vitamin D binding protein, by other accumulating metabolites—increases in vitamin D intoxication (Vieth, 2007; Jones, 2008). Overall, however, the accumulating 25OHD appears to be the critical factor in triggering the intoxication.
Serum 25OHD Concentrations as Indicative of Toxicity
In the absence of well-controlled studies, the serum 25OHD level representing the vitamin D toxicity threshold in humans is not readily defined. Similarly, the vitamin D intakes required to trigger toxicity symptoms are not precisely known. Moreover, even though the physiological changes that occur with vitamin D toxicity are correlated to serum 25OHD levels, they may not be precisely aligned (Towler, 2009) and may vary from subject to subject and among sub-populations. Appendix G summarizes a number of human vitamin D toxicity case studies gathered from the scientific literature from early in the 20th century to the present. Some of these reports originated from a time before vitamin D metabolism was discovered and hence lack confirmation that the causative agent was vitamin D overdose. Table 6-3 contains case reports from the past 35 years in which the data are supported by vitamin D dose administered, serum calcium levels, and serum 25OHD levels. Also provided are data from several month-long studies with a range of vitamin D supplements in which fully documented vitamin D intoxication was not identified. It is concluded that occasional reports of hypercalcemia in these studies are not related to vitamin D.
As shown in Table 6-3, the literature contains evidence that a range of vitamin D supplements from 800 to 300,000 IU/day have been used for periods ranging from months to years. Doses below 10,000 IU/day are not usually associated with toxicity, whereas doses equal to or above 50,000 IU/day for several weeks or months are frequently associated with toxic side effects including documented hypercalcemia.
TABLE 6-3 Case Reports of Vitamin D Intoxication: Intake and Plasma Measures
|
Vitamin D Intake (IU/day) |
Duration |
Serum Calcium (mg/dL) |
Serum 25OHD (nmol/L) |
Serum Creatinine (μmol/L) |
Urinary Calcium (mmol/L GFR) |
Reference |
|
Vitamin D supplementation studies without documented hypercalcemia |
||||||
|
800 |
4–6 mo |
NCaa |
60–105b |
— |
— |
Byrne et al., 1995e |
|
1,800 |
3 mo |
NCa |
65, 80c |
— |
— |
Byrne et al., 1995e |
|
1,800 |
3 mo |
NCa |
57–86 |
82.4–3.8 |
— |
Honkanen et al., 1990f |
|
2,000 |
6 mo |
NCa |
— |
— |
— |
Johnson et al., 1980g |
|
10,000 |
4 wk |
— |
105d |
— |
— |
Stamp et al., 1977 |
|
10,000 |
10 wk |
— |
110d |
— |
— |
Davie et al., 1982 |
|
20,000 |
4 wk |
— |
150d |
— |
— |
Stamp et al., 1977 |
|
Vitamin D supplementation studies reporting hypercalcemia |
||||||
|
50,000 |
6 wk |
15.0 |
320 |
388 |
— |
Schwartzman and Franck, 1987 |
|
50,000 |
15 y |
12.5 |
560 |
— |
— |
Davies and Adams, 1978 |
|
100,000 |
10 y |
12.8 |
865 |
215 |
0.508 |
Selby et al., 1995 |
|
200,000 |
2 y |
15.1 |
1,202 |
207 |
— |
Selby et al., 1995 |
|
300,000 |
6 y |
13.2 |
1,692 |
184 |
0.432 |
Rizzoli et al., 1994 |
|
300,000 |
3 wk |
11.3 |
800 |
339 |
0.065 |
Rizzoli et al., 1994 |
|
Accidental vitamin D intoxication |
||||||
|
~ 1,131,840; vitamin D overdose |
— |
15.0 |
1,171 |
265 |
— |
Klontz and Acheson, 2007 |
DeLuca (2009) concluded that, overall, the toxicity of hypercalcemia becomes evident at vitamin D intakes above 25,000 IU/day, corresponding to a serum 25OHD level of about 500 nmol/L. Hathcock et al. (2007), following an analysis of more than 20 publications, concluded that there was no association between harm and intakes of 10,000 IU/day. Although toxic effects associated with 400 IU/day seem implausible,3 the diverse range of intakes and serum 25OHD levels is notable. Most reports suggest that the toxicity threshold is between 10,000 and 40,000 IU of vitamin D per day. Also, most do not identify toxicity until serum 25OHD levels of 500 to 600
nmol/L or higher are reached; frank toxicity has been associated with a serum 25OHD level of 750 nmol/L (Jones, 2008; Deluca, 2009).
There have been no reports of vitamin D intoxication by ultraviolet B light alone (Webb et al., 1989). Davie et al. (1982), using high-performance liquid chromatographic analysis, found that skin irradiation reached a plateau after 5 to 6 weeks of exposure and achieved a plasma 25OHD3 level of no more than 45 nmol/L. In a study of healthy men (n = 26) who had just completed a summer of extended outdoor activity, Barger-Lux and Heaney (2002) found that the median serum 25OHD level was 122 nmol/L in late summer and decreased to 74 nmol/L by late winter. Binkley et al. (2007) found that among subjects (n = 93) with habitually high sun exposure (~ 29 hours/week), the mean serum 25OHD level was 79 nmol/L, with the highest reported level of 155 nmol/L. In a study of subjects (n = 50) who used a tanning bed on a regular basis (at least once a week), serum 25OHD levels were 90 percent higher in tanners than in controls (n = 106) (115.5 ± 8.0 nmol/L vs. 60.3 ± 3.0 nmol/L) (Tangpricha et al., 2004).
Conclusion
Clearly, there are a number of variables that may affect the onset of toxic symptoms in the face of excess vitamin D intake. There has been a paucity of longer-term studies that have investigated the effects of doses over 10,000 IU or the maintenance of serum 25OHD levels above 250 nmol/L. What the data do suggest is that it would be unlikely to observe symptoms of toxicity at daily intakes below 10,000 IU, while it is possible that daily intakes above 10,000 IU could be associated with toxicity. In any case, such short-term findings related to the extreme conditions of toxicity are not the ideal basis for setting ULs for the general population, which apply to long-term (essentially lifetime) exposures. Thus, additional considerations were evaluated, as discussed next.
Excess Vitamin D and Serum Calcium
The 1997 IOM report on DRIs for vitamin D used the effect of vitamin D intake on serum calcium level in humans as the basis for developing ULs for vitamin D (IOM, 1997). The work of Johnson et al. (1980) and most notably that of Narang et al. (1984) were taken into account. In the Narang et al. (1984) study, serum calcium levels in humans (with and without tuberculosis) were measured as a function of daily vitamin D doses of 400, 800, 1,200, 2,400, and 3,800 IU for 3 months. Thirty healthy men and women ranging in age from 21 to 60 years and without tuberculosis were included in the study. Hypercalcemia with vitamin D supplementation was reported in 63 percent of the patients with active tuberculosis, consis-
tent with the known effect of granulomatous diseases on enhancement of 1α-hydroxylase activity. In the 30 subjects reported to be normal, statistically significant increases in serum calcium level were observed with vitamin D doses of 2,400 and 3,800 IU/day; however, only at the dose of 3,800 IU/day did the serum calcium level exceed the upper limits of normal (i.e., 10.5 mg/dL). Moreover, there were only five subjects in the highest dose group, the duration of the effect was not reported, and the heterogeneity within that subgroup was reflected by the large standard error.
Although increased serum calcium levels are of concern, the Narang et al. (1984) study is likely too small to allow any conclusions to be drawn beyond the potential risk of hypercalcemia during vitamin D supplementation in patients with tuberculosis. More recently, Aloia et al. (2008) conducted a 6-month dose–response study using 138 white and African American adults to determine the intake of vitamin D3 needed to achieve a targeted plasma 25OHD level. Doses of vitamin D varied but reached means of 3,915 ± 840 IU/day for blacks and 3,040 ± 1,136 IU/day for whites. No patient presented with a serum calcium level above 265 mmol/L (or 10.6 mg/dL).
Excess Vitamin D and Measures in Infants
Jeans and Stearns (1938) found a retarded linear growth rate in 35 infants up to 45 weeks of age who received daily doses of 1,800 to 4,500 IU of vitamin D as supplements (without regard to sun exposure), for a minimum of 6 months, compared with infants receiving supplemental doses of 340 IU/day or less. Fomon et al. (1966), in a similar study, explored the effects of vitamin D on linear growth in infants (n = 13) ingesting 1,380 to 2,170 IU/day (mean = 1,775 IU/day) of vitamin D from fortified evaporated milk formulas as the only source of vitamin D, compared with infants receiving 350 to 550 IU/day (n = 11) from another batch of formula. No effect was found in infants who were enrolled in the study from the first 9 days after birth up to 6 months of age. Newer data to better elucidate the relationship between vitamin D and retarded linear growth in infants have not emerged in recent years.
Reports in Britain in the 1950s, when foods were being liberally fortified with vitamin D, indicated an unusually large number of cases of “idiopathic hypercalcemia” (British Paediatric Association, 1956). Given the number of foods fortified at the time, the British Paediatric Association (1956) estimated an intake of about 4,000 IU of vitamin D per day for an infant who consumed a typical diet of milk (1.5 pints), cereal (1 ounce), and cod liver oil (1 teaspoon). The outbreak of idiopathic hypercalcemia that took place was attributed to vitamin D supplementation, but the cause cannot be determined with certainty. Survey data apparently reported a
marked decline in hypercalcemia in infants, from 7.2 cases per month in a 1953 to 1955 survey, to 3.0 cases per month in a 1960 to 1961 survey (British Paediatric Association, 1956, 1964). This change occurred at the time new guidelines were introduced for fortification of food products with vitamin D. Data from the British Paediatric Association (1956) and Bransby et al. (1964) also suggested that the estimated total vitamin D intake in infants at the 75th percentile declined from 4,000 IU/day to a range of 724 to 1,343 IU/day between the two surveys.
Other Adverse Effects of Excess Vitamin D: Mortality, Chronic Disease, Falls and Fractures
The committee reviewed the evidence emerging from observational/association studies and a limited number of clinical trials related to vitamin D intake and a diverse set of health outcomes, ranging from breast cancer to falls and fractures. The purpose was not to determine that certain levels of intake definitively cause harm, but rather to decide whether the emerging data were sufficiently compelling to warrant caution relative to vitamin D intakes and associated serum 25OHD concentrations that may be less than those associated with the more widely known acute toxicity but still associated with adverse effects that may occur as a result of chronic intake. The potential adverse effects are considered in alphabetical order.
All-Cause Mortality
All-cause mortality data emerging from the examination of national survey data as well as observational studies suggest adverse effects at serum 25OHD levels much lower than those associated with the toxicity demonstrated by hypervitaminosis D. The AHRQ-Tufts analysis identified four cohort studies (Sambrook et al., 2004, 2006; Visser et al., 2006; Jia et al., 2007; Melamed et al., 2008) that focused on the relationship between serum 25OHD level and all-cause mortality. In general, these studies, as expected, indicated that low serum 25OHD levels akin to deficiency states (< 30 nmol/L) are associated with an increased risk of mortality. Further, as serum 25OHD levels increase—up to a point—mortality is lowered.4 However, some, but not all, of the studies have observed a troubling U-shaped (or perhaps more appropriately a reverse-J-shaped) relationship. For example, Jia et al. (2007) found a statistically significant trend between increasing serum 25OHD levels and lower odds ratios for all-cause
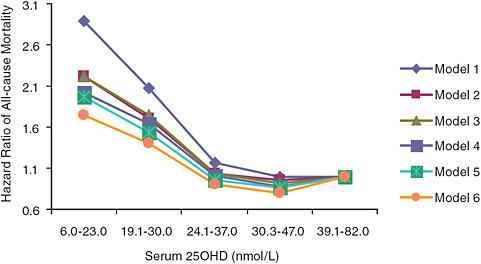
FIGURE 6-1 Hazard ratios of risk of death according to baseline serum 25OHD level (subjects with serum 25OHD levels 39.1–82.0 nmol/L are the referent category).
NOTE: Model 1 is adjusted for age and gender; model 2 is adjusted for model 1 and taking five or more kinds of medicine and self-perceived health status; model 3 is adjusted for model 2 and having heart problem and/or diabetes at baseline; model 4 is adjusted for model 3 and sunlight exposure (i.e., season of blood sampling, sunbathing, and outdoor physical activity); model 5 is adjusted for model 3 and use of a supplement containing vitamin D; model 6 is adjusted for model 3 and variables in models 4 and 5.
SOURCE: Jia et al. (2007).
mortality (p = 0.03); however, a U-shaped or reverse-J-shaped relationship between serum 25OHD level and mortality was observed, with the lowest mortality at serum 25OHD levels below 50 nmol/L (see Figure 6-1). Visser et al. (2006) showed a similar pattern, with reduced mortality associated with higher than deficiency levels, but increased mortality at the highest blood 25OHD levels (see Figure 6-2). Melamed et al. (2008), using data from the Third National Health and Nutrition Examination Survey (NHANES III), also suggested a U-shaped or reverse-J-shaped risk curve with increasing risk at about 75 nmol/L (see Figure 6-3). The similar patterns emerging in these studies are of concern and are suggestive of at least a reverse-J-shaped curve, if not precisely a U-shaped curve for risk relative to serum 25OHD levels and all-cause mortality. Of note, Sambrook et al. (2004, 2006) found no relationship between mortality and the log of serum 25OHD levels in a sample (n = 842) of frail, institutionalized persons, most
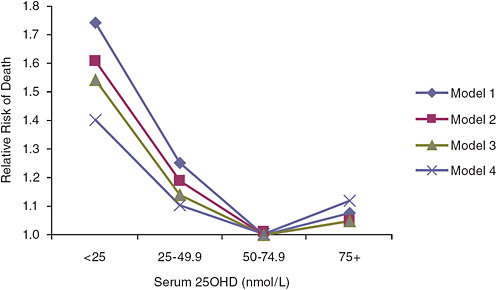
FIGURE 6-2 Risk of death in elderly people according to baseline serum 25OHD level in the Longitudinal Aging Study (subjects with serum 25OHD levels of 50.0–74.9 nmol/L are the referent category).
NOTE: Model 1 is adjusted for gender, age, and education; model 2 is adjusted for model 1 and for chronic disease, serum creatinine concentration, cognitive status, and depressive symptoms; model 3 is adjusted for model 2 and for lifestyle variables including body mass index, smoking status, alcohol consumption, and physical activity; model 4 is adjusted for model 3 and for frailty indicators: mobility performance, low serum albumin concentration, and low serum total cholesterol concentration.
SOURCE: Visser et al. (2006).
over the age of 80 years. Also, the committee identified another cohort study not included in the AHRQ-Tufts report (Semba et al., 2009) that did not observe a U-shaped relationship, but the highest exposure category in this Italian cohort was approximately 64 nmol/L. In addition to these published observational studies, a preliminary analysis of NHANES III data limited to data on non-Hispanic blacks with follow-up as of December 31, 2006, also saw a U-shaped relationship, although the suggested increase in risk was seen at a lower serum 25OHD concentration of approximately 60 nmol/L.5
Turning to evidence from vitamin D supplementation trials, AHRQ-Tufts calculated an overall relative risk (RR) for all-cause mortality of 0.97 (95% CI: 0.92–1.02), with no evidence of between-study heterogeneity. The doses studied included 400 and 880 IU of supplemental vitamin D per day,
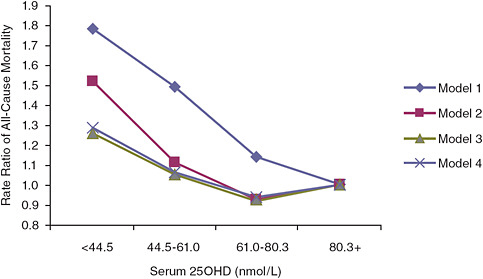
FIGURE 6-3 Rate ratios of all-cause mortality by serum 25OHD level in NHANES III (subjects with serum 25OHD levels above 80.3 nmol/L are the referent category).
NOTE: Model 1 is unadjusted; model 2 is adjusted for age, gender, race, and season; model 3 is adjusted for age, gender, race, season, hypertension, history of prior cardiovascular disease, diabetes, smoking, high-density lipoprotein cholesterol, total cholesterol, use of cholesterol medications, estimated glomerular filtration rate categories, serum albumin, log (albumin-creatinine ratio), log (C-reactive protein), body mass index, physical activity level, vitamin D supplementation, and low socioeconomic status; model 3 is adjusted for age, gender, race, season, cigarette use, body mass index, log (C-reactive protein), serum albumin, physical activity level, vitamin D supplementation, and low socioeconomic status.
SOURCE: Melamed et al. (2008).
and one trial that gave a supplement of 100,000 IU every 3 months, which is roughly equivalent to 1,100/day.
Because the trials did not evaluate particularly high doses and as observational studies are subject to confounding, one cannot interpret conclusively whether or not this U-shaped relationship is real or causal. However, the data are clearly suggestive of a U-shaped or reverse-J-shaped risk curve between serum 25OHD level and all-cause mortality; increases in risk are suggested at thresholds in the range of 75 to 120 nmol/L for the white population, with lower levels for the black population.
Cancer
Breast cancer A study from the randomized, double-blind, placebo-controlled WHI trial (Chlebowski et al., 2008) indicated overall that daily
supplementation with 1,000 mg of elemental calcium combined with 400 IU of vitamin D3 had no effect on breast cancer incidence. However, through a stratified analysis, the data demonstrated an increased risk of breast cancer for women who were already consuming 600 IU of vitamin D per day at baseline, to which a supplement of 400 IU/day was added (Pinteraction = 0.003). Serum 25OHD measures were analyzed by quintile and the highest quintile was 67.6 nmol/L and above.
Pancreatic cancer Some, but not all, observational studies suggest that higher serum 25OHD levels are associated with an increased risk of pancreatic cancer. Beginning with negative studies, Skinner et al. (2006) examined two large cohort populations—the HPFS and the NHS—for associations between pancreatic cancer incidence and vitamin D intake from diet and supplements. Another study of the HPFS cohort examined associations between serum 25OHD level and total cancer mortality or digestive (including pancreatic) cancer incidence (Giovannucci et al., 2006b). Both studies found reduced risk for pancreatic cancer incidence: in one instance associated with higher vitamin D intake (≥ 600 IU/day) (Skinner et al., 2006) and in the other based on a predicted serum 25OHD level (as described by the authors) for which RR was calculated for incremental increases in serum 25OHD level of 25 nmol/L (Giovannucci et al., 2006b).
In contrast, an initial study from Stolzenberg-Solomon et al. (2006), using a nested case–control protocol to evaluate associations between vitamin D nutriture and incidence of pancreatic cancer in subjects from the ATBC Study, found a positive association between higher serum 25OHD levels (highest quintile at 83.2 nmol/L) and risk for pancreatic cancer. In a subsequent nested case–control analysis of a cohort from the Prostate, Lung, Colorectal, and Ovarian (PLCO) Cancer Screening Trial, the same investigators found no association between higher serum 25OHD level and increased pancreatic cancer risk as an outcome (Stolzenberg-Solomon, 2009). The difference between the study populations included living at a northern latitude, positive smoking history, and gender (male) in the ATBC Study compared with a mixed gender U.S. population that was controlled for smoking history in the PLCO Cancer Screening Trial.
To address the dissimilarity in results from individual large cohort studies, Stolzenberg-Solomon et al. (2010) conducted a pooled nested case–control analysis of participants from several cohorts (the ATBC Study, CLUE, the Cancer Prevention Study II Nutrition Cohort, the New York University Women’s Health Study, the PLCO Cancer Screening Trial, and the Shanghai Women’s and Men’s Health Studies) to determine associations between serum 25OHD levels pre-diagnosis and risk for incident pancreatic cancer. This large-scale pooled analysis (n = 2,285) found a statistically significant two-fold increased risk for pancreatic cancer in participants with
serum 25OHD levels at or above 100 nmol/L compared with those with levels between 50 to 75 nmol. Further, the association was strongest for whites, participants in northern latitudes (> 35°N), and participants whose blood was collected in summer months. Thus, a pooled analysis of large cohort studies suggests an association for increased risk of pancreatic cancer with serum 25OHD levels greater than 100 nmol/L that is not consistently seen in analyses of individual large cohorts.
Prostate cancer Regarding prostate cancer, Tuohimaa et al. (2004) found a higher risk of prostate cancer for those with serum 25OHD levels above 80 nmol/L. The subjects were 67 men, mostly from Norway. Although another study from Finland (Tuohimaa et al., 2004) also found an association between serum 25OHD levels and prostate cancer at levels above 80 nmol/L, a study conducted by Faupel-Badger et al. (2007) also in Finland did not find a relationship.
Cardiovascular Risk
Although Linden (1974) observed that myocardial infarct patients in Norway were more likely than matched controls to have consumed vitamin D in excess (greater than 1,200 IU/day), two later studies (Schmidt-Gayk et al., 1977; Vik et al., 1979) failed to confirm these results. Melamed et al. (2008) examined data from 3,439 persons in the NHANES 2001 to 2004 surveys to determine the relationship between serum 25OHD level and peripheral arterial disease (defined as an ankle-brachial index < 0.9). The researchers noted that there was a lower risk of CVD mortality in men and women at levels of 75 to 122 nmol/L, but a higher risk of CVD mortality in women at levels above 125 nmol/L. Recently, Ginde et al. (2009), in a prospective cohort analysis of NHANES III data (1988 to 1994) on serum 25OHD levels in adults ages 65 years and older (n = 3,408) over a median 7.3-year follow-up, examined CVD mortality. Analysis of fully adjusted data indicated an inverse relationship between CVD mortality and baseline serum 25OHD level of 50.0 to 74.9 nmol/L. Risk began to increase at approximately 75 nmol/L and then it declined after 100 nmol/L.
Analyses from the Framingham Offspring Study (Wang et al., 2008), which followed 1,739 participants (mean age 59 years) with an average follow-up at 5.4 years, found a significant relationship between low serum 25OHD levels and incident cardiovascular risk. During a mean follow-up of 5.4 years, 120 individuals developed a first cardiovascular event; vitamin D deficiency as defined in the study (serum 25OHD level < 37.5 nmol/L) was associated with increased risk for cardiovascular events. However, a closer look at the individuals with the highest serum 25OHD levels suggests that there was no additional reduction in risk with 25OHD levels above 75 nmol/L and even that the dose–response relationship may be U-shaped or
reverse-J-shaped, with increased risk not only at low but also at the higher levels of serum 25OHD (i.e., > 75 nmol/L).
Fiscella and Franks (2010) conducted a retrospective cohort analysis also based on NHANES III data. They examined serum 25OHD levels and CVD mortality in participants ages 18 years and older (n = 15,363). Analysis of fully adjusted data showed a U-shaped risk profile for CVD mortality, as reported by others. Without consideration of vitamin D status, after adjusting for age, gender, season, and region, non-Hispanic blacks had a 38 percent higher cardiovascular mortality than whites. Adjusting for low serum 25OHD levels reduced the racial difference in risk by about 60 percent (to 23 percent). Including both low serum 25OHD level and poverty level reduced the racial difference in risk to 1.0, suggesting that low serum 25OHD level and poverty capture much of the racial disparity in cardiovascular mortality in blacks compared with whites; however, it must be recognized that the low serum 25OHD level may be a marker for other factors (obesity, inactivity, etc.). Additionally, a cross-sectional study conducted by Freedman et al. (2010) reported a positive association between serum 25OHD level and calcified atherosclerotic plaque in the aorta and carotid arteries of African Americans.
Falls and Fractures
In a recent trial of 2,256 community-dwelling women 70 years of age and older residing in Australia and presenting with high risk of fracture, the women were treated with 500,000 IU of vitamin D annually for 3 to 5 years (Sanders et al., 2010). Sanders et al. (2010) reported that “… participants receiving annual high-dose oral cholecalciferol experienced 15% more falls and 26% more fractures than the placebo group. Women not only experienced excess fractures after more frequent falls but also experienced more fractures that were not associated with a fall. A post hoc analysis found that the increased likelihood of falls in the vitamin D group was exacerbated in the 3-month period immediately following the annual dose and a similar temporal trend was observed for fractures. An increased risk (albeit, not significant because of smaller numbers) of falls and fracture in the vitamin D group was apparent for each year of the intervention. The results were similar after adjustment for baseline calcium intake.…”
The non-physiological nature of a large one-time dose cannot be readily extrapolated to the situation in which smaller daily doses are provided. However, in view of a number of studies in the literature (e.g., Trivedi et al., 2003) in which large bolus doses have been given without apparent adverse effect, the results of the study by Sanders et al. (2010) are unexpected, but not readily dismissed. The study is notable because the adverse effect was demonstrated as a result of the intervention (which was primarily
for safety) as well as through a measure of interest, serum 25OHD concentration. The median serum 25OHD concentration 1 month after dose for study participants was 120 nmol/L. By 3 months, the median value was approximately 90 nmol/L. One other study (Smith et al., 2007) also reported an increase in fracture associated with vitamin D treatment. Participants were 75 years of age or older (4,354 men and 5,086 women) and received an annual injection of 300,000 IU as ergocalciferol or placebo. In men, treatment had no effect on fractures. However, women treated with vitamin D had increased risk of fractures classified as non-vertebral (HR = 1.21), hip/femur (HR = 1.80), and hip/femur/wrist/forearm (HR = 1.59). No effect on falls was observed; however, falls were a secondary outcome and ascertainment was based on 6-month recall. Baseline serum 25OHD levels and changes in serum 25OHD levels were very similar to the results from Sanders et al. (2010). Another common feature was that calcium supplements were not given.
A recent study reported by Cauley et al. (2009) indicated that in contrast to white and American Indian women, black women and possibly Asian women appeared to be at greater risk of fracture with higher serum 25OHD levels (≥ 75 nmol/L).
Conclusion
Despite the limitations of the evidence, there is a notable congruence across different health indicators—all-cause mortality, some cancers, CVD risk, fractures and falls—for adverse outcomes associated with serum 25OHD levels ranging from about 75 to 120 nmol/L. The U-shaped curve, or possibly a reverse-J-shaped curve, for risk does indeed emerge, with adverse effects reported at either end of the serum 25OHD concentration span. Data for associated intakes of vitamin D are limited.
The committee’s approach was to consider whether it was reasonable to use these findings as a basis for adjusting data on the toxicity of vitamin D, discussed above. In doing so, it was aware of recent criticisms related to taking into account these so-called U-shaped serum 25OHD response curves for elucidating levels of vitamin D that may cause adverse effects (e.g., Grant, 2010). However, although these data may be characterized as emerging and in need of further study before firm conclusions can be made, they are not reflective of flawed studies nor are they readily dismissed by other literature. Further, in the absence of data to demonstrate benefit at such serum 25OHD levels, a cautious approach is justified and appropriate given the purpose of the UL. In the committee’s view, these emerging relationships do not have to be definitively proven in order to justify a cautious approach that is most likely to ensure safety, and in the absence of data to demonstrate benefit from the higher intake level or higher
serum 25OHD levels, these signals can be taken into account. Focusing exclusively on vitamin D acute toxicity for the purposes of establishing a UL and ignoring the emerging data related to other adverse events is not in the best interests of public health.
Selection of Indicator for the UL: Vitamin D
The best available data set for establishing a UL for vitamin D is associated with the onset of hypercalcemia and related toxicity. This indicator is selected as the basis for the UL for all age groups except infants, with the caveat that while it serves as a starting point, it is to be subject to adjustment for uncertainty. The adjustment is based on: (1) the recognition of the goal of public health protection, which suggests that avoiding hypervitaminosis D is, of course, desirable, but not necessarily sufficient; and (2) the emerging data concerning other adverse effects at intakes lower than those associated with acute toxicity and at serum 25OHD levels previously considered to be at the high end of physiological values. Taken as a whole, the body of evidence suggests that there is reason to proceed cautiously in assuming that higher levels of vitamin D intake below those expected to cause hypervitaminosis D are harmless, especially in the absence of data to demonstrate benefit at such intake levels. For infants, the long-standing measures related to retarded linear growth serve as the indicator for the UL.
The available data could not offer a BI or be used to estimate a dose–response relationship. The basis for the ULs is a NOAEL as described further below for specific life stage groups.
VITAMIN D UPPER LEVELS: INTAKE-RESPONSE ASSESSMENT AND SPECIFICATION OF UPPER LEVELS
The ULs established for vitamin D are shown in Table 6-4 by life stage group. The ULs for infants are discussed first. This is followed by a discussion of ULs for adults rather than children and adolescents because the UL for adults is used to extrapolate or scale a UL value for children and adolescents. A discussion of ULs during pregnancy and lactation follows.
ULs for Infants 0 to 12 Months of Age
TABLE 6-4 Vitamin D Tolerable Upper Intake Levels (UL) by Life Stage
The work of Fomon et al. (1966) forms the starting point for these life stage group, as it did in the 1997 IOM report (IOM, 1997). Given the small sample size used in the study, the NOAEL for infants is based on the mean intake in this study rather than the high end of the range. The NOAEL was rounded to 1,800 IU/day from 1,775 IU/day. The British Paediatric Association (1956) data and data reported by Bransby et al. (1964) suggested that hypercalcemia could be present at intakes of 4,000 IU/day, but appeared to decline at intakes between 700 and 1,300 IU/day, lending some support to the NOAEL of 1,800 IU/day as reasonable. However, considerable uncertainty surrounds this estimate, and newer data have not
emerged regarding vitamin D intake and hypercalcemia in infants. Stearns (1968) commented that Fomon et al. (1966) did not study the infants long enough, because the greatest differences in the Jeans and Stearns (1938) study appeared after 6 months. Also, a report from 1959 (Graham, 1959) suggested that a serum calcium level obtained from a study in Glasgow of infants with hypercalcemia ages 3 weeks to 11 months was associated with an estimated vitamin D intake of 1,320 IU/day. Overall, on balance, 1,800 IU/day is reasonable as a NOAEL and offers an appropriate starting point.
Infants 0 to 6 Months of Age
The first order of importance is to protect young infants, and the intake of 1,800 IU/day may not be entirely protective of such young infants. As the UL can reasonably be considered to affect all non-growth retarded infants at greater than 37 weeks gestational age at birth, and given the current practice to begin vitamin D supplementation within days of birth (Wagner and Greer, 2008), it is necessary to ensure an absence of toxicity in infants as small as 2,500 to 3,000 grams who would meet this definition. As such, applying an uncertainty factor of 0.5 and rounding would reasonably give a level of 1,000 IU/day, which is also about 400 IU/kg body weight per day, a dose that can reasonably be considered an upper safety level on a body weight basis. This UL is the same as the UL established in 1997 (IOM, 1997).
Infants 6 to 12 Months of Age
Consistent with general principles of toxicology, the committee considered that an infant’s capacity to handle excess substances such as vitamin D is likely increased with increased body size, organ maturation, and growth needs. Therefore, for older infants it is reasonable to consider a higher UL than for younger infants, although available data are inadequate for quantitative risk assessment. Also, the endpoint is acknowledged to be relatively insensitive. The UL for infants 6 to 12 months of age is increased by 500 IU/day from that established for infants 0 to 6 months of age, to a value of 1,500 IU/day. This reflects a more cautious approach than would be taken if the UL were doubled and is consistent with public health protection. This UL is slightly greater than the UL for vitamin D established for this life stage group in 1997, but is consistent with the toxicological principles that older infants are likely to have greater tolerances than younger infants (IOM, 1997).
ULs for Adults 19 or More Years of Age
|
||||
The indicator of hypercalcemia for vitamin D toxicity is the starting point for the UL for adults. This condition is at an extreme end of an adverse outcome continuum and it may be appropriate to consider instead as a starting point for other measures, such as hypercalciuria. However, interpretation of measures such as hypercalciuria as a predictor of adverse outcomes is unclear. Therefore, the best available option as an indicator is hypercalcemia. In this case, an intake value of 10,000 IU/day reflects a NOAEL. This NOAEL is initially adjusted for uncertainty to establish a UL of 4,000 IU/day, as described below.
Initially, it should be noted that evidence pertaining to the levels of 25OHD in serum that are associated with adverse effects is less well established than that associated with benefit, and the available literature suggests considerable variability. As shown above in Table 6-3, frank toxicity has been reported to have occurred within a wide range of serum 25OHD levels, from as low as 60 nmol/L (Byrne et al., 1995) to values above 1,500 nmol/L (Rizzoli et al., 1994; Pettifor et al., 1995; Vieth et al., 2002), although the majority of available reports of toxicity involve serum 25OHD values above 350 nmol/L. The variability in the toxicity data may mean that toxicity can be affected by numerous mitigating factors or perhaps may be a function of the diversity in the nature of the available case reports. Reports on maximal sun exposure also described previously (Barger-Lux and Heaney, 2002; Binkley et al., 2007) suggest that serum 25OHD levels under these circumstances generally remain below 125 to 150 nmol/L, although the populations studied are not diverse and generally include younger men. The emerging data related to all-cause mortality, chronic disease risk, and falls would appear to suggest that adverse events may occur with serum 25OHD levels of approximately 75 nmol/L or above (Visser et al., 2006; Ginde et al., 2009), but ranging up to approximately 125 nmol/L (Melamed et al., 2008). The vagaries of serum 25OHD measures in general, the sparse data available, and the uncertainty as to the nature of the adverse effects preclude strong conclusions. On the basis of available reports, the committee considered that serum 25OHD levels above approximately 125 to 150 nmol/L should be avoided. Given the conclusion derived in Chapter 5 that bone health benefit is achieved by 97.5 percent
of the population at 50 nmol/L, there is a range of serum 25OHD levels between 50 and 150 nmol/L that remains undescribed. The adjustment to the starting point of 10,000 IU/day reflects first data concerning adverse effects related to all-cause mortality, falls and fractures, and CVD risk, which, taken as a total body of evidence, provide reason for caution, as described earlier. More specifically, the evidence from the studies that focused on all-cause mortality, chronic disease, falls and fractures suggested that serum 25OHD levels between 75 nmol/L and approximately 120 nmol/L were associated with the adverse effect. There is considerable uncertainty surrounding such values, and—using information on the serum levels achieved during maximal sun exposure and to avoid being unnecessarily restrictive given the uncertainties—the committee determined that for the purposes of the UL, concern would be for levels above approximately 125 to 150 nmol/L.
Further, there are emerging data concerning the possible differences in adverse event response for African Americans and perhaps other dark-skinned population groups. The cross–sectional study from Freedman et al. (2010) reported a positive association between serum 25OHD levels and calcified atherosclerotic plaque in the aorta and carotid arteries of African Americans, and preliminary reports from NHANES suggest that the risk for all-cause mortality among non-Hispanic blacks compared with whites occurs at a lower serum 25OHD level (60 vs. 75 nmol/L).6 These data are limited, are not necessarily consistent with other findings, and may eventually be explained by factors other than serum 25OHD levels, but they are concerning. Although data on race and ethnic differences are much too sparse to justify providing different ULs for different racial or ethnic groups, they can be incorporated as a source of uncertainty.
To determine an adjustment from the starting point of 10,000 IU/day as a NOAEL taking into account the uncertainties introduced by reports concerning all-cause mortality and other chronic disease outcomes as well as the possibility that blacks in the North American population may experience adverse effects at lower serum 25OHD concentrations than whites, the committee considered the work of Heaney et al. (2003). As suggested by the study, vitamin D intakes of 5,000 IU/day achieved serum 25OHD levels that range between 100 and 150 nmol/L, but do not surpass 150 nmol/L after 160 days of administration. Almost no other studies have assessed the safety of long-term maintenance of serum 25OHD levels in this range in relation to chronic disease risk and all-cause mortality, so the information about the increases in serum levels is useful for the purposes of establishing a UL. Given the uncertainties surrounding the data and the reliance on a
single report, the UL is set 20 percent below the level identified by Heaney et al. (i.e., 5,000 IU), specifically at 4,000 IU/day.
This value is greater than that set in 1997 by the previous IOM committee. A UL of 4,000 IU/day is still, however, a reference value that reflects the interest in providing public health protection, especially when existing data do not support benefit above such intakes. Intake values in the range of 4,000 IU/day would not appear to cause serum 25OHD levels to exceed 125 to 150 nmol/L,7 a concentration which is at the high end of the range of serum levels associated with nadir risk of outcomes such as all-cause mortality.
ULs for Children and Adolescents 1 Through 18 Years of Age
No specific data are available for age groups other than adults and infants. In 1997 it was determined that increased rates of bone formation in toddlers, children, and adolescents suggested that the adult UL is appropriate for these age groups (IOM, 1997). The present committee chose to scale down the adult UL for younger children—to 2,500 IU/day for 1- to 3-year-olds and 3,000 IU/day for 4- to 8-year-olds—so as to be more consistent with concepts of graded tolerances with maturity. Although the simulated dose–response relationship between vitamin D intake and serum 25OHD level described in Chapter 5 is not affected by age, the data available did not include any children younger than 6 years old. There is no quantitative basis for such scaling, but it reflects a cautious and prudent approach given current biological understandings. Children and adolescents between 9 and 18 years of age have ULs that are the same as that for adults. All the UL values for children are slightly higher than the values provided in 1997 (IOM, 1997).
|
7 |
Use of the regression model developed to estimate the vitamin D intakes needed to achieve a specific level of 25OHD in serum is not appropriate for this situation, in that the model was derived using data based on minimal sun exposure and did not anticipate estimations of such high levels of intake. However, the use of the related equations suggests that 4,000 IU/day results in a mean serum 25OHD concentration of 91 nmol/L and an upper level of 105 nmol/L. |
ULs for Pregnancy and Lactation
|
||||
The available data do not indicate a basis for deriving a UL for pregnant and lactating women or adolescents that is different from those for their non-pregnant and non-lactating counterparts.
REFERENCES
Adams, J. S. and G. Lee. 1997. Gains in bone mineral density with resolution of vitamin D intoxication. Annals of Internal Medicine 127(3): 203-6.
Aloia, J. F., M. Patel, R. Dimaano, M. Li-Ng, S. A. Talwar, M. Mikhail, S. Pollack and J. K. Yeh. 2008. Vitamin D intake to attain a desired serum 25-hydroxyvitamin D concentration. American Journal of Clinical Nutrition 87(6): 1952-8.
Ames, S. K., B. M. Gorham and S. A. Abrams. 1999. Effects of high compared with low calcium intake on calcium absorption and incorporation of iron by red blood cells in small children. American Journal of Clinical Nutrition 70(1): 44-8.
Anthoni, S., E. Savilahti, H. Rautelin and K. L. Kolho. 2009. Milk protein IgG and IgA: the association with milk-induced gastrointestinal symptoms in adults. World Journal of Gastroenterology 15(39): 4915-8.
Asmus, H. G., J. Braun, R. Krause, R. Brunkhorst, H. Holzer, W. Schulz, H. H. Neumayer, P. Raggi and J. Bommer. 2005. Two year comparison of sevelamer and calcium carbonate effects on cardiovascular calcification and bone density. Nephrology, Dialysis, Transplantation 20(8): 1653-61.
Bailey, C. S., J. J. Weiner, O. M. Gibby and M. D. Penney. 2008. Excessive calcium ingestion leading to milk-alkali syndrome. Annals of Clinical Biochemistry 45(Pt 5): 527-9.
Bajwa, G. S., L. M. Morrison and B. H. Ershoff. 1971. Induction of aortic and coronary atheroarteriosclerosis in rats fed a hypervitaminosis D, cholesterol-containing diet. Proceedings of the Society for Experimental Biology and Medicine 138(3): 975-82.
Barger-Lux, M. J. and R. P. Heaney. 2002. Effects of above average summer sun exposure on serum 25-hydroxyvitamin D and calcium absorption. Journal of Clinical Endocrinology and Metabolism 87(11): 4952-6.
Baron, J. A., M. Beach, K. Wallace, M. V. Grau, R. S. Sandler, J. S. Mandel, D. Heber and E. R. Greenberg. 2005. Risk of prostate cancer in a randomized clinical trial of calcium supplementation. Cancer Epidemiology, Biomarkers & Prevention 14(3): 586-9.
Binkley, N., R. Novotny, D. Krueger, T. Kawahara, Y. G. Daida, G. Lensmeyer, B. W. Hollis and M. K. Drezner. 2007. Low vitamin D status despite abundant sun exposure. Journal of Clinical Endocrinology and Metabolism 92(6): 2130-5.
Blank, S., K. S. Scanlon, T. H. Sinks, S. Lett and H. Falk. 1995. An outbreak of hypervitaminosis D associated with the overfortification of milk from a home-delivery dairy. American Journal of Public Health 85(5): 656-9.
Block, G. A., D. M. Spiegel, J. Ehrlich, R. Mehta, J. Lindbergh, A. Dreisbach and P. Raggi. 2005. Effects of sevelamer and calcium on coronary artery calcification in patients new to hemodialysis. Kidney International 68(4): 1815-24.
Bolland, M. J., P. A. Barber, R. N. Doughty, B. Mason, A. Horne, R. Ames, G. D. Gamble, A. Grey and I. R. Reid. 2008. Vascular events in healthy older women receiving calcium supplementation: randomised controlled trial. British Medical Journal 336(7638): 262-6.
Bolland, M. J., A. Avenell, J. A. Baron, A. Grey, G. S. MacLennan, G. D. Gamble and I. R. Reid. 2010. Effect of calcium supplements on risk of myocardial infarction and cardiovascular events: meta-analysis. British Medical Journal 341: 3691-9.
Borghi, L., T. Schianchi, T. Meschi, A. Guerra, F. Allegri, U. Maggiore and A. Novarini. 2002. Comparison of two diets for the prevention of recurrent stones in idiopathic hypercalciuria. New England Journal of Medicine 346(2): 77-84.
Brannon, P. M., E. A. Yetley, R. L. Bailey and M. F. Picciano. 2008. Vitamin D and health in the 21st century: an update. Proceedings of a conference held September 2007 in Bethesda, Maryland, USA. American Journal of Clinical Nutrition 88(2): 483S-592S.
Bransby, E. R., W. T. Berry and D. M. Taylor. 1964. Study of the vitamin-D intakes of infants in 1960. British Medical Journal 1(5399): 1661-3.
British Paediatric Association. 1956. Hypercalcaemia in infants and vitamin D. British Medical Journal 2(4985): 149.
British Paediatric Association. 1964. Infantile hypercalcaemia, nutritional rickets, and infantile scurvy in Great Britain. British Medical Journal 1(5399): 1659-61.
Burnett, C. H., R. R. Commons and et al. 1949. Hypercalcemia without hypercalcuria or hypophosphatemia, calcinosis and renal insufficiency; a syndrome following prolonged intake of milk and alkali. New England Journal of Medicine 240(20): 787-94.
Byrne, P. M., R. Freaney and M. J. McKenna. 1995. Vitamin D supplementation in the elderly: review of safety and effectiveness of different regimes. Calcified Tissue International 56(6): 518-20.
Caruso, J. B., R. M. Patel, K. Julka and D. C. Parish. 2007. Health-behavior induced disease: return of the milk-alkali syndrome. Journal of General Internal Medicine 22(7): 1053-5.
Cauley, J., et al. 2009. Serum 25 hydroxyvitamin (OH)D and fracture risk in multi-ethnic women: The Women’s Health Initiative (WHI). Presented at ASBMR 31st Annual Meeting. Denver, CO.
Chan, J. M., P. Pietinen, M. Virtanen, N. Malila, J. Tangrea, D. Albanes and J. Virtamo. 2000. Diet and prostate cancer risk in a cohort of smokers, with a specific focus on calcium and phosphorus (Finland). Cancer Causes and Control 11(9): 859-67.
Chan, J. M., M. J. Stampfer, J. Ma, P. H. Gann, J. M. Gaziano and E. L. Giovannucci. 2001. Dairy products, calcium, and prostate cancer risk in the Physicians’ Health Study. American Journal of Clinical Nutrition 74(4): 549-54.
Chiricone, D., N. G. De Santo and M. Cirillo. 2003. Unusual cases of chronic intoxication by vitamin D. Journal of Nephrology 16(6): 917-21.
Chlebowski, R. T., K. C. Johnson, C. Kooperberg, M. Pettinger, J. Wactawski-Wende, T. Rohan, J. Rossouw, D. Lane, M. J. O’Sullivan, S. Yasmeen, R. A. Hiatt, J. M. Shikany, M. Vitolins, J. Khandekar and F. A. Hubbell. 2008. Calcium plus vitamin D supplementation and the risk of breast cancer. Journal of the National Cancer Institute 100(22): 1581-91.
Chung M., E. M. Balk, M. Brendel, S. Ip, J. Lau, J. Lee, A. Lichtenstein, K. Patel, G. Raman, A. Tatsioni, T. Terasawa and T. A. Trikalinos. 2009. Vitamin D and calcium: a systematic review of health outcomes. Evidence Report No. 183. (Prepared by the Tufts Evidence-based Practice Center under Contract No. HHSA 290-2007-10055-I.) AHRQ Publication No. 09-E015. Rockville, MD: Agency for Healthcare Research and Quality.
Coe, F. L., J. H. Parks and D. R. Webb. 1992. Stone-forming potential of milk or calcium-fortified orange juice in idiopathic hypercalciuric adults. Kidney International 41(1): 139-42.
Coresh, J., D. Byrd-Holt, B. C. Astor, J. P. Briggs, P. W. Eggers, D. A. Lacher and T. H. Hostetter. 2005. Chronic kidney disease awareness, prevalence, and trends among U.S. adults, 1999 to 2000. Journal of the American Society of Nephrology 16(1): 180-8.
Cozzolino, M., D. Brancaccio, M. Gallieni and E. Slatopolsky. 2005. Pathogenesis of vascular calcification in chronic kidney disease. Kidney International 68(2): 429-36.
Cranney A., T. Horsley, S. O’Donnell, H. A. Weiler, L. Puil, D. S. Ooi, S. A. Atkinson, L. M. Ward, D. Moher, D. A. Hanley, M. Fang, F. Yazdi, C. Garritty, M. Sampson, N. Barrowman, A. Tsertsvadze and V. Mamaladze. 2007. Effectiveness and safety of vitamin D in relation to bone health. Evidence Report/Technology Assessment No. 158. (Prepared by the University of Ottawa Evidence-based Practice Center (UO-EPC) under Contract No. 290-02-0021.) AHRQ Publication No. 07-E013. Rockville, MD: Agency for Healthcare Research and Quality.
Curhan, G. C., W. C. Willett, E. B. Rimm and M. J. Stampfer. 1993. A prospective study of dietary calcium and other nutrients and the risk of symptomatic kidney stones. New England Journal of Medicine 328(12): 833-8.
Curhan, G. C., W. C. Willett, F. E. Speizer, D. Speigelman and M. J. Stampfer. 1997. Comparison of dietary calcium with supplemental calcium and other nutrients as factors affecting the risk for kidney stones in women. Annals of Internal Medicine 126(7): 497-504.
Curhan, G. C., W. C. Willett, E. L. Knight and M. J. Stampfer. 2004. Dietary factors and the risk of incident kidney stones in younger women: Nurses’ Health Study II. Archives of Internal Medicine 164(8): 885-91.
Curhan, G. C. 2007. Epidemiology of stone disease. Urologic Clinics of North America 34(3): 287-93.
Dalton, M. A., J. D. Sargent, G. T. O’Connor, E. M. Olmstead and R. Z. Klein. 1997. Calcium and phosphorus supplementation of iron-fortified infant formula: no effect on iron status of healthy full-term infants. American Journal of Clinical Nutrition 65(4): 921-6.
Davie, M. W., D. E. Lawson, C. Emberson, J. L. Barnes, G. E. Roberts and N. D. Barnes. 1982. Vitamin D from skin: contribution to vitamin D status compared with oral vitamin D in normal and anticonvulsant-treated subjects. Clinical Science 63(5): 461-72.
Davies, M. and P. H. Adams. 1978. The continuing risk of vitamin-D intoxication. Lancet 2(8090): 621-3.
Deluca, H. F. 2009. Vitamin D toxicity. Paper prepared for the Committee to Review Dietary Reference Intakes for Vitamin D and Calcium. Washington, DC.
Dourson, M. L. and J. F. Stara. 1983. Regulatory history and experimental support of uncertainty (safety) factors. Regulatory Toxicology and Pharmacology 3(3): 224-38.
Faupel-Badger, J. M., L. Diaw, D. Albanes, J. Virtamo, K. Woodson and J. A. Tangrea. 2007. Lack of association between serum levels of 25-hydroxyvitamin D and the subsequent risk of prostate cancer in Finnish men. Cancer Epidemiology, Biomarkers & Prevention 16(12): 2784-6.
Felsenfeld, A. J. and B. S. Levine. 2006. Milk alkali syndrome and the dynamics of calcium homeostasis. Clinical Journal of the American Society of Nephrology 1(4): 641-54.
Fiscella, K. and P. Franks. 2010. Vitamin D, race, and cardiovascular mortality: findings from a national US sample. Annals of Family Medicine 8(1): 11-8.
Fomon, S. J., M. K. Younoszai and L. N. Thomas. 1966. Influence of vitamin D on linear growth of normal full-term infants. Journal of Nutrition 88(3): 345-50.
Freedman, B. I., L. E. Wagenknecht, K. G. Hairston, D. W. Bowden, J. J. Carr, R. C. Hightower, E. J. Gordon, J. Xu, C. D. Langefeld and J. Divers. 2010. Vitamin D, adiposity, and calcified atherosclerotic plaque in African-Americans. Journal of Clinical Endocrinology and Metabolism 95(3): 1076.
Ginde, A. A., R. Scragg, R. S. Schwartz and C. A. Camargo, Jr. 2009. Prospective study of serum 25-hydroxyvitamin D level, cardiovascular disease mortality, and all-cause mortality in older U.S. adults. Journal of the American Geriatrics Society 57(9): 1595-603.
Giovannucci, E., E. B. Rimm, A. Wolk, A. Ascherio, M. J. Stampfer, G. A. Colditz and W. C. Willett. 1998. Calcium and fructose intake in relation to risk of prostate cancer. Cancer Research 58(3): 442-7.
Giovannucci, E., Y. Liu, M. J. Stampfer and W. C. Willett. 2006a. A prospective study of calcium intake and incident and fatal prostate cancer. Cancer Epidemiology, Biomarkers & Prevention 15(2): 203-10.
Giovannucci, E., Y. Liu and W. C. Willett. 2006b. Cancer incidence and mortality and vitamin D in black and white male health professionals. Cancer Epidemiology, Biomarkers & Prevention 15(12): 2467-72.
Goodman, W. G., J. Goldin, B. D. Kuizon, C. Yoon, B. Gales, D. Sider, Y. Wang, J. Chung, A. Emerick, L. Greaser, R. M. Elashoff and I. B. Salusky. 2000. Coronary-artery calcification in young adults with end-stage renal disease who are undergoing dialysis. New England Journal of Medicine 342(20): 1478-83.
Gordon, M. V., L. P. McMahon and P. S. Hamblin. 2005. Life-threatening milk-alkali syndrome resulting from antacid ingestion during pregnancy. Medical Journal of Australia 182(7): 350-1.
Graham, S. 1959. Idiopathic hypercalcemia. Postgraduate Medicine 25(1): 67-72.
Grant, W. B. 1999. An ecologic study of dietary links to prostate cancer. Alternative Medicine Review 4(3): 162-9.
Grant, W. B. 2010. Critique of the U-shaped serum 25-hydroxyvitamin D level-disease response relation. Dermato-Endocrinology 1(6): 289.
Grubb, M., K. Gaurav and M. Panda. 2009. Milk-alkali syndrome in a middle-aged woman after ingesting large doses of calcium carbonate: a case report. Cases Journal 2: 8198.
Haddad, J. G. 1980. Competitive protein-binding radioassays for 25-OH-D; clinical applications. In Vitamin D, Volume 2, edited by Norman. New York: Marcel Dekker, Inc. Pp. 587.
Hardt, L. L. and A. B. Rivers. 1923. Toxic manifestations following the alkaline treatment of peptic ulcer. Archives of Internal Medicine 31(2): 171-80.
Harmeyer, J. and C. Schlumbohm. 2004. Effects of pharmacological doses of vitamin D3 on mineral balance and profiles of plasma vitamin D3 metabolites in horses. Journal of Steroid Biochemistry and Molecular Biology 89-90(1-5): 595-600.
Harrington, D. D. and E. H. Page. 1983. Acute vitamin D3 toxicosis in horses: case reports and experimental studies of the comparative toxicity of vitamins D2 and D3. Journal of the American Veterinary Medical Association 182(12): 1358-69.
Hathcock, J. N., A. Shao, R. Vieth and R. Heaney. 2007. Risk assessment for vitamin D. American Journal of Clinical Nutrition 85(1): 6-18.
Heaney, R. P., K. M. Davies, T. C. Chen, M. F. Holick and M. J. Barger-Lux. 2003. Human serum 25-hydroxycholecalciferol response to extended oral dosing with cholecalciferol. American Journal of Clinical Nutrition 77(1): 204-10.
Hiatt, R. A., L. G. Dales, G. D. Friedman and E. M. Hunkeler. 1982. Frequency of urolithiasis in a prepaid medical care program. American Journal of Epidemiology 115(2): 255-65.
Honkanen, R., E. Alhava, M. Parviainen, S. Talasniemi and R. Monkkonen. 1990. The necessity and safety of calcium and vitamin D in the elderly. Journal of the American Geriatrics Society 38(8): 862-6.
Hruska, K. A., S. Mathew, R. J. Lund, I. Memon and G. Saab. 2009. The pathogenesis of vascular calcification in the chronic kidney disease mineral bone disorder: the links between bone and the vasculature. Seminars in Nephrology 29(2): 156-65.
Hughes, M. R., D. J. Baylink, W. A. Gonnerman, S. U. Toverud, W. K. Ramp and M. R. Haussler. 1977. Influence of dietary vitamin D3 on the circulating concentration of its active metabolites in the chick and rat. Endocrinology 100(3): 799-806.
Hunt, R. D., F. G. Garcia and R. J. Walsh. 1972. A comparison of the toxicity of ergocalciferol and cholecalciferol in rhesus monkeys (Macaca mulatta). Journal of Nutrition 102(8): 975-86.
Ilich-Ernst, J. Z., A. A. McKenna, N. E. Badenhop, A. C. Clairmont, M. B. Andon, R. W. Nahhas, P. Goel and V. Matkovic. 1998. Iron status, menarche, and calcium supplementation in adolescent girls. American Journal of Clinical Nutrition 68(4): 880-7.
IOM (Institute of Medicine). 1997. Dietary Reference Intakes for Calcium, Phosphorus, Magnesium, Vitamin D, and Fluoride. Washington, DC: National Academy Press.
IOM. 1998. Dietary Reference Intakes: A Risk Assessment Model for Establishing Upper Intake Levels for Nutrients. Washington, DC: National Academy Press.
IOM. 2008. The Development of DRIs 1994-2004: Lessons Learned and New Challenges: Workshop Summary. Washington, DC: The National Academies Press.
Irtiza-Ali, A., S. Waldek, E. Lamerton, A. Pennell and P. A. Kalra. 2008. Milk alkali syndrome associated with excessive ingestion of Rennie: case reports. Journal of Renal Care 34(2): 64-7.
Jackson, R. D., A. Z. LaCroix, M. Gass, R. B. Wallace, J. Robbins, C. E. Lewis, T. Bassford, S. A. Beresford, H. R. Black, P. Blanchette, D. E. Bonds, R. L. Brunner, R. G. Brzyski, B. Caan, J. A. Cauley, R. T. Chlebowski, S. R. Cummings, I. Granek, J. Hays, G. Heiss, S. L. Hendrix, B. V. Howard, J. Hsia, F. A. Hubbell, K. C. Johnson, H. Judd, J. M. Kotchen, L. H. Kuller, R. D. Langer, N. L. Lasser, M. C. Limacher, S. Ludlam, J. E. Manson, K. L. Margolis, J. McGowan, J. K. Ockene, M. J. O’Sullivan, L. Phillips, R. L. Prentice, G. E. Sarto, M. L. Stefanick, L. Van Horn, J. Wactawski-Wende, E. Whitlock, G. L. Anderson, A. R. Assaf and D. Barad. 2006. Calcium plus vitamin D supplementation and the risk of fractures. New England Journal of Medicine 354(7): 669-83.
Javed, R. A., M. A. Rafiq, K. Marrero and J. Vieira. 2007. Milk-alkali syndrome: a reverberation of the past. Singapore Medical Journal 48(4): 359-60.
Jeans, P. C. and G. Stearns. 1938. The effect of vitamin D on linear growth in infancy: II. The effect of intakes above 1,800 U.S.P. units daily. Journal of Pediatrics 13(5): 730-40.
Jia, X., L. S. Aucott and G. McNeill. 2007. Nutritional status and subsequent all-cause mortality in men and women aged 75 years or over living in the community. British Journal of Nutrition 98(3): 593-9.
Johnson, C. M., D. M. Wilson, W. M. O’Fallon, R. S. Malek and L. T. Kurland. 1979. Renal stone epidemiology: a 25-year study in Rochester, Minnesota. Kidney International 16(5): 624-31.
Johnson, K. R., J. Jobber and B. J. Stonawski. 1980. Prophylactic vitamin D in the elderly. Age and Ageing 9(2): 121-7.
Jones, G. 2008. Pharmacokinetics of vitamin D toxicity. American Journal of Clinical Nutrition 88(2): 582S-6S.
Jousten, E. and P. Guffens. 2008. Milk-alkali syndrome caused by ingestion of antacid tablets. Acta Clinica Belgica 63(2): 103-6.
Kaklamanos, M. and P. Perros. 2007. Milk alkali syndrome without the milk. British Medical Journal 335(7616): 397-8.
Kamio, A., T. Taguchi, M. Shiraishi, K. Shitama, K. Fukushima and S. Takebayashi. 1979. Vitamin D sclerosis in rats. Acta Pathologica Japonica 29(4): 545-62.
Klontz, K. C. and D. W. Acheson. 2007. Dietary supplement-induced vitamin D intoxication. New England Journal of Medicine 357(3): 308-9.
Koh, K. A., H. D. Sesso, R. S. Paffenbarger, Jr. and I. M. Lee. 2006. Dairy products, calcium and prostate cancer risk. British Journal of Cancer 95(11): 1582-5.
Kristal, A. R., J. L. Stanford, J. H. Cohen, K. Wicklund and R. E. Patterson. 1999. Vitamin and mineral supplement use is associated with reduced risk of prostate cancer. Cancer Epidemiology, Biomarkers & Prevention 8(10): 887-92.
Kurahashi, N., M. Inoue, M. Iwasaki, S. Sasazuki and A. S. Tsugane. 2008. Dairy product, saturated fatty acid, and calcium intake and prostate cancer in a prospective cohort of Japanese men. Cancer Epidemiology, Biomarkers and Prevention 17(4): 930-7.
Levine, B. S., J. S. Rodman, S. Wienerman, R. S. Bockman, J. M. Lane and D. S. Chapman. 1994. Effect of calcium citrate supplementation on urinary calcium oxalate saturation in female stone formers: implications for prevention of osteoporosis. American Journal of Clinical Nutrition 60(4): 592-6.
Linden, V. 1974. Vitamin D and myocardial infarction. British Medical Journal 3(5932): 647-50.
Littledike, E. T. and R. L. Horst. 1982a. Vitamin D3 toxicity in dairy cows. Journal of Dairy Science 65(5): 749-59.
Littledike, E. T. and R. L. Horst. 1982b. Metabolism of vitamin D3 in nephrectomized pigs given pharmacological amounts of vitamin D3. Endocrinology 111(6): 2008-13.
Markowitz, M. E., M. Sinnett and J. F. Rosen. 2004. A randomized trial of calcium supplementation for childhood lead poisoning. Pediatrics 113(1 Pt 1): e34-9.
McKenna, A. A., J. Z. Ilich, M. B. Andon, C. Wang and V. Matkovic. 1997. Zinc balance in adolescent females consuming a low- or high-calcium diet. American Journal of Clinical Nutrition 65(5): 1460-4.
Medarov, B. I. 2009. Milk-alkali syndrome. Mayo Clinic Proceedings 84(3): 261-7.
Melamed, M. L., E. D. Michos, W. Post and B. Astor. 2008. 25-hydroxyvitamin D levels and the risk of mortality in the general population. Archives of Internal Medicine 168(15): 1629-37.
Mitrou, P. N., D. Albanes, S. J. Weinstein, P. Pietinen, P. R. Taylor, J. Virtamo and M. F. Leitzmann. 2007. A prospective study of dietary calcium, dairy products and prostate cancer risk (Finland). International Journal of Cancer 120(11): 2466-73.
Moe, S. M. 2008. Disorders involving calcium, phosphorus, and magnesium. Primary Care; Clinics in Office Practice 35(2): 215-37, v-vi.
Mourad, B., N. Fadwa, T. Mounir, E. Abdelhamid, N. Mohamed Fadhel and S. Rachid. 2006. Influence of hypercalcic and/or hyperoxalic diet on calcium oxalate renal stone formation in rats. Scandinavian Journal of Urology and Nephrology 40(3): 187-91.
Nabhan, F. A., G. W. Sizemore and P. M. Camacho. 2004. Milk-alkali syndrome from ingestion of calcium carbonate in a patient with hypoparathyroidism. Endocrine Practice 10(4): 372-5.
Narang, N. K., R. C. Gupta and M. K. Jain. 1984. Role of vitamin D in pulmonary tuberculosis. Journal of the Association of Physicians of India 32(2): 185-8.
Pak, C. Y. and K. Holt. 1976. Nucleation and growth of brushite and calcium oxalate in urine of stone-formers. Metabolism 25(6): 665-73.
Park, S. Y., S. P. Murphy, L. R. Wilkens, A. M. Nomura, B. E. Henderson and L. N. Kolonel. 2007a. Calcium and vitamin D intake and risk of colorectal cancer: the Multiethnic Cohort Study. American Journal of Epidemiology 165(7): 784-93.
Park, S. Y., S. P. Murphy, L. R. Wilkens, D. O. Stram, B. E. Henderson and L. N. Kolonel. 2007b. Calcium, vitamin D, and dairy product intake and prostate cancer risk: the Multiethnic Cohort Study. American Journal of Epidemiology 166(11): 1259-69.
Patel, A. M. and S. Goldfarb. 2010. Got calcium? Welcome to the calcium-alkali syndrome. Journal of the American Society of Nephrology 21(9): 1440-3.
Peterson, C. A., D. H. Baker and J. W. Erdman, Jr. 1996. Diet-induced nephrocalcinosis in female rats is irreversible and is induced primarily before the completion of adolescence. Journal of Nutrition 126(1): 259-65.
Pettifor, J. M., D. D. Bikle, M. Cavaleros, D. Zachen, M. C. Kamdar and F. P. Ross. 1995. Serum levels of free 1,25-dihydroxyvitamin D in vitamin D toxicity. Annals of Internal Medicine 122(7): 511-3.
Picolos, M. K., V. R. Lavis and P. R. Orlander. 2005. Milk-alkali syndrome is a major cause of hypercalcaemia among non-end-stage renal disease (non-ESRD) inpatients. Clinical Endocrinology 63(5): 566-76.
Prince, R. L., A. Devine, S. S. Dhaliwal and I. M. Dick. 2006. Effects of calcium supplementation on clinical fracture and bone structure: results of a 5-year, double-blind, placebo-controlled trial in elderly women. Archives of Internal Medicine 166(8): 869-75.
Raggi, P., G. James, S. K. Burke, J. Bommer, S. Chasan-Taber, H. Holzer, J. Braun and G. M. Chertow. 2005. Decrease in thoracic vertebral bone attenuation with calcium-based phosphate binders in hemodialysis. Journal of Bone and Mineral Research 20(5): 764-72.
Raimondi, S., J. B. Mabrouk, B. Shatenstein, P. Maisonneuve and P. Ghadirian. 2010. Diet and prostate cancer risk with specific focus on dairy products and dietary calcium: a case–control study. Prostate 70(10):1054-65.
Reid, I. R. and M. J. Bolland. 2008. Calcium supplementation and vascular disease. Climacteric 11(4): 280-6.
Reynolds, J. L., A. J. Joannides, J. N. Skepper, R. McNair, L. J. Schurgers, D. Proudfoot, W. Jahnen-Dechent, P. L. Weissberg and C. M. Shanahan. 2004. Human vascular smooth muscle cells undergo vesicle-mediated calcification in response to changes in extracellular calcium and phosphate concentrations: a potential mechanism for accelerated vascular calcification in ESRD. Journal of the American Society of Nephrology 15(11): 2857-67.
Riggs, B. L., W. M. O’Fallon, J. Muhs, M. K. O’Connor, R. Kumar and L. J. Melton, 3rd. 1998. Long-term effects of calcium supplementation on serum parathyroid hormone level, bone turnover, and bone loss in elderly women. Journal of Bone and Mineral Research 13(2): 168-74.
Rizzoli, R., C. Stoermann, P. Ammann and J. P. Bonjour. 1994. Hypercalcemia and hyperosteolysis in vitamin D intoxication: effects of clodronate therapy. Bone 15(2): 193-8.
Roborgh, J. R. and T. de Man. 1960. The hypercalcemic activity of dihydrotachysterol-2 and dihydrotachysterol-3 and of the vitamins D2 and D3 after intravenous injection of the aqueous preparations. 2. Comparative experiments on rats. Biochemical Pharmacology 3: 277-82.
Rodriguez, C., M. L. McCullough, A. M. Mondul, E. J. Jacobs, D. Fakhrabadi-Shokoohi, E. L. Giovannucci, M. J. Thun and E. E. Calle. 2003. Calcium, dairy products, and risk of prostate cancer in a prospective cohort of United States men. Cancer Epidemiology, Biomarkers & Prevention 12(7): 597-603.
Rohrmann, S., E. A. Platz, C. J. Kavanaugh, L. Thuita, S. C. Hoffman and K. J. Helzlsouer. 2007. Meat and dairy consumption and subsequent risk of prostate cancer in a US cohort study. Cancer Causes and Control 18(1): 41-50.
Sambrook, P. N., J. S. Chen, L. M. March, I. D. Cameron, R. G. Cumming, S. R. Lord, J. Schwarz and M. J. Seibel. 2004. Serum parathyroid hormone is associated with increased mortality independent of 25-hydroxy vitamin d status, bone mass, and renal function in the frail and very old: a cohort study. Journal of Clinical Endocrinology and Metabolism 89(11): 5477-81.
Sambrook, P. N., C. J. Chen, L. March, I. D. Cameron, R. G. Cumming, S. R. Lord, J. M. Simpson and M. J. Seibel. 2006. High bone turnover is an independent predictor of mortality in the frail elderly. Journal of Bone and Mineral Research 21(4): 549-55.
Sanders, K. M., A. L. Stuart, E. J. Williamson, J. A. Simpson, M. A. Kotowicz, D. Young and G. C. Nicholson. 2010. Annual high-dose oral vitamin D and falls and fractures in older women: a randomized controlled trial. Journal of the American Medical Association 303(18): 1815-22.
Sargent, J. D., M. A. Dalton, G. T. O’Connor, E. M. Olmstead and R. Z. Klein. 1999. Randomized trial of calcium glycerophosphate-supplemented infant formula to prevent lead absorption. American Journal of Clinical Nutrition 69(6): 1224-30.
Schmidt-Gayk, H., J. Goossen, F. Lendle and D. Seidel. 1977. Serum 25-hydroxycalciferol in myocardial infarction. Atherosclerosis 26(1): 55-8.
Schuurman, A. G., P. A. van den Brandt, E. Dorant and R. A. Goldbohm. 1999. Animal products, calcium and protein and prostate cancer risk in The Netherlands Cohort Study. British Journal of Cancer 80(7): 1107-13.
Schwartzman, M. S. and W. A. Franck. 1987. Vitamin D toxicity complicating the treatment of senile, postmenopausal, and glucocorticoid-induced osteoporosis. Four case reports and a critical commentary on the use of vitamin D in these disorders. American Journal of Medicine 82(2): 224-30.
Selby, P. L., M. Davies, J. S. Marks and E. B. Mawer. 1995. Vitamin D intoxication causes hypercalcaemia by increased bone resorption which responds to pamidronate. Clinical Endocrinology 43(5): 531-6.
Semba, R. D., D. K. Houston, L. Ferrucci, A. R. Cappola, K. Sun, J. M. Guralnik and L. P. Fried. 2009. Low serum 25-hydroxyvitamin D concentrations are associated with greater all-cause mortality in older community-dwelling women. Nutrition Research 29(8): 525-30.
Shah, B. K., S. Gowda, H. Prabhu, J. Vieira and H. C. Mahaseth. 2007. Modern milk alkali syndrome—a preventable serious condition. New Zealand Medical Journal 120(1262): U2734.
Shephard, R. M. and H. F. Deluca. 1980. Plasma concentrations of vitamin D3 and its metabolites in the rat as influenced by vitamin D3 or 25-hydroxyvitamin D3 intakes. Archives of Biochemistry and Biophysics 202(1): 43-53.
Skinner, H. G., D. S. Michaud, E. Giovannucci, W. C. Willett, G. A. Colditz and C. S. Fuchs. 2006. Vitamin D intake and the risk for pancreatic cancer in two cohort studies. Cancer Epidemiology, Biomarkers & Prevention 15(9): 1688-95.
Smith, H., F. Anderson, H. Raphael, P. Maslin, S. Crozier and C. Cooper. 2007. Effect of annual intramuscular vitamin D on fracture risk in elderly men and women—a population-based, randomized, double-blind, placebo-controlled trial. Rheumatology 46(12): 1852-7.
Stamatelou, K. K., M. E. Francis, C. A. Jones, L. M. Nyberg and G. C. Curhan. 2003. Time trends in reported prevalence of kidney stones in the United States: 1976-1994. Kidney International 63(5): 1817-23.
Stamp, T. C., J. G. Haddad and C. A. Twigg. 1977. Comparison of oral 25-hydroxycholecalciferol, vitamin D, and ultraviolet light as determinants of circulating 25-hydroxyvitamin D. Lancet 1(8026): 1341-3.
Stearns, G. 1968. Fifty years of experience in nutrition and a look to the future: III. Early studies of vitamin D requirement during growth. American Journal of Public Health and the Nations Health 58(11): 2027-35.
Stephenson, D. W. and A. N. Peiris. 2009. The lack of vitamin D toxicity with megadose of daily ergocalciferol (D2) therapy: a case report and literature review. Southern Medical Journal 102(7): 765-8.
Stolzenberg-Solomon, R. Z., R. Vieth, A. Azad, P. Pietinen, P. R. Taylor, J. Virtamo and D. Albanes. 2006. A prospective nested case–control study of vitamin D status and pancreatic cancer risk in male smokers. Cancer Research 66(20): 10213-9.
Stolzenberg-Solomon, R. Z. 2009. Vitamin D and pancreatic cancer. Annals of Epidemiology 19(2): 89-95.
Stolzenberg-Solomon, R. Z., E. J. Jacobs, A. A. Arslan, D. Qi, A. V. Patel, K. J. Helzlsouer, S. J. Weinstein, M. L. McCullough, M. P. Purdue, X. O. Shu, K. Snyder, J. Virtamo, L. R. Wilkins, K. Yu, A. Zeleniuch-Jacquotte, W. Zheng, D. Albanes, Q. Cai, C. Harvey, R. Hayes, S. Clipp, R. L. Horst, L. Irish, K. Koenig, L. Le Marchand and L. N. Kolonel. 2010. Circulating 25-hydroxyvitamin D and risk of pancreatic cancer: Cohort Consortium Vitamin D Pooling Project of Rarer Cancers. American Journal of Epidemiology 172(1): 81-93.
Szczech, L. A., W. Harmon, T. H. Hostetter, P. E. Klotman, N. R. Powe, J. R. Sedor, P. Smedberg and J. Himmelfarb. 2009. World Kidney Day 2009: problems and challenges in the emerging epidemic of kidney disease. Journal of the American Society of Nephrology 20(3): 453-5.
Tangpricha, V., A. Turner, C. Spina, S. Decastro, T. C. Chen and M. F. Holick. 2004. Tanning is associated with optimal vitamin D status (serum 25-hydroxyvitamin D concentration) and higher bone mineral density. American Journal of Clinical Nutrition 80(6): 1645-9.
Taussig, H. B. 1966. Possible injury to the cardiovascular system from vitamin D. Annals of Internal Medicine 65(6): 1195-200.
Tominaga, S. and T. Kuroishi. 1997. An ecological study on diet/nutrition and cancer in Japan. International Journal of Cancer (Suppl 10): 2-6.
Towler, D. 2009. Adverse health effects of excessive vitamin D and calcium intake: considerations relevant to cardiovascular disease and nephrocalcinosis. A white paper commissioned for the Committee to Review Dietary Reference Intakes for Vitamin D and Calcium. Washington, DC.
Trivedi, D. P., R. Doll and K. T. Khaw. 2003. Effect of four monthly oral vitamin D3 (cholecalciferol) supplementation on fractures and mortality in men and women living in the community: randomised double blind controlled trial. British Medical Journal 326(7387): 469.
Tryfonidou, M. A., M. A. Oosterlaken-Dijksterhuis, J. A. Mol, T. S. van den Ingh, W. E. van den Brom and H. A. Hazewinkel. 2003. 24-hydroxylase: potential key regulator in hypervitaminosis D3 in growing dogs. American Journal of Physiology, Endocrinology, and Metabolism 284(3): E505-13.
Tseng, M., R. A. Breslow, B. I. Graubard and R. G. Ziegler. 2005. Dairy, calcium, and vitamin D intakes and prostate cancer risk in the National Health and Nutrition Examination Epidemiologic Follow-up Study cohort. American Journal of Clinical Nutrition 81(5): 1147-54.
Tuohimaa, P., L. Tenkanen, M. Ahonen, S. Lumme, E. Jellum, G. Hallmans, P. Stattin, S. Harvei, T. Hakulinen, T. Luostarinen, J. Dillner, M. Lehtinen and M. Hakama. 2004. Both high and low levels of blood vitamin D are associated with a higher prostate cancer risk: a longitudinal, nested case–control study in the Nordic countries. International Journal of Cancer 108(1): 104-8.
Ulett, K., B. Wells and R. Centor. 2010. Hypercalcemia and acute renal failure in milk-alkali syndrome: a case report. Journal of Hospital Medicine 5(2): E18-20.
Vervaet, B. A., A. Verhulst, P. C. D’Haese and M. E. De Broe. 2009. Nephrocalcinosis: new insights into mechanisms and consequences. Nephrology, Dialysis, Transplantation 24(7): 2030-5.
Vieth, R. 1990. The mechanisms of vitamin D toxicity. Bone and Mineral 11(3): 267-72.
Vieth, R., T. R. Pinto, B. S. Reen and M. M. Wong. 2002. Vitamin D poisoning by table sugar. Lancet 359(9307): 672.
Vieth, R. 2007. Vitamin D toxicity, policy, and science. Journal of Bone and Mineral Research 22(Suppl 2): V64-8.
Vik, B., K. Try, D. S. Thelle and O. H. Forde. 1979. Tromso Heart Study: vitamin D metabolism and myocardial infarction. British Medical Journal 2(6183): 176.
Visser, M., D. J. Deeg, M. T. Puts, J. C. Seidell and P. Lips. 2006. Low serum concentrations of 25-hydroxyvitamin D in older persons and the risk of nursing home admission. American Journal of Clinical Nutrition 84(3): 616-22; quiz 671-2.
Wagner, C. L. and F. R. Greer. 2008. Prevention of rickets and vitamin D deficiency in infants, children, and adolescents. Pediatrics 122(5): 1142-52.
Waked, A., A. Geara and B. El-Imad. 2009. Hypercalcemia, metabolic alkalosis and renal failure secondary to calcium bicarbonate intake for osteoporosis prevention—“modern” milk alkali syndrome: a case report. Cases Journal 2: 6188.
Wang, T. J., M. J. Pencina, S. L. Booth, P. F. Jacques, E. Ingelsson, K. Lanier, E. J. Benjamin, R. B. D’Agostino, M. Wolf and R. S. Vasan. 2008. Vitamin D deficiency and risk of cardiovascular disease. Circulation 117(4): 503-11.
WCRF (World Cancer Research Fund)/AICR (American Institute for Cancer Research). 2007. Food, Nutrition, Physical Activity, and the Prevention of Cancer: A Global Perspective. Washington, DC: AICR.
Webb, A. R., B. R. DeCosta and M. F. Holick. 1989. Sunlight regulates the cutaneous production of vitamin D3 by causing its photodegradation. Journal of Clinical Endocrinology and Metabolism 68(5): 882-7.
Williams, C. P., D. F. Child, P. R. Hudson, G. K. Davies, M. G. Davies, R. John, P. S. Anandaram and A. R. De Bolla. 2001. Why oral calcium supplements may reduce renal stone disease: report of a clinical pilot study. Journal of Clinical Pathology 54(1): 54-62.
Yang, H., G. Curinga and C. M. Giachelli. 2004. Elevated extracellular calcium levels induce smooth muscle cell matrix mineralization in vitro. Kidney International 66(6): 2293-9.
Yetley, E. A., D. Brule, M. C. Cheney, C. D. Davis, K. A. Esslinger, P. W. Fischer, K. E. Friedl, L. S. Greene-Finestone, P. M. Guenther, D. M. Klurfeld, M. R. L’Abbe, K. Y. McMurry, P. E. Starke-Reed and P. R. Trumbo. 2009. Dietary reference intakes for vitamin D: justification for a review of the 1997 values. American Journal of Clinical Nutrition 89(3): 719-27.
Zielhuis, R. L. and F. W. van der Kreek. 1979. Calculation of a safety factor in setting health based permissible levels for occupational exposure. II. Comparison of extrapolated and published permissible levels. International Archives of Occupational and Environmental Health 42(3-4): 203-15.


