
2
Overview of Calcium
INTRODUCTION
Calcium as a nutrient is most commonly associated with the formation and metabolism of bone. Over 99 percent of total body calcium is found as calcium hydroxyapatite (Ca10[PO4]6[OH]2) in bones and teeth, where it provides hard tissue with its strength. Calcium in the circulatory system, extracellular fluid, muscle, and other tissues is critical for mediating vascular contraction and vasodilatation, muscle function, nerve transmission, intracellular signaling, and hormonal secretion. Bone tissue serves as a reservoir for and source of calcium for these critical metabolic needs through the process of bone remodeling.
Calcium metabolism is regulated in large part by the parathyroid hormone (PTH)–vitamin D endocrine system, which is characterized by a series of homeostatic feedback loops. The rapid release of mineral from the bone is essential to maintain adequate levels of ionized calcium in serum. During vitamin D deficiency states, bone metabolism is significantly affected as a result of reduced active calcium absorption. This leads to increased PTH secretion as the calcium sensing receptor in the parathyroid gland senses changes in circulating ionic calcium. Increased PTH levels induce enzyme activity (1α-hydroxylase) in the kidney, which converts vitamin D to its active hormonal form, calcitriol. In turn, calcitriol stimulates enhanced calcium absorption from the gut. Not surprisingly, the interplay between the dynamics of calcium and vitamin D often complicates the interpretation of data relative to calcium requirements, deficiency states, and excess intake.
SOURCES OF CALCIUM
Ingested calcium comes from food sources and dietary supplements. In this report dietary calcium refers to both food sources and supplements combined (although some researchers reserve the term dietary calcium to mean only food sources) and is most often referred to as total calcium intake for clarity. With more than one-half of the U.S. population (Bailey et al., 2010)—and between 24 and 60 percent of Canadians (2004 Canadian Community Health Survey, personal communication, D. Brulé, Health Canada, April 29, 2010)—reporting use of dietary supplements of some type, dietary supplements must be taken into account when considering the sources of calcium in the diet and, in turn, estimating total calcium intake. Current estimates from 2003 to 2006 indicate that the median total intake of calcium from all sources for persons > 1 year of age ranges from 918 to 1,296 mg/day, depending upon life stage (Bailey et al., 2010). Only small amounts of calcium are contributed by water, depending upon geographic location. Chapter 7 of this report contains an assessment of quantitative calcium intake in the U.S. and Canadian populations.
Food
Calcium is classically associated with dairy products; milk, yogurt, and cheese are rich sources of calcium, providing the major share of calcium from foods in the general diet in the United States and Canada. In the United States, an estimated 72 percent of calcium comes from milk, cheese and yogurt and from foods to which dairy products have been added (e.g., pizza, lasagna, dairy desserts). The remaining calcium comes from vegetables (7 percent); grains (5 percent); legumes (4 percent); fruit (3 percent); meat, poultry, and fish (3 percent); eggs (2 percent); and miscellaneous foods (3 percent).1 Similar data from Canada are not currently available.
Fortification with calcium for a number of foods that do not naturally contribute calcium—such as orange juice, other beverages, and ready-to-eat cereals—is becoming commonplace in the United States (Calvo et al., 2004; Rafferty et al., 2007; Poliquin et al., 2009). These practices challenge the ability of national food composition databases, such as those maintained by U.S. Department of Agriculture (USDA), to keep abreast of these newer products and may result in some underestimation of actual calcium intake from food sources. However, for those persons who choose such foods, total calcium intake is increased.
|
1 |
U.S. Department of Agriculture/Economic Research Service Nutrient Availability Data (2009). Available online at http://www.ers.usda.gov/Data/FoodConsumption/NutrientAvailIndex.htm. Accessed October 19, 2010. |
Dietary Supplements
Among the U.S. population, about 43 percent of all persons—but almost 70 percent of older women—reported calcium intake from supplements, based on a national survey conducted between 2003 and 2006 (Bailey et al., 2010). When calcium from supplement use is taken into account based on these survey data, the average intake increases by about 7 percent for males and 14 percent for females. However, this is not a meaningful snapshot of the effect of supplement use, because non-users of supplements are averaged with users, meaning that the effect is much more skewed than can be reflected by a mean estimate. Similar data are not available for Canada, but the frequency of use data show that 48 to 82 percent of Canadians reported taking a calcium supplement within the previous 30 days (2004 Canadian Community Health Survey, personal communication, D. Brulé, Health Canada, April 29, 2010).
The most common forms of supplemental calcium are calcium carbonate and calcium citrate.2 The bioavailability of the calcium in these forms is discussed below in the section titled “Other Factors Related to Calcium Nutriture.” Generally fewer tablets of calcium carbonate are required to achieve given dose of elemental calcium because calcium carbonate generally provides 40 percent elemental calcium, compared with 21 percent for calcium citrate. Thus, costs tend to be lower with calcium carbonate (Heaney et al., 2001; Keller et al., 2002) than with calcium citrate, and compliance may be higher among patients who do not want to take (or have difficulty swallowing) multiple pills. Chewable calcium carbonate supplements are also available. However, compared with calcium citrate, calcium carbonate is more often associated with gastrointestinal side effects, including constipation, flatulence, and bloating (Straub, 2007). Calcium citrate is less dependent than calcium carbonate on stomach acid for absorption (Hunt and Johnson, 1983; Recker, 1985; Straub, 2007) and thus can be taken without food. It is useful for individuals with achlorhydria, inflammatory bowel disease, or absorption disorders or who are taking histamine-2 receptor blockers or proton pump inhibitors; for residents of long-term care facilities where calcium supplements are not given with meals; and for others whose schedules preclude taking supplements with food (Bo-Linn et al., 1984; Carr and Shangraw, 1987; Straub, 2007). Calcium can compete or interfere with the absorption of iron, zinc, and magnesium. For this reason, persons with known deficiencies of these other minerals who require calcium supplementation usually take calcium supplements between meals (Straub, 2007).
METABOLISM OF CALCIUM
Absorption
Calcium is absorbed by active transport (transcellularly) and by passive diffusion (paracellularly) across the intestinal mucosa. Active transport of calcium is dependent on the action of calcitriol and the intestinal vitamin D receptor (VDR). This transcellular mechanism is activated by calcitriol and accounts for most of the absorption of calcium at low and moderate intake levels. Transcellular transport occurs primarily in the duodenum where the VDR is expressed in the highest concentration, and is dependent on up-regulation of the responsive genes including the calcium transport protein called transient receptor potential cation channel, vanilloid family member 6 or TRPV6 (Li et al., 1993; Xue and Fleet, 2009). These features—up-regulation of VDR and TRPV6—are most obvious during states in which a high efficiency of calcium absorption is required.
Passive diffusion or paracellular uptake involves the movement of calcium between mucosal cells and is dependent on luminal:serosal electrochemical gradients. Passive diffusion occurs more readily during higher calcium intakes (i.e., when luminal concentrations are high) and can occur throughout the length of the intestine (Ireland and Fordtran, 1973). However, the permeability of each intestinal segment determines passive diffusion rates. The highest diffusion of calcium occurs in the duodenum, jejunum, and ileum (Weaver and Heaney, 2006b).
From a recent series of controlled metabolic studies undertaken by the USDA, mean calcium absorption (also referred to as “fractional calcium absorption,” which is the percentage of a given dose of calcium that is absorbed) in men and non-pregnant women—across a wide age range—has been demonstrated to be approximately 25 percent of calcium intake (Hunt and Johnson, 2007). Mean urinary loss averages 22 percent and fecal loss 75 percent of total calcium intake, with minor losses from sweat, skin, hair, etc. In general, mean calcium absorption and calcium intake are directly related (Heaney et al., 1975; Gallagher et al., 1980; Hunt and Johnson, 2007). However, fractional calcium absorption varies inversely with calcium intake when the intake is very low (Malm, 1958; Spencer et al., 1969; Ireland and Fordtran, 1973). For example, when calcium intake was lowered from 2,000 to 300 mg, healthy women increased their fractional whole body retention of ingested calcium, an index of calcium absorption, from 27 percent to about 37 percent (Dawson-Hughes et al., 1993). This type of adaptation occurs within 1 to 2 weeks and is accompanied by a decline in serum calcium concentration and a rise in serum PTH and calcitriol concentrations (see section below titled “Homeostatic Regulation of Calcium”). The fraction of calcium absorbed rises adaptively as intake
is lowered. However, this rise is not sufficient to offset the loss in absorbed calcium that occurs as a result of the lower intake of calcium—however modest that decrease may be—and thus net calcium absorption is reduced.
Fractional calcium absorption varies during critical periods of life. In infancy, it is high at approximately 60 percent, although the range is large (Fomon and Nelson, 1993; Abrams et al., 1997). Calcium absorption in newborns is largely passive and facilitated by the lactose content of breast milk (Kocian et al., 1973; Kobayashi et al., 1975). As the neonate ages, passive absorption declines and calcitriol-stimulated active intestinal calcium absorption becomes more important (Ghishan et al., 1980; Halloran and DeLuca, 1980; Ghishan et al., 1984).
A recent preliminary report on breast-fed infants in the first 2 months of life (Hicks et al., 2010) reported calcium absorption of approximately 33.7 ± 2.0 mg/100 kcal. In an earlier study using stable isotopes (Abrams et al., 1997), calcium absorption was measured in 14 breast milk–fed infants who were 5 through 7 months of age at the time of the study. Mean absorption was 61 ± 23 percent of intake when approximately 80 percent of the calcium intake was from human milk (IOM, 1997). There was no significant relationship between calcium intake from solid foods and the fractional calcium absorption from human milk. This finding suggests that calcium from solid foods does not negatively affect the bioavailability of calcium from human milk (IOM, 1997). Using measured urinary calcium and estimates of endogenous excretion, net retention of calcium was calculated to be 68 ± 38 mg/day for those infants. Abrams (2010) concluded that in infancy, based on calcium intakes that vary from as low as 200 mg/day in exclusively breast-fed infants in the early months of life to 900 mg/day in older formula-fed infants receiving some solids, calcium absorption depends primarily on the level of intake. The author reported that the absorption fraction can range from somewhat above 60 percent with lower intakes to about 30 percent with higher intakes. As the infant transitions into childhood, fractional calcium absorption declines, only to rise again in early puberty, a time when modeling of the skeleton is maximal. Abrams and Stuff (1994) found fractional absorption in white girls with a mean calcium intake of about 931 mg/day to average 28 percent before puberty, 34 percent during early puberty (the age of the growth spurt), and 25 percent 2 years after early puberty. Fractional absorption remains about 25 percent in young adults. In 155 healthy men and women between 20 and 75 years of age, mean calcium absorption was 24.9 ± 12.4 percent of total intake (Hunt and Johnson, 2007). During pregnancy, calcium absorption doubles (Kovacs and Kronenberg, 1997; Kovacs, 2001). Metabolic status also influences calcium absorption such that severe obesity is associated with higher calcium absorption and dieting reduces the fractional calcium absorption by 5 percent (Cifuentes et al., 2002; Riedt et al., 2006).
With aging and after menopause, fractional calcium absorption has been reported to decline on average by 0.21 percent per year after 40 years of age (Heaney et al., 1989). Nordin et al. (2004) and Aloia et al. (2010) also reported decreased absorption with age. There are early reports of an inverse correlation between age and calcium absorption in women (Avioli et al., 1965), and several studies have indicated that despite an increase in circulating levels of calcitriol in older women, which would be anticipated to increase calcium uptake, fractional calcium absorption was unaffected (Bullamore et al., 1970; Alevizaki et al., 1973; Gallagher et al., 1979; Tsai et al., 1984; Eastell et al., 1991; Ebeling et al., 1992). Thus, although calcium absorption (active calcium transport) has been reported to decrease with age, it is challenging to take this factor into consideration given that calcium intake must be very high to have a significant effect on calcium uptake via the passive absorption.
Homeostatic Regulation of Calcium
Maintaining the level of circulating ionized calcium within a narrow physiological range is critical for the body to function normally, and control of serum calcium levels is maintained through an endocrine system—a system of glands that secrete hormones and is characterized by controlling factors and feedback mechanisms—that includes a major role for vitamin D metabolites, principally calcitriol, and PTH. Calcium balance within the body is closely linked to the hormonal actions of calcitriol. The vitamin D-related endocrine system that maintains serum calcium levels is discussed in Chapter 3 but is also summarized below and illustrated in Figure 2-1.
The vitamin D metabolic system forms the basis of the calcium homeostatic mechanism in mammals. Total calcium concentration in serum is tightly regulated to remain between 8.5 and 10.5 mg/dL (2.12 and 2.62 mmol/L). If this level deviates slightly, the calcium sensing receptor of the parathyroid gland signals the secretion of PTH, which functions as a calcium sensor. PTH then stimulates the kidney to produce calcitriol, the hormonal form of vitamin D, as well as to activate bone resorption, which will increase extracellular calcium levels. Calcitriol acts in an endocrine manner on the intestine, bone, and kidney to raise serum calcium levels; it also acts on the intestine and, to some extent, the kidneys to raise serum phosphorus levels. As the serum calcium level rises, the feedback mechanism causes the calcium sensing receptor to be turned off and PTH secretion to drop. If there is an overshoot in serum calcium levels, the “C” cells (parafollicular) cells of the thyroid gland secrete calcitonin, which can block bone calcium resorption, helping to keep serum calcium levels in the normal range. Calcitriol, through its receptor, also provides feedback relative to suppressing the production and release of PTH, commonly referred
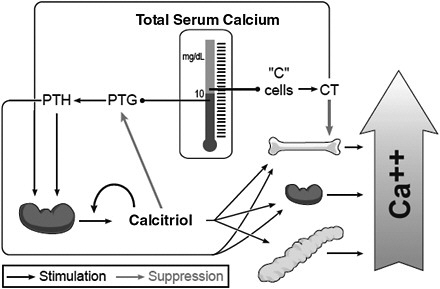
FIGURE 2-1 Endocrine feedback system that maintains serum calcium levels: Involvement of vitamin D and parathyroid hormone (PTH).
NOTE: CT = calcitonin; PTG = parathyroid gland.
SOURCE: Reprinted with permission from Hector DeLuca.
to as PTH suppression. Not shown in the figure is that calcitriol is also directly controlled by the serum phosphorus level; a high serum phosphorus level suppresses the formation of calcitriol, whereas a low level stimulates it.
Excretion
Calcium leaves the body mainly in urine and feces, but also in other body tissues and fluids, such as sweat. Calcium excretion in the urine is a function of the balance between the calcium load filtered by the kidneys and the efficiency of reabsorption from the renal tubules. Nearly 98 percent of filtered calcium (i.e., glomerular filtrate) is reabsorbed by either passive or active processes occurring at four sites in the kidney, each contributing to maintaining neutral calcium balance. Seventy percent of the filtered calcium is reabsorbed passively in the proximal tubule. Active calcium transport is regulated by the calcium sensing receptor located in the ascending loop of Henle, where, in response to high calcium levels in the extracellular fluid, active reabsorption in the loop is blocked through actions of the calcium sensing receptor. In contrast, when the filtered calcium load is low, the calcium sensing receptor is activated, and a greater fraction of the filtered calcium is reabsorbed. In the distal tubule, the ion chan-
nels known as transient receptor potential cation channel, vanilloid family member 5 or TRPV5 control active calcium transport and this process is regulated by calcitriol and estradiol (Hoenderop et al., 2000). Finally, the collecting duct also can participate in passive calcium transport, although the relative percentage of total calcium reabsorption in the collecting duct is low. Overall, a typical daily calcium loss for a healthy adult man or woman via renal excretion is 5 mmol/day (Weaver and Heaney, 2006a).
Calcium is excreted through the feces as unabsorbed intestinal calcium and is shed in mucosal cells and secretions including saliva, gastric juices, pancreatic juice, and bile. Endogenous fecal calcium losses are approximately 2.1 mg/kg per day in adults and about 1.4 mg/kg per day in children (Abrams et al., 1991). These intestinal losses as well as minor losses in sweat are referred to collectively as endogenous calcium excretion. Endogenous calcium excretion, in contrast to urinary excretion, does not change appreciably with aging (Heaney and Recker, 1994).
PTH can be a major determinant of urinary calcium excretion; during states of low calcium intake, secondary increases in PTH levels result in reduced urinary calcium excretion. Impaired renal function due to aging paradoxically reduces calcium loss due to impaired filtration, but there is also a secondary increase in PTH levels due to reduced phosphate clearance. However, renal 1α-hydroxylase activity declines with impaired renal function, so the net result is calcium loss from the kidney, but also reduced active transport of calcium from the intestine.
Excess Intake
Although excess intake of calcium is almost never due to calcium intake from foods, the use of calcium supplements (including the voluntary fortification of a range of foods that are not naturally sources of calcium) has increased (Ricci et al., 1998; Riedt et al., 2005), and excess calcium intake may occur as a result of high intake from calcium supplements. Excess calcium intake can result in adverse effects. Calcium plays a major role in the metabolism of virtually every cell in the body and interacts with a large number of other nutrients, and as a result, disturbances of calcium metabolism may give rise to a variety of adverse effects (IOM, 1997). A review of the considerations related to adverse effects from excess calcium ingestion can be found in Chapter 6, which focuses on the establishment of Tolerable Upper Intake Levels (ULs).
FUNCTIONS AND PHYSIOLOGICAL ACTIONS OF CALCIUM
Calcium is an integral component of the skeleton, and the skeleton provides a reservoir of calcium for other essential calcium-dependent functions throughout the body. The skeleton serves at least three main func-
tions. First, calcium, as part of the mineral hydroxyapatite, deposited into the organic matrix of the skeleton, is critical for its structure and is necessary for tissue rigidity, strength, and elasticity. This function allows for normal movement and exercise. Second, the skeleton functions as a source of minerals and alkali and therefore is critical for overall mineral homeostasis. The skeleton is the principal depot for calcium, containing 98 percent of total body calcium. It can be called on repeatedly, through the processes of bone formation and resorption (referred to as remodeling, as discussed below), to maintain circulating levels of calcium at a constant level. While the same qualitative processes apply to skeletal calcium metabolism across the life cycle, there are quantitative differences by age and hormonal status. These life cycle differences for skeletal growth and remodeling are discussed in a section below. Excessive calcium resorption can compromise the integrity and strength of the skeletal tissues. Third, the marrow cavity of bone serves as a major site for the development of hematopoietic cells and as a major compartment of the immune system. Several of the cell types involved in bone remodeling originate in the bone marrow compartment. Stromal or connective tissue cells are found in the bone marrow; at one time, these were thought to be inert, but they are now considered multi-potent stem cells that can become either fat or bone cells under the influence of specific differentiation factors (Muruganandan et al., 2009).
A principal physiological function of calcium apart from its role in maintaining the skeleton, is as an essential intracellular messenger in cells and tissues throughout the body. Although this pool of calcium is quantitatively small, the ionized calcium present in the circulatory system, extracellular fluid, muscle, and other tissues, is critical for mediating vascular contraction and vasodilatation, muscle function, nerve transmission, and hormonal secretion. Ionized calcium is the most common signal transduction element in biology, owing to its ability to reversibly bind to proteins and to complex with anions such as citrate and bicarbonate (Weaver and Heaney, 2006b).
Bone Formation and Remodeling
Bone is composed of a mineral compartment, predominantly calcium hydroxyapatite and an organic matrix, osteoid, composed principally of collagen and non-collagenous proteins and growth factors. The relative contributions of the mineralized and organic compartments depend on the age of the individual; in general, 50 to 70 percent of bone is mineral, 20 to 40 percent is organic matrix, and the rest is water and lipid. The organic matrix is critical for both the structural and functional components of the skeleton, providing elasticity and contributing to regenerative and remodeling properties. Much of the organic matrix is composed of type I collagen fibrils that are organized in such a manner that strength and
elasticity are combined. Numerous non-collagenous proteins are also present in the organic matrix. Some of them, such as osteocalcin and matrix GLA protein, contain γ-carboxyglutamate, an amino acid with high affinity for calcium that is required for proper mineralization of the matrix (see below). The role of phosphate in bone development should not be overlooked. As described below, first phosphorus is laid down during the mineralization process, and then calcium binds to it. Calcitriol stimulates the uptake of both calcium and phosphorus from the intestine.
Development
The skeleton develops through a process of either intramembranous or endochondral bone formation, depending on location and function. Intramembranous bone formation is the predominant process in the skull, whereas endochondral bone formation occurs in long bone and the axial skeleton. Intramembranous bone is formed by direct differentiation of mesenchymal precursors into osteoblasts, cells of the fibroblast–stromal lineage that produce bone matrix proteins and synthesize a lattice for subsequent mineralization. In contrast, during endochondral bone formation chondrocytic differentiation occurs first, leading to a soft cartilaginous infrastructure. The cartilage then becomes calcified, and the provisional calcified cartilage is subsequently replaced by bone. This occurs by vascular invasion, which allows entry of hematopoietic precursors and osteoclasts, macrophage-like cells that originate from the monocyte–macrophage lineage, which remove apoptotic chondrocytes and cartilage (Provot and Schipani, 2007). New bone is formed by osteoblasts. Osteoblastogenesis follows chondrogenesis after release of growth factors from terminally differentiated chondrocytes. The first bone formed is woven and relatively unorganized. However, through osteoclastic modeling that bone is replaced by lamellar bone, which is highly organized and provides the strength necessary to support soft tissue (Yang and Yang, 2008).
Endochondral bone formation allows for linear development of the growth plate as well as periosteal expansion, which ultimately results in a longer and thicker bone. Mineralization is the final stage in terminal differentiation of the osteoblast and occurs through a complex process whereby ion deposition is followed by crystal formation between the collagen fibrils. This occurs because of undersaturation of calcium hydroxyapatite in the extracellular fluid and the binding of calcium to non-collagenous proteins in the matrix (Favus, 2008). Initially, phosphate drives the mineralization by being laid down in bone as hydroxyapatite; the negative charge of hydroxyapatite then causes calcium to avidly bind to it. In states of phosphorus deficiency, unmineralized osteoid persists despite adequate calcium intake. Bone mechanical properties are then influenced by the distribu-
|
BOX 2-1 Bone Remodeling Terms and Definitions
SOURCE: Hadjidakis and Androulakis, 2006. |
tion, size, and density of the apatite crystals. Too much or too little mineral can lead to impaired bone strength; the former makes the bone too brittle, whereas the latter makes the bone too ductile and weak.
Remodeling
Calcium balance is preserved within the non-bone tissues of the body, because adult bone constantly undergoes remodeling through bone resorption, mainly by osteoclasts and bone formation mainly by osteoblasts.3 Terminology associated with remodeling is shown in Box 2-1. In adults, virtually all of the human skeleton is remodeled over a 10-year cycle, although trabecular bone turns over more readily. In contrast, bone formation incorporates calcium into the matrix, and this process requires significant time
and energy. Overall calcium balance is maintained at the skeletal level by opposing actions of bone cells. Skeletal remodeling occurs in microscopic elements of bone referred to as remodeling units or basic multicellular units, which contain the osteoblasts (bone-resorbing cells) and osteoclasts (bone-forming cells). Old osteoblasts then become osteocytes entombed within the bone matrix after mineralization.
The axial and appendicular skeletons are composed of both cortical and trabecular bone. The hard outer shell of bone is cortical, which is remodeled less frequently, but is important for strength and periosteal expansion during puberty and with aging. The trabecular compartment is bathed by bone marrow and is remodeled much more frequently, which is in part due to a much greater surface area and the existence of marrow elements that are in close proximity to the endosteal surface of bone (which contribute progenitor cells for eventual remodeling).
Physical activity—or more specifically mechanical loading—is a critical component of skeletal homeostasis. It is thought that osteocytes in cortical bone sense changes in gravitational forces and elaborate growth factors that initiate remodeling. Unloading of the skeleton in cases such as bed rest or weightlessness (space travel) is associated with a profound uncoupling of remodeling, such that bone resorption is dramatically increased, whereas bone formation is suppressed. These changes cause rapid bone loss and are a major problem for long-term spaceflight. Loading of the skeleton by mechanical means (e.g., weight-bearing exercise such as running, walking, or jumping) can promote bone formation, particularly in early childhood and adolescence, although it has benefits later in life as well.
Concept of Normal, Healthy Bone Accretion
Bone is a dynamic tissue; it is metabolically active, responding to both genetically determined and environmental stimuli that ultimately determine its composition and structural integrity. Bone modeling describes events that occur primarily during growth resulting in increased bone size and modification of its shape in response to genetic determinants and mechanical loading. Bone remodeling occurs in response to stimulation by surface-dependent factors initiated by damage or mechanical loading. It includes bone resorption and deposition but does not alter the size or shape of bone (reviewed in Seeman, 2009).
Although the role of genetic and environmental factors in bone modeling and remodeling has long been debated in the literature, genetics remains the chief determinant of bone mass, which, in turn, is the determinant of bone strength (Krall and Dawson-Hughes, 1993; Jouanny et al., 1995; Jones and Nguyen, 2000; Sigurdsson et al., 2008; Perez-Lopez et al., 2010). Given uncertainties in understanding the cumulative impact of
genetic and environmental influences on bone mass across life stages, the question of whether attainment of maximal, optimal, or “peak” bone mass can be achieved on a lasting basis through dietary manipulation and/or use of supplements has not been completely resolved.
A 2-year longitudinal multiethnic study (Abrams et al., 2000) of changes in calcium absorption, bone accretion, and markers of bone growth in pre-pubertal girls (7 to 8 years of age) maintained on a calcium intake of 1,200 mg/day found a significant increase in calcium use associated with pubertal development. The increase paralleled markers of bone formation; supporting the hypothesis that calcium intake during the early to late pubertal stage influences peak rates of calcium gain in bone during pubertal development. An earlier study followed pre-pubertal males and females (mean age 8.5 years) for 18 months after calcium supplementation and also found gains in bone mineral content (BMC) and bone area of the lumbar spine; however, the increases in bone accretion disappeared after supplements were withdrawn (Lee et al., 1996). In a longer-term randomized clinical trial, Matkovic et al. (2005) evaluated the effects of calcium supplementation on bone accretion in the transition from childhood into early adulthood. This study found significant increases in bone accretion for total bone density, distal and proximal radius, and metacarpal indexes after 4 years of supplementation; by 7 years, however, only the proximal radius and metacarpal indexes still showed significantly increased bone accretion over non-supplemented controls.
These findings corroborate a role for calcium intake and skeletal size; however, they also suggest that bone accretion diminishes during skeletal consolidation in late adolescence, and attainment of a peak bone mass was transient for some skeletal sites, even though the study subjects continued calcium supplementation through year 7. When considered together, these studies support an increase in skeletal size and mineralization that occurs with calcium supplementation, but fail to show consistently that BMC is retained over the long term, particularly after supplementation is withdrawn.
Effect of Menopause
Studies of bone histomorphometry (Recker et al., 2004) and markers of bone remodeling (Uebelhart et al., 1990) indicate that bone remodeling is accelerated in the perimenopausal and postmenopausal periods. The span of 5 to 10 years surrounding menopause is characterized by a decrease in estrogen production and an increase in resorption of calcium from bone (Stevenson et al., 1981; Riggs, 2002; Masse et al., 2005; Finkelstein et al., 2008), resulting in a marked decrease in bone density. For example, Ebeling et al. (1996) measured changes in markers of bone mineral density (BMD) in a cohort of 281 women who were 45–57 years of age, and found
the BMD in lumbar spine and femoral neck was decreased by 20 percent in perimenopausal and postmenopausal women compared with premenopausal women. The bone loss is most rapid in the early years of menopause, and then approximately 6 to 7 years postmenopause the loss continues at a slower rate (Pouilles et al., 1995)
The bone loss associated with menopause results from uncoupling in the bone remodeling units, such that resorption of bone is greater than formation of new bone. Over time, such changes lead to skeletal fragility and decreased bone mass. Some cohort studies demonstrate that accelerated bone loss is an independent risk factor for fracture, such that the combination of low bone mass and high rates of bone turnover markedly increase the potential for a future fracture (Garnero et al., 1996). Bone remodeling in postmenopausal osteoporosis includes changes in osteoid thickness, surface area, and volume. Parfitt et al. (1995) determined that defective osteoblast recruitment in women with osteoporosis resulted in decreased osteoid thickness, a characteristic of osteoporosis.
Considerable variability exists among women regarding the effects of menopause on bone loss, and such effects vary according to body mass index and ethnicity (Finkelstein et al., 2008). The effect of estrogen/progesterone treatment on preventing bone loss and reducing fracture risk is well established. However, the use of such therapy has declined as a result of recent reports of adverse non-skeletal effects. Because rapid bone loss occurs after estrogen treatment is discontinued (Gallagher et al., 2002), the potential impact on subsequent fracture rates is of interest but remains unclear.
Skeletal Disorders
Rickets and Osteomalacia
Rickets is the term for the end-stage condition in infants and children that begins with suboptimal bone mineralization at the growth plate and progresses with associated physiological perturbations that include secondary hyperparathyroidism, hypocalcemia, and hypophosphatemia leading to irreversible changes in skeletal structure. The disease is a disorder of the growth apparatus of bone in which growth cartilage fails to mature and mineralize normally. Because the bone is undermineralized it is also soft and ductile, and this leads to bowing of the limbs, widening and compression of the ends of the long bones, etc. The similar condition of osteomalacia (defective mineralization of bone and softening of bone) also occurs, and is seen in adults as well as children. Although these conditions are commonly associated with inadequate vitamin D exposure, each can also result from calcium (or phosphorus) deficiency. Rickets and osteomalacia
due to a lack of calcium in the diet cannot be corrected by increasing levels of calcitriol (i.e., the active form of vitamin D also referred to as 1,25-dihyroxyvitamin D).
Rickets In rickets, during prolonged deficiency of calcium (and phosphate), the body increases PTH to prevent hypocalcemia by causing osteoclastic absorption of the bone. This, in turn, causes the bone to become progressively weaker, resulting in rapid osteoblastic activity. The osteoblasts produce large amounts of organic bone matrix, osteoid, which does not become calcified (Guyton and Hall, 2001). Consequently, the newly formed, uncalcified osteoid gradually takes the place of other bone that is being reabsorbed. During the later stages of rickets, the serum calcium level falls precipitously, and tetany (neuromuscular spasm) develops. In infants and young children, a long-standing calcium intake deficiency, in association with suboptimal vitamin D exposure, can produce rickets. Indeed, in experimental animals and in humans with extremely low vitamin D levels, genetic absence of calcitriol (vitamin D–dependent rickets [VDDR] type I), or genetic absence of the vitamin D receptor (VDDR type II), the use of increased calcium supplementation or calcium infusions will prevent and treat rickets. These observations indicate that the primary cause of rickets is inadequate delivery of calcium to the bone surface, not a defect in osteoblast function. In other words, the primary role for vitamin D and calcitriol in regulating skeletal homeostasis is indirectly accomplished by stimulating the intestinal absorption of calcium and phosphorus.
The clinical symptoms of rickets include stunted growth and bowing of the extremities. A serum 25-hydroxyvitamin D (25OHD) level of less than 27 to 30 nmol/L is not diagnostic of the disease but is associated with an increased risk for developing rickets (Specker et al., 1992).
Osteomalacia In osteomalacia, as seen in adults, the newly deposited bone matrix fails to mineralize adequately. Poor calcium intake is associated with secondary increases in PTH in an attempt to compensate for low serum calcium levels. The secondary hyperparathyroidism of calcium deficiency states is associated with increased bone resorption and suppression of bone formation. As a result, older adults who have calcium-poor diets and very low vitamin D levels may develop not only osteoporosis, as described below (i.e., a reduction in bone mass), but also osteomalacia (a reduction in mineral within the bone matrix). Osteomalacia is actually the clinical syndrome of undermineralization of bone associated with muscle weakness, bone pain, and fractures. The characteristic histological feature of osteomalacia is unmineralized matrix, which is often represented experimentally as the ratio of osteoid volume to bone volume. Ultimately, reductions in mineralization lead to impaired bone strength and signifi-
cant softening of the skeleton. The calcium levels in the blood of patients with osteomalacia are often normal despite the undermineralization of bone, underscoring the importance of maintaining the blood calcium level over maintaining the mineralization of the skeleton. However, serum phosphorus levels are frequently low, PTH concentrations are 5 to 10 times the normal levels, and there is an increased level of alkaline phosphatase together with increased markers of bone turnover. Bone scans often indicate dramatically increased skeletal uptake by resident osteoblasts. As recognized by Parfitt et al. (1995) and illustrated by the histological classification scheme used for osteomalacia, what clinicians generally recognize as osteomalacia is the end-stage results from a prolonged severe deficiency of calcium and/or vitamin D. During the earliest stages (preosteomalacia), there exists a calcium-deficient state, even though the osteoid thickness, mineralization lag time, and osteoid volume are still normal. Subsequently, more dramatic changes occur including a greater increase in osteoid thickness, and impaired mineralization.
Osteomalacia is estimated to be present in about 4 to 5 percent of general medical and geriatric patients (Anderson, 1961; Stacey and Daly, 1989; Campbell et al., 1994). However, the clinical syndrome of bone pain, muscle weakness, and impaired bone mineralization is much less frequently recognized. In the face of severe osteoporosis, the diagnosis of osteomalacia can only be made by bone biopsy, usually using the method of double tetracycline labeling, demonstrating impaired mineralization of the skeleton (Villareal et al., 1991; Chapuy et al., 1992; Komar et al., 1993). In fact, osteomalacia is noted histologically in the bones of 20 to 40 percent of first-time hip fracture patients (Jenkins et al., 1973; Aaron et al., 1974; Sokoloff, 1978). These results suggest that these individuals may be presenting with a mixture of osteoporosis and osteomalacia. This clinical scenario can be related to both nutrient insufficiency and the coincidental progression of age-related bone loss.
Osteoporosis and Fractures
Osteoporosis is a skeletal disorder associated with aging and characterized by compromised bone strength due to reduced bone mass and reduced bone quality. Reduced bone mass—as measured by low BMD—increases bone fragility and, in turn, predisposes a person to an increased risk of fracture, notably at the vertebrae, hip, and forearm (NIH Consensus Development Panel on Osteoporosis Prevention, Diagnosis, and Therapy, 2001). As shown in Figure 2-2, the relationship between BMD measures and the incidence of fractures is notable. Overall, osteoporosis-related morbidity and mortality, as well as health care costs, are a significant public health concern (NIH Consensus Development Panel on Osteoporosis Pre-
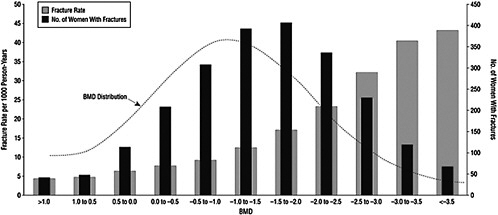
vention, Diagnosis, and Therapy, 2001). Osteoporosis is most commonly associated with women, but the condition also occurs in men.
Menopause can initiate osteoporosis through elevated bone remodeling, which occurs characteristically in postmenopausal women. Remodeling activity, although designed to repair weakened bone, actually makes it temporarily weaker when remodeling is excessive. It can lead to enhanced skeletal fragility (Heaney, 2003). Although it is unclear to what extent calcium intake can mitigate such bone loss, inadequate calcium intake can exacerbate the situation.
Men experience age-related bone loss as well, although not due to menopause. This, in turn, can result in osteoporosis. However, the incidence of fracture risk increases some 5 to 10 years later in men than it does in women (Tuck and Datta, 2007).
CALCIUM ACROSS THE LIFE CYCLE
The body’s need for calcium relative to skeletal growth and remodeling varies by life stage. The major physiological activities include bone accretion during skeletal growth and maintenance of bone mass after growth is completed. Later in adult life, net calcium is lost from the body when bone formation no longer keeps up with bone resorption. For all life stages highlighted below, specific studies and conclusions are detailed in Chapter 4.
Infancy
At full-term birth, the human infant has accrued about 26 to 30 g of calcium, most of which is in the skeleton. When calcium transfer from the placenta ceases at birth, the newborn infant is dependent on dietary calcium. Calcium deposition into bone occurs at a proportionately higher rate during the first year of life than during other periods. Breast-fed infants absorb about 55 to 60 percent of the calcium in human milk (Abrams et al., 1997). Formula-fed infants receive more calcium than breast-fed infants because formula contains nearly double the calcium of breast milk. However, fractional calcium absorption is lower in formula-fed infants, averaging about 40 percent among different formula types (Abrams et al., 2002). Studies to establish the level of calcium provided by human milk are long-standing in nature, and little information has emerged to change the conclusions of earlier analyses. Although the composition of milk varies significantly from the start to the end of each feed, the average calcium concentration of milk produced in total for each feeding remains relatively constant over the months of lactation, with an estimated value of 259 ± 59 mg/L at 30 days, followed by a small decrease during the second 6 months. This estimate is based on the average concentrations found in
several studies from the United States and the United Kingdom, as summarized in Atkinson et al. (1995). Variations in milk calcium content have been found between population groups. For example, in comparison with the above data from the United States, milk calcium concentrations have been found to be lower (by approximately 20 mg/100 mL at 5 months of lactation) in mothers from the Gambia, but this difference appears to be genetic and not due to differences in total intake of calcium (Prentice et al., 1995; IOM, 1997).
Relative to the average amount of milk consumed by infants, there are three key studies based on weighing full-term infants before and after feeding (Butte et al., 1984; Allen et al., 1991; Heinig et al., 1993). While it has been noted that the volume of intake is somewhat lower during the first month of life than in subsequent months (Widdowson, 1965; Southgate et al., 1969; Lonnerdal, 1997) and that a number of factors contribute to variability in intake, an estimate of 780 mL/day is reasonable based on the data from the three test weighing studies. Therefore, given an intake of milk estimated to be 780 mL/day from the infant weighing studies and the average content of 259 ± 59 mg of calcium per liter, the intake of calcium for infants fed exclusively human milk is estimated to be 202 mg/day.
Childhood and Adolescence
Calcium deposition into bone is an ongoing process throughout childhood and into adolescence, reaching maximal accretion during the pubertal growth spurt. Measures of bone density in adolescent girls indicate that about 37 percent of total skeletal bone mass is achieved between pubertal stages 2 (mean age 11 years) and 4 (mean age 15 years), with an average daily calcium accretion rate of 300 to 400 mg/day (Matkovic et al., 1994). For growing children, bone modeling (i.e., formation over resorption) is the predominant skeletal process promoting longitudinal extension of the growth plate and periosteal expansion. Modeling requires mineralization; hence, calcium requirements are increased, particularly during neonatal and pubertal growth spurts. Approximately 40 percent of total skeletal bone mass is acquired within a relatively short window of 3 to 5 years, when gonadal steroids and growth hormone secretion are maximal (Weaver and Heaney, 2006b). During this time, bone formation far outpaces resorption and longitudinal growth, and consolidation of bone occurs. The most recent estimate of average calcium accretion is 92 to 210 mg/day calcium in 9- to 18-year-old boys and girls (Vatanparast et al., 2010), and bone calcium accretion can peak at 300 to 400 mg/day (Bailey et al., 2000).
During this developmental period, calcium absorption is maximal and variation in calcium intake accounts for 12 to 15 percent of the variance in calcium retention for both boys and girls. Increases in total calcium
transiently enhance bone mass (Lee et al., 1996; Matkovic et al., 2005). These effects disappear during or after cessation of increased calcium intake; final bone mass, measured in randomized trials of calcium supplementation during this period, did not differ between controls and calcium-supplemented individuals (Matkovic et al., 2005). However, this period of bone accretion determines adult bone mass, which, in turn, is a significant predictor of fracture risk late in life.
Young Adults
After puberty and throughout most of adulthood, bone formation and resorption are balanced. During this period, bone mass is consolidated, and calcium requirements are relatively stable. Peak bone mass, the maximum amount of bone that can be accumulated, is reached in early adulthood (Bonjour et al., 1994). The ability to attain peak bone mass is affected by genetic background and by lifestyle factors such as physical activity and total calcium intake. Specific skeletal sites have been found to reach peak bone mass at different ages, and bone mineral accretion has been reported to continue slowly into the third decade of life (Recker et al., 1992). Bone is a dynamic tissue, and a number of clinical studies suggest that increasing bone mass early in life has a transient effect, but does not confer protection against later bone loss and osteoporosis (Gafni and Baron, 2007). The calcium content of bone at maturity is approximately 1,200 g in women and 1,400 g in men (Ilich and Kerstetter, 2000; Anderson, 2001). In men, this level remains relatively constant until the onset of age-related bone loss later in life. In women, the level remains relatively constant until the onset of menopause. Although bone mass generally remains at a plateau during reproductive years, some studies have suggested that mean bone mass gradually reaches a plateau and then declines slowly with age.
Older Adults
Age-related bone loss, in both men and women, results when bone remodeling becomes uncoupled and bone resorption exceeds bone formation. However, the pathogenesis of bone loss is a multi-faceted process. The roles and interactions of various hormonal, genetic, and other factors in bone loss and risk for decreased bone health are not yet clear. Moreover, the ability of increased calcium intake to overcome the effects of bone loss related to menopause or normal aging continues to be debated.
In postmenopausal women, estrogen loss increases the rate of bone remodeling, characterized by an imbalance between osteoclast and osteoblast activity, resulting in irreversible bone loss (Riggs et al., 1998; Seeman, 2003). Estrogen loss can further accelerate bone loss through its effect on
decreased absorption of calcium and increased urinary loss of calcium (Nordin et al., 2004). Evidence suggests that remodeling in women becomes imbalanced just prior to, during, and immediately after menopause, when the rate of bone loss becomes more rapid. However, the rate of bone loss as a result of menopause varies greatly depending upon a number of factors, including genetics, body composition, other hormonal changes and endogenous production of estradiol.
The effects of lower estrogen levels on calcium balance continue to be debated. However, the principal effect of estrogen deficiency on the skeleton is increased bone resorption. The range of bone loss in the 7 to 10 years around the onset of menopause can range from 3 to 7 percent annually (Kenny and Prestwood, 2000). In women over age 65, the rate of bone loss slows again to 0.5 to 2 percent per year (Greenspan et al., 1994). Later in menopause—and in men over 70 years of age—if reduced calcium intake occurs, it contributes to a secondary form of hyperparathyroidism, which serves as a compensatory mechanism to maintain extracellular calcium balance. This compensation results in accelerated bone resorption, leading to a net loss of bone mass under these conditions.
For men over 65 years of age, the loss of bone is about 1 to 2 percent per year (Orwoll et al., 1990; Hannan et al., 1992). Additionally, reduced glomerular filtration rate is another factor associated with aging that affects renal conservation of calcium in both men and women (Goldschmied et al., 1975) and also leads to secondary hyperparathyroidism, which can cause significant bone loss. This is underscored by patients with renal disease who have renal osteodystrophy, now referred to as chronic kidney disease–mineral disorder (Demer and Tintut, 2010; Peacock, 2010).
Pregnancy and Lactation
Pregnancy
The fetal need for calcium is met by maternal physiological changes, primarily through increased calcium absorption. There is currently debate about whether calcium is also mobilized from maternal skeleton, as discussed in Chapter 4. In any case, calcium is actively transported across the placenta from mother to fetus, an essential activity to mineralizing the fetal skeleton. Calcium accretion in the developing fetus is low until the third trimester of pregnancy when the fetus requires about 200 to 250 mg/day calcium to sustain skeletal growth (Givens and Macy, 1933; Trotter and Hixon, 1974). Intestinal calcium absorption of the mother doubles beginning early in pregnancy—even though there is little calcium transfer to the embryo at this stage (Heaney and Skillman, 1971; Kovacs and Kronenberg, 1997)—and continues through late pregnancy (Kent et al., 1991). Overall,
relatively few studies have examined the effect of calcium supplementation on either fetal or maternal outcomes.
Maternal serum calcium falls during pregnancy (Pedersen et al., 1984), but this is likely not important from a physiological perspective in that it reflects the fall in serum albumin caused by plasma volume expansion and therefore does not imply calcium deficiency. Reports indicate that the concentration of ionized calcium remains normal during pregnancy (Frolich et al., 1992; Seely et al., 1997).
Pregnant women consuming moderate (800 to 1,000 mg/day [Gertner et al., 1986; Allen et al., 1991]) to high (1,950 mg/day [Cross et al., 1995]) levels of calcium are often hypercalciuric due to increased intestinal calcium absorption (i.e., absorptive hypercalciuria), and as such pregnancy itself can be a risk factor for kidney stones.
Within the developing human fetus, calcium metabolism is regulated differently from that of its mother. Serum calcium, ionized calcium, and phosphorus are raised above the maternal values, while PTH and calcitriol are low. The high calcium and phosphorus as well as the low levels of PTH all contribute to suppression of the renal 1α-hydroxylase and maintenance of low levels of calcitriol.
In adolescents, whose skeleton is still growing, pregnancy could theoretically reduce peak bone mass and increase the long-term risk of osteoporosis. Although most cross-sectional studies comparing BMD in teens early post-partum to never-pregnant teens (reviewed by Kovacs and Kronenberg, 1997) suggest that BMD or bone mass after adolescent pregnancy is not adversely affected, a few smaller associational studies report that adolescent age at first pregnancy is associated with lower BMD in the adult (Sowers et al., 1985, 1992; Fox et al., 1993). Chantry et al. (2004) analyzed data from the Third National Health and Nutrition Examination Survey (NHANES III) on BMD as measured by dual-energy X-ray absorptiometry (DXA) for 819 women ages 20 to 25 years and found that women pregnant as adolescents had the same BMD as nulliparous women and women pregnant as adults.
Lactation
Breast milk calcium content is homeostatically regulated, and maternal calcium intake does not appear to alter the breast milk calcium content (Kalkwarf et al., 1997; Jarjou et al., 2006). Generally, human breast milk will provide two to three times the amount of calcium to the infant during 6 months of lactation as the pregnant woman will have provided to the fetus during the preceding 9 months of pregnancy. To meet the calcium demands of pregnancy, key physiological changes in the female will also occur, but the adaptations differ from those that take place during pregnancy
(Kovacs and Kronenberg, 1997; Kalkwarf, 1999; Prentice, 2003; Kovacs, 2005, 2008; Kovacs and Kronenberg, 2008). Maternal bone resorption is markedly up-regulated (Specker et al., 1994; Kalkwarf et al., 1997), and it appears that most of the calcium present in milk derives from the maternal skeleton. Maternal BMD can decline 5 to 10 percent during the 2- to 6-month time period of exclusive breastfeeding. However, it normally returns to baseline during the 6 to 12 months post-weaning (Kalkwarf, 1999). Thus, in the long term, a history of lactation does not appear to increase the risk of low BMD or osteoporosis.
The physiological responses appear to be similar for lactating adolescents. In fact, an analysis using NHANES III data compared BMD from DXA measures in 819 women ages 20 to 25 years (Chantry et al., 2004), and found that young women who had breast-fed as adolescents had higher BMD than those who had not breast-fed, even after controlling for obstetrical variables. This suggests that the normal loss of BMD during lactation and the post-lactation recovery occurs in adolescents as well.
BONE MASS MEASURES ASSOCIATED WITH CALCIUM
Several key bone mass measures are commonly used in the context of calcium nutriture and related health outcomes. The accumulation and level of bone mass can be determined using the calcium balance method or, alternatively, the measurement of BMC or BMD based on DXA. The latter method relies on the assumption that about 32 percent of the measured bone mineral is calcium (Ellis et al., 1996; Ma et al., 1999). These methods are described below.
Calcium Balance
Calcium balance (positive, neutral, or negative) is the measure derived by taking the difference between the total intake and the sum of the urinary and endogenous fecal excretion. Balance studies embody a metabolic approach to examining the relationship between calcium intake and calcium retention and are based on the assumption that the body retains the amount of calcium that is needed. As such, measures of calcium balance (or of “calcium retention”) can reflect conditions of bone accretion, bone maintenance, or bone loss. Calcium balance analyses involve measuring as precisely as possible the intake and the output of calcium. Output is usually reflected by urine and fecal calcium; sweat calcium is not usually measured, but its inclusion adds to the precision of the estimates. Calcium balance studies are expensive and require considerable subject cooperation owing to the prolonged stays in metabolic wards. Measures of calcium balance have limitations and are generally cross–sectional in nature, and their
precision is difficult to ascertain. However, if well conducted, they provide valuable information on calcium requirements relative to the typical intake of the population under study. Long-term balance studies for calcium are generally not carried out because of the difficult study protocol. Calcium balance can also be estimated by using stable isotopes to trace the amount of calcium absorbed, usually in infants from a single feeding (Abrams, 2006).
Calcium balance outcomes that are positive are indicative of calcium accretion and are sometimes referred to as net calcium retention; neutral balance suggests maintenance of bone, and negative balance indicates bone loss. The relevance of the calcium balance state varies depending upon developmental stage. Infancy through late adolescence are characterized by positive calcium balance. In female adolescents and adults, even within the normal menstrual cycle, there are measurable fluctuations in calcium balance owing to the effects of fluctuating sex steroid levels and other factors on the basal rates of bone formation and resorption. Later in life, menopause and age-related bone loss lead to a net loss as a result of calcium due to enhanced bone resorption.
In the 1997 IOM report that focused on calcium DRIs (IOM, 1997), metabolic studies of calcium balance were used to obtain data on the relationship between calcium intakes and retention, from which a non-linear regression model was developed; from this was derived an intake of calcium that would be adequate to attain a predetermined desirable calcium retention.4 The approach used in 1997 was a refinement of an earlier approach suggested to determine the point at which additional calcium does not significantly increase calcium retention, called the plateau intake (Spencer et al., 1984; Matkovic and Heaney, 1992).
The balance studies included in the 1997 IOM report (IOM, 1997) met
|
4 |
A footnote to the 1997 IOM report (IOM, 1997) explains the decision not to base considerations on maximal calcium retention: The 1997 committee intended to use a recently described statistical model (Jackman et al., 1997) to estimate an intake necessary to support maximal calcium retention and from which to derive an EAR, and did so in the prepublication of the report. In the original paper by Jackman et al. (1997), an estimate was made of the lowest level of calcium intake that was statistically indistinguishable from 100 percent maximal retention in some individuals. However, the Standing Committee on the Scientific Evaluation of Dietary Reference Intakes (DRI Committee) reviewed the approach in the pre-publication of the report and adopted a different interpretation of the data for the purpose of establishing an AI. The 1997 committee was subsequently advised that there were both statistical and biological concerns with the application of the percent maximal retention model (presented in Appendix E of the 1997 IOM report [IOM, 1997]). The final print of the 1997 report retained the statistical model described by Jackman et al. (1997), but applied it to determine, from the same calcium balance data as was used in the pre-publication report, an estimate of the calcium intake that is sufficient to achieve a defined, desirable level of calcium retention specific to the age groups considered. |
criteria that included the following: subjects had a wide range of calcium intakes, as variability in retention increases at higher intakes; the balance studies were initiated at least 7 days after starting the diet in order for subjects to approach a steady state, as observed by Dawson-Hughes et al. (1988); and, where possible, the adult balance studies included were only for subjects who were consuming calcium at their usual intakes, unless otherwise indicated. By selecting studies conducted on such subjects, the 1997 committee concluded that it obviated the concern about whether the bone remodeling transient (i.e., the temporary alteration in the balance between bone formation and bone resorption) might introduce bias in the calcium retentions observed (IOM, 1997). Such selection was not possible in studies in children who were randomized to one of two calcium intakes. However, in children, the impact of the bone remodeling transient related to changing intake is overshadowed by their rapid and constantly changing rates of calcium accretion (i.e., their modeling and remodeling rates are not in steady state, even without an intake change).
For the 1997 DRI development (IOM, 1997), the non-linear regression model describing the relationship between calcium intake and retention was solved to obtain a predetermined desirable calcium retention that was specific for each age group. According to the report, the major limitation of the data available was that bone mineral accretion during growth had not yet been studied over a wide range of calcium intakes. Overall, the committee expressed concern about the uncertainties in the methods inherent in balance studies.
Specifics about calcium balance studies that relate to DRI development are provided in Chapter 4, but, as background the recent work of Hunt and Johnson (2007) offers some remedy for the uncertainties surrounding the precision of balance studies. Hunt and Johnson (2007) examined data from 155 subjects—men and women between the ages of 20 and 75 years—who took part in 19 feeding studies conducted at one site (Grand Forks Human Nutrition Research Unit) between 1976 and 1995 in a metabolic unit under carefully controlled conditions.
In their overall analysis, the relationship between intake and output was examined by fitting random coefficient models. Rather than model calcium retention compared with calcium intake by using the Jackman et al. (1997) model, as was done in the 1997 DRI report (IOM, 1997), Hunt and Johnson (2007) modeled output rather than retention to avoid confounding in the precision of estimates that would be caused by including intake as a component of the dependent variable. In the Hunt and Johnson (2007) analysis, the data summary did not show non-linearity and therefore did not justify the use of a more complex non-linear model. The authors noted that the coefficients of the 1997 approach appeared to be greatly influenced by data points above the 99th percentile of daily
calcium intake and pointed out that the data in their model reflected typical calcium intake between the 5th and approximately 95th percentiles for all boys and men 9 or more years of age, and between the approximately 25th and greater than 99th percentiles for all girls and women 9 or more years of age.
Hunt and Johnson (2007) also pointed out that most (but not all) studies with adults that indicate a positive influence of high total calcium in reducing the rate of bone remodeling were confounded by the presence of vitamin D as an experimental co-variable. In their study, the metabolic diets were similar to the estimated median intake of vitamin D by free-living young women. In short, the analysis may provide a reasonable approach for extracting meaningful data from calcium balance studies that are often confounded by multiple dietary factors. At this point, factorial methods should be briefly noted as the determination of calcium requirements has also made use of a factorial approach as noted in the 1997 DRI report (IOM, 1997). The factorial approach allows the estimate of an intake level that achieves the measured levels of calcium accretion/retention. The method combines estimates of losses of calcium via its main routes in apparently healthy individuals and then assumes that these losses represent the degree to which calcium intake, as corrected by estimated absorption, is required to balance these losses. The weakness in this method is that it is unusual for all of the necessary measurements to be obtained within a single study. Therefore, most calculations using the factorial approach are compiled from data in different studies and thus in different subjects; this can introduce considerable variation and confound the outcomes. This approach, as carried out in the 1997 IOM report on DRIs for calcium and vitamin D (IOM, 1997), where the interest was in desirable retention, is illustrated in Table 2-1.
Bone Mineral Content and Bone Mineral Density
BMC is the amount of mineral at a particular skeletal site, such as the femoral neck, lumbar spine, or total body. BMC is correctly a three-dimensional measurement, but when it is commonly measured by DXA, a cross-section of bone is analyzed, and the two-dimensional output is a real BMD (i.e., BMC divided by the area of the scanned region). True measurements of BMC (volumetric BMD) can be determined non-invasively by computed tomography. Throughout this report, the term “BMD” generally means areal BMD unless specified as volumetric BMD. Most importantly, any of these measures are strong predictors of fracture risk (IOM, 1997). Bone density studies can be considered to reflect average intakes of calcium over a long period of time. When available, such data likely provide
TABLE 2-1 1997 DRI Factorial Approach for Determining Calcium Requirements During Peak Calcium Accretion in White Adolescents
|
|
Number of Observations |
Female Calcium Requirements (mg/day) |
Number of Observations |
Male Calcium Requirements (mg/day) |
|
Peak calcium accretion |
507 |
212a |
471 |
282a |
|
Urinary losses |
28 |
106b |
14 |
127c |
|
Endogenous fecal calcium |
14 |
112d |
3 |
108e |
|
Sweat Losses |
|
55f |
|
55f |
|
Total |
|
485 |
|
572 |
|
Total adjusted for absorptiong |
|
1,276 |
|
1,505 |
|
aMartin et al. (1997) using peak BMC velocity. bGreger et al. (1978); Weaver et al. (1995). cMatkovic (1991). dWastney et al. (1996) for mean age 13 years on calcium intakes of 1,330 mg/day. eAbrams et al. (1992). fTaken from Peacock (1991) who adjusted the adult data of Charles et al. (1983) for body weight. gAbsorption is 38% for mean age 13 years on calcium intakes of 1,330 mg/day (Wastney et al., 1996). |
||||
a better snapshot of long-term calcium intake than does the combination of accretion/retention data.
In children, change in BMC is a useful indicator of calcium retention; change in BMD is less suitable, because it overestimates mineral content as a result of changes in skeletal size from growth (IOM, 1997). In adults, with their generally stable skeletal size, changes in either BMD or BMC are useful measures. In the context of longitudinal calcium intervention trials that measure change in BMC, the measures can provide data on the long-term impact of calcium intake not only on the total skeleton, but also on skeletal sites that are subject to osteoporotic fracture (IOM, 1997). However, because DXA does not distinguish between calcium that is within bone and calcium on the surface (e.g., osteophytes, calcifications in other tissues) or within blood vessels (e.g., calcified aorta), an increase in BMC or BMD, particularly in the spine, may result in false positive readings suggesting high bone mass (Banks et al., 1994).
In DXA, fan beam dual-energy X-ray beams are used to measure bone mass, with correction for overlying soft tissue. Data are converted to BMC and the area represented is measured. The BMD measurement is annotated in grams of mineral per square centimeter. BMC represents the amount of mineral in a volume of bone without consideration of total body
size. It is thus independent of growth. The DXA method is also limited by excessive soft tissue as present in massively obese individuals. Dual-energy computed tomography measurements, which are much more expensive and require larger X-ray doses can provide density as well as volumetric determinants and are useful for estimating the entire mineral component.
Direct estimation of calcium balance in older adults by BMD is highly dependent on other factors besides calcium intake, such as serum levels of estrogen and PTH, intake of other nutrients (e.g., phosphorus and sodium), as well as adequate intestinal absorption and normal kidney function. Indeed, bone remodeling is not directly regulated by calcium, although it can suppress PTH-induced increases in bone resorption under certain conditions. Circumstances that enhance bone resorption, such as estrogen deficiency, or glucocorticoid use, alter the organic matrix and reduce the thickness and density of trabeculae, independent of calcium intake. In short, density measurements do not directly reflect calcium stores.
OTHER FACTORS RELATED TO CALCIUM NUTRITURE
As described above, not all calcium consumed is absorbed once it enters the gut. In general, the efficiency of calcium absorption is in reverse proportion to the amount of calcium consumed at any one time. Other factors also affect the amount of calcium available to the body.
Bioavailability of Calcium
Humans absorb about 30 percent of the calcium present in foods, but this varies with the type of food consumed. Bioavailability is generally increased when calcium is well solubilized and inhibited in the presence of agents that bind calcium or form insoluble calcium salts. The absorption of calcium is about 30 percent from dairy and fortified foods (e.g., orange juice, tofu, soy milk) and nearly twice as high from certain green vegetables (bok choy, broccoli, and kale). If a food contains compounds that bind calcium or otherwise interfere with calcium absorption, such as oxalic acid and phytic acid, then the food source is considered to be a poor source of calcium. Foods with high levels of oxalic acid include spinach, collard greens, sweet potatoes, rhubarb, and beans. Among the foods high in phytic acid are fiber-containing whole-grain products and wheat bran, beans, seeds, nuts, and soy isolates. The extent to which these compounds affect calcium absorption varies, and food combinations affect overall absorption efficiency. Eating spinach with milk at the same time reduces the absorption of the calcium in the milk (Weaver and Heaney, 1991); in contrast, wheat products (with the exception of wheat bran) do not appear
to have a negative impact on calcium absorption (Weaver et al., 1991).5 Vegan sources of calcium may be less bioavailable and, in turn, problematic for ensuring adequate calcium intake (Weaver, 2009).
The calcium salts most commonly used as supplements or food fortificants exhibit similar absorbability when tested in pure chemical form (Rafferty et al., 2007), but the absorbability of calcium from pharmaceutical preparations can fall short of predictions from studies of pure salts (Weaver and Heaney, 2006a). Calcium citrate appears to be better absorbed than calcium carbonate (Harvey et al., 1988); when they are taken with food, however, some researchers (Heaney et al., 1999), but not all (Heller et al., 2000), suggest comparable bioavailability of the two forms of calcium.
Factors in the Diet
Protein
Protein intake stimulates acid release in the stomach, and this, in turn, enhances calcium absorption. However, it has long been known that protein also increases urinary calcium excretion. The effect of protein on calcium retention and hence bone health has been controversial (IOM, 1997). Several observational and clinical studies have examined the effect of high-protein diets on bone (Shapses and Sukumar, 2010). Over a 4-year period in the Framingham Osteoporosis Study (Hannan et al., 2000), a higher protein intake (84 to 152 g/day), was positively associated with change in femoral neck and spine BMD (Shapese and Sukumar, 2010). Additionally, NHANES II suggested a positive association between femoral neck BMD and total protein intake (> 75 g/day) (Kerstetter et al., 2000; Shapses and Sukumar, 2010). In contrast, some epidemiological studies suggest that high protein diets reduce bone mass; this has been attributed to a higher acid load, leading to a buffering response by the skeleton and greater urinary calcium excretion. A recent meta-analysis (Darling et al., 2009) concluded that there is a small benefit of protein for bone health, but the benefit may not necessarily translate into reduced fracture risk in the long term. Shapses and Sukumar (2010) suggested that the currently available data would lead to the conclusion that there is a beneficial effect of increasing protein intake on bone in older individuals who normally have a habitually low intake of protein.
|
5 |
Available online at http://ods.od.nih.gov/factsheets/calcium/ (accessed July 23, 2010). |
Foods and Food Components
Sodium and potassium in the diet may also affect calcium nutriture. High intakes of sodium increase urinary calcium excretion. In contrast, adding more potassium to a high-sodium diet might help decrease calcium excretion, particularly in postmenopausal women (Sellmeyer et al., 2002; IOM, 2005).
Alcohol intake can affect calcium nutriture by reducing calcium absorption (Hirsch and Peng, 1996), although the amount of alcohol required to cause an effect and whether moderate alcohol consumption is helpful or harmful to bone are unknown.
Caffeine from coffee and tea modestly increases calcium excretion and reduces absorption (Heaney and Recker, 1982; Bergman et al., 1990). Two studies have indicated that caffeine intake (two to three or more cups of coffee per day) will result in bone loss, but only in individuals with low milk or low total calcium intake (Barrett-Connor et al., 1994; Harris and Dawson-Hughes, 1994).
Phosphate is also of interest. Food phosphate is a mixture of inorganic and organic forms, and there is no evidence that its absorption efficiency varies with dietary intake. A portion of phosphorus absorption is due to saturable, active transport facilitated by calcitriol. However, fractional phosphorus absorption is virtually constant across a broad range of intakes suggesting that absorption occurs primarily by a passive, concentration-dependent process. Several observational studies have suggested that the consumption of carbonated soft drinks with high levels of phosphate is associated with reduced bone mass and increased fracture risk, but it is likely that the effect is due to replacing milk with soda, rather than to phosphorus itself (Calvo, 1993; Heaney and Rafferty, 2001).
REFERENCES
Aaron, J. E., J. C. Gallagher, J. Anderson, L. Stasiak, E. B. Longton, B. E. Nordin and M. Nicholson. 1974. Frequency of osteomalacia and osteoporosis in fractures of the proximal femur. Lancet 1(7851): 229-33.
Abrams, S. A., J. B. Sidbury, J. Muenzer, N. V. Esteban, N. E. Vieira and A. L. Yergey. 1991. Stable isotopic measurement of endogenous fecal calcium excretion in children. Journal of Pediatric Gastroenterology and Nutrition 12(4): 469-73.
Abrams, S. A., N. V. Esteban, N. E. Vieira, J. B. Sidbury, B. L. Specker and A. L. Yergey. 1992. Developmental changes in calcium kinetics in children assessed using stable isotopes. Journal of Bone and Mineral Research 7(3): 287-93.
Abrams, S. A. and J. E. Stuff. 1994. Calcium metabolism in girls: current dietary intakes lead to low rates of calcium absorption and retention during puberty. American Journal of Clinical Nutrition 60(5): 739-43.
Abrams, S. A., J. Wen and J. E. Stuff. 1997. Absorption of calcium, zinc, and iron from breast milk by five- to seven-month-old infants. Pediatric Research 41(3): 384-90.
Abrams, S. A., K. C. Copeland, S. K. Gunn, C. M. Gundberg, K. O. Klein and K. J. Ellis. 2000. Calcium absorption, bone mass accumulation, and kinetics increase during early pubertal development in girls. Journal of Clinical Endocrinology and Metabolism 85(5): 1805-9.
Abrams, S. A., I. J. Griffin and P. M. Davila. 2002. Calcium and zinc absorption from lactose-containing and lactose-free infant formulas. American Journal of Clinical Nutrition 76(2): 442-6.
Abrams, S. A. 2006. Building bones in babies: can and should we exceed the human milk-fed infant’s rate of bone calcium accretion? Nutrition Reviews 64(11): 487-94.
Abrams, S. A. 2010. Calcium absorption in infants and small children: methods of determination and recent findings. Nutrients 2(4): 474-80.
Alevizaki, C. C., D. G. Ikkos and P. Singhelakis. 1973. Progressive decrease of true intestinal calcium absorption with age in normal man. Journal of Nuclear Medicine 14(10): 760-2.
Allen, J. C., R. P. Keller, P. Archer and M. C. Neville. 1991. Studies in human lactation: milk composition and daily secretion rates of macronutrients in the first year of lactation. American Journal of Clinical Nutrition 54(1): 69-80.
Aloia, J. F., D. G. Chen, J. K. Yeh and H. Chen. 2010. Serum vitamin D metabolites and intestinal calcium absorption efficiency in women. American Journal of Clinical Nutrition 92(4): 835-40.
Anderson, J. 1961. Metabolic diseases affecting the locomotor system. III. Investigations of biochemical changes in osteomalacia and osteoporosis. Annals of Physical Medicine 6: 1-9.
Anderson, J. J. 2001. Calcium requirements during adolescence to maximize bone health. Journal of the American College of Nutrition 20(2 Suppl): 186S-91S.
Atkinson, S. A., B. P. Alston-Mills, B. Lonnerdal, M. C. Neville and M. P. Thompson. 1995. Major minerals and ionic constituents of human and bovine milk. In Handbook of Milk Composition, edited by R. J. Jensen. San Diego, CA: Academic Press. Pp. 593-619.
Avioli, L. V., J. E. McDonald and S. W. Lee. 1965. The influence of age on the intestinal absorption of 47-Ca absorption in post-menopausal osteoporosis. Journal of Clinical Investigation 44(12): 1960-7.
Bailey, D. A., A. D. Martin, H. A. McKay, S. Whiting and R. Mirwald. 2000. Calcium accretion in girls and boys during puberty: a longitudinal analysis. Journal of Bone and Mineral Research 15(11): 2245-50.
Bailey, R. L., K. W. Dodd, J. A. Goldman, J. J. Gahche, J. T. Dwyer, A. J. Moshfegh, C. T. Sempos and M. F. Picciano. 2010. Estimation of total usual calcium and vitamin D intake in the United States. Journal of Nutrition 140(4): 817-22.
Banks, L. M., B. Lees, J. E. MacSweeney and J. C. Stevenson. 1994. Effect of degenerative spinal and aortic calcification on bone density measurements in post-menopausal women: links between osteoporosis and cardiovascular disease? European Journal of Clinical Investigation 24(12): 813-7.
Barrett-Connor, E., J. C. Chang and S. L. Edelstein. 1994. Coffee-associated osteoporosis offset by daily milk consumption. The Rancho Bernardo Study. JAMA 271(4): 280-3.
Bergman, E. A., L. K. Massey, K. J. Wise and D. J. Sherrard. 1990. Effects of dietary caffeine on renal handling of minerals in adult women. Life Sciences 47(6): 557-64.
Bo-Linn, G. W., G. R. Davis, D. J. Buddrus, S. G. Morawski, C. Santa Ana and J. S. Fordtran. 1984. An evaluation of the importance of gastric acid secretion in the absorption of dietary calcium. Journal of Clinical Investigation 73(3): 640-7.
Bonjour, J. P., G. Theintz, F. Law, D. Slosman and R. Rizzoli. 1994. Peak bone mass. Osteoporosis International 4(Suppl 1): 7-13.
Bullamore, J. R., R. Wilkinson, J. C. Gallagher, B. E. Nordin and D. H. Marshall. 1970. Effect of age on calcium absorption. Lancet 2(7672): 535-7.
Butte, N. F., C. Garza, E. O. Smith and B. L. Nichols. 1984. Human milk intake and growth in exclusively breast-fed infants. Journal of Pediatrics 104(2): 187-95.
Calvo, M. S. 1993. Dietary phosphorus, calcium metabolism and bone. Journal of Nutrition 123(9): 1627-33.
Calvo, M. S., S. J. Whiting and C. N. Barton. 2004. Vitamin D fortification in the United States and Canada: current status and data needs. American Journal of Clinical Nutrition 80(6 Suppl): 1710S-6S.
Campbell, S. B., D. J. Macfarlane, S. J. Fleming and F. A. Khafagi. 1994. Increased skeletal uptake of Tc-99m methylene diphosphonate in milk-alkali syndrome. Clinical Nuclear Medicine 19(3): 207-11.
Carr, C. J. and R. F. Shangraw. 1987. Nutritional and pharmaceutical aspects of calcium supplementation. American Pharmacy NS27(2): 49-50, 54-7.
Chantry, C. J., P. Auinger and R. S. Byrd. 2004. Lactation among adolescent mothers and subsequent bone mineral density. Archives of Pediatrics and Adolescent Medicine 158(7): 650-6.
Chapuy, M. C., M. E. Arlot, F. Duboeuf, J. Brun, B. Crouzet, S. Arnaud, P. D. Delmas and P. J. Meunier. 1992. Vitamin D3 and calcium to prevent hip fractures in the elderly women. New England Journal of Medicine 327(23): 1637-42.
Charles, P., F. T. Jensen, L. Mosekilde and H. H. Hansen. 1983. Calcium metabolism evaluated by 47Ca kinetics: estimation of dermal calcium loss. Clinical Science (London) 65(4): 415-22.
Cifuentes, M., A. B. Morano, H. A. Chowdhury and S. A. Shapses. 2002. Energy restriction reduces fractional calcium absorption in mature obese and lean rats. Journal of Nutrition 132(9): 2660-6.
Cross, N. A., L. S. Hillman, S. H. Allen, G. F. Krause and N. E. Vieira. 1995. Calcium homeostasis and bone metabolism during pregnancy, lactation, and postweaning: a longitudinal study. American Journal of Clinical Nutrition 61(3): 514-23.
Darling, A. L., D. J. Millward, D. J. Torgerson, C. E. Hewitt and S. A. Lanham-New. 2009. Dietary protein and bone health: a systematic review and meta-analysis. American Journal of Clinical Nutrition 90(6): 1674-92.
Dawson-Hughes, B., D. T. Stern, C. C. Shipp and H. M. Rasmussen. 1988. Effect of lowering dietary calcium intake on fractional whole body calcium retention. Journal of Clinical Endocrinology and Metabolism 67(1): 62-8.
Dawson-Hughes, B., S. Harris, C. Kramich, G. Dallal and H. M. Rasmussen. 1993. Calcium retention and hormone levels in black and white women on high- and low-calcium diets. Journal of Bone and Mineral Research 8(7): 779-87.
Demer, L. and Y. Tintut. 2010. The bone-vascular axis in chronic kidney disease. Current Opinion in Nephrology and Hypertension 19(4): 349-53.
Eastell, R., A. L. Yergey, N. E. Vieira, S. L. Cedel, R. Kumar and B. L. Riggs. 1991. Interrelationship among vitamin D metabolism, true calcium absorption, parathyroid function, and age in women: evidence of an age-related intestinal resistance to 1,25-dihydroxyvitamin D action. Journal of Bone and Mineral Research 6(2): 125-32.
Ebeling, P. R., M. E. Sandgren, E. P. DiMagno, A. W. Lane, H. F. DeLuca and B. L. Riggs. 1992. Evidence of an age-related decrease in intestinal responsiveness to vitamin D: relationship between serum 1,25-dihydroxyvitamin D3 and intestinal vitamin D receptor concentrations in normal women. Journal of Clinical Endocrinology and Metabolism 75(1): 176-82.
Ebeling, P. R., L. M. Atley, J. R. Guthrie, H. G. Burger, L. Dennerstein, J. L. Hopper and J. D. Wark. 1996. Bone turnover markers and bone density across the menopausal transition. Journal of Clinical Endocrinology and Metabolism 81(9): 3366-71.
Ellis, K. J., R. J. Shypailo, A. Hergenroeder, M. Perez and S. Abrams. 1996. Total body calcium and bone mineral content: comparison of dual-energy X-ray absorptiometry with neutron activation analysis. Journal of Bone and Mineral Research 11(6): 843-8.
Favus, M. J. 2008. Mineral and bone homeostasis. In Cecil Medicine, 23rd Edition, edited by L. Goldman and D. Ausiello. Philadelphia, PA: Saunders Elsevier. Pp. 1871-8.
Finkelstein, J. S., S. E. Brockwell, V. Mehta, G. A. Greendale, M. R. Sowers, B. Ettinger, J. C. Lo, J. M. Johnston, J. A. Cauley, M. E. Danielson and R. M. Neer. 2008. Bone mineral density changes during the menopause transition in a multiethnic cohort of women. Journal of Clinical Endocrinology and Metabolism 93(3): 861-8.
Fomon, S. J. and S. E. Nelson. 1993. Calcium, phosphorus, magnesium, and sulfur. In Nutrition of Normal Infants, edited by S. J. Fomon. St. Louis: Mosby-Year Book, Inc. Pp. 192-216.
Fox, K. M., J. Magaziner, R. Sherwin, J. C. Scott, C. C. Plato, M. Nevitt and S. Cummings. 1993. Reproductive correlates of bone mass in elderly women. Study of Osteoporotic Fractures Research Group. Journal of Bone and Mineral Research 8(8): 901-8.
Frolich, A., M. Rudnicki, T. Storm, N. Rasmussen and L. Hegedus. 1992. Impaired 1,25-dihydroxyvitamin D production in pregnancy-induced hypertension. European Journal of Obstetrics, Gynecology, and Reproductive Biology 47(1): 25-9.
Gafni, R. I. and J. Baron. 2007. Childhood bone mass acquisition and peak bone mass may not be important determinants of bone mass in late adulthood. Pediatrics 119(Suppl 2): S131-6.
Gallagher, J. C., B. L. Riggs, J. Eisman, A. Hamstra, S. B. Arnaud and H. F. DeLuca. 1979. Intestinal calcium absorption and serum vitamin D metabolites in normal subjects and osteoporotic patients: effect of age and dietary calcium. Journal of Clinical Investigation 64(3): 729-36.
Gallagher, J. C., B. L. Riggs and H. F. DeLuca. 1980. Effect of estrogen on calcium absorption and serum vitamin D metabolites in postmenopausal osteoporosis. Journal of Clinical Endocrinology and Metabolism 51(6): 1359-64.
Gallagher, J. C., P. B. Rapuri, G. Haynatzki and J. R. Detter. 2002. Effect of discontinuation of estrogen, calcitriol, and the combination of both on bone density and bone markers. Journal of Clinical Endocrinology and Metabolism 87(11): 4914-23.
Garnero, P., E. Hausherr, M. C. Chapuy, C. Marcelli, H. Grandjean, C. Muller, C. Cormier, G. Breart, P. J. Meunier and P. D. Delmas. 1996. Markers of bone resorption predict hip fracture in elderly women: the EPIDOS Prospective Study. Journal of Bone and Mineral Research 11(10): 1531-8.
Gertner, J. M., D. R. Coustan, A. S. Kliger, L. E. Mallette, N. Ravin and A. E. Broadus. 1986. Pregnancy as state of physiologic absorptive hypercalciuria. American Journal of Medicine 81(3): 451-6.
Ghishan, F. K., J. T. Jenkins and M. K. Younoszai. 1980. Maturation of calcium transport in the rat small and large intestine. Journal of Nutrition 110(8): 1622-8.
Ghishan, F. K., P. Parker, S. Nichols and A. Hoyumpa. 1984. Kinetics of intestinal calcium transport during maturation in rats. Pediatric Research 18(3): 235-9.
Givens, M. H. and I. G. Macy. 1933. The chemical composition of the human fetus. Journal of Biological Chemistry 102(1): 7-17.
Goldschmied, A., B. Modan, R. A. Greenberg, S. Zurkowski and M. Modan. 1975. Urinary calcium excretion in relation to kidney function in the adult. Journal of the American Geriatrics Society 23(4): 155-60.
Greenspan, S. L., L. A. Maitland, E. R. Myers, M. B. Krasnow and T. H. Kido. 1994. Femoral bone loss progresses with age: a longitudinal study in women over age 65. Journal of Bone and Mineral Research 9(12): 1959-65.
Greger, J. L., P. Baligar, R. P. Abernathy, O. A. Bennett and T. Peterson. 1978. Calcium, magnesium, phosphorus, copper, and manganese balance in adolescent females. American Journal of Clinical Nutrition 31(1): 117-21.
Guyton, A. C. and J. E. Hall, Eds. (2001). Textbook in Medical Physiology, 10th Edition. Philadelphia, PA: W.B. Saunders.
Hadjidakis, D. J. and I. I. Androulakis. 2006. Bone Remodeling. Annals of the New York Academy of Sciences 1092(Women’s Health and Disease: Gynecologic, Endocrine, and Reproductive Issues): 385-96.
Halloran, B. P. and H. F. DeLuca. 1980. Calcium transport in small intestine during pregnancy and lactation. American Journal of Physiology 239(1): E64-8.
Hannan, M. T., D. T. Felson and J. J. Anderson. 1992. Bone mineral density in elderly men and women: results from the Framingham Osteoporosis Study. Journal of Bone and Mineral Research 7(5): 547-53.
Hannan, M. T., K. L. Tucker, B. Dawson-Hughes, L. A. Cupples, D. T. Felson and D. P. Kiel. 2000. Effect of dietary protein on bone loss in elderly men and women: the Framingham Osteoporosis Study. Journal of Bone and Mineral Research 15(12): 2504-12.
Harris, S. S. and B. Dawson-Hughes. 1994. Caffeine and bone loss in healthy postmenopausal women. American Journal of Clinical Nutrition 60(4): 573-8.
Harvey, J. A., M. M. Zobitz and C. Y. Pak. 1988. Dose dependency of calcium absorption: a comparison of calcium carbonate and calcium citrate. Journal of Bone and Mineral Research 3(3): 253-8.
Heaney, R. P. and T. G. Skillman. 1971. Calcium metabolism in normal human pregnancy. Journal of Clinical Endocrinology and Metabolism 33(4): 661-70.
Heaney, R. P., P. D. Saville and R. R. Recker. 1975. Calcium absorption as a function of calcium intake. Journal of Laboratory and Clinical Medicine 85(6): 881-90.
Heaney, R. P. and R. R. Recker. 1982. Effects of nitrogen, phosphorus, and caffeine on calcium balance in women. Journal of Laboratory and Clinical Medicine 99(1): 46-55.
Heaney, R. P., R. R. Recker, M. R. Stegman and A. J. Moy. 1989. Calcium absorption in women: relationships to calcium intake, estrogen status, and age. Journal of Bone and Mineral Research 4(4): 469-75.
Heaney, R. P. and R. R. Recker. 1994. Determinants of endogenous fecal calcium in healthy women. Journal of Bone and Mineral Research 9(10): 1621-7.
Heaney, R. P., M. S. Dowell and M. J. Barger-Lux. 1999. Absorption of calcium as the carbonate and citrate salts, with some observations on method. Osteoporosis International 9(1): 19-23.
Heaney, R. P., M. S. Dowell, J. Bierman, C. A. Hale and A. Bendich. 2001. Absorbability and cost effectiveness in calcium supplementation. Journal of the American College of Nutrition 20(3): 239-46.
Heaney, R. P. and K. Rafferty. 2001. Carbonated beverages and urinary calcium excretion. American Journal of Clinical Nutrition 74(3): 343-7.
Heaney, R. P. 2003. Is the paradigm shifting? Bone 33(4): 457-65.
Heinig, M. J., L. A. Nommsen, J. M. Peerson, B. Lonnerdal and K. G. Dewey. 1993. Energy and protein intakes of breast-fed and formula-fed infants during the first year of life and their association with growth velocity: the DARLING Study. American Journal of Clinical Nutrition 58(2): 152-61.
Heller, H. J., L. G. Greer, S. D. Haynes, J. R. Poindexter and C. Y. Pak. 2000. Pharmacokinetic and pharmacodynamic comparison of two calcium supplements in postmenopausal women. Journal of Clinical Pharmacology 40(11): 1237-44.
Hicks, P. D., K. M. Hawthorne, J. Marunyzy, C. Berseth, J. Heubi and S. A. Abrams. 2010. Similar calcium status is present in infants fed formula with and without prebiotics. Presented at Pediatric Academic Societies (PAS). Vancouver, British Columbia.
Hirsch, P. E. and T. C. Peng. 1996. Effects of alcohol on calcium homeostasis and bone. In Calcium and Phosphorus in Health and Disease, edited by J. Anderson and S. Garner. Boca Raton, FL: CRC Press.
Hoenderop, J. G., D. Muller, M. Suzuki, C. H. van Os and R. J. Bindels. 2000. Epithelial calcium channel: gate-keeper of active calcium reabsorption. Current Opinion in Nephrology and Hypertension 9(4): 335-40.
Hunt, J. N. and C. Johnson. 1983. Relation between gastric secretion of acid and urinary excretion of calcium after oral supplements of calcium. Digestive Diseases and Sciences 28(5): 417-21.
Hunt, C. D. and L. K. Johnson. 2007. Calcium requirements: new estimations for men and women by cross–sectional statistical analyses of calcium balance data from metabolic studies. American Journal of Clinical Nutrition 86(4): 1054-63.
Ilich, J. Z. and J. E. Kerstetter. 2000. Nutrition in bone health revisited: a story beyond calcium. Journal of the American College of Nutrition 19(6): 715-37.
IOM (Institute of Medicine). 1997. Dietary Reference Intakes for Calcium, Phosphorus, Magnesium, Vitamin D, and Fluoride. Washington, DC: National Academy Press.
IOM. 2005. Dietary Reference Intakes for Water, Potassium, Sodium, Chloride, and Sulfate. Washington, DC: The National Academies Press.
Ireland, P. and J. S. Fordtran. 1973. Effect of dietary calcium and age on jejunal calcium absorption in humans studied by intestinal perfusion. Journal of Clinical Investigation 52(11): 2672-81.
Jackman, L. A., S. S. Millane, B. R. Martin, O. B. Wood, G. P. McCabe, M. Peacock and C. M. Weaver. 1997. Calcium retention in relation to calcium intake and postmenarcheal age in adolescent females. American Journal of Clinical Nutrition 66(2): 327-33.
Jarjou, L. M., A. Prentice, Y. Sawo, M. A. Laskey, J. Bennett, G. R. Goldberg and T. J. Cole. 2006. Randomized, placebo-controlled, calcium supplementation study in pregnant Gambian women: effects on breast-milk calcium concentrations and infant birth weight, growth, and bone mineral accretion in the first year of life. American Journal of Clinical Nutrition 83(3): 657-66.
Jenkins, D. H., J. G. Roberts, D. Webster and E. O. Williams. 1973. Osteomalacia in elderly patients with fracture of the femoral neck. A clinico-pathological study. Journal of Bone and Joint Surgery. British Volume 55(3): 575-80.
Jones, G. and T. V. Nguyen. 2000. Associations between maternal peak bone mass and bone mass in prepubertal male and female children. Journal of Bone and Mineral Research 15(10): 1998-2004.
Jouanny, P., F. Guillemin, C. Kuntz, C. Jeandel and J. Pourel. 1995. Environmental and genetic factors affecting bone mass. Similarity of bone density among members of healthy families. Arthritis & Rheumatism 38(1): 61-7.
Kalkwarf, H. J., B. L. Specker, D. C. Bianchi, J. Ranz and M. Ho. 1997. The effect of calcium supplementation on bone density during lactation and after weaning. New England Journal of Medicine 337(8): 523-8.
Kalkwarf, H. J. 1999. Hormonal and dietary regulation of changes in bone density during lactation and after weaning in women. Journal of Mammary Gland Biology and Neoplasia 4(3): 319-29.
Keller, J. L., A. J. Lanou and N. D. Barnard. 2002. The consumer cost of calcium from food and supplements. Journal of the American Dietetic Association 102(11): 1669-71.
Kenny, A. M. and K. M. Prestwood. 2000. Osteoporosis. Pathogenesis, diagnosis, and treatment in older adults. Rheumatic Diseases Clinics of North America 26(3): 569-91.
Kent, G. N., R. I. Price, D. H. Gutteridge, K. J. Rosman, M. Smith, J. R. Allen, C. J. Hickling and S. L. Blakeman. 1991. The efficiency of intestinal calcium absorption is increased in late pregnancy but not in established lactation. Calcified Tissue International 48(4): 293-5.
Kerstetter, J. E., A. C. Looker and K. L. Insogna. 2000. Low dietary protein and low bone density. Calcified Tissue International 66(4): 313.
Kobayashi, A., S. Kawai, Y. Obe and Y. Nagashima. 1975. Effects of dietary lactose and lactase preparation on the intestinal absorption of calcium and magnesium in normal infants. American Journal of Clinical Nutrition 28(7): 681-3.
Kocian, J., I. Skala and K. Bakos. 1973. Calcium absorption from milk and lactose-free milk in healthy subjects and patients with lactose intolerance. Digestion 9(4): 317-24.
Komar, L., J. Nieves, F. Cosman, A. Rubin, V. Shen and R. Lindsay. 1993. Calcium homeostasis of an elderly population upon admission to a nursing home. Journal of the American Geriatrics Society 41(10): 1057-64.
Kovacs, C. S. and H. M. Kronenberg. 1997. Maternal-fetal calcium and bone metabolism during pregnancy, puerperium, and lactation. Endocrine Reviews 18(6): 832-72.
Kovacs, C. S. 2001. Calcium and bone metabolism in pregnancy and lactation. Journal of Clinical Endocrinology and Metabolism 86(6): 2344-8.
Kovacs, C. S. 2005. Calcium and bone metabolism during pregnancy and lactation. Journal of Mammary Gland Biology and Neoplasia 10(2): 105-18.
Kovacs, C. S. 2008. Vitamin D in pregnancy and lactation: maternal, fetal, and neonatal outcomes from human and animal studies. American Journal of Clinical Nutrition 88(2): 520S-8S.
Kovacs, C. S. and H. M. Kronenberg. 2008. Pregnancy and lactation. In Primer on the Metabolic Bone Diseases and Disorders of Mineral Metabolism, 7th Edition, edited by C. J. Rosen. Washington, DC: ASBMR Press. Pp. 90-5.
Krall, E. A. and B. Dawson-Hughes. 1993. Heritable and life-style determinants of bone mineral density. Journal of Bone and Mineral Research 8(1): 1-9.
Lee, W. T., S. S. Leung, D. M. Leung and J. C. Cheng. 1996. A follow-up study on the effects of calcium-supplement withdrawal and puberty on bone acquisition of children. American Journal of Clinical Nutrition 64(1): 71-7.
Li, X. Q., V. Tembe, G. M. Horwitz, D. A. Bushinsky and M. J. Favus. 1993. Increased intestinal vitamin D receptor in genetic hypercalciuric rats. A cause of intestinal calcium hyperabsorption. Journal of Clinical Investigation 91(2): 661-7.
Lonnerdal, B. 1997. Effects of milk and milk components on calcium, magnesium, and trace element absorption during infancy. Physiological Reviews 77(3): 643-69.
Ma, R., K. J. Ellis, S. Yasumura, R. J. Shypailo and R. N. Pierson, Jr. 1999. Total body-calcium measurements: comparison of two delayed-gamma neutron activation facilities. Physics in Medicine and Biology 44(6): N113-8.
Malm, O. J. 1958. Calcium requirement and adaptation in adult men. Scandinavian Journal of Clinical and Laboratory Investigation 10(Suppl 36): 1-290.
Martin, A. D., D. A. Bailey, H. A. McKay and S. Whiting. 1997. Bone mineral and calcium accretion during puberty. American Journal of Clinical Nutrition 66(3): 611-5.
Masse, P. G., J. Dosy, J. L. Jougleux, M. Caissie and D. S. Howell. 2005. Bone mineral density and metabolism at an early stage of menopause when estrogen and calcium supplement are not used and without the interference of major confounding variables. Journal of the American College of Nutrition 24(5): 354-60.
Matkovic, V. 1991. Calcium metabolism and calcium requirements during skeletal modeling and consolidation of bone mass. American Journal of Clinical Nutrition 54(1 Suppl): 245S-60S.
Matkovic, V. and R. P. Heaney. 1992. Calcium balance during human growth: evidence for threshold behavior. American Journal of Clinical Nutrition 55(5): 992-6.
Matkovic, V., T. Jelic, G. M. Wardlaw, J. Z. Ilich, P. K. Goel, J. K. Wright, M. B. Andon, K. T. Smith and R. P. Heaney. 1994. Timing of peak bone mass in Caucasian females and its implication for the prevention of osteoporosis. Inference from a cross–sectional model. Journal of Clinical Investigation 93(2): 799-808.
Matkovic, V., P. K. Goel, N. E. Badenhop-Stevens, J. D. Landoll, B. Li, J. Z. Ilich, M. Skugor, L. A. Nagode, S. L. Mobley, E. J. Ha, T. N. Hangartner and A. Clairmont. 2005. Calcium supplementation and bone mineral density in females from childhood to young adulthood: a randomized controlled trial. American Journal of Clinical Nutrition 81(1): 175-88.
Muruganandan, S., A. A. Roman and C. J. Sinal. 2009. Adipocyte differentiation of bone marrow-derived mesenchymal stem cells: cross talk with the osteoblastogenic program. Cellular and Molecular Life Sciences 66(2): 236-53.
NIH Consensus Development Panel on Osteoporosis Prevention Diagnosis and Therapy. 2001. Osteoporosis prevention, diagnosis, and therapy. JAMA 285(6): 785-95.
Nordin, B. E., J. M. Wishart, P. M. Clifton, R. McArthur, F. Scopacasa, A. G. Need, H. A. Morris, P. D. O’Loughlin and M. Horowitz. 2004. A longitudinal study of bone-related biochemical changes at the menopause. Clinical Endocrinology 61(1): 123-30.
Orwoll, E. S., S. K. Oviatt, M. R. McClung, L. J. Deftos and G. Sexton. 1990. The rate of bone mineral loss in normal men and the effects of calcium and cholecalciferol supplementation. Annals of Internal Medicine 112(1): 29-34.
Parfitt, A. M., A. R. Villanueva, J. Foldes and D. S. Rao. 1995. Relations between histologic indices of bone formation: implications for the pathogenesis of spinal osteoporosis. Journal of Bone and Mineral Research 10(3): 466-73.
Parfitt, A. M. 2003. Misconceptions (3): calcium leaves bone only by resorption and enters only by formation. Bone 33(3): 259-63.
Peacock, M. 1991. Calcium absorption efficiency and calcium requirements in children and adolescents. American Journal of Clinical Nutrition 54(Suppl 1): 261S-5S.
Peacock, M. 2010. Calcium metabolism in health and disease. Clinical Journal of the American Society of Nephrology 5(Suppl 1)1: S23-30.
Pedersen, E. B., P. Johannesen, S. Kristensen, A. B. Rasmussen, K. Emmertsen, J. Moller, J. G. Lauritsen and M. Wohlert. 1984. Calcium, parathyroid hormone and calcitonin in normal pregnancy and preeclampsia. Gynecologic and Obstetric Investigation 18(3): 156-64.
Perez-Lopez, F. R., P. Chedraui and J. L. Cuadros-Lopez. 2010. Bone mass gain during puberty and adolescence: deconstructing gender characteristics. Current Medicinal Chemistry 17(5): 453-66.
Poliquin, S., L. Joseph and K. Gray-Donald. 2009. Calcium and vitamin D intakes in an adult Canadian population. Canadian Journal of Dietetic Practice & Research 70(1): 21-7.
Pouilles, J. M., F. Tremollieres and C. Ribot. 1995. Effect of menopause on femoral and vertebral bone loss. Journal of Bone and Mineral Research 10(10): 1531-6.
Prentice, A., L. M. Jarjou, T. J. Cole, D. M. Stirling, B. Dibba and S. Fairweather-Tait. 1995. Calcium requirements of lactating Gambian mothers: effects of a calcium supplement on breast-milk calcium concentration, maternal bone mineral content, and urinary calcium excretion. American Journal of Clinical Nutrition 62(1): 58-67.
Prentice, A. 2003. Micronutrients and the bone mineral content of the mother, fetus and newborn. Journal of Nutrition 133(5 Suppl 2): 1693S-9S.
Provot, S. and E. Schipani. 2007. Fetal growth plate: a developmental model of cellular adaptation to hypoxia. Annals of the New York Academy of Sciences 1117: 26-39.
Rafferty, K., G. Walters and R. P. Heaney. 2007. Calcium fortificants: overview and strategies for improving calcium nutriture of the U.S. population. Journal of Food Science 72(9): R152-8.
Recker, R. R. 1985. Calcium absorption and achlorhydria. New England Journal of Medicine 313(2): 70-3.
Recker, R. R., K. M. Davies, S. M. Hinders, R. P. Heaney, M. R. Stegman and D. B. Kimmel. 1992. Bone gain in young adult women. JAMA 268(17): 2403-8.
Recker, R., J. Lappe, K. M. Davies and R. Heaney. 2004. Bone remodeling increases substantially in the years after menopause and remains increased in older osteoporosis patients. Journal of Bone and Mineral Research 19(10): 1628-33.
Ricci, T. A., H. A. Chowdhury, S. B. Heymsfield, T. Stahl, R. N. Pierson, Jr. and S. A. Shapses. 1998. Calcium supplementation suppresses bone turnover during weight reduction in postmenopausal women. Journal of Bone and Mineral Research 13(6): 1045-50.
Riedt, C. S., M. Cifuentes, T. Stahl, H. A. Chowdhury, Y. Schlussel and S. A. Shapses. 2005. Overweight postmenopausal women lose bone with moderate weight reduction and 1 g/day calcium intake. Journal of Bone and Mineral Research 20(3): 455-63.
Riedt, C. S., R. E. Brolin, R. M. Sherrell, M. P. Field and S. A. Shapses. 2006. True fractional calcium absorption is decreased after Roux-en-Y gastric bypass surgery. Obesity (Silver Spring) 14(11): 1940-8.
Riggs, B. L., W. M. O’Fallon, J. Muhs, M. K. O’Connor, R. Kumar and L. J. Melton, 3rd. 1998. Long-term effects of calcium supplementation on serum parathyroid hormone level, bone turnover, and bone loss in elderly women. Journal of Bone and Mineral Research 13(2): 168-74.
Riggs, B. L. 2002. Endocrine causes of age-related bone loss and osteoporosis. Novartis Foundation Symposium 242: 247-59; discussion 260-4.
Seely, E. W., E. M. Brown, D. M. DeMaggio, D. K. Weldon, and S. W. Graves. 1997. A prospective study of calciotropic hormones in pregnancy and post partum: reciprocal changes in serum intact parathyroid hormone and 1,25-dihydroxyvitamin D. American Journal of Obstetrics and Gynecology 176(1 Pt 1): 214-7.
Seeman, E. 2003. Reduced bone formation and increased bone resorption: rational targets for the treatment of osteoporosis. Osteoporosis International 14(Suppl 3): S2-8.
Seeman, E. 2009. Bone modeling and remodeling. Critical Reviews in Eukaryotic Gene Expression 19(3): 219-33.
Sellmeyer, D. E., M. Schloetter and A. Sebastian. 2002. Potassium citrate prevents increased urine calcium excretion and bone resorption induced by a high sodium chloride diet. Journal of Clinical Endocrinology and Metabolism 87(5): 2008-12.
Shapses, S. A. and D. Sukumar. 2010. Protein intake during weight loss: effects on bone. In Nutritional Aspects of Osteoporosis, edited by P. Burckhardt, B. Dawson-Hughes and C. M. Weaver. London: Springer. Pp. 9-16.
Sigurdsson, G., B. V. Halldorsson, U. Styrkarsdottir, K. Kristjansson and K. Stefansson. 2008. Impact of genetics on low bone mass in adults. Journal of Bone and Mineral Research 23(10): 1584-90.
Siris, E. S., Y. T. Chen, T. A. Abbott, E. Barrett-Connor, P. D. Miller, L. E. Wehren and M. L. Berger. 2004. Bone mineral density thresholds for pharmacological intervention to prevent fractures. Archives of Internal Medicine 164(10): 1108-12.
Sokoloff, L. 1978. Occult osteomalacia in American (U.S.A.) patients with fracture of the hip. American Journal of Surgical Pathology 2(1): 21-30.
Southgate, D. A., E. M. Widdowson, B. J. Smits, W. T. Cooke, C. H. Walker and N. P. Mathers. 1969. Absorption and excretion of calcium and fat by young infants. Lancet 1(7593): 487-9.
Sowers, M., R. B. Wallace and J. H. Lemke. 1985. Correlates of forearm bone mass among women during maximal bone mineralization. Preventive Medicine 14(5): 585-96.
Sowers, M. R., M. K. Clark, B. Hollis, R. B. Wallace and M. Jannausch. 1992. Radial bone mineral density in pre- and perimenopausal women: a prospective study of rates and risk factors for loss. Journal of Bone and Mineral Research 7(6): 647-57.
Specker, B. L., M. L. Ho, A. Oestreich, T. A. Yin, Q. M. Shui, X. C. Chen and R. C. Tsang. 1992. Prospective study of vitamin D supplementation and rickets in China. Journal of Pediatrics 120(5): 733-9.
Specker, B. L., N. E. Vieira, K. O. O’Brien, M. L. Ho, J. E. Heubi, S. A. Abrams and A. L. Yergey. 1994. Calcium kinetics in lactating women with low and high calcium intakes. American Journal of Clinical Nutrition 59(3): 593-9.
Spencer, H., I. Lewin, J. Fowler and J. Samachson. 1969. Influence of dietary calcium intake on Ca47 absorption in man. American Journal of Medicine 46(2): 197-205.
Spencer, H., L. Kramer, M. Lesniak, M. De Bartolo, C. Norris and D. Osis. 1984. Calcium requirements in humans. Report of original data and a review. Clinical Orthopedics Related Research (184): 270-80.
Stacey, J. and C. Daly. 1989. Osteomalacia in the elderly: biochemical screening in general practice. Irish Medical Journal 82(2): 72-3.
Stevenson, J. C., G. Abeyasekera, C. J. Hillyard, K. G. Phang, I. MacIntyre, S. Campbell, P. T. Townsend, O. Young and M. I. Whitehead. 1981. Calcitonin and the calcium-regulating hormones in postmenopausal women: effect of oestrogens. Lancet 1(8222): 693-5.
Straub, D. A. 2007. Calcium supplementation in clinical practice: a review of forms, doses, and indications. Nutrition in Clinical Practice 22(3): 286-96.
Teti, A. and A. Zallone. 2009. Do osteocytes contribute to bone mineral homeostasis? Osteocytic osteolysis revisited. Bone 44(1): 11-6.
Trotter, M. and B. B. Hixon. 1974. Sequential changes in weight, density, and percentage ash weight of human skeletons from an early fetal period through old age. Anatomical Record 179(1): 1-18.
Tsai, K. S., H. Heath, 3rd, R. Kumar and B. L. Riggs. 1984. Impaired vitamin D metabolism with aging in women. Possible role in pathogenesis of senile osteoporosis. Journal of Clinical Investigation 73(6): 1668-72.
Tuck, S. P. and H. K. Datta. 2007. Osteoporosis in the aging male: treatment options. Clinical Intervention Aging 2(4): 521-36.
Uebelhart, D., E. Gineyts, M. C. Chapuy and P. D. Delmas. 1990. Urinary excretion of pyridinium crosslinks: a new marker of bone resorption in metabolic bone disease. Bone and Mineral 8(1): 87-96.
Vatanparast, H., D. A. Bailey, A. D. Baxter-Jones and S. J. Whiting. 2010. Calcium requirements for bone growth in Canadian boys and girls during adolescence. British Journal of Nutrition: 1-6.
Villareal, D. T., R. Civitelli, A. Chines and L. V. Avioli. 1991. Subclinical vitamin D deficiency in postmenopausal women with low vertebral bone mass. Journal of Clinical Endocrinology and Metabolism 72(3): 628-34.
Wastney, M. E., J. Ng, D. Smith, B. R. Martin, M. Peacock and C. M. Weaver. 1996. Differences in calcium kinetics between adolescent girls and young women. American Journal of Physiology 271(1 Pt 2): R208-16.
Weaver, C. M. and R. P. Heaney. 1991. Isotopic exchange of ingested calcium between labeled sources. Evidence that ingested calcium does not form a common absorptive pool. Calcified Tissue International 49(4): 244-7.
Weaver, C. M., R. P. Heaney, B. R. Martin and M. L. Fitzsimmons. 1991. Human calcium absorption from whole-wheat products. Journal of Nutrition 121(11): 1769-75.
Weaver, C. M., B. R. Martin, K. L. Plawecki, M. Peacock, O. B. Wood, D. L. Smith and M. E. Wastney. 1995. Differences in calcium metabolism between adolescent and adult females. American Journal of Clinical Nutrition 61(3): 577-81.
Weaver, C. and R. Heaney. 2006a. Chapter 9: Food sources, supplements, and bioavailability. In Calcium in Human Health, edited by C. Weaver and R. Heaney. Totowa, NJ: Humana Press. Pp. 129-44.
Weaver, C. M. and R. Heaney. 2006b. Calcium. In Modern Nutrition in Health and Disease, 10th Edition, edited by M. E. Shils, M. Shike, A. C. Ross, B. Cabellero and R. J. Cousins. Baltimore, MD: Lippincott Williams & Wilkins.
Weaver, C. M. 2009. Should dairy be recommended as part of a healthy vegetarian diet? Point. American Journal of Clinical Nutrition 89(5): 1634S-7S.
Widdowson, E. M. 1965. Absorption and excretion of fat, nitrogen, and minerals from “filled” milks by babies one week old. Lancet 2(7422): 1099-105.
Xue, Y. and J. C. Fleet. 2009. Intestinal vitamin D receptor is required for normal calcium and bone metabolism in mice. Gastroenterology 136(4): 1317-27, e1-2.
Yang, Y. C. and C. Y. Yang. 2008. The influence of residual stress on the shear strength between the bone and plasma-sprayed hydroxyapatite coating. Journal of Materials Science. Materials in Medicine 19(3): 1051-60.


