
D
Methods and Results from the AHRQ-Tufts Evidence-Based Report on Vitamin D and Calcium
The purpose of this systematic evidence-based review, referred to as AHRQ-Tufts,1 requested by the Office of Dietary Supplements/National Institutes of Health, the Public Health Agency of Canada, Health Canada, and the Food and Drug Administration and conducted by the Tufts Evidence-based Practice Center (EPC), was to answer key scientific questions on how dietary vitamin D and calcium intake effect health outcomes. The key questions addressed in the AHRQ-Tufts reports are as follows:
Key Question 1. What is the effect of vitamin D, calcium, or combined vitamin D and calcium intakes on clinical outcomes, including growth, cardiovascular diseases, body weight outcomes, cancer, immune function, pregnancy or birth outcomes, mortality, fracture, renal outcomes, and soft tissue calcification?
Key Question 2. What is the effect of vitamin D, calcium, or combined vitamin D and calcium intakes on surrogate or intermediate outcomes, such as hypertension, blood pressure, and bone mineral density?
Key Question 3. What is the association between serum 25(OH)D concentrations or calcium balance and clinical outcomes?
Key Question 4. What is the effect of vitamin D or combined vitamin D and calcium intakes on serum 25(OH)D concentrations?
Key Question 5. What is the association between serum 25(OH)D concentrations and surrogate or intermediate outcomes?
The review focused on electronic searches of the medical literature (1969–April 2009) to identify publications addressing the aforementioned questions. One hundred and sixty-five primary articles and 11 systematic reviews that incorporated more than 200 additional primary articles were systematically reviewed, and each was rated on quality and used to assess the strength of evidence for each outcome.
The methods and results chapters of the AHRQ-Tufts evidence review are reprinted below. The report in its entirety, including appendices and evidence tables, can be accessed and viewed at http://www.ahrq.gov/clinic/tp/vitadcaltp.htm.
Chapter 2.
Methods
Overview
This report is based on a systematic review of key questions on the relationships between vitamin D [either 25(OH)D concentrations or supplements] or dietary calcium intake, and health outcomes. The methodologies employed in this evidence report generally follow the methods outlined in the AHRQ Methods Reference Guide for Effectiveness and Comparative Effectiveness Reviews (http://effectivehealthcare.ahrq.gov/repFiles/2007_10DraftMethodsGuide.pdf). The initial questions identified by the federal sponsors of this report were refined with input from a Technical Expert Panel (TEP). This report does not make clinical or policy recommendations. The report is being made available to an IOM committee charged with updating vitamin D and calcium DRIs.
A description of roles and responsibilities of sponsoring federal agencies, AHRQ, the TEP and the EPC is included to clarify the relationships that support the process and ensure transparency and that the approach adhered to the highest standards of scientific integrity.
Because of the large number of abbreviations for unfamiliar terms are used, their explanations have been repeated whenever deemed necessary. A table of Abbreviations can be found after the references in page 316. We also provide a table with the latitudes of several major cities in Central and North America, right after the Abbreviations table, on page 320.
Sponsoring federal agencies
The sponsoring agencies were responsible for specifying the topic-specific task order requirements. They participated in a Kick-Off meeting with the EPC and the Task Order Officer (TOO) to facilitate a common understanding of the topic-specific work requirements, and responded to inquiries from the TOO if modifications to the work order were requested by the EPC. Any communication between the sponsoring agencies and the EPC occurred with oversight from the TOO.
Review by Federal sponsors was limited to comments on factual errors, requests for clarification, and consistency with the original contract task order. Comments on the scientific content of the report were not provided. In all cases, reviewer comments are advisory only and are not binding on the scientific authors of the final report.
AHRQ Task Order Officer (TOO)
The TOO was responsible for overseeing all aspects of this Task Order. The TOO served as the point person for all communication required between the sponsoring agencies, the EPC, and other AHRQ officials. The purpose of this communication was to facilitate a common understanding of the task order requirements among the sponsors, the TOO, and the EPC, resolve ambiguities and to allow the EPC to focus on the scientific issues and activities.
Technical Expert Panel (TEP)
The TEP is comprised of qualified experts including, but not limited to, individuals with knowledge of DRI decision making processes, vitamin D and calcium nutrition and biology across the life cycle, health outcomes of interest, and the methodology of conducting systematic reviews. The EPC worked closely with the TEP in the formative stages of the project on question
refinement and throughout the evidence review process to address questions that occurred. The EPC conducted the actual systematic review of the questions independent of the TEP and other stakeholders. It was specified, a priori, that external peer reviewers of the final report could not also serve as a member of the IOM’s calcium and vitamin D DRI Committee.
Those serving on the TEP provided input on such factors as reviewing search terms to ensure they were adequately inclusive, assessing search strategies to ensure they comprehensively covered the questions of interest, and answering questions about technical details (e.g., nuances of laboratory methods of performing an assay). Members of the TEP did not participate in EPC research meetings or in reviewing and synthesizing evidence. Their function was limited to providing domain-specific knowledge and advising the proper context that is relevant to the process of evaluating DRI. They did not have any decision making role and did not participate in writing any part of the evidence report.
EPC methodologists
This evidence report was carried out under the AHRQ EPC program, which has a 12-year history of producing over 175 evidence reports and numerous technology assessments for various users including many federal agencies. EPCs are staffed by experienced methodologists who continually refine approaches to conducting evidence reviews and develop new methods on the basis of accumulated experience encompassing a wide range of topics. The Tufts EPC has produced many evidence reports on nutrition topics19-24 (http://www.ahrq.gov/clinic/epcix.htm). We have also conducted methodological research to identify the issues and challenges of including evidence-based methods as a component of the process used to develop nutrient reference values, such as the DRI, using vitamin A as an example.3
Development of the analytic framework and refinement of key questions
The focus of this report is on the relationship of vitamin D only, calcium only, and combinations of vitamin D and calcium with specific health outcomes. Key questions and analytic frameworks were developed by defining each box in the generic analytic framework described in Chapter 1 with specific reference to vitamin D and calcium.
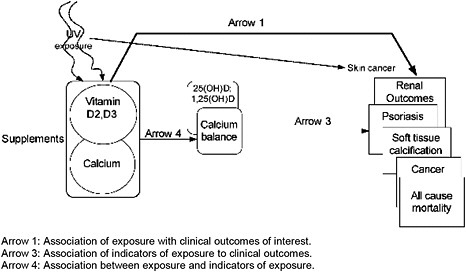
A one-day meeting of the federal sponsors, TEP and Tufts EPC staff was held in Boston on September 20, 2008. At this meeting, the analytic framework was discussed, the key questions refined, and study eligibility criteria established. Two analytic frameworks were developed: one for intakes of vitamin D and/or calcium related to their beneficial effects and one for intakes associated with adverse effects (Figures 3 & 4). We used the PI(E)CO method to establish study eligibility criteria. This method defines the Population, Intervention (or Exposure in the case of observational studies), Comparator, and Outcomes of interest. Details are described in the sections that follow.
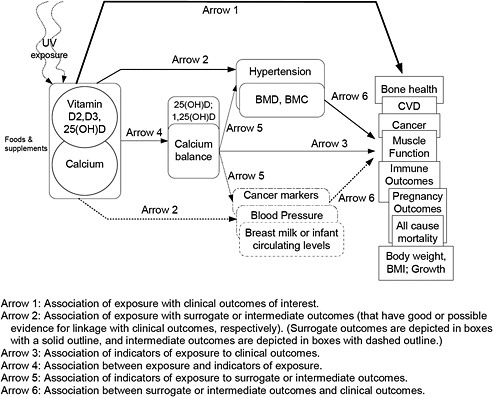
Figure 4. Analytic framework for vitamin D and/or calcium safety-related (adverse) outcomes
Definitions
Vitamin D and calcium exposures
Vitamin D exposure included intake of vitamin D2 or vitamin D3 from foods and supplements, including human milk and commercial infant formulas. Because the primary source of vitamin D in the human body is produced in skin exposed to sunlight, background information on ultraviolet B (UVB) exposure was captured to the extent possible. However, we did not include studies that evaluated the effect of or association between exposure to sunlight (or UVB) and clinical outcomes or serum 25(OH)D concentrations. In other words, we did not investigate sunlight exposure as a proxy for or a source of vitamin D intake. Sunlight exposure was considered only as a potential confounder or effect modifier of associations between vitamin D or calcium and clinical outcomes.
Calcium exposure included intake of calcium from foods and supplements, including calcium-containing antacids, mineral-supplemented water, human milk and commercial infant formulas.
Combined vitamin D and calcium exposure included any relevant combinations of the above.
Clinical outcomes
Clinical outcomes are measures of how a person (e.g., a study participant) feels, functions or survives, or a clinical measurement of the incidence or severity of a disease (e.g., diagnosis of disease or change from one disease state to another). Examples of clinical outcomes used in this report are incidence of cancer, cardiovascular events, and preeclampsia. The clinical outcomes of interest in this report are described in the “Specific Outcomes of Interest” section.
Indicators of exposure (nutrient intake)
Indicators of exposure are measures that correlate with dietary intake of a nutrient, such as nutrient biomarkers, nutritional status, or markers of nutritional status.
Indicators of vitamin D exposure (i.e., vitamin D intake and sun exposure) included serum 25(OH)D and 1,25(OH)2D concentrations.
Indicators of dietarycalcium intakes included calcium balance (i.e., calcium accretion, retention, and loss).
Surrogate outcomes
Surrogate outcomes are biomarkers or physical measures that are generally accepted as substitutes for or predictors of specific clinical outcomes.18 Changes induced by the exposure or intervention on a surrogate outcome marker are expected to reflect changes in a clinical outcome. Examples of surrogate outcomes used in this report are bone mineral density (as a surrogate marker of fracture risk) and breast mammographic density (as a surrogate marker of breast cancer risk). The surrogate outcomes of interest in this report are described in “Specific Outcomes of Interest” section.
Intermediate outcomes
Intermediate outcomes are possible predictors of clinical outcomes that are not generally accepted to fulfill the criteria for a surrogate outcome. However, in the absence of data for surrogate outcomes, intermediate markers are often used. Examples of intermediate markers used in this report are prostate cancer antigen (as a marker of prostate cancer risk) and blood pressure (as a marker of stroke risk). All intermediate markers of interest in this report are described in “Specific Outcomes of Interest” section.
Life stages
In consultation with the TEP, the 22 life stages defined by the FNB/IOM for the development of DRI were consolidated to 9 categories to facilitate the reporting of results. Within each life stages, men and women (or boys and girls) were considered separately when possible. There are also some inevitable overlaps between these categories. For example, most women in 51-70 years life stage are postmenopausal women. The 9 categories created for this report are:
-
0 – 6 months
-
7 months – 2 years
-
3 – 8 years
-
9 – 18 years
-
19 – 50 years
-
51 – 70 years
-
≥71 years
-
Pregnant and lactating women
-
Postmenopausal women
In summarizing studies for each given outcome, we used our best judgment to describe the study results for each applicable life stage.
Key questions
In agreement with the TEP, the following key questions were addressed in this evidence report. It was decided that arrow 6 in the analytic framework (What is the relationships between intermediate or surrogate outcomes and clinical outcomes?) is outside the scope of the DRI literature review in this report. All outcomes of interest in this report are described in “Eligibility Criteria” section.
Key Question 1. What is the effect of vitamin D, calcium, or combined vitamin D and calcium intakes on clinical outcomes, including growth, cardiovascular diseases, weight outcomes, cancer, immune function, pregnancy or birth outcomes, mortality, fracture, renal outcomes, and soft tissue calcification? (Arrow 1)
Key Question 2. What is the effect of vitamin D, calcium or combined vitamin D and calcium intakes on surrogate or intermediate outcomes, such as hypertension, blood pressure, and bone mineral density? (Arrow 2)
Key Question 3. What is the association between serum 25(OH)D concentrations or calcium balance and clinical outcomes? (Arrow 3)
Key Question 4. What is the effect of vitamin D or combined vitamin D and calcium intakes on serum 25(OH)D concentrations? (Arrow 4)
Key Question 5. What is the association between serum 25(OH)D concentrations and surrogate or intermediate outcomes? (Arrow 5)
Literature search strategy
We conducted a comprehensive literature search to address the key questions. For primary studies, the EPC used the Ovid search engine to conduct searches in the MEDLINE® and Cochrane Central database. A wide variety of search terms were used to capture the many potential sources of information related to the various outcomes (see Appendix A). Search terms that were used to identify outcomes of interest, for both EARs and ULs, can be categorized into the following groups: 1) bodyweight or body mass index; 2) growth (height and weight); 3) fracture or bone mineral density; 4) falls or muscle strength; 5) cardiovascular diseases; 6) hypertension or blood pressure; 7) cancer or neoplasms, including adenomas, colon polyps, and mammography; 8) autoimmune diseases (e.g., type 1 diabetes, psoriasis, rheumatoid arthritis, multiple sclerosis, inflammatory bowel disease, ulcerative colitis, and Crohn's disease); 9) preeclampsia, eclampsia and pregnancy-related hypertension; 10) preterm or low birth weight; 11) breast milk or lactation; 12) death; 13) infectious diseases; 14) soft tissue calcification (for ULs only); and 15) kidney disease or hypercalcemia (for ULs only). The different outcomes were crossed with terms to identify vitamin D and calcium exposure: “vitamin D”, “plasma vitamin D”, “25-hydroxyvitamin D” and its abbreviations, “25-hydroxycholecalciferol”, “25-hydroxyergocalciferol”, “calcidiol”, “calcifediol”, “ergocalciferol”, “cholecalciferol”, “calciferol”, “calcium”, “calcium carbonate”, “calcium citrate”, “calcium phosphates” and
“calcium malate”. Literature searches of the outcomes alone without references to vitamin D or calcium were not conducted.
The searches were limited to human studies, English language publications, and citations from 1969 to September 2008 for all but bone outcomes. For outcomes related to bone health (i.e., bone mineral density, fracture, fall or muscle strength), we relied on a recent comprehensive systematic review performed by the Ottawa EPC.6 The Ottawa EPC report was updated from January 2006 to September 2008. The electronic search was supplemented by bibliographies of relevant review articles. Unpublished data, including abstracts and conference proceedings, were not included. An updated literature search was performed in April 2009 for all the topics to include relevant primary studies published since September 2008 for the final report.
For potentially relevant systematic reviews, we also searched MEDLINE®, the Cochrane Database of Systemic Reviews, and the Health Technology Assessments database up to December 2008. We searched for systematic reviews of the relationships between vitamin D or calcium and the prespecified outcomes. In this search, terms for identifying vitamin D or calcium exposures were crossed with terms for identifying systematic reviews, such as “systematic,” “evidence,” “evidence-based,” “meta-analysis,” or “pooled analysis”; specific terms for the outcomes were not included (Appendix B).
Study selection
Abstract screening
All abstracts identified through the literature search were screened. Eligible studies included all English language primary interventional or observational studies that reported any outcome of interest in human subjects in relation to vitamin D and/or calcium.
Full text article eligibility criteria
Articles that potentially met eligibility criteria at the abstract screening stage were retrieved and the full text articles were reviewed for eligibility. Rejected full text articles were examined only once, unless the articles were equivocal for inclusion or exclusion. In that event, the article in question was examined again by a different reviewer and a consensus was reached after discussion with the first reviewer. We recorded the reason for rejection of all full text articles.
Primary studies
Because the outcomes of interest ranged from very broad topics with common occurrences (e.g., cardiovascular disease) to narrowly focused topics with relatively few occurrences (e.g., preeclampsia), the number and types of studies available for each outcome varied widely in the distribution of study designs and sample sizes. It was neither possible nor desirable to use a uniform, strict set of inclusion and exclusion criteria applicable to all outcomes. Therefore, additional eligibility criteria germane to the specific outcome were applied to all accepted full text articles. Details are described in the “Eligibility criteria” section.
General eligibility criteria for the full text articles were:
Population of interest:
-
Primary population of interest is generally healthy people with no known disorders
-
Studies that include a broad population that might have included some people with diseases. For example, some hypertensive and diabetic patients were included.
-
People with prior cancers (or cancer survivors), prior fractures, and precancer conditions (e.g., colon polyps) were included
-
Studies that enrolled more than 20% subjects with any diseases at baseline were excluded. An exception was made for older adults (mean age ≥65 years old) due to high prevalence of diseases in this population. For studies of older adults, only studies that exclusively enrolled subjects with particular disease (e.g., 100% type 2 diabetes) were excluded. In addition, for studies of blood pressure, studies of people exclusively with hypertension were included.
-
For adverse or safety outcomes, we included any adverse effects of high intake in any population.
Intervention/exposure of interest
-
For observational studies:
-
Serum 25(OH)D or 1,25(OH)2D concentration
-
Dietary intake level of vitamin D were not included due to inadequacy of nutrient composition tables for vitamin D.25
-
Dietary intake level of calcium from food and/or supplements
-
Calcium balance (i.e., calcium accretion, retention, and loss)
-
-
For interventional studies:
-
Vitamin D supplements (but not analogues) with known doses
-
Calcium supplements with known doses
-
The only combination of dietary supplements of interest was the combination of vitamin D and calcium. Any other combinations of supplements and/or drug treatments were excluded unless the independent effects of vitamin D and/or calcium can be separated. Thus studies of multivitamins were excluded.
-
Trials in which participants in both study groups took the same calcium (or vitamin D) supplement were evaluated as vitamin D (or calcium) versus control trials. In other words, the intervention common to both study groups was ignored (though it was noted).
-
Food based interventions were included if the doses of vitamin D and/or calcium were quantified and there were differences in the doses between the comparison groups. For example, a trial of dairy supplementation (with 500 mg/d calcium) versus no supplementation was qualified to be included. However, a trial of calcium fortified orange juice (with 1200 mg/d calcium) versus milk (with 1200 mg/d calcium) was not qualified to be included because there are no differences in the calcium doses.
-
Nonoral routes of nutrient delivery were excluded
-
Specific Outcomes of interest
-
Growth outcomes
-
In infants and premenarchal girls and boys of corresponding age: weight and height gain
-
-
Cardiovascular disease clinical outcomes
-
Cardiac events or symptoms (e.g., myocardial infarction, angina)
-
-
-
Cerebrovascular events (stroke, transient ischemic attacks)
-
Peripheral vascular events or symptoms (diagnosis, claudication)
-
Cardiovascular death
-
Study-specific combinations of cardiovascular events
-
-
CVD intermediate outcomes
-
Diagnosis of hypertension
-
Blood pressure
-
-
Weight outcomes
-
In adults only: incident overweight or obesity, body mass index, or weight (kg)
-
-
Cancer (incident or mortality)
-
Cancer from all cause (or total cancer)
-
Prostate
-
Colorectal cancer
-
Breast cancer
-
Pancreatic cancer
-
Cancer-specific mortality
-
-
Cancer intermediate outcomes
-
Colorectal adenoma
-
Aberrant cryptic
-
Breast mammographic density (quantitative whole breast density)
-
-
Immune function clinical outcomes
-
Infectious diseases
-
Autoimmune diseases
-
Infectious disease-specific mortality
-
-
Pregnancy-related outcomes
-
Preeclampsia
-
High blood pressure with or without proteinuria
-
Preterm birth or low birth weight
-
Infant mortality
-
-
Mortality, all cause
-
Bone health clinical outcomes
-
Rickets
-
Fracture
-
Fall or muscle strength
-
-
Bone health intermediate outcomes
-
Bone mineral density or bone mineral content
-
-
Dose-response relationship between intake levels and indicators of exposure (arrow 4 of Figures 2 and 3)
-
Serum 25(OH)D concentration
-
Breast milk or circulating concentrations of 25(OH)D in infants
-
-
Outcomes of tolerable upper intake levels (ULs)
-
All-cause mortality
-
Cancer and cancer-specific mortality
-
Renal outcomes
-
Soft tissue calcification
-
Adverse events from vitamin D and/or calcium supplements
-
Study design
-
Randomized controlled trials (RCTs)
-
Nonrandomized, prospective comparative studies of interventions
-
Prospective, longitudinal, observational studies (where the measure of exposure occurred before the outcome)
-
Prospective nested case-control studies (case-control study nested in a cohort so the measure of exposure occurred before the outcome)
-
We excluded cross-sectional studies and traditional, retrospective case-control studies (where the measure of exposure occurred after or concurrent with the outcome)
Systematic reviews
We included relevant systematic reviews that addressed the key questions. Systematic review is defined as a study that has at a minimum the following three components: a statement of the research questions (aims or objectives); a description of the literature search; and a listing of the study eligibility criteria. We did not attempt to contact authors for clarifications of outstanding questions. In addition, the following types of reviews were excluded: reviews of foods or diets that did not quantify vitamin D or calcium intake; reviews that included nonoral routes of nutrient delivery; reviews that did not evaluate the association between vitamin D or calcium intake to health outcomes; reviews of nonhuman data; and pooled analyses of primary databases (i.e., secondary database analyses of multiple cohorts) that did not include a systematic review (except possibly as a replacement for data from the original cohorts).
To determine the relevance of a systematic review to this report, the following inclusion criteria were applied:
-
Address key question(s) of interest (i.e., similar PI(E)CO criteria used):
-
Systematic review must include only healthy population at baseline or have separate analyses for population with diseases and without diseases.
-
Systematic reviews of interventional studies had to include only vitamin D or calcium interventions. Cointerventions with other nutrients had to be disallowed or separate analyses were needed for studies of vitamin D or calcium interventions alone.
-
Systematic review of observational studies had to report the baseline concentrations of serum 25(OH)D and the assay methods used or the dietary assessment methods used to measure dietarycalcium intake (e.g. food frequency questionnaire, 24 hour recall).
-
Exposure levels (e.g., level of 25(OH)D or calcium intake) or doses of interventions had to be reported
-
Outcome definitions had to be reported
-
Designs of primary studies had to be reported. If cross-sectional or case-control studies were included, the systematic review must provide sufficient information or separate analyses to separate them from RCTs or cohort studies.
-
-
We include only the most recent update if there were multiple systematic reviews from the same group of investigators using the same review process.
-
Where there were several systematic reviews on the same topic with similar conclusions and the same set of primary studies, we selected the systematic review with either the latest cutoff date for the end of the literature search or the most included primary studies. Where there were several systematic reviews, each of which included only a sample of
-
the total literature included by the several systematic reviews, all systematic reviews were included.
Other specific eligibility criteria
-
Growth outcomes (weight and height gain)
-
Only infants (<1 year old) and children (age <18 years old) were included
-
For infants, we include all eligible study designs. The vitamin D and/or calcium intervention or exposure can be administered to the mothers or to the infants in the study.
-
For infants, premenarchal girls, and boys of similar age, only RCTs that reported weight as a primary or secondary outcome were included. RCTs of weight loss were excluded.
-
-
Cardiovascular disease clinical outcomes
-
Only adults (aged ≥18 years old) were included.
-
-
Blood pressure and bodyweight
-
Only adults (aged ≥18 years old) were included.
-
Only RCTs of calcium or vitamin D interventions were included. We did not include observational studies of associations between calcium or vitamin D intake or serum vitamin D concentrations and blood pressure or weight measurements (as continuous outcomes). This decision was made in agreement with the TEP in part because it was agreed that any conclusions based on observational studies (e.g., associations between baseline calcium intake and change in systolic blood pressure) would be weak and difficult to interpret.
-
-
Bone health clinical outcomes
-
The Ottawa EPC report6 was updated with literature published between January 2006 and September 2008. Only RCTs qualified for inclusion.
-
Studies of calcium and bone health clinical outcomes were excluded.
-
-
Bone health intermediate outcomes
-
The Ottawa EPC report6 was updated with literature published between January 2006 and September 2008. For adults, we included only BMD indices. For children, we included only BMC indices. Only RCTs with duration of more than 1 year were qualified for inclusion.
-
Studies of calcium and bone health clinical outcomes were excluded.
-
-
Dose-response relationship between intake levels and indicators of exposure (arrow 4 of Figures 2 and 3)
-
Studies for this question were identified in our literature search that crossed vitamin D terms with various outcomes terms. Some studies that addressed this question but do not report any of the outcomes of interest would not have been identified in this manner. Because the availability of serum 25(OH)D concentration is unlikely to be adequately indexed in the Medline citation, it would be difficult to comprehensively search the literature for this question. To do so would require retrieving all full text articles mentioning vitamin D supplements (in excess of 10,000) to look for data on serum 25(OH)D concentration.
-
-
-
Only RCTs were included for this question. However, RCTs of different regimens but the same dose of vitamin D supplementation were excluded (e.g., comparison of daily, weekly versus monthly dose).
-
Data extraction
For outcomes that had not been subjected to a prior systematic review, we extracted and summarized the relevant data from the primary studies. Where previous systematic reviews were available, we summarized their results into our report. In addition, we updated the previous systematic reviews (with our eligibility criteria) and extracted and summarized the additional primary studies.
Data extraction forms (evidence tables) were developed separately for extraction of systematic reviews and primary studies. For primary studies, the items extracted were: study characteristics, baseline population characteristics, background diet data, dietary assessment methods for calcium intake, 25(OH)D assay methods, interventions (for interventional studies only), confounders and effect modifiers that were adjusted for in statistical analysis, results, and quality assessments. Whenever the type of vitamin D supplement (D2 or D3) was clearly reported, we extracted and reported this information. Otherwise, we used the general term “vitamin D”. Evidence tables for all eligible studies are available in Appendix C. For systematic reviews, items extracted were: design, population, intervention (exposure) and comparator, results, and AMSTAR26 checklist criteria (a measurement tool created to assess the methodological quality of systematic reviews). A table with a list of all systematic reviews with the evaluation of their relevance to this report, and evidence tables of the qualified systematic reviews are available in Appendix D.
Data analysis
We explored the dose-response relationship between the level of intake of vitamin D (with or without calcium) and serum 25(OH)D concentrations graphically, using a scatter (“bubble”) plot. We plotted the observed net changes in 25(OH)D concentration, against the doses of vitamin D supplementation. In these plots studies were represented by empty circles (bubbles) with area proportional to the inverse of the within-study variances. Typically, the larger the bubble, the larger the sample size and the smaller the standard error of the changes in 25(OH)D.
Studies were included only if they reported sufficient data to estimate both mean net change and SE of the net change. We required data on both the mean net change in outcome level and the SE of the change. However, many studies provided only the SEs for the baseline and final outcome levels. In order to include these studies in the analyses we had to make several assumptions to estimate the SE of the change. To do this we used the

where SE1, SE2, and SE12 are the SEs for baseline, final and change, respectively, and ρ is the correlation between the baseline and final measurements.27 We arbitrarily chose the correlation, ρ, to be 0.50, the midpoint value. In our experience, using different values for ρ generally does not greatly affect the meta-analysis results of quantitative analyses or conclusions.
For each RCT, the SE of the net change was then calculated using the standard calculation for determining the SE of 2 independent cohorts. Namely, in the above equation where the correlation factor becomes 0, and thus the final term drops out. Where studies reported either within-cohort SEs or net change SEs, these numbers were used. Some RCTs may have more than
two arms (e.g., two different doses of vitamin D supplement compared to the placebo), and in this case, the same control arm was used to calculate the net change and the SE of the net change as for two independent comparisons.
Meta-analysis
Overall, we did not perform new meta-analyses in this report because of large degree of clinical and methodological heterogeneity across studies. However, we reanalyzed an existing meta-analysis using available data in the all-cause mortality section. We performed random effects model meta-analyses of risk ratios using the DerSimonian and Laird model.28 The random effects model assigns a weight to each study that is based both on the individual study variance and the between-study heterogeneity. Compared with the fixed effect model, the random effects model is more conservative in that it results in broader confidence intervals when hen between-study heterogeneity is present. We tested for heterogeneity using Cochran’s Q (considered significant for P <0.10) and quantified its extent with I2 29,30. I2 ranges between 0 and 100% and quantifies the proportion of between-study variability that is attributed to heterogeneity rather than chance.
Intercooled Stata SE version 9.2 and Meta-Analyst version 3.2 (developed by Tufts EPC) were used for analyses. All P values are two tailed and considered significant when less than 0.05, unless otherwise indicated.
Grading of studies analyzed in this evidence report
Studies included as part of accepted in this report have been designed, conducted, analyzed, and reported with various degrees of methodological rigor and completeness. Deficiencies in any of these items may lead to biased reporting or interpretation of the results. While it is desirable to have a simple evidence grading system using a single quantity, the quality of evidence is multidimensional. A single metric cannot adequately capture information needed to interpret a study. Not withstanding these limitations, providing an indication of study quality adds an important dimension to the summary of published data.
We note that we did not grade the strength of evidence per outcome. Grading the strength of the evidence considers several dimensions beyond the methodological quality of the individual studies. These include but are not limited to consistency of studies, directness, precision, as well as judgments on whether conclusions are affected by systematic errors and biases.
Critical appraisal and grading of primary studies
Critical appraisal of the evidence is an important aspect of conducting a systematic review. For the assessment of interventional studies, the criteria were based on the CONSORT31 statement for reporting RCTs (a checklist with specifications for reporting important aspects of a trial). We primarily considered the methods used for randomization, allocation concealment, and blinding as well as the use of intention-to-treat analysis, the report of well-described valid primary outcomes, and the dropout rate.
For interventional studies with nonrandomized design, we used the report of eligibility criteria and assessed the adequacy of controlling for differences between compared groups in terms of baseline characteristics and prognostic factors. We also considered the reporting of
intention-to-treat analyses and crossovers when so designed, as well as important differential loss to followup between the compared groups or overall high loss to followup. The validity and the adequate description of outcomes and results were re also assessed.
For the assessment of prospective cohorts and nested case-control studies (crosssectional and retrospective case-control studies were excluded from this review), we developed a rating checklist specifically designed for nutritional epidemiology study based on some of the reporting items for cohort study in STROBE (STrengthening the Reporting of OBservational studies in Epidemiology) checklist32 and the nutrition-specific items in our previous publication.33 Items assessed include: eligibility criteria and sampling of study population, blinding of exposure and outcome assessors, dietary assessment methodology (when applicable), assay methodology of biomarkers of intake (when applicable), clear reporting of comparisons in the study, statistical analyses, adequacy of controlling for baseline characteristics and prognostic factors (including confounders), clear reporting of outcome definitions, and prospective study design with preplanned hypotheses.
The quality assessment checklists for intervention or observational studies can be found in Appendix E. Additional considerations that were not included in the checklists are described later in this section.
In this report we adapted a three-category grading system of the AHRQ Methods Reference Guide for Effectiveness and Comparative Effectiveness Reviews. Note that a single study can receive different grades for different outcomes. This system defines a generic grading system that is applicable to each type of study design including interventional and observational studies:
A
Studies have the least bias and results are considered valid. These studies adhere mostly to the commonly held concepts of high quality including the following: a formal study design; clear description of the population, setting, interventions, and comparison groups; appropriate measurement of outcomes; appropriate statistical and analytic methods and reporting; no reporting errors; less than 20 percent dropout; clear reporting of dropouts; and no obvious bias. Studies must provide valid estimation of nutrient exposure, from dietary assessments and/or biomarkers with reasonable ranges of measurement errors, and justifications for approaches to control for confounding in their design and analyses.
B
Studies are susceptible to some bias, but not sufficient to invalidate the results. They do not meet all the criteria in category “A”, they have some deficiencies but none likely to cause major bias. The study may be missing information, making it difficult to assess limitations and potential problems.
C
Studies have significant bias that may invalidate the results. These studies have serious errors in design, analysis, or reporting; there are large amounts of missing information, or discrepancies in reporting.
If the initial assigned grade was equivocal, then the study received a second round of review by an independent reviewer, and the final grade was reached via consensus. Lastly, it should be noted that the qualitygrading system evaluates and grades the studies within their own design strata (i.e., RCTs, cohorts, nested case-control). It does not attempt to assess the comparative
validity of studies across different design strata. Thus, it is important to be cognizant of the study design when interpreting the methodological quality grade of a study.
Additional considerations of methodological quality of primary studies for the purpose of DRI decision making
Randomized controlled trials of all outcomes
The Tufts EPC debated about the quality assessment of RCTs. A consensus was reached to include additional considerations for RCTs to receive grade A. The general quality assessment of interventional studies as described earlier has been widely adopted for the purpose of grading high quality effectiveness trials (in contrast with a more standardized efficacy trial) which are most relevant to the actual use of supplements. Thus the crossover of interventions (i.e., contamination between supplementation and placebo groups) affects the applicability more than the methodological quality. However, it was the consensus among the Tufts EPC methodologists that the RCTs with contamination between supplementation and placebo groups cannot receive grade A because this issue affects the actual differences in the doses given to the subjects. Therefore it is particularly important when the trial results are used to guide decisions about DRI, as opposed to decisions about whether to actively recommend supplementation for an individual.
Observational studies of cancer outcomes
When cancer cases were identified based on cancer registries or questionnaire-based data, we perused whether the investigators verify the diagnoses independently (e.g., by use of medical records or pathological reports). An observational study of cancer outcomes cannot receive grade A if the cancer diagnoses were not verify independently. We also examined if the study adequately control for other risk factors for specific cancer. We used the suggested risk factors by National Cancer Institute (www.cancer.org). An observational study of cancer outcomes cannot receive grade A if important risk factors for the specific cancer were not fully controlled for in their analyses.
Critical appraisal of systematic reviews
We also critically appraised systematic reviews utilized in this report. However, a summary quality grade for systematic review is difficult to interpret. While it may be straight forward to assign a high quality grade to a rigorously carried out systematic review of high quality primary studies, a rigorously conducted systematic review finding only poor quality primary studies to summarize has uncertain value. Similarly, a poorly conducted systematic review of high quality studies may also result in be misleading conclusions. Therefore, to appreciate its validity, the various dimensions and nuances of the systematic review must be understood.
To help readers appreciate the methodological quality of a systematic review, we applied the AMSTAR checklist,26 a tool that was created for this purpose. This tool does not assign a composite grade. Instead, the items evaluated are made explicit for the reader. Another challenge in evaluating systematic reviews is that none of the existing systematic reviews were specifically conducted to be used for DRI development; therefore their “quality”, for the purpose of DRI development, is impossible to reliably define.
In addition to using AMSTAR, we made comments on special considerations, issues or limitations concerning design, conduct and analyses of the systematic review, and interpretability of the results for the purpose of DRI development.
Reporting of the evidence
Evidence tables
Evidence tables offer a detailed description of the primarys tudies we identified that address each of the key questions. These tables provide detailed information about the study design, patient characteristics, background diet, inclusion and exclusion criteria, interventions (or exposures), comparators used, and outcomes assessed in the study. A study, regardless of how many interventions (or exposures) or outcomes were reported, appears once in the evidence tables. Evidence tables are ordered alphabetically by the first author’s last name to allow for easy searching within the tables. Evidence tables are available electronically in Appendix C.
Summary tables
Summary tables were created to assist (qualitative) synthesis of primary studies of the same outcomes and life stage. If feasible, data were also grouped by sex. Typically, in each outcome section, we presented one summary table for the study characteristics of all included studies, followed by another summary table for study findings.
We created different summary tables for different exposures (i.e., vitamin D or calcium) and for different study designs (i.e., interventional or observational studies). Key study characteristics, such as population characteristics (i.e., health status, age and sex), vitamin D assay method and season in which blood was drawn, dietary assessment methods and whether the instrument was internally validated, patient or participant adherence, and study comparisons, were presented in the summary table for study characteristics. We reported daily vitamin D doses (IU/d) and/or elemental calcium doses (mg/d) in all summary tables.
For observational studies, we also list the confounders adjusted in either design (e.g., matching factors) or analyses. If any confounders or effect modifiers in each prespecified category (i.e., nutrients, demographics, anthropometry, medical conditions, ultraviolet exposure, and life styles) were controlled for, we marked “X” in the category. Otherwise, the category was left blank.
Graphical presentation of dose-response relationship
We present graphically the results of studies associating outcomes with categorical exposures (e.g., percentiles or other arbitrary categories of 25(OH)D concentration or of total calcium intake). The graphs complement the information mentioned in the tables and allow the reader to appreciate the direction of the estimated effects, even when the choice of the reference category is inconsistent across studies. The graphs do not readily convey the slope (strength) of the dose-response relationship between exposure and outcome, because the exposure categories are simply ranked and their spacing does not necessarily correspond to the actual values that they represent within study or across studies.
Grand summary tables (evidence map)
In the beginning of the Results section, we created a grand overview table. The table details how many studies reported an outcome of interest (either as a primary or nonprimary outcome) and also listed the total number of unique studies (including systematic reviews) as each study
may have provided data on more than one outcome. The number of primary studies included in each existing systematic review is also reported.
Units of measurement
In this report, we converted serum 25(OH)D concentrations as reported by various studies as different units (i.e., ng/mL, μg/dL, μg/L and ng/dL) to nmol/L. The conversion formula is 1 ng/mL = 2.5 nmol/L. To limit the variation in the reporting of vitamin D unit (e.g., nmol, IU, μg and mg), IU was chosen as the standard unit and all other units were converted using a standard formula. The conversion formula for micrograms is 1 μg = 40 IU.
Assay method
For 25(OH)D measurements, we present information on the assay used in our evidence tables, and summary tables describing individual studies. When reported, we also recorded details on the methodology or kit used (e.g., RIA–radioimmunoassay, RIA “DiaSorin”) used. Often, additional information was lacking. We did not perform any subgroup analyses based on the type of 25(OH)D assay used.
Sunlight exposure
We report information on country where the study took place and its latitude (when this was meaningful), and when available, the season when serum 25(OH)D concentrations were measured. A substantial amount of vitamin D is formed in the skin in humans. The amount of vitamin D synthesized in the skin depends on a person’s exposure to UV irradiation. Therefore, information on country’s latitude (and season of serum 25(OH)D measurements) informs on whether different populations are likely to have similar or different amount of endogenous vitamin D production. Latitudes were extracted directly from the published reports, or extrapolated from the city or country where the study took place (by searching Google for “<county/city> latitude”). For national or international studies that spanned a wide range of latitudes (e.g., NHANES), the latitude information was summarized simply as "various." To facilitate the reader, we also provide a Table with the latitudes of major cities in Central and North America (this table is found right after the Abbreviations table on page 316.
Primary and secondary outcomes
For intervention studies, we distinguished primary from secondary (or nonspecified) outcomes. Outcomes were considered primary only when they were clearly reported as such or when the outcome was used in an ad hoc sample size calculation. For observational studies we did not separate primary from secondary outcomes. For example, many observational studies are analyses of the same well known cohorts for several different outcomes. Each of these studies may have a different “primary” outcome.
Study quality
We summarize methodological and reporting quality of individual studies and meta-analyses. More details on the reporting characteristics of individual studies and systematic reviews are found in the evidence tables (Appendix C).
Organization of the Results Section
The Results section is organized in the following way:
Chapter 3.
Results
Literature search results
The original MEDLINE® and Cochrane Central database search for primary studies yielded 15,621 citations of generic health outcomes and 194 citations of adverse or safety outcomes. The update search for primary studies published between September, 2008 and April, 2009 yielded 918 citations. We identified 654 of these as potentially relevant and retrieved the full-text articles for further evaluation. Of these, 478 did not meet eligibility criteria (Appendix E); thus, a total of 165 primary study articles met the inclusion criteria and were included in this report (Figure 5). Of the 165 primary study articles, 60 were randomized controlled trials (RCTs), 3 were nonrandomized comparative studies, and 102 were observational studies (either cohort or nested case-control studies). The publication dates of the 165 primary study articles ranged from 1980 to 2009.
The MEDLINE®, Cochrane Database of Systemic Reviews, and the Health Technology Assessments database search for systematic reviews yielded 1746 citations. We identified 68 of these as potentially relevant and retrieved the full-text articles for further evaluation. Of these, 46 did not meet eligibility criteria. After examining the 22 qualifying systematic reviews, 11 were re excluded for various reasons (Appendix D; Figure 5).
The grand overview tables (Tables 1, 2, and 3) detailed how many studies reported an outcome (either as a primary or secondary outcome) that is of interest and also listed the total number of unique studies (including those from systematic reviews) as each study may have provided data for more than one outcome.
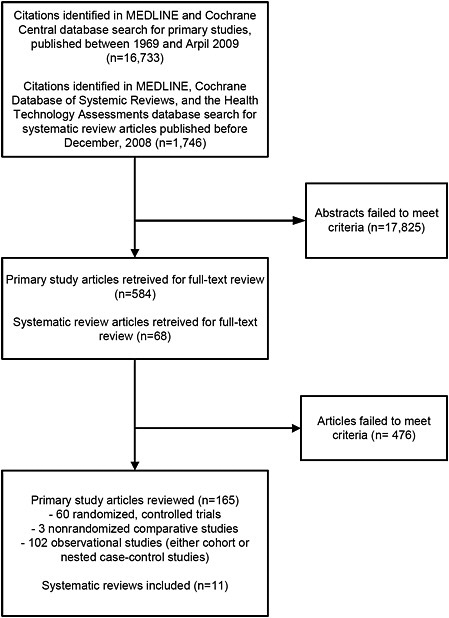
Table 1. Number of primary studies on Vitamin D intake or concentration and specific health outcomes that could be applicable to certain life stages
|
|
|
Shaded cells indicate that either the eligibility criteria excluded outcomes in those life stages or the outcomes are not applicable to those life stages. Blank unshaded cells indicate no primary studies were identified in this report in those life stages. A only RCTs were eligible for this outcome B Relationship between maternal 25(OH)D concentration and a topic eczema in infants C 1 study was a combined analysis of Nurses Health Study and Health Professionals Follow-up Study |
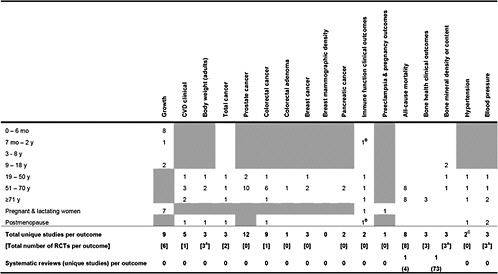
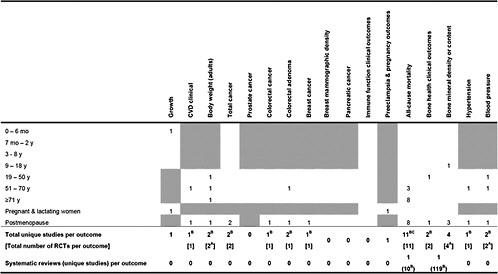
Table 2. Number of primary studies on calcium intake and specific health outcomes that could be applicable to certain life stages
|
|
|
Shaded cells indicate that either the eligibility criteria exclued outcomes in those life stages of the outcomes are not applicable to those life stages. Blank unshaded cells indicate no primary studies were identified in this life stages. A Only RCTs were eligible for this outcome B Association between total calcium intake in childhood and colorectal cancer after 65 years of followup C 1 study was a combined analysis of Nurses Health Study and Health Professionals Follow-up Study D 6 analyses, including 2 separate analyses of NHANES I |
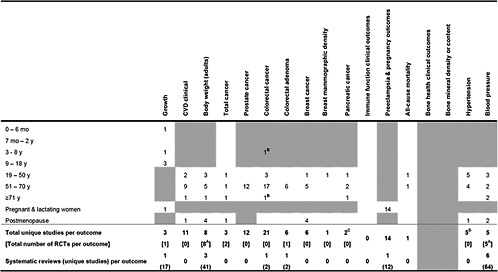
Table 3. Number of primary studies on combined vitamin D and calcium intake and specific health outcomes that are relevant to certain life stages
|
|
|
Shaded cells indicate that either the eligibility criteria excluded outcomes in those life stages or the outcomes are not applicable to those life stages. Blank unshaded cells indicate no primary studies were identified in this report in those life stages. A Only RCTs were eligible for this outcome B Including the Women’s Health Initiative (WHI) trial C A de novo reanalysis of the 10 RCTs in a previous systematic review and one newly added trial |
Vitamin D and health outcomes
Vitamin D and growth
We reviewed primary studies that evaluated relationships between vitamin D and growth parameters in infants and children.
Synopsis
Seven intervention studies and two observational studies evaluated intake or exposure to vitamin D and growth parameters in infants and children. Two intervention studies from the same center found a significant association of maternal vitamin D intakes with infant birth weights. Study methodologies were incompletely reported in these two studies. The rest of the studies did not find a significant association between either maternal or offspring vitamin D intake and offspring’s weight or height. No overall conclusions could be drawn as the studies reviewed had diverse populations and methodological approaches.
Detailed presentation (Tables 4, 5, 6 & 7)
Six RCTs34-40 and one nonrandomized comparative study41 in eight publications reported on the effect of vitamin D supplementation on growth parameters in infants and children. Two cohort studies reported on the association between maternal serum 25(OH)D concentration and her offspring’s growth parameters.42,43 The number of subjects in the RCTs ranged from 19 to 200. The two cohort studies had 374 and 466 subjects, respectively. The latitudes of the studies ranged from 38º to 51º. Four studies administered vitamin D exclusively to expectant mothers during the third trimester of pregnancy. One study administered vitamin D to both the lactating mothers and her offspring. Two studies administered vitamin D only to the infants or children. Followup ranged from delivery until 9 years. Methodological quality of two studies were rated B and seven studies were rated C. T he studies were limited by such factors as incomplete reporting and small sample sizes.
Infant 0 - 6 months; 7 months - 2 years; pregnant or lactating women
One RCT from UK administered vitamin D 1000 IU/d or placebo to 126 expectant mothers (first generation Asian immigrants) during the third trimester and found no significant difference between the infants’ birth weights or birth lengths and those of the control population.34,38 There were twice as many low birth weight infants (<2500 g) in the control group compared to the supplemented group (21.7% vs. 11.9%); however, this difference was not significant. A study from US supplemented 10 lactating mothers with vitamin D 400 IU/d and their infants with 300 IU/d for 6 months. Compared to the group where nine mothers received 6400 IU/d and their infants none, there was no significant difference in the infants’ weight or length at 1 month, 4 months, and 7 months of age.39 A study from China randomly assigned 255 newborn infants to 100, 200, or 400 IU/d of vitamin D for 6 months and reported no significant difference in weight or length among the three groups at 6 months of age.36 One study from India randomly selected 100 expectant mothers to receive a total of 1.2 million IU of vitamin D (600,000 IU of vitamin D2 in 7th and 8th month) during the third trimester. The newborns’ birth weight was significantly increased compared to those from 100 unsupplemented expectant mothers (difference 190 g).37 Important elements of the study methodology like randomization technique and any blinding of outcome assessors were not reported. An earlier nonrandomized comparison from the same study center involving smaller samples reported similar findings.41 The estimated baseline mean
dietary vitamin D intake in the expectant mothers from these two studies was less than 30 to 35 IU/d (the validity of these measures is unclear). An RCT from France supplemented 48 expectant mothers with either vitamin D 1000 IU/d in the third trimester or 200,000 IU one time dose at 7 month pregnancy and found no significant difference in the infants’ birth weights between the two methods.40 A cohort study from Australia analyzed the maternal serum 25(OH)D concentration in 374 women at 28-32 week gestation (geometric mean in winter 48 nmol/L; summer 69 nmol/L) and found no association with infant birth weight or length.43 One cohort study from UK analyzed the serum 25(OH)D concentration in 466 white women in late pregnancy (~33 wk) and found the concentrations (from <30 to >75 nmol/L) were not related to their offspring’s weight or height at birth, 9 months, and 9 years.42
9 - 18 years
One RCT of vitamin D3 (placebo, 200, or 2000 IU/d for 1 year) on girls in Lebanon aged 10-17 years found no significant difference at 1 year followup in weight or height among the 34 girls who were premenarchal at time of enrollment.35
Findings by life stage
-
0 – 6 mo One RCT found that supplementing expectant mothers with vitamin D 1000 IU/d during the 3rd trimester has no effect on infant birth weight or length. Another RCT found that supplementing expectant mothers with a total of 1.2 million IU of vitamin D during the 3rd trimester effected a significant increase in birth weight (+190 g). Background diet is low in vitamin D in this study. A studycompared supplementing lactating mothers with vitamin D 400 IU/d and their infants 300 IU/d for 6 months with mothers supplemented with 6400 IU/d and their infants none, there was no significant difference in the infants’ weight or length at 1 month, 4 months, and 7 months of age. Another study compared supplementing newborn infants with 100, 200, or 400 IU/d of vitamin D for 6 months and reported no significant difference in weight or length at 6 months of age. An RCT supplemented expectant mothers with either vitamin D 1000 IU/d during the third trimester or 200,000 IU one time dose at 7 month pregnancy and found no significant difference in the infants’ birth weights between the two methods. A cohort study analyzed the maternal serum 25(OH)D concentration at 28-32 week gestation (geometric mean in winter 48 nmol/L; summer 69 nmol/L) and found no association with infant birth weight or length. Another cohort study found that serum 25(OH)D concentration (ranged from <30 to >75 nmol/L) in late pregnancy (~33 wk) was not related to the newborn’s weight or height at birth, 9 months, and 9 years.
-
7 mo – 2 y A cohort study found that serum 25(OH)D concentration (ranged from <30 to >75 nmol/L) in late pregnancy (~33 wk) was not related to the newborn’s weight or height at birth, 9 months, and 9 years.
-
3 – 8 y No study covered this life stage.
-
9 – 18 y A cohort study found that serum 25(OH)D concentration (ranged from <30 to >75 nmol/L) in late pregnancy (~33 wk) was not related to the newborn’s weight or height at birth, 9 months, and 9 years. One RCT of vitamin D3 (placebo, 200, or 2000 IU/d for 1 year) on girls 10-17 years old found no significant difference at 1 year followup in weight or height among the girls who were premenarchal at time of enrollment.
-
19 – 50 y Not reviewed
-
51 – 70 y Not reviewed
-
≥71 y Not reviewed
-
Postmenopause Not reviewed
-
Pregnant & lactating women One RCT found that supplementing expectant mothers with vitamin D 1000 IU/d during the 3rd trimester has no effect on infant birth weight or length. Another RCT found that supplementing expectant mothers with a total of 1.2 million IU of vitamin D during the 3rd trimester effected a significant increase in birth weight (+190 g). Background diet is low in vitamin D in this study. A study compared supplementing lactating mothers with vitamin D 400 IU/d and their infants 300 IU/d for 6 months with mothers supplemented with 6400 IU/d and their infants none, there was no significant difference in the infants’ weight or length at 1 month, 4 months, and 7 months of age. An RCT supplemented expectant mothers with either vitamin D 1000 IU/d during the third trimester or 200,000 IU one time dose at 7 month pregnancy and found no significant difference in the infants’ birth weights between the two methods.
Table 4. Vitamin D on growth outcome: Characteristics of interventional studies
|
Author Year Study Name Location (Latitude) [PMID] |
Population |
Background Calcium Intake & Vitamin D Data |
Comparisons |
Compliance |
Comments |
|
|
RCTs |
||||||
|
Maxwell 198138 Brooke 198034 UK (51ºN) [6793058] [6989438] |
• Health status |
pregnancy |
25(OH)D at 28-32 wk: 20.1 nmol/L |
Vit D 1000 IU/d 3rd trimester only |
nd |
First generation Asian immigrants only |
|
• Mean age (range/SD), y |
nd |
|
||||
|
• Male (%) |
0 |
|||||
|
Feliciano 199436 China (22ºN to 47ºN) [8078115] |
• Health status |
healthy term |
86% infant breastfed until 5-6 mo |
Vit D 100 IU/d vs. 200 IU/d vs. 400 IU/d |
nd |
|
|
• Mean age (range/SD), y |
newborn |
|
|
|||
|
• Male (%) |
nd |
|
|
|
||
|
El-Hajj 200635 Lebanon (33ºN) [16278262] |
• Health status |
healthy |
25(OH)D 35 nmol/L; dietary Ca 677 mg/d |
Vit D3200 IU/d vs. 2000 IU/d vs. placebo × 1 y |
98% in placebo; 98% in low dose; 97% in high dose |
7.4 h sun exposure/wk |
|
• Mean age (range/SD), y |
13.2 (10-17) |
|
|
|||
|
• Male (%) |
0 |
|
|
|||
|
Wagner 200639 Charleston, US (32ºN) [17661565] |
• Health status |
Fully lactating; <1 mo postpartum |
Lactating mother’s dietary vit D 273 IU/d; dietary calcium intake: 1125 mg/d; |
Mother Vit D3 400 IU/d + infant 300 IU/d vs. mother 6400 IU/d + infant 0 IU/d |
80% in mothers; as low as 61% for infants |
78% white; 11% black; 11% Hispanic |
|
• Mean age (range/SD), y |
29 |
|
||||
|
• Male (%) |
0 |
|
|
|||
|
Marya 198837 India (28ºN) [3243609] |
• Health status |
no pregnancy-related complications |
Expectant mother’s dietary Vit D 35 IU/d; calcium 429 mg/d |
Mother Vit D 1.2 mil IU (total; 600,000 IU vit D2 in 7th & 8th mo) vs. no supplement |
nd |
|
|
• Mean age (range/SD), y |
24 |
|
|
|||
|
• Male (%) |
0 |
|
|
|||
|
Mallet 198640 France (48º N) [3755517] |
• Health status |
pregnancy |
Ca intake 550 to 1000 mg/d in 55% of the subjects |
Vit D 1000 IU/d vs. 200,000 IU 1× dose |
nd |
|
|
• Mean age (range/SD), y |
newborn |
|
||||
|
• Male (%) |
nd |
|
|
|
||
|
Nonrandomized comparative study |
||||||
|
Marya 198141 India (28ºN) [7239350] |
• Health status |
no pregnancy-related complications |
Expectant mother’s daily milk intake <500 mL; dietary Vit D <30 IU/d |
Vit D 1200 IU/d + Ca 375 mg/d (3rd trimester) or Vit D 1.2 mil IU (total; 600,000 IU in 7th & 8th mo) or no supplement |
nd |
|
|
• Mean age (range/SD), y |
nd |
|
||||
|
• Male (%) |
0 |
|
|
|||
Table 5. Vitamin D and growth outcomes: Characteristics of cohort studies
|
Author Year Study Name Location (Latitude) [PMID] |
Population |
Vitamin D Concentration |
Comparisons |
Confounders/Effect Modifiers Adjusted |
Comments |
|||||||
|
Nutrients |
Demograph |
Anthrop |
Medical |
UV exposure |
Lifestyle |
|||||||
|
Morley 200643 Australia (38ºS) [16352684] |
• Health status |
singleton pregnancy; no disease |
• Assay method |
RIA |
Length and weight in offspring stratified by mother’s 25(OH)D |
|
X |
X |
|
X |
X |
99% white; excluded dark skin or women with concealing clothing |
|
• Mean age (range/SD), y |
29 |
|
|
|
|
|
|
|
|
|||
|
|
• Male (%) |
0 |
• Season blood drawn |
winter & summer |
|
|
|
|
|
|
|
|
|
Gale 200842 PAHSG UK (50ºN) [17311057] |
• Health status |
singleton pregnancy <17 wk |
• Assay method |
RIA |
Length and weight in offspring stratified by mother’s 25(OH)D |
|
X |
|
|
X |
|
White only |
|
• Mean age (range/SD), y |
26.3 |
|||||||||||
|
|
• Male (%) |
0 |
• Season blood drawn |
nd |
|
|
|
|
|
|
|
|
Table 6. Vitamin D and growth outcomes: Results of RCTs
|
Author Year Study Name [PMID] |
Life Stage |
Outcome |
1°/2° |
Mean Followup |
Interventions, Daily Dose |
No. Analyzed |
Unit |
Baseline |
Change (SD) |
Change 95% CI |
Net Diff |
Net Diff 95% CI |
P Btw |
Study Quality |
|
Maxwell 198138 Brooke 198034 [6793058] [6989438] |
Pregnant women & infant 0-6 mo (Asians) |
Infant birth weight |
2° |
until delivery |
Vit D 1000 IU |
59 |
g |
NA |
Final 3157 |
3037, 3277 |
Diff +123 |
−50, 296C |
NS |
B |
|
|
|
Control |
67 |
|
NA |
3034 |
2909, 3159 |
|
|
|
||||
|
Infant birth length |
2° |
until delivery |
Vit D 1000 IU |
59 |
cm |
NA |
Final 49.7 |
49.6, 49.8 |
Diff +0.2 |
0.1, 0.3C |
NS |
|||
|
|
|
|
Control |
67 |
|
NA |
49.5 |
49.4, 49.6 |
|
|
|
|||
|
Feliciano 199436 [8078115] |
0-6 mo |
Weight gain born in spring, N. ChinaA |
1° |
6 mo |
Vit D 400 IU |
12 |
g |
nd |
3745 |
2613, 4877 |
−463 |
926C |
NS |
C |
|
|
|
|
Vit D 200 IU |
13 |
|
nd |
5296 |
4718, 5874 |
1088 |
96, 2080C |
NS |
|||
|
|
|
|
Vit D 100 IU |
17 |
|
nd |
4208 |
3402, 5013 |
|
|
|
|||
|
|
|
Length gain born in spring, N. China |
1° |
6 mo |
Vit D 400 IU |
12 |
cm |
nd |
18.8 |
17.4, 20.2 |
−0.5 |
−2.7, 1.7C |
NS |
|
|
|
|
|
|
Vit D 200 IU |
13 |
|
nd |
19.0 |
18.1, 19.9 |
−0.3 |
−2.2, 1.6C |
NS |
||
|
|
|
|
|
Vit D 100 IU |
15 |
|
nd |
19.3 |
17.6, 21.0 |
|
|
|
||
|
El-Hajj 200635 [16278262] |
9-18 y female, premenarche |
Height |
2° |
1 y |
Vit D3 2000 IU |
nd, ≤34 total |
% |
nd |
5.6% |
|
~1.8% |
~0.6, 3.0 |
0.07 |
C |
|
|
|
Vit D3 200 IU |
|
nd |
5.0% |
|
~1.2% |
−0.01, 2.4C |
|
|||||
|
|
|
Placebo |
|
nd |
3.8% |
|
|
|
|
|||||
|
|
|
Weight |
2° |
1 y |
Vit D3 2000 IU |
nd, ≤34 total |
% |
nd |
18.4% |
|
~3.5% |
~-1.3, 8.3C |
0.25 |
|
|
|
|
|
|
Vit D3 200 IU |
|
nd |
15.3% |
|
~0.4 |
−3.7, 4.5C |
|
|||
|
|
|
|
|
Placebo |
|
nd |
14.9% |
|
|
|
|
|||
|
Wagner 200639 [17661565] |
Lactating mothers & infant 0 - 6 mo; 7 mo - 2 y |
Infant weightB |
1° |
7 mo |
Mother (400) |
10 |
g |
NA |
Final 7600 |
7100, 8100 |
Diff -800 |
−2300, 700C |
0.30 |
C |
|
|
|
+infant (300) |
|
|
|
|
|
|
|
|
||||
|
|
|
Mother (6400) |
9 |
|
NA |
8400 |
7700, 9100 |
|
|
|
||||
|
|
|
+infant (0) |
|
|
|
|
|
|
|
|
||||
|
|
Infant length |
1° |
7 mo |
Mother (400) |
10 |
cm |
NA |
Final 65.5 |
64.4, 66.6 |
Diff −3.8 |
−7.8, 0.2C |
0.06 |
||
|
|
|
|
|
+infant (300) |
|
|
|
|
|
|
|
|
||
|
|
|
|
|
Mother (6400) |
9 |
|
NA |
69.3 |
67.4, 71.2 |
|
|
|
||
|
|
|
|
|
+infant (0) |
|
|
|
|
|
|
|
|
||
|
Marya 198837 India [3243609] |
Pregnant women & infant 0-6 mo |
Birth weight |
1º |
Delivery |
Vit D 1.2 mil |
100 |
g |
NA |
Final 2990 |
2920, 3060 |
Diff +190 |
90, 290C |
<0.001 |
C |
|
|
|
IU total |
|
|
|
|
|
|
|
|
||||
|
|
|
No supplement |
100 |
|
NA |
2800 |
2730, 2870 |
|
|
|
||||
|
|
|
Birth length |
2º |
|
Vit D 1.2 mil |
100 |
cm |
NA |
Final 50.06 |
49.7, 50.4 |
Diff +1.6 |
1.1, 2.1C |
<0.001 |
|
|
|
|
|
|
IU total |
|
|
|
|
|
|
|
|
||
|
|
|
|
|
No supplement |
100 |
|
NA |
48.45 |
48.1, 48.8 |
|
|
|
||
|
Marya 198141 [7239350]E |
Pregnant women & infant 0-6 mo |
Birth weight |
2º |
Delivery |
Vit D 1.2 mil |
20 |
g |
NA |
Final 3140 |
2940, 3340 |
Diff +410 |
166, 654C |
0.001 |
C |
|
|
|
IU total |
|
|
|
|
|
|
|
|
||||
|
|
|
Vit D 1200 IU |
25 |
g |
NA |
Final 2890 |
2760, 3020 |
Diff +160 |
0, 320C |
0.05 |
||||
|
|
|
|
+ 375 mg Ca (3rd trimester) |
|
|
|
|
|
|
|
|
|||
|
|
|
|
|
No supplement |
75 |
|
NA |
2730 |
2650, 2810 |
|
|
|
|
Author Year Study Name [PMID] |
Life Stage |
Outcome |
1°/2° |
Mean Followup |
Interventions, Daily Dose |
No. Analyzed |
Unit |
Baseline |
Change (SD) |
Change 95% CI |
Net Diff |
Net Diff 95% Cl |
P Btw |
Study Quality |
|
Mallet40 1986 France (48º N) [3755517] |
Pregnant women & infant 0-6 mo |
Birth weight |
2° |
delivery |
Vit D 1000 IU |
21D |
g |
NA |
Final 3370 (80) |
|
Diff +160 |
|
NS |
C |
|
|
|
|
|
Vit D 200,000 IU 1× dose |
27D |
|
NA |
3210 (90) |
|
|
|
|
|
|
|
A See Table 1 in original paper for complete results stratified by North vs. South China and birth in spring vs. fall B See Table 3 in original paper for results on 1 mo and 4 mo C Estimated from available data D Estimated from number of mothers; number of infants not reported E This is not an RCT; the supplemented groups were randomized, but not the control (non-supplemented group); data from comparisons between the supplemented groups not reported. |
||||||||||||||
Table 7. Vitamin D and growth outcomes: Results of cohort studies
|
Author Year Study Name PMID |
Life Stage |
Outcome (n/N; Incidence) |
Followup Duration |
Maternal 25(OH)D concentration, nmol/L |
No. in Category |
Final value |
Final SD |
P value |
Study Quality |
|
Morley 200643 Australia [16352684] |
Pregnant women; infant 0-6 mo |
Birth weight (N=374) |
Delivery |
<28 at 28-32 wk |
27 |
3397 g |
57 |
NS |
B |
|
|
|
≥28 at 28-32 wk |
347 |
3555 |
52 |
|
|||
|
|
Birth length (N=374) |
Delivery |
<28 at 28-32 wk |
27 |
49.8 cm |
2.7 |
NS |
||
|
|
|
|
|
≥28 at 28-32 wk |
347 |
50.4 |
2.4 |
|
|
|
Gale 200842 PAHSG, UK [17311057] |
Pregnant women; infant 0-6 mo |
Birth weight (N=466) |
Delivery |
<30 (Quartile) |
nd |
3.38 kg |
0.46 |
0.25A |
C |
|
|
|
|
|
30-50 |
nd |
3.40 |
0.56 |
||
|
|
|
|
|
50-75 |
nd |
3.49 |
1.57 |
||
|
|
|
|
|
>75 |
nd |
3.43 |
0.51 |
||
|
|
|
Weight at 9 mo (N=440) |
9 mo |
<30 |
nd |
15.9 |
1.14 |
0.58 |
|
|
|
|
|
|
30-50 |
nd |
15.8 |
1.26 |
||
|
|
|
|
|
50-75 |
nd |
16.1 |
1.34 |
||
|
|
|
|
|
>75 |
nd |
15.9 |
1.09 |
||
|
|
|
Weight at 9 y (N=178) |
9 y |
<30 |
nd |
27.4 kg |
1.19 |
0.10 |
|
|
|
|
|
|
30-50 |
nd |
29.4 |
1.21 |
||
|
|
|
|
|
50-75 |
nd |
30 |
1.20 |
||
|
|
|
|
|
>75 |
nd |
29.3 |
1.19 |
||
|
|
Pregnant women; infant 0-6 mo |
Birth length (N=466) |
Delivery |
<30 |
nd |
50 cm |
1.83 |
0.15 |
|
|
|
|
|
|
30-50 |
nd |
50 |
2.29 |
||
|
|
|
|
|
50-75 |
nd |
50.5 |
2.25 |
||
|
|
|
|
|
>75 |
nd |
50.1 |
2.09 |
||
|
|
|
Length at 9 mo (N=440) |
9 mo |
<30 |
nd |
71.2 cm |
2.85 |
0.86 |
|
|
|
|
|
|
30-50 |
nd |
71.4 |
2.60 |
||
|
|
|
|
|
50-75 |
nd |
71.7 |
2.89 |
||
|
|
|
|
|
>75 |
nd |
71.1 |
2.67 |
||
|
|
|
Height at 9 y (N=178) |
9 y |
<30 |
nd |
129.6 cm |
5.88 |
0.19 |
|
|
|
|
|
|
30-50 |
nd |
131.5 |
6.66 |
||
|
|
|
|
|
50-75 |
nd |
131.8 |
5.09 |
||
|
|
|
|
|
>75 |
nd |
130.6 |
6.45 |
||
|
ANon-adjusted |
|||||||||
Vitamin D and cardiovascular disease
Synopsis
No qualified systematic reviews have evaluated the association between vitamin D intake or serum 25(OH)D concentrations and incidence of hypertension. One RCT of almost 2700 elderly British who received either vitamin D3 100,000 IU every 4 months or placebo for 5 years found no statistically significant difference in event rates for various cardiovascular outcomes, including total events and cardiovascular deaths. No effects were also found in subgroup analyses of men and women. Three cohort and one nested case-control studies have analyzed the association between serum 25(OH)D concentrations and cardiovascular outcomes (cardiovascular events, nonfatal myocardial infarction or fatal coronary heart disease, cardiovascular death, myocardial infarction, and stroke). Significant associations were found between progressively lower 25(OH)D concentration and progressively increased risk of cardiovascular events in two studies of people approximately 40 to 75 years old. No significant associations were found between serum 25(OH)D concentrations and cardiovascular death, myocardial infarction, or stroke in one studyeach.
Detailed presentation (Tables 8, 9, 10 & 11; Figure 6)
Total cardiovascular events
Total cardiovascular events were evaluated by an RCT,44 the Framingham Offspring Study (FOS),45 and a nested case-control study derived from the Health Professionals Follow-up Study (HPFS).46 The RCT found no significant effect of vitamin D; both cohort studies found significant negative associations between serum 25(OH)D concentrations and outcomes.
The RCT randomized almost 2700 elderly participants (65-85 years) from the general population in Ipswich, UK (52° N) to vitamin D3 100,000 IU every 4 months or placebo.44 After 5 years, 36 percent of the participants had a cardiac or cerebrovascular event, but there was no statistically significant difference between those taking vitamin D or placebo. Similar results were found in subgroups of men and women. The RCT was rated quality B primarily due to inadequate verification of outcomes.
The FOS cohort evaluated 1739 men and women with no history of cardiovascular disease and a mean age of 59 years (based on the standard deviation, with an approximate rage of 41 to 77 years).45 After 5.4 years, 6.9 percent had a cardiovascular event (including myocardial infarction, coronary insufficiency, angina, stroke, transient ischemic attack, claudication, and heart failure). Overall, the methodological quality of the study was A; though their secondary analysis of three categories of serum 25(OH)D concentrations (as opposed to two categories) was rated C due to incomplete reporting and lack of adjustment for important variables including season of blood draw. In their primary analysis, people with serum 25(OH)D concentrations less than 37.5 nmol/L were 70 percent more likely (P=0.02) to have a cardiovascular event. In their secondary analysis, those with 25(OH)D concentrations between 25 and 37.5 nmol/L were about 50 percent more likely (P=0.01) to have an event than those with higher concentrations. Furthermore, a multivariable analysis of continuous 25(OH)D concentrations suggested increased likelihoods of cardiovascular e vents in those with 25(OH)D concentrations below approximately 50 to 55 nmol/L.
In a nested case-control study of the HPFS, 454 men 40 to 75 years old with no cardiovascular history who had a nonfatal myocardial infarction or coronary heart disease death
over a 10 year period were matched with 1354 controls.46 The methodological quality of the analysis was A, although due to limitations on analyzable serum, the investigators had to use a case-control analysis instead of a complete analysis of all eligible men in the HPFS. Across four categories of men based on their serum 25(OH)D concentrations, lower concentrations were significantly associated with increased cardiovascular events (trend across categories P=0.02). Compared with men who had 25(OH)D concentrations above 75 nmol/L, those with 25(OH)D concentrations 56 to 75 nmol/L had an adjusted relative risk (RR) of 1.6 (95% CI 1.1, 2.3), those with 25(OH)D 37.5 to 56 nmol/L had an RR of 1.4 (95% CI 0.96, 2.1), and those with 25(OH)D below 37.5 nmol/L had an RR of 2.1 (95% CI 1.2, 3.5).
Cardiovascular death
The British RCT of vitamin D3 100,000 IU every 4 months versus placebo analyzed cardiovascular death as a primary outcome; 8 percent of the participants had cardiovascular deaths within 5 years.44 Fewer people taking vitamin D3 supplements had cardiovascular deaths (RR = 0.84), but this finding was not statistically significant (95% CI 0.65, 1.10). Similar results were found in subgroups of men and women.
An analysis of NHANES III (methodological quality C) evaluated cardiovascular death (due to hypertensive disease, ischemic heart disease, arrhythmia, heart failure, cerebrovascular disease, atherosclerosis or other disease of the arteries) in over 13,000 men and women regardless of baseline medical history.47 During almost 9 years of followup, 5.8 percent had a cardiovascular death. The analysis compared four categories of serum 25(OH)D concentrations ranging from less than 44.5 nmol/L to more than 80 nmol/L. No significant association was found between serum 25(OH)D concentration and cardiovascular death.
Ischemic heart disease
The RCT evaluated total ischemic heart disease.44 In this elderly British population, 17% had an ischemic heart disease event; no effect of vitamin D3 supplementation was found. Similar results were found in subgroups of men and women.
Ischemic heart disease death
The RCT evaluated total ischemic heart disease death as a primary outcome.44 In the trial, 3.4% had an ischemic heart disease event; no effect of vitamin D3 supplementation was found (RR = 0.84 [95% CI 0.56, 1.27]). Similar results were found in subgroups of men and women.
Myocardial infarction
In one small analysis, 755 elderly (age 65 to 99 years) Finnish men and women, regardless of cardiovascular history, were evaluated on the basis of myocardial infarction (methodological quality C due to lack of reporting of relevant data including information on the serum 25(OH)D or 1,25(OH)2D concentrations within the tertiles).48
During 10 years of followup, 17 percent of the participants had a myocardial infarction. Both analyses of serum 25(OH)D and 1,25(OH)2D concentrations found no significant association with risk of myocardial infarction.
Stroke
The RCT evaluated total cerebrovascular disease.44 In this elderly British population, 7.7% had a cerebrovascular event; no effect of vitamin D3 supplementation was found. Similar results were found in subgroups of men and women.
Stroke was evaluated in the same small Finnish study. During 10 years of followup, 9.3 percent of the participants had a stroke. Both analyses of serum 25(OH)D and 1,25(OH)2D concentrations found no significant association with th risk of stroke.
Cerebrovascular death
The RCT evaluated cerebrovascular disease death as a primary outcome.44 In the trial, 2.0% had a fatal stroke; no effect of vitamin D3 supplementation was found. Similar results were found in subgroups of men and women.
Findings per vitamin D concentration
The RCT compared vitamin D3 supplementation 100,000 IU every 4 months with placebo, but found no effect on cardiovascular outcomes. Two cohort studies found a significant association between higher serum 25(OH)D concentrations and lower risk of combined cardiovascular events. Both found that those people in the highest 25(OH)D category analyzed within each study had the lowest risk. The FOS used a maximum threshold of 37.5 nmol/L; the HPFS used a maximum threshold of 75 nmol/L. The FOS provided a graphic representation of a multivariable regression of continuous 25(OH)D concentrations (Figure 2 in the study).45 The risk of cardiovascular events rose below 37 to 50 nmol/L serum 25(OH)D concentration. The Finnish cohort did not report the range of serum 25(OH)D and 1,25(OH)2D concentrations.48
Findings per age and sex
The single RCT included elderly people from the general population. No effects on various cardiovascular events were found. Subgroup analyses of men and women yielded similar findings. The four cohort studies included adults across the full age range. Three of the cohorts included about half men and women; one included only men. None evaluated potential differences in associations based on age or sex, but no differences were evident across studies.
Findings by life stage
-
0 – 6 mo Not reviewed
-
7 mo – 2 y Not reviewed
-
3 – 8 y Not reviewed
-
9 – 18 y Not reviewed
-
19 – 50 y For cardiovascular events, only a minority of evaluated participants were within this life stage (almost all above 40 years). The NHANES III study, which found no association between serum 25(OH)D concentration and cardiovascular death, included largely people within this life stage.
-
51 – 70 y The majority of people investigated for the association between serum 25(OH)D concentration and cardiovascular events were within this life stage. Significant negative associations were found between lower serum 25(OH)D concentrations and cardiovascular events, across a range of 25(OH)D concentrations. The NHANES III study likely included many people within this life stage; no association was found with cardiovascular death.
-
≥71 y The majority of participants in the British RCT included men and women within this age group. Vitamin D supplementation was not found to have an effect on cardiovascular outcomes. Among the cohort studies, only the small Finnish study adequately evaluated people within this life stage. No significant associations were found between serum 25(OH)D or 1,25(OH)2D concentrations and either myocardial infarction or stroke, however, the absolute concentrations were not reported.
Table 8. Vitamin D and cardiovascular outcomes: Characteristics of RCTs
|
Author Year Study Name Location (Latitude) [PMID] |
Population |
Background Calcium Intake & Vitamin D Data |
Comparisons |
Compliance |
Comments |
|
|
Trivedi 20044 Ipswich, UK (52°N) [12609940] |
• Health status |
General population |
742 mg/day (at 4 years, no difference by treatment allocation) |
Vit D3 100,000 IU vs placebo every 4 months |
76% with at least 80% compliance; 66% at last dose (80% if excluding deaths) |
|
|
• Mean age (range), y |
75(65-85) |
|
||||
|
|
• Male (%) |
76% |
|
|
|
|
Table 9. Vitamin D and cardiovascular outcomes: Results of RCTs
|
Author Year Study Name [PMID] |
Age Range, Sex (Subgp) |
Outcome |
1°/2° |
Mean Followup |
Interventions, Daily Dose |
n Event |
N Total |
Outcome Metric (Comparison) |
Result |
95% CI |
P Btw |
Study Quality |
|
Trivedi 20044 [12609940] |
65-85 y, Both |
CVD, total |
2° |
5 y |
Vit D3 100,000 IU every 4 mo |
477 |
1345 |
Age adj RR (Vit D/Placebo) |
0.90A |
0.77, 1.06 |
0.22 |
B |
|
|
|
|
|
|
Placebo |
503 |
1341 |
|
|
|
|
|
|
|
|
IHD, total |
2° |
|
Vit D3 |
224 |
1345 |
Age adj RR (Vit D/Placebo) |
0.94A |
0.77, 1.15 |
0.57 |
|
|
|
|
|
|
|
Placebo |
233 |
1341 |
|
|
|
|
|
|
|
|
CeVD, total |
2° |
|
Vit D3 |
105 |
1345 |
Age adj RR (Vit D/Placebo) |
1.02A |
0.77, 1.36 |
0.87 |
|
|
|
|
|
|
|
Placebo |
101 |
1341 |
|
|
|
|
|
|
|
|
CVD death |
1° |
|
Vit D3 |
101 |
1345 |
Age adj RR (Vit D/Placebo) |
0.84A |
0.65, 1.10 |
0.20 |
|
|
|
|
|
|
|
Placebo |
117 |
1341 |
|
|
|
|
|
|
|
|
IHD death |
1° |
|
Vit D3 |
42 |
1345 |
Age adj RR (Vit D/Placebo) |
0.84A |
0.56, 1.27 |
0.41 |
|
|
|
|
|
|
|
Placebo |
49 |
1341 |
|
|
|
|
|
|
|
|
CeVD death |
1° |
|
Vit D3 |
28 |
1345 |
Age adj RR (Vit D/Placebo) |
1.04A |
0.61, 1.20 |
0.89 |
|
|
|
|
|
|
|
Placebo |
26 |
1341 |
|
|
|
|
|
|
A Similar results for subgroups of men and women |
||||||||||||
Table 10. Vitamin D and cardiovascular outcomes: Characteristics of cohort studies
|
Author Year Study Name Location (Latitude) [PMID] |
Population |
Vitamin D Concentration |
Comparisons |
Confounders/Effect Modifiers Adjusted |
Specific CVD Outcomes |
|||||||
|
Nutrients |
Demograph |
Anthrop |
Medical |
UV exposure |
Lifestyle |
|||||||
|
Wang 200845 Framingham Offspring Framingham, MA (mostly) (42°N) [18180395] |
• Health status |
No CVD |
• Assay method |
RIA (DiaSorin) |
Outcome stratified by 2 or 3 categories |
XA |
X |
X |
X |
XA |
X |
CVD event |
|
• Mean age (SD), y |
59 (9) |
|
|
|
|
|
|
|
|
|
||
|
• Male (%) |
45 |
• Season blood drawn |
All |
|
|
|
|
|
|
|
|
|
|
Giovannucci 200846 HPFS US (various) [18541825] |
• Health status |
No CVD |
• Dietary assessment method |
RIA (Hollis 1993) |
Outcome stratified by 4 categoriesB |
X |
X |
X |
X |
X |
X |
Nonfatal MI or fatal CHD |
|
• Mean age (range), y |
64 (40-75) |
|
|
|
|
|
|
|
|
|
||
|
|
• Male (%) |
100 |
• Internal validation? (y/n) |
All |
|
|
|
|
|
|
|
|
|
Melamed 200847 NHANES III US (various) [18695076] |
• Health status |
Any |
• Assay method |
RIA (DiaSorin) |
Outcome stratified by 4 categories |
X |
X |
X |
X |
X |
X |
CVD death |
|
• Mean age (range), y |
45 (≥20) |
|
|
|
|
|
|
|
|
|
||
|
|
• Male (%) |
46 |
• Season blood drawn |
All (even distribution) |
|
|
|
|
|
|
|
|
|
Marniemi 200548 Turku, Finland (60°N) [15955467] |
• Health status |
Any |
• Assay method |
RIA (Incstar) |
Outcome stratified by tertiles |
|
X |
|
|
|
X |
MI Stroke |
|
• Mean age (range), y |
79 (65-99) |
|
|
|
|
|
|
|
|
|
||
|
|
• Male (%) |
48 |
• Season blood drawn |
All |
|
|
|
|
|
|
|
|
|
A Not in 3-category analysis B Case-control study |
||||||||||||
Table 11. Vitamin D and cardiovascular outcomes: Results of cohort studies
|
Author Year Study Name [PMID] |
Age Range, Sex |
Outcome (n/N; Incidence) |
Followup Duration (Time to Dx) |
Vit D Measure |
Concentration, nmol/L |
No. of Cases |
No. in Category |
Adjusted OR |
95% CI |
P for Trend |
Study Quality |
|
CVD Events |
|||||||||||
|
Both Sexes |
|||||||||||
|
Wang 200845 Framingham Offspring [18180395] |
Mean (SD) 59 (9), Both |
CVD event (120/1739; 0.069) |
5.4 y |
25(OH)D |
<37.5 |
50 |
481 |
1.70 |
1.08, 2.67* |
0.02A |
A |
|
|
|
|
≥37.5 |
70 |
1258 |
1 |
Reference |
|
|
||
|
|
|
|
|
|
<25 |
nd |
nd |
1.80 |
1.05, 3.08* |
0.01 |
C |
|
|
|
|
|
|
25-37.5 |
nd |
nd |
1.53 |
1.00, 2.36* |
|
|
|
|
|
|
|
|
≥37.5 |
70 |
1258 |
1 |
Reference |
|
|
|
Men |
|||||||||||
|
Giovannucci 200846 HPFS [18541825] |
40-75 y, Men |
Nonfatal MI or fatal CHD (454 cases; 1354 controls) |
10 y |
25(OH)D |
≤37.5 |
63 |
150 |
2.09 |
1.24, 3.54 |
A |
|
|
|
|
|
|
37.5-56.25 |
156 |
463 |
1.43 |
0.96, 2.13 |
|
|
|
|
|
|
|
|
|
56.25-75 |
165 |
464 |
1.60 |
1.10, 2.32 |
|
|
|
|
|
|
|
|
>75 |
70 |
277 |
1 |
Reference |
|
|
|
CVD Death |
|||||||||||
|
Both Sexes |
|||||||||||
|
Melamed 200847 NHANES III [18695076] |
≥20 y, Both |
CVD death (777/13,331; 0.058) |
8.7 y |
25(OH)D |
<44.5 |
nd |
nd |
1.20 |
0.87, 1.64 |
nd |
C |
|
|
|
|
|
|
44.5-60.75 |
nd |
nd |
0.88 |
0.69, 1.14 |
|
|
|
|
|
|
|
|
60.75-80.25 |
nd |
nd |
0.83 |
0.65, 1.07 |
|
|
|
|
|
|
|
|
>80.25 |
nd |
nd |
1 |
Reference |
|
|
|
Myocardial Infarction |
|||||||||||
|
Both Sexes |
|||||||||||
|
Marniemi 200548 [15955467] |
65-99 y, Both |
MI (130/755; 0.172) |
10 y |
25(OH)D |
nd |
nd |
~252 |
1 |
Reference |
nd |
C |
|
|
|
|
|
nd |
nd |
~252 |
0.99 |
0.64, 1.53 |
|
|
|
|
|
|
|
|
|
nd |
nd |
~252 |
0.77 |
0.47, 1.27 |
|
|
|
|
|
|
|
1,25(OH)2D |
nd |
nd |
~252 |
1 |
Reference |
nd |
|
|
|
|
|
|
|
nd |
nd |
~252 |
1.05 |
0.68, 1.62 |
|
|
|
|
|
|
|
|
nd |
nd |
~252 |
0.82 |
0.52, 1.30 |
|
|
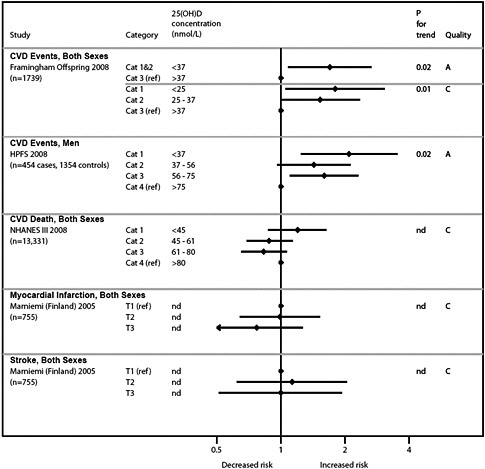
Vitamin D and body weight
Synopsis
No qualified systematic reviews have evaluated the association between vitamin D intake or serum 25(OH)D concentrations and body weight in adults. No cohort studies evaluated serum vitamin D concentrations and weight changes. Three RCTs from Finland, Norway, and India compared different doses of vitamin D (300 IU daily, 20,000 or 40,000 IU weekly, or 120,000 IU every 2 weeks) to placebo, with or without supplemental calcium in both groups. The study participants also varied: they were postmenopausal women, obese men and women, or only obese men. In the Finnish and Norwegian studies, the participants on average, gained weight in all groups over 1 or 3 years; in the Indian study weight remained mostly stable over 6 weeks. All studies found no difference in weight change with or without vitamin D supplementation.
Detailed presentation (Tables 12 & 13)
Three RCTs of vitamin D reported body weight (or body mass index [BMI]) as an outcome. The Kuopio (Finland) Osteoporosis Risk Factor and Prevention Study (Kuopio ORFPS) included postmenopausal women in a four-arm study.49 Two of the study arms included hormone replacement treatment and are not further discussed here. The remaining two arms compared vitamin D3 300 IU (83 women) versus placebo (95 women), where all women were taking low dose calcium lactate 500 mg/d (equivalent to 93 mg Ca++/d). Women on cholesterol-lowering medication at anypoint during the trial were excluded. The primary outcome of the trial was the serum lipid profile. The women ranged in age from 47 to 56 years. After 3 years, women, on average, gained weight in both study arms (about 1-2 kg). Those in the placebo arm gained an absolute 1.5 percent more weight than those in the vitamin D arm, but the difference was not statistically significant. The study had a methodological quality of C due to an uneven distribution of body weights between study arms at baseline (means 71.5 and 67.6 kg) and an overall withdrawal r ate of over 30 percent.
The second trial was conducted in Norway among healthy overweight and obese women and men.50 The participants’ mean baseline serum 25(OH)D concentration was 53 nmol/L. The trial compared vitamin D2 40,000 IU weekly (116 participants completed), 20,000 IU weekly (106 participants), and placebo (112 participants). All study participants also took calcium carbonate 500 mg daily. Almost all participants complied with the vitamin D (or placebo). Changes in weight and BMI were primary outcomes. The participants ranged in age from 21 to 70 years. After 1 year, changes in weight were small (increases of 0.1-0.5 kg) in each trial group. Compared to the placebo group, those taking the larger dose of vitamin D had less weight gain than those taking the smaller dose, but none of the differences among study groups were statistically significant. The study was rated methodological quality B, primarily due to the high dropout rate (25 percent), which was not explained.
The third trial was conducted in New Delhi, India among healthy obese men.51 The participants’ mean baseline serum 25(OH)D concentration was about 33 nmol/L. The trial compared vitamin D3 120,000 given under supervised conditions every 2 weeks and placebo in 100 men, of whom 71 were analyzed; most dropouts occurred because of refusals for subsequent blood draws (to assess the primary outcome). After 6 weeks, weight in kg and BMI were essentially stable, with no difference in weight change between the interventions. The study was rated methodological quality B because of the high dropout rate; for weight (in kg), the study was of quality C because baseline weights were not reported.
Findings per vitamin D dose
There was a lack of effect found across a range of doses from 300 IU to 8570 IU (prorated) daily.
Findings per age and sex
There was a lack of effect found in studies both of men mostly in their 40s, somewhat older people of both sexes, and postmenopausal women.
Findings by life stage
-
0 – 6 mo Not reviewed
-
7 mo – 2 y Not reviewed
-
3 – 8 y Not reviewed
-
9 – 18 y Not reviewed
-
19 – 50 y No effect was found in one trial of men mostly within this life stage after 6 weeks.
-
51 – 70 y The majority of people in the trials were within this life stage. No significant effect was found on weight from vitamin D supplementation for 1or 3 years.
-
≥71 y No data
-
Postmenopause All the women in the Finnish trial were postmenopausal.
-
Pregnant & lactating women Not reviewed
Table 12. Vitamin D and weight: Characteristics of RCTs
|
Author Year Study Name Location (Latitude) [PMID] |
Population |
Background Calcium Intake & Vitamin D Data |
Comparisons |
Compliance |
Comments |
|
|
Heikkinen 199749 Kuopio ORFPS Kuopio, Finland (63°N) [9405029] |
• Health status |
All, post-menopause |
nd |
Vit D3 & Ca lactate vs Placebo & Ca lactate |
nd |
|
|
• Mean age (range), y |
53 (47-56) |
|
|
|
||
|
• Male (%) |
0 |
|
|
|
|
|
|
Sneve 200850 Tromsø, Norway (70°N) [19056900] |
• Health status |
Healthy overweight and obese |
25(OH)D 53.1±16.9 nmol/L Ca intake 940±398 mg/d |
Vit D3 40,000 IU per week vs Vit D3 20,000 IU per week vs Placebo All: Ca carbonate 500 mg/d |
The compliance rate for cholecalciferol/placebo capsules were 95% in all 3 groups, and for the calcium tablets 81-85% across all 3 groups. |
|
|
• Mean age (range), y |
48 (21-70) |
|
||||
|
|
• Male (%) |
36 |
|
|
|
|
|
Nagpal 200951 New Delhi, India (28.5°N) [19125756] |
• Health status |
Healthy, obese |
25(OH)D: 36.5 nmol/L (treatment group), 30.0 nmol/L (control group) |
Vit D3 120,000 IU every 2 weeks vs Placebo |
100% (implied); supervised home visits |
Excluded subjects who refused subsequent blood draws |
|
• Mean age (SD), y |
44 (8) |
|
||||
|
• Male (%) |
100% |
|
|
|
|
|
Table 13. Vitamin D and weight: Results of RCTs
|
Author Year Study Name [PMID] |
Age Range, Sex (Subgp) |
Outcome |
1°/2° |
Mean Followup |
Interventions, Daily Dose |
No. Analyzed |
Unit |
Baseline |
Change |
Change 95% CI |
Net Diff |
Net Diff 95% CI |
P Btw |
Study Quality |
|
Isocaloric Diet |
||||||||||||||
|
Heikkinen 199749 Kuopio ORFPS [9405029] |
47-56 y, Women |
Weight |
2° |
3 y |
Vit D3 300 IU + Ca lactate 93 mg |
83 |
kg |
71.5 |
+1.84% |
+0.43%, +3.25% |
−1.5% |
−3.6%, +0.6%A |
NSB |
C |
|
Ca lactate 93 mg |
95 |
|
67.6 |
+3.32% |
+1.73%, 4.91% |
|
|
|
||||||
|
Sneve 200850 [19056900] |
21-70 y, Both |
Weight |
1° |
1 y |
Vit D3 40,000 IU weekly+ Ca carbonate 500 mg |
116 |
kg |
101.0 |
+0.1 |
−0.6, +0.8 |
−0.4 |
−1.3, +0.5A |
NS |
B |
|
Vit D3 20,000 IU weekly + Ca carbonate 500 mg |
106 |
|
98.6 |
+0.3 |
−0.3, +0.9 |
−0.2 |
−1.1, +0.7A |
NS |
||||||
|
Ca carbonate 500 mg |
112 |
|
100.6 |
+0.5 |
-0.2, +1.2 |
|
|
|
||||||
|
BMI |
1° |
1 y |
Vit D3 40,000 IU weekly + Ca carbonate 500 mg |
116 |
BMI |
35.0 |
0.0 |
−0.2, +0.2 |
−0.2 |
−0.6, +0.2A |
NS |
|||
|
Vit D3 20,000 IU weekly + Ca carbonate 500 mg |
106 |
|
34.4 |
+0.1 |
−0.1, +0.3 |
−0.1 |
−0.4, +0.2A |
NS |
||||||
|
Ca carbonate 500 mg |
112 |
|
35.1 |
+0.2 |
−0.1, +0.5 |
|
|
|
||||||
|
Nagpal 200951 New Delhi, India [19125756] |
44 (8, SD) Men |
Weight |
2° |
6 wk |
Vit D3 120,000 IU every 2 wk |
35 |
kg |
nd |
+0.03 |
−0.6, +0.6 |
+0.42 |
−0.4, +1.2 |
NS |
C |
|
Placebo |
36 |
|
nd |
−0.38 |
−0.9, +0.2 |
|
|
|
||||||
|
BMI |
2° |
6 wk |
Vit D3 120,000 IU every 2 wk |
35 |
BMI |
26.7 |
−0.02 |
−0.2, +0.2 |
+0.02 |
−0.3, +0.3 |
NS |
B |
||
|
Placebo |
36 |
|
26.0 |
−0.04 |
−0.3, +0.2 |
|
||||||||
|
A Estimated from reported data B Per estimated 95% confidence interval, P=0.17 |
||||||||||||||
Vitamin D and cancer
Cancer from all causes and total cancer mortality
Synopsis
No qualified systematic reviews have evaluated relationships between vitamin D and total cancer incidence or mortality. One RCT showed no effect of combined vitamin D3 (1000 IU/d) and calcium (~1500 mg/d) supplementation versus calcium supplementation (~1500 mg/d) alone on the risk of total cancer in healthy postmenopausal women (>55 years old) living in Nebraska (latitude 41°N). Another RCT also found no difference in total cancer mortality or incidence between supplemental vitamin D3 (100,000 IU every 4 months) and placebo in elderly (71+ years old) men and women living in the United Kingdom (latitude 52° N). Both RCTs were rated B quality.
Analyses using NHANES III data (general adult populations living in the US) showed no significant association between baseline 25(OH)D concentrations and total cancer mortality.
Detailed presentation (Tables 14, 15, 16 & 17)
A 4-year population-based RCT,52 sampled from a 9 county, largely rural area in eastern Nebraska (latitude 41°N), aimed to determine the efficacy of vitamin D3 (1000 IU/d) plus calcium (either calcium citrate 1400 mg/d or calcium carbonate 1500 mg/d) or calcium alone (either calcium citrate 1400 mg/d or calcium carbonate 1500 mg/d) compared to placebo in reducing fracture incident. Only the comparison between the combined vitamin D and calcium versus the calcium alone groups is discussed here. The other comparisons are described in the calcium and combined vitamin D and calcium sections. This study was rated methodological quality B. Incidence of cancer was a secondary outcome of this trial. A total of 1179 postmenopausal women, aged more than 55 years old, were randomized. The mean 25(OH)D concentration at baseline was 72 nmol/L. The relative risk of developing cancer at the end of study was 0.76 (95% CI: 0.38, 1.55). On the hypothesis that cancers diagnosed early in the study would have been present, although unrecognized on entry, the analyses were restricted to women who were free of cancer at 1 year intervention. The relative risk of developing cancer at the end of study for the vitamin D3 plus calcium group changed to 0.55 (95% CI 0.24, 1.28).
Another 5-year RCT compared the effects of supplemental vitamin D3 (100,000 IU every 4 months) with placebo on total cancer mortality and incidence in 2686 elderly participants with a mean age of 75 years in the United Kingdom (latitude 52° N).44 Total cancer mortality and incidence were evaluated as two of multiple secondary endpoints. The primary endpoint was the prevention of fracture. At 5 years vitamin D3 supplementation had no significant effect on the prevention of total cancer mortality (HR 0.86; 95% CI 0.61, 1.20) or incidence (HR 1.09; 95% CI 0.86, 1.36). This trial was rated B because it did not report in sufficient detail the randomization method, and the outcome ascertainment was based on death certificates or self-reported data, not verified with another objective documents (e.g., medical records or pathology reports).
Reported in two publications (one was rated B and one was rated C), there was no association between baseline 25(OH)D concentrations and total cancer mortality in the total NHANES III study population47,53 or in subgroup analyses by either season or latitude after a median 9 years of followup.53
Findings by age, sex and/or ethnicity
There were no differences in the total cancer mortality and incidence between men and women, reported in a 5-year RCT compared the effects of supplemental vitamin D3 (100,000 IU every 4 months) with placebo. In the NHANES III analysis, there was a suggestion of increased risk of total cancer mortality in men whose baseline 25(OH)D were in the two highest categories (80 to <100 nmol/L; ≥100 nmol/L) compared to the reference category (<50 nmol/L) [80 to <100 nmol/L: RR = 1.21, 95% CI 0.83 to 1.78; ≥100 nmol/L: RR = 1.35; 95% CI 0.78 to 2.31; P for trend=0.08]. However, this relationship was not seen in women (P for trend=0.12).53 When racial/ethnic groups were considered separately, there was also no association between baseline 25(OH)D concentrations and total cancer mortality in non-Hispanic whites (P for trend=0.80), non-Hispanic blacks (P for trend=0.14), or Mexican Americans (P for trend=0.37).
Findings Findings by life stage
-
0 – 6 mo No data
-
7 mo – 2 y No data
-
3 – 8 y No data
-
9 – 18 y No data
-
19 – 50 y Analyses using NAHANES III data showed no significant association between baseline 25(OH)D concentrations and total cancer mortality. NHANES III included participants mostly within this life stage.
-
51 – 70 y A proportion of participants in NHANES III were in this life stage, but no unique conclusions are possible for this life stage separate from those for people 19 to 50 years.
-
≥71 y One RCT included elderly men and women mostly in this life stage. Thetrial found no difference in total cancer mortality or incidence between supplemental vitamin D3 (100,000 IU every 4 months) and placebo.
-
Postmenopause One RCT with healthy postmenopausal women showed no effect of vitamin D3 supplementation (1000 IU/d) on the risk of total cancer.
-
Pregnant & lactating women No Data
Table 14. Vitamin D and total cancer: Characteristics of RCTs
|
Author Year Study Name Location (Latitude) [PMID] |
Population |
Background Calcium Intake & Vitamin D Data |
Comparisons |
Compliance |
Comments |
|
|
Lappe 200752 Nebraska, US (41º N) [17556697] |
• Health status |
Mentally and physically fit; postmenopause |
25(OH)D: 71.8 nmol/L |
Vit D3 1000 IU/d + Ca (citrate 1400 mg/d or carbonate 1500 mg/d) vs. Ca (citrate 1400 mg/d or carbonate 1500 mg/d) vs. placebo |
nd |
|
|
• Mean age (SD), y |
67 (7.3) |
|
|
|
||
|
|
• Male (%) |
0 |
|
|
|
|
|
Trivedi 200344 Oxford, UK (52°N) [12609940] |
• Health status |
General population |
25(OH)D: 53.4 nmol/L |
Vit D3 100,000 IU vs placebo every 4 months |
Participants taking 80% of study medication: 76%A |
Previous CVD: 28%, previous cancer: 6%, steroids user: 5%, and HRT taker: 7%. |
|
• Mean age (range), y |
75 (65-85) |
Calcium intake= 742 mg/d (at 4 years, no difference by treatment allocation) |
|
|||
|
|
• Male (%) |
76% |
|
|
|
|
|
A No difference between the vitamin D and the placebo arm. |
||||||
Table 15. Vitamin D and total cancer: Characteristics of cohort studies
|
Author Year Study Name Location (Latitude) [PMID] |
Population |
Vitamin D Concentration |
Comparisons |
Confounders/Effect Modifiers Adjusted |
Comments |
|||||||
|
Nutrients |
Demograph |
Anthrop |
Medical |
UV exposure |
Lifestyle |
|||||||
|
Cohort |
||||||||||||
|
Freedman 200753 NHANES III US (various) [16481636] |
• Health status |
Any |
• Assay method |
RIA (DiaSorin) |
Cancer mortality stratified by prespecified baseline 25(OH)D cut points |
X |
X |
X |
X |
X |
X |
Final model includes sex, race/ethnicity, and smoking pattern. Other potential confounders were examined but not chosen. |
|
• Mean age (range), y |
44 (≥17) |
|
|
|
|
|
|
|
|
|||
|
|
• Male (%) |
45 |
• Season blood drawn |
All |
|
|
|
|
|
|
||
|
Melamed 200847 NHANES III US (various) [18695076] |
• Health status |
DM 7.4%, history of CVD 7.9%, HTN 25% |
• Assay method |
RIA (DiaSorin) |
Cancer mortality stratified by baseline 25(OH)D quartiles |
X |
X |
X |
X |
X |
X |
|
|
|
• Mean age (range), y |
45 (≥20) |
|
|
|
|
|
|
|
|
|
|
|
|
• Male (%) |
46 |
• Season blood drawn |
All |
|
|
|
|
|
|
|
|
Table 16. Vitamin D and total cancer: Results of RCTs
|
Author Year Study Name Location (Latitude) [PMID] |
Life Stage |
Outcome |
1°/2° |
Followup, y |
Interventions, Daily Dose |
n Event |
N Total |
Outcome Metric (Comparison) |
Result |
95% CI |
P Btw |
Study Quality |
|
Lappe 200752 |
Postmenopausal women |
Incident cancer (all causes) |
2° |
4 |
Vit D3 1000 IU + Ca (citrate 1400 mg or carbonate 1500 mg) |
13 |
446 |
RR (Vit D+Ca vs Ca) |
0.76 |
0.38, 1.55 |
NS |
B |
|
Nebraska, US (41º N) [17556697] |
|
|
|
|
Ca (citrate 1400 mg or carbonate 1500 mg) |
17 |
445 |
|
|
|
|
|
|
|
Postmenopausal women |
Incident cancer restricted to subjects who were free of cancer at 1 y intervention) |
2° |
4 |
Vit D3 1000 IU + Ca (citrate 1400 mg or carbonate 1500 mg) |
8 |
403 |
RR (Vit D+Ca vs Ca) |
0.55 |
0.24, 1.28 |
NS |
B |
|
|
|
|
|
Ca (citrate 1400 mg or carbonate 1500 mg) |
15 |
416 |
|
|
|
|
||
|
Trivedi 200344 [12609940] |
65-85 y, Both sexes |
Incident cancer (all causes) |
2° |
5 |
Vit D3 100,000 IU every 4 mo (~833 IU/d) |
188 |
1345 |
HR (Vit D vs placebo) |
1.09 |
0.86, 1.36 |
NS |
B |
|
|
|
|
|
|
Placebo |
173 |
1341 |
|
|
|
|
|
|
|
|
Total cancer mortality |
2° |
5 |
Vit D3 100,000 IU every 4 mo (~833 IU/d) |
63 |
1345 |
HR (Vit D vs placebo) |
0.86 |
0.61, 1.2 |
NS |
|
|
|
|
|
|
|
Placebo |
72 |
1341 |
|
|
|
|
|
Table 17. Vitamin D and total cancer: Results of cohort studies
Prostate cancer
Synopsis
No qualified systematic reviews have evaluated the association between serum vitamin D concentrations and incidence of prostate cancer. Eight nested case-control studies (2B, 6C) found no association between baseline serum 25(OH)D concentrations and the risk of prostate cancer. One study rated C found a significant association between lower baseline serum 25(OH)D concentrations (<30 compared to >55 nmol/L) and higher risk of prostate cancer (adjusted OR 1.8, lowest compared to highest quartile). The same study found that the prostate cancer risk was increased in subjects less than 52 years at study entry and who had serum 25(OH)D concentration less than 40 nmol/L (adjusted OR 3.5). However, there was no difference in risk between low and high serum 25(OH)D concentration for those older than 51 years at study entry. A C study suggested an U-shaped association between baseline serum 25(OH)D concentrations and the risk of prostate cancer.
Detailed presentation (Tables 18 & 19; Figure 7)
A total of 12 nested case-control studies in 14 publications reported on the association between baseline serum 25(OH)D concentrations and the risk of prostate cancer.53-66 The number of cases ranged from 61 to 749. The latitudes of the studies ranged from 21º N to 60º N. The mean age of the subjects ranged from 44 to 68 years. Baseline serum concentrations of 25(OH)D in these studies ranged from 12.8 to 194 nmol/L. The time between blood drawn and the diagnosis of prostate cancer varied from 2 to 16 years. The methodological quality of three studies was rated B and nine studies were rated C.
19-50 years
Two studies provided data on younger subjects. Ahonen et al. analyzed subjects from 40 to 57 years of age.55 The study found that the prostate cancer risk was increased in subjects less than 52 years at study entry and had low serum 25(OH)D concentration (≤40 nmol/L) (adjusted OR 3.5, 95% CI 1.7, 7.0). The corresponding adjusted OR for those older than 51 years at study entrywas 1.2 and was not significant. This study adjusted for factors related to insulin resistance syndrome but not those potentially related to prostate cancer.
Freedman et al. analyzed data from NHANES III and reported on subjects with a mean age of 44 years and found that the adjusted relative risk of mortality from prostate cancer was 0.91 (95% CI 0.39, 2.14) in the group with baseline serum 25(OH)D concentration of at least 62.5 nmol/L compared to the group with less than 62.5 nmol/L.53
51-70 years
Ten studies reported data on subjects with a mean age ranged from 51 to 68 years. Eight studies did not find an association by trend analysis between baseline serum 25(OH)D concentrations and the risk of prostate cancer.54,56-63,66 One study found no association between baseline serum 25(OH)D concentrations and mortality from prostate cancer.58 One study found an association between lower baseline serum 25(OH)D concentrations (<30 compared to >55 nmol/L) and the risk of prostate cancer (P for trend = 0.01).55 The adjusted OR of the lowest compared to highest quartile was 1.8. The study also found that the prostate cancer risk was increased in subjects less than 52 years at study entry and had low serum 25(OH)D concentration (≤40 nmol/L) (adjusted OR 3.5, 95% CI 1.7, 7.0). However, there was no difference in risk (adjusted OR 1.2, P=NS) between low (≤40 nmol/L) and high (>40 nmol/L) serum 25(OH)D
concentration for those older than 51 years at study entry. This study did not adjust for factors potentially relevant to prostate cancer. One study reported an U-shaped association between baseline serum 25(OH)D concentrations and the risk of prostate cancer: the odds ratio in the group with 25(OH)D concentration of at least 80 nmol/L was 1.7 (95% CI 1.1, 2.4) compared to the group with a 25(OH)D concentration of 40-49 nmol/L; the odds ratio in the group with 25(OH)D concentration of no more than 19 nmol/L was 1.5 (95% CI 0.8, 2.7) compared to the group with a 25(OH)D concentration of 40 to 49 nmol/L.64 Even though this study used a conditional logistic regression in its analysis to maintain matching status, it was unclear if additional factors potentially relevant to prostate cancer were also entered into the regression analysis.
1,25(OH)2D
Five studies reported on the association between 1,25(OH)2D serum concentrations and the risk of prostate cancer. Four studies did not find an association.59,62,63,66 One study found that the risk of prostate cancer decreased with higher serum concentrations of 1,25(OH)2D in men with low serum concentrations of 25(OH)D (unadjusted OR 0.15, comparing 4th quartile of 1,25(OH)2D (104-211 pmol/L) to 1st quartile (13-68 pmol/L) in men with serum 25(OH)D concentrations that ranged from 7.5-45 nmol/L).58 When stratified by age and race, this association was only found in men above the median age of 57 years at time of blood drawn but not in younger men; the association was similar in black and white men.
Findings by life stage
-
0 – 6 mo not applicable
-
7 mo – 2 y not applicable
-
3 – 8 y not applicable
-
9 – 18 y not reviewed
-
19 – 50 y One study found that the prostate cancer risk was highest in subjects less than 52 years at study entry and had low serum 25(OH)D concentration (≤40 nmol/L) (adjusted OR 3.5, 95% CI 1.7, 7.0). Another study analyzed data from NHANES III and reported on subjects with a mean age of 44 years and found that the adjusted relative risk of mortality from prostate cancer was 0.91 (95% CI 0.39, 2.14) in the group with baseline serum 25(OH)D concentration of at least 62.5 nmol/L compared to the group with less than 62.5 nmol/L.
-
51 – 70 y Eight studies did not find an association by P for trend analysis between baseline serum 25(OH)D concentrations and the risk of prostate cancer. One study found an inverse association of baseline serum 25(OH)D concentrations (<30 compared to >55 nmol/L) and the risk of prostate cancer (adjusted OR 1.8, lowest compared to highest quartile, P for trend = 0.01). This study found that the prostate cancer risk was increased in subjects less than 52 years at studyentryand had low serum 25(OH)D concentration (≤40 nmol/L) (adjusted OR 3.5, 95% CI 1.7, 7.0). However, there was no difference in risk (adjusted OR 1.2, P=NS) between low (≤40 nmol/L) and high (>40 nmol/L) serum 25(OH)D concentration for those older than 51 years at studyentry. One studyreported an U-shaped association between baseline serum 25(OH)D concentrations and the risk of prostate cancer: the odds ratio in the group with 25(OH)D concentration of at least 80 nmol/L was 1.7 (95% CI 1.1, 2.4) compared to the group with a 25(OH)D concentration of 40-49 nmol/L; the odds ratio in the group with 25(OH)D concentration of no more
Table 18. Vitamin D and prostate cancer: Characteristics of nested case-control studies
|
Author Year Study Name Location (Latitude) [PMID] |
Population |
25(OH)D |
Comparisons |
Confounders/Effect Modifiers Adjusted |
Comments |
|||||||
|
Nutrients |
Demographic |
Anthrop |
Medical |
UV exposure |
Life styles |
|||||||
|
Ahn 200854 PLCO US (21ºN to 44ºN) [18505967] |
Health status |
8% current smoker |
Assay |
RIA (Heartland) |
Prostate cancer risk stratified baseline 25(OH)D quintiles |
X |
|
X |
X |
|
X |
|
|
Mean age range/SD), y |
67.8 (5.3) |
|
|
|
|
|
|
|
|
|
||
|
Male (%) |
100 |
Season blood drawn |
nd |
|
|
|
|
|
|
|
||
|
Platz 200463 Mikhak 200761 HPFS US (multiple latitudes) [15090720] [17440943] |
Health status |
Smoked 18%; DM 3.6% |
Assay |
RIA |
Prostate cancer risk stratified by baseline 25(OH)D quartiles |
X |
X |
X |
X |
X |
X |
6% nonwhite |
|
Mean age range/SD), y |
66 (7) |
|
|
|
|
|
|
|
|
|
||
|
Male (%) |
100 |
Season blood drawn |
nd |
|
|
|
|
|
|
|
||
|
Freedman 200753 NHANES III US (multiple latitudes) [17971526] |
Health status |
28% current smoker |
Assay |
RIA |
Prostate cancer mortality stratified by 2 baseline 25(OH)D categories |
X |
X |
X |
X |
X |
X |
71% white; 14% black; 6% Hispanics |
|
Mean age range/SD), y |
44 |
|
|
|
|
|
|
|
|
|||
|
Male (%) |
100 |
Season blood drawn |
South: Nov to Mar; North: Apr to Oct |
|
|
|
|
|
|
|
||
|
Tuohimaa 200464 Helsinki Heart Vasterbotten; Janus Project; Finland (60°N) [14618623] |
Health status |
Gemfibrozil vs. placebo subjects |
Assay |
RIA (Incstar) |
Prostate cancer risk stratified by 5 baseline 25(OH)D categories |
|
X |
|
|
X |
|
|
|
Mean age range/SD), y |
<40 to >60 |
|
|
|
|
|
|
|
|
|
||
|
Male (%) |
100 |
Season blood drawn |
nd |
|
|
|
|
|
|
|
||
|
Li 200760 Gann 199666 PHS US (multiple latitudes) [17388667] [8850273] |
Health status |
on ASA, β-carotene, placebo trial; 9% current smoker |
Assay |
RIA (Bruce Hollis) |
Prostate cancer risk stratified by baseline 25(OH)D quartiles |
|
X |
|
|
X |
94% white |
|
|
Mean age (range/SD), y |
58.9 (8.3) |
|
|
|
|
|
|
|
|
|
||
|
|
Male (%) |
100 |
Season blood drawn |
24% spring winter |
|
|
|
|
|
|
|
|
|
Corder 199358 San Francisco US (37ºN) [8220092] |
Health status |
nd |
Assay |
Competitive protein-binding (Hadded, 1971) |
Prostate cancer risk compared by baseline 25(OH)D |
|
X |
|
|
X |
|
50% black; 50% white |
|
Mean age range/SD), y |
57 (38-81) |
|
|
|
|
|
|
|
|
|
||
|
Male (%) |
100 |
Season blood drawn |
nd |
|
|
|
|
|
|
|
||
|
|
|
|
|
|
|
|
|
|
|
|
|
|
|
Author Year Study Name Location (Latitude) [PMID] |
Population |
25(OH)D |
Comparisons |
Confounders/Effect Modifiers Adjusted |
Comments |
|||||||
|
Nutrients |
Demographic |
Anthrop |
Medical |
UV exposure |
Life styles |
|||||||
|
Ahonen 200055 Helsinki Heart Finland (60°N) [11075874] |
Health status |
Gemfibrozil vs. placebo subjects |
Assay |
RIA (Incstar) |
Prostate cancer risk stratified baseline 25(OH)D quartiles |
|
X |
X |
X |
X |
X |
|
|
Mean age range/SD), y |
40-57 |
|
|
|
|
|
|
|
|
|
||
|
Male (%) |
100 |
Season blood drawn |
Jan-Feb; Mar-May; Sep |
|
|
|
|
|
|
|
||
|
Nomura 199862 Honolulu Heart US (21ºN) [9794175] |
Health status |
64% smoked |
Assay |
Protein-binding |
Prostate cancer risk stratified baseline 25(OH)D quartiles |
|
X |
|
|
X |
X |
100% Japanese Americans |
|
Mean age range/SD), y |
58 (49-70) |
|
|
|
|
|
|
|
|
|||
|
Male (%) |
100 |
Season blood drawn |
nd |
|
|
|
|
|
|
|
||
|
Tuohimaa 200765 Helsinki Heart Finland (60°N) 17301263 |
Health status |
Gemfibrozil vs. placebo subjects |
Assay |
RIA (Incstar) |
Prostate cancer risk stratified 3 baseline 25(OH)D categories |
|
X |
X |
X |
|
|
|
|
Mean age range/SD), y |
51 (3.7) |
|
|
|
|
|
|
|
|
|
||
|
Male (%) |
100 |
Season blood drawn |
Most in winter |
|
|
|
|
|
|
|
||
|
Jacobs 200459 NPC Eastern US (25º46’N to 41ºN) [15225833] |
Health status |
Selenium vs. placebo subjectsA |
Assay |
RIA |
Prostate cancer risk stratified baseline 25(OH)D tertiles |
|
X |
X |
X |
X |
X |
100% white |
|
Mean age range/SD), y |
68 (nd) |
|
|
|
|
|
|
|
|
|
||
|
Male (%) |
100 |
Season blood drawn |
nd |
|
|
|
|
|
|
|
||
|
Braun 199557 WCC, MD US (39°N) [7612803] |
Health status |
nd |
Assay |
RIA (Bruce Hollis, 1993) |
Prostate cancer risk stratified baseline 25(OH)D quintiles |
|
X |
|
|
|
|
|
|
Mean age (range/SD), y |
<45-75+ |
|
|
|
|
|
|
|
|
|
||
|
Male (%) |
100 |
Season blood drawn |
Aug through Nov |
|
|
|
|
|
|
|
||
|
Baron 200556 CPP US (multiple latitudes) [15767334]B |
Health status |
had >1 colon adenoma removal |
Assay |
Competitive protein-binding (Quest) |
Prostate cancer risk stratified baseline 25(OH)D tertiles |
X |
X |
|
|
X |
|
5% black |
|
Mean age range/SD), |
62 (8.7) |
|
|
|
|
|
|
|
|
|
||
|
|
Male (%) |
100 |
Season blood drawn |
nd |
|
|
|
|
|
|
|
|
|
Author Year Study Name Location (Latitude) [PMID] |
Population |
25(OH)D |
Comparisons |
Confounders/Effect Modifiers Adjusted |
Comments |
|||||||
|
Nutrients |
Demographic |
Anthrop |
Medical |
UV exposure |
Life styles |
|||||||
|
Braun 199557 WCC, MD US (39°N) [7612803] |
Health status |
nd |
Assay |
RIA (Bruce Hollis, 1993) |
Prostate cancer risk stratified by baseline 25(OH)D quintiles |
|
X |
|
|
|
|
100% white |
|
Mean age (range/SD), y |
<45-75+ |
|
|
|
|
|
|
|
|
|
||
|
Male (%) |
100 |
Season blood drawn |
Aug through Nov |
|
|
|
|
|
|
|
||
|
Baron 200556 CPP US (multiple latitudes) [15767334]B |
Health status |
had >1 colon adenoma removal |
Assay |
Competitive protein-binding (Quest) |
Prostate cancer risk stratified by baseline 25(OH)D tertiles |
X |
X |
|
|
X |
|
5% black |
|
Mean age (range/SD), y |
62 (8.7) |
|
|
|
|
|
|
|
|
|
||
|
|
Male (%) |
100 |
Season blood drawn |
nd |
|
|
|
|
|
|
|
|
|
A For prevention of recurrence of non-melanoma skin cancer B This is a cohort study, not a nested case-control study. |
||||||||||||
Table 19. Vitamin D and prostate cancer: Results of nested case-control studies
|
Author Year Study Name PMID |
Life Stage (male), y |
Outcome (no. of cases; no. of control) |
Time to diagnosis, y |
25(OH)D concentration, nmol/L |
No. of cases |
No. of control |
Adjusted OR |
95% CI |
P for trend |
Study Quality |
|
Ahn 200854 PLCO [8505967] |
51-70 |
Prostate cancer (741; 781) |
2-8 |
12.8-42.5 |
119 |
157 |
1 |
Reference |
0.20 |
B |
|
|
|
|
42.5-51. |
125 |
156 |
1.10 |
0.78, 1.56 |
|
|
|
|
|
|
|
51.4-60.5 |
190 |
157 |
1.53 |
1.10, 2.13* |
|
|
|
|
|
|
|
|
60.6-71.7 |
167 |
156 |
1.33 |
0.95, 1.86 |
|
|
|
|
|
|
|
71.8-129.5 |
148 |
155 |
1.18 |
0.83, 1.68 |
|
|
|
Platz 200463 Mikhak 200761 HPFS [15090720] [17440943] |
51-70 |
Prostate cancer (460; 460) |
2.2 (mean) |
Quartile 1A |
109 |
114 |
1 |
Reference |
0.59 |
B |
|
|
|
|
Quartile 2 |
115 |
113 |
1.00 |
0.67, 1.49 |
|
|
|
|
|
|
|
Quartile 3 |
94 |
120 |
0.77 |
0.51, 1.15 |
|
|
|
|
|
|
|
Quartile 4 |
142 |
113 |
1.19 |
0.79, 1.79 |
|
|
|
|
Freedman 200753 NHANES III [17971526] |
19-50 |
Mortality prostate cancer |
nd |
<62.5 |
22 |
nd |
1 |
Reference |
0.95 |
B |
|
|
|
|
≥62.5 |
25 |
nd |
0.91 |
0.39, 2.14 |
|
|
|
|
Tuohimaa 200464 Helsinki Heart [14618623] |
19-50 51-70 |
Prostate cancer (622; 1451) |
≤9 ->14 (range) |
≤19 |
19 |
nd |
1.5 |
0.8, 2.7 |
|
C |
|
|
|
|
20-39 |
169 |
nd |
1.3 |
0.98, 1.6 |
|
|
|
|
|
|
|
40-59 |
229 |
nd |
1 |
Reference |
|
|
|
|
|
|
|
|
60-79 |
138 |
nd |
1.2 |
0.9, 1.5 |
|
|
|
|
|
|
|
≥80 |
67 |
nd |
1.7 |
1.1, 2.4* |
|
|
|
Li 200760 PHS [17388667] |
19-50 51-70 |
Prostate cancer (492; 664) |
11 (median) |
Quartile 1B |
nd |
nd |
1.01 |
0.71, 1.44 |
0.91 |
C |
|
|
|
|
Quartile 2 |
nd |
nd |
1.26 |
0.89, 1.80 |
|
|
|
|
|
|
|
|
Quartile 3 |
nd |
nd |
1.00 |
0.71, 1.41 |
|
|
|
|
|
|
|
Quartile 4 |
nd |
nd |
1 |
Reference |
|
|
|
Gann 199666 PHS [8850273] |
19-50 51-70 |
Prostate cancer (232; 414) |
6 (mean) |
15.7-53.3 |
nd |
nd |
1.00 |
nd |
0.82 |
C |
|
|
|
|
53.4-70.9 |
nd |
nd |
1.10 |
nd |
|
|
|
|
|
|
|
|
71-93.5 |
nd |
nd |
1.16 |
nd |
|
|
|
|
|
|
|
93.6-194 |
nd |
nd |
0.92 |
0.56, 1.50 |
|
|
|
|
|
Prostate cancer; age ≤61 y |
|
15.7-53.3 |
nd |
nd |
1.00 |
nd |
nd |
|
|
|
|
|
|
53.4-70.9 |
nd |
nd |
1.19 |
nd |
|
|
|
|
|
|
|
71-93.5 |
nd |
nd |
1.75 |
nd |
|
|
|
|
|
|
|
93.6-194 |
nd |
nd |
1.48 |
0.73, 2.98 |
|
|
|
|
|
Prostate cancer; age >61 y |
|
15.7-53.3 |
nd |
nd |
1.00 |
nd |
nd |
|
|
|
|
|
|
53.4-70.9 |
nd |
nd |
1.00 |
nd |
|
|
|
|
|
|
|
71-93.5 |
nd |
nd |
0.82 |
nd |
|
|
|
|
|
|
|
93.6-194 |
nd |
nd |
0.76 |
0.39, 1.47 |
|
|
|
Author Year Study Name PMID |
Life Stage (male), y |
Outcome (no. of cases; no. of control) |
Time to diagnosis, y |
25(OH)D concentration, nmol/L |
No. of cases |
No. of control |
Adjusted OR |
95% CI |
P for trend |
Study Quality |
|
Corder 199358 [8220092] |
19-50 51-70 |
Prostate cancer (181; 181) |
>5 (mode) |
60.0 (case) vs. 50.5 (control) (est.) |
181 |
181 |
- |
- |
- |
C |
|
|
Mortality prostate cancer |
|
nd |
51 |
nd |
- |
- |
- |
|
|
|
Ahonen 200055 Helsinki Heart [11075874] |
19-50 51-70 |
Prostate cancer (149; 566) |
8-14 (mode) |
< 30C |
48 |
131 |
1.8 |
1.0, 3.2* |
0.01 |
C |
|
|
|
|
31-40 |
41 |
143 |
1.4 |
0.8, 2.4 |
|
|
|
|
|
|
|
|
41-54 |
26 |
148 |
0.8 |
0.5, 1.5 |
|
|
|
|
|
|
|
> 55 |
34 |
144 |
1 |
Reference |
|
|
|
|
|
Prostate cancer in those <52 years old at entry |
|
≤40 |
nd |
nd |
3.5 |
1.7, 7.0* |
|
|
|
|
|
|
|
>40 |
nd |
nd |
1 |
|
|
|
|
|
|
Prostate cancer in those >51 years old at entry |
|
≤40 |
nd |
nd |
1.2 |
0.7, 2.1 |
||
|
|
|
|
|
>40 |
nd |
nd |
1 |
|
|
|
|
Nomura 199862 Honolulu Heart [9794175] |
19-50 51-70 |
Prostate cancer (136; 136) |
16 (mean) |
<85D |
38 |
34 |
1 |
Reference |
0.68 |
C |
|
|
|
|
85-101 |
35 |
36 |
0.8 |
0.4, 1.8 |
|
|
|
|
|
|
|
102-119 |
30 |
32 |
0.8 |
0.4, 1.7 |
|
||
|
|
|
|
|
≥120 |
33 |
34 |
0.8 |
0.4, 1.8 |
|
|
|
Tuohimaa 200765 Helsinki Heart [17301263] |
19-50 51-70 |
Prostate cancer (132; 456) |
10.8 (mean) |
<40 |
- |
- |
1.88 |
1.15, 3.08* |
|
C |
|
|
|
|
40-59 |
- |
- |
1 |
Reference |
|||
|
|
|
|
≥60 |
- |
- |
1.25 |
0.64, 2.43 |
|
|
|
|
Jacobs 200459 NPC [15225833] |
51-70 |
Prostate cancer (83; 166) |
5.1 (mean) |
20-63.3 |
26 |
58 |
1 |
Reference |
0.51 |
C |
|
|
|
|
63.4-81.9 |
33 |
49 |
1.71 |
0.68, 4.34 |
|||
|
|
|
|
82-149 |
24 |
59 |
0.75 |
0.29, 1.91 |
|
|
|
|
Braun 199557 WCC [7612803] |
19-50 51-70 |
Prostate cancer (61; 122) |
14 (mean) |
<60.1 |
7 |
24 |
1 |
Reference |
0.60 |
C |
|
|
|
|
60.1-73.8 |
17 |
25 |
2.3 |
0.7, 7.8 |
|
|
|
|
|
|
|
|
73.9-88.5 |
16 |
24 |
2.3 |
0.7, 7.7 |
|
|
|
|
|
|
|
88.6-103 |
4 |
25 |
0.6 |
0.1, 2.5 |
||
|
|
|
|
|
>103 |
17 |
24 |
2.4E |
0.8, 8.2 |
|
|
|
Baron 200556 CPP [15767334]F |
19-50 51-70 |
Prostate cancer (70 cases in a total of 672)F |
<4 (34%) |
<62.9 |
nd |
NA |
1 |
Reference |
0.70 |
C |
|
|
|
|
62.9-84.9 |
nd |
NA |
1.22 |
0.66, 2.26 |
|
|
|
|
|
|
|
|
85 |
nd |
NA |
0.32 |
0.72, 2.43 |
|
|
|
*Statistically significant (P<0.05) |
||||||||||
|
A Cut points separated by analytical run; season, distributions among control (see Table 3 in original study B Cut points based on control standardized by season of collection C Cut points based on total original cohort D Cut points based on control frequency E Unadjusted F This is a cohort study, not a nested case-control study |
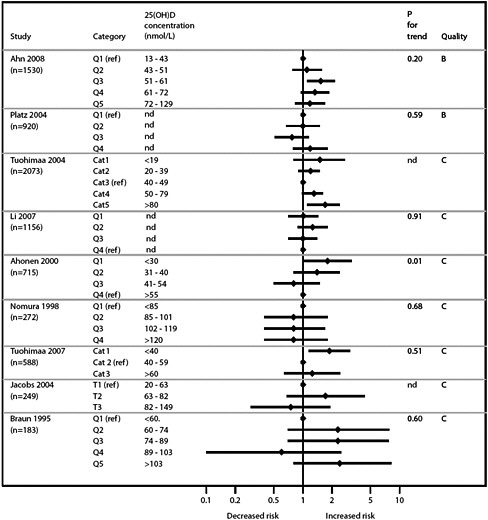
Colorectal cancer
Synopsis
No qualified systematic reviews have evaluated the association between 25(OH)D concentrations and colorectal cancer mortality or incidence. One B quality RCT of elderly population reported no significant difference in colorectal cancer mortality or incidence between supplemental vitamin D3 and no supplements. One B quality cohort study found an inverse association between higher 25(OH)D concentrations and the risk of colorectal cancer mortality (HR 0.28, highest compared to lowest tertile). Two B quality nested case-control studies of women found a trend between higher 25(OH)D serum concentrations and lower risk of colorectal cancer incidence (trend analysis). Another two B quality nested case-control studies of men, and one B quality and two C quality nested case-control studies of both sexes reported no significant association between 25(OH)D concentrations and risk of colorectal cancer or colon cancer.
Detailed presentation of supplemental vitamin D and colorectal caner (Tables 20 & 21)
An RCT compared supplemental vitamin D3 (100,000 IU every 4 months) with placebo in 2686 elderly participants with a mean age of 75 years in the United Kingdom (latitude 52° N).44 Colorectal cancer mortality and incidence were evaluated as two of multiple secondary endpoints. The primary endpoint was the prevention of fracture. At 5 years vitamin D3 supplementation had no significant effect on the prevention of colorectal cancer mortality (P=0.33) or incidence (P=0.94). This trial was rated B because it did not report in sufficient detail the randomization method, and the outcome ascertainment was based on death certificates or self-reported data, not verified with another objective documents (e.g., medical records or pathology reports).
Findings per age and sex
The same British trial reported no significant difference in colorectal caner mortality or incidence between the vitamin D supplements group and the placebo at 5 years in men (P=0.96 and 0.59, respectively). In women, the trial also found no significant difference in colorectal cancer incidence between the two groups (P=0.32), whereas the risk of colorectal cancer mortality in the supplements group was significantly decreased compared to the placebo (0/326 deaths vs. 4/323 deaths; HR, not reported; P=0.04).
Findings per special populations
No subgroup data were available regarding special populations (e.g., obese participants, smokers, ethnic groups, or users of contraceptives).
Table 20. Vitamin D and colorectal cancer: Characteristics of RCTs
|
Author Year Study Name Location (Latitude) [PMID] |
Population |
Background Calcium Intake & Vitamin D Data |
Comparisons |
Compliance |
Comments |
|
|
Trivedi 200344 Oxford, UK (52°N) [12609940] |
• Health status |
General population |
25(OH)D: 53.4 nmol/L |
Vit D3 100,000 IU vs placebo every 4 months |
Participants taking ≥80% of study medication: 76%A |
Previous CVD: 28%, previous cancer: 6%, steroids user: 5%, and HRT taker: 7%. |
|
• Mean age (range), y |
75 (65-85) |
Calcium intake= 742 mg/day (at 4 years, no difference by treatment allocation) |
||||
|
|
• Male (%) |
76% |
|
|
|
|
|
CVD = cardiovascular disease; HRT = hormone replacement therapy. A No difference between the vitamin D and the placebo arm. |
||||||
Table 21. Vitamin D and colorectal cancer: Results of RCTs
|
Author Year Study Name [PMID] |
Age Range, Sex (Subgp) |
Outcome |
1°/2° |
Mean Followup |
Interventions, Daily Dose |
n Event |
N Total |
Outcome Metric (Comparison) |
Result |
95% CI |
P Btw |
Study Quality |
|
Trivedi 200344 [12609940] |
65-85 y, Both sexes |
CRC, mortality |
2° |
5 y |
Vit D3 100,000 IU every 4 mo |
7 |
1345 |
Age adj HR (Vit D/Placebo) |
0.62 |
0.24, 1.60 |
0.33 |
B |
|
|
|
|
|
|
Placebo |
11 |
1341 |
|
|
|
|
|
|
|
|
CRC, incidence |
2° |
|
Vit D3 |
28 |
1345 |
Age adj HR (Vit D/Placebo) |
1.02 |
0.60, 1.74 |
0.94 |
|
|
|
|
|
|
|
Placebo |
27 |
1341 |
|
|
|
|
|
|
|
65-85 y, Men |
CRC, mortality |
2° |
5 y |
Vit D3 |
7 |
1019 |
Age adj HR (Vit D/Placebo) |
0.97 |
0.34, 2.78 |
0.96 |
|
|
|
|
|
|
|
Placebo |
7 |
1018 |
|
|
|
|
|
|
|
|
CRC, incidence |
2° |
|
Vit D3 |
25 |
1019 |
Age adj HR (Vit D/Placebo) |
1.18 |
0.65, 2.12 |
0.59 |
|
|
|
|
|
|
|
Placebo |
21 |
1018 |
|
|
|
|
|
|
|
65-85 y, Women |
CRC, mortality |
2° |
5 y |
Vit D3 |
0 |
326 |
Age adj HR (Vit D/Placebo) |
NA |
NA |
0.04 |
|
|
|
|
|
|
|
Placebo |
4 |
323 |
|
|
|
|
|
|
|
|
CRC, incidence |
2° |
|
Vit D3 |
3 |
326 |
Age adj HR (Vit D/Placebo) |
0.49 |
0.12, 1.98 |
0.32 |
|
|
|
|
|
|
|
Placebo |
6 |
323 |
|
|
|
|
|
Detailed presentation of 25(OH)D concentrations and colorectal cancer (Tables 22 & 23; Figures 8, 9, & 10)
A total of seven nested case-control studies evaluated the associations between 25(OH)D concentrations and risk of colorectal cancer67-71 or colon cancer.72,73 The number of pairs of cases and controls in these studies ranged from 101 to 588. Another cohort study comprising 16,818 adult community volunteers from the NHANES III53 assessed the association between 25(OH)D concentrations and colorectal cancer mortality. The mean age of the subjects ranged from 44 to 66 years. Locations of the studies ranged from 20° N to 60° N. Baseline 25(OH)D concentrations ranged from 10 nmol/L to 227.5 nmol/L. No studies reported followup 25(OH)D concentrations. Time between blood drawn and the diagnosis of colorectal cancer incidence or mortality ranged from less than 1 year to 17 years. None of the studies reported power calculations. Methodological quality of five nested case-control studies67-71 were rated B and two were rated C.72,73 Common reasons for downgrading the quality ratings included exclusion of participants without available blood samples, no verification of cancer diagnosis, and lack of adequate statistical adjustments. The cohort study53 was rated B because it was unclear whether cases were verified and there was no statistical adjustment for family history.
Findings per age and sex
The NHANES III53 analyzed data for both sexes combined. An adjusted analysis found an inverse association between 25(OH)D concentrations and the risk of colorectal cancer mortality (HR: 0.28, highest [≥80 nmol/L] compared to lowest tertile [<50 nmol/L]; P for trend = 0.02). Two studies from WCC reported colon cancer incidence for both sexes combined.72,73 One study reported a significantly lower 25(OH)D concentrations in colon cancer cases than controls (58.9 nmol/L vs. 86.6 nmol/L; P<0.001).73 Both studies reported no significant association between 25(OH)D concentrations and colon cancer risk by trend analysis.
Three studies, from the Japan PHC, HPFS, and ATBC respectively, provided data on adult men.67-69 None of the studies found an association between 25(OH)D concentrations and colorectal cancer risk. Although all three studies provided data on colon cancer and rectal cancer as subgroup analysis, only HPFS reported a significant negative trend between 25(OH)D concentrations and risk of colon cancer (OR 0.46, highest [median 97.0 nmol/L] compared to lowest quartile [median 48.3 nmol/L]; P for trend = 0.005).69 The HPFS also reported a subgroup analysis on men aged 65 years or older.69 No significant association was reported between 25(OH)D concentrations and colorectal cancer risk by trend analysis.
The Japan PHC and HPFS compared 25(OH)D concentrations between colorectal cancer cases and controls.68,69 Neither reported a significant difference. One study explored subgroup analyses. Only the rectal cancer cases had significantly lower 25(OH)D concentrations compared to the controls (55 nmol/L for cases vs. 110 nmol/L for controls; P = 0.005).68
Two nested case-control studies from the NHS and Japan PHC provided data on adult women.68,70 The NHS reported a negative trend between 25(OH)D concentrations and colorectal cancer risk (OR 0.53, highest [median 99.1 nmol/L] compared to lowest quintile [median 40.2 nmol/L]; P for trend = 0.02).70 This trend remained significant in a subgroup analysis of women age 60 years or older (OR 0.35 between the highest quintiles [median 99.1 nmol/L] and lowest [median 40.2 nmol/L]; P for trend = 0.006) or in rectal cancer alone (OR 0.31, highest [median 92.4 nmol/L] compared to lowest tertile [median 44.4 nmol/L]; P for trend = 0.03).70 The WHI focused on postmenopausal women.71 A significant negative trend was reported between
25(OH)D concentrations and colorectal cancer risk (OR 2.53, between highest [≥58.4 nmol/L] and lowest quintiles [<31.0 nmol/L]; P for Trend end = 0.02).
The Japan PHC compared 25(OH)D concentrations between cases and controls; no significant difference was reported.68
Findings per special populations
No subgroup data were available regarding the association between 25(OH)D concentrations and colorectal cancer risk in obese persons. One study exclusively included male smokers aged between 50 and 69 years,67 and reported no significant association between 25(OH)D concentrations and colorectal cancer risk by trend analysis. Another study that exclusively included white population also found no association.72 In addition, another study that focused on women who were taking hormone replacement therapy reported no significant association between 25(OH)D and colorectal cancer.70
Findings excluding early cases
Three studies performed sensitivity analyses on the association between 25(OH)D concentrations and colorectal cancer risk by excluding cases diagnosed within the first 1 to 2 years after blood draw.67,69,70 One study found a significant negative association between 25(OH)D concentrations and colon cancer risk (OR 0.3, between highest [>48.2 nmol/L] and lowest quartiles [≤ 24.5 nmol/L]; P for Trend = 0.04), which was not significant in main analysis.67 Otherwise, the results were not materially different from the main analysis.
Findings on 1,25-Dihydroxyvitamin D
A total of three studies evaluated the associations between 1,25(OH)2D concentrations and colorectal cancer risk67,70 or colon cancer.73 None of the studies found a significant association by trend analysis. One study reported no significant association between 1,25(OH)2D concentrations and rectal cancer risk.67
Findings by life stage
-
0 – 6 mo Not reviewed
-
7 mo – 2 y Not reviewed
-
3 – 8 y Not reviewed
-
9 – 18 y Not reviewed
-
19 – 50 y The analysis of the NHANES III with a mean age of 44 years included participants mostly within this life stage. The study found an inverse association between 25(OH)D and colorectal cancer mortality.
-
51 – 70 y The seven nested case-control studies included people with a mean age ranged from 55 to 66 years. A negative trend between 25(OH)D concentrations and colorectal cancer risk was found in two studies of women. Out of five studies that separately assessed the risk of colon cancer and rectal cancer, only one study of men and another study of women found a negative trend in colon cancer risk and rectal cancer risk, respectively. Otherwise, no association was found between 25(OH)D concentrations and cancer risk.
-
≥71 y One RCT with a mean age of 75 included participants mostly within this life stage. The trial found no difference in colorectal cancer mortality or incidence between supplemental vitamin D and no supplements.
Table 22. Vitamin D and colorectal cancer: Characteristics of observational studiesA
|
Author Year Study Name Location (Latitude) [PMID] |
Population |
Vitamin D Concentration |
Comparisons |
Confounders/Effect Modifiers Adjusted |
Comments |
|||||||
|
Nutrients |
Demograph |
Anthrop |
Medical |
UV exposure |
Lifestyle |
|||||||
|
Cohort |
||||||||||||
|
Freedman 200753 NHANES III US (various) [16481636] |
• Health status |
Any |
• Assay method |
RIA (DiaSorin) |
Colorectal cancer mortality stratified by prespecified baseline |
X |
X |
X |
X |
X |
X |
White: 71%; Black: 14%; Hispanic: 6%; Others: 9% |
|
• Mean age (range), y |
44 (≥17) |
|
|
|
|
|
|
|
|
|||
|
|
• Male (%) |
45 |
• Season blood drawn |
All |
25(OH)D cut points |
|
|
|
|
|
|
|
|
Nested case-control |
|
|
|
|
|
|
|
|
|
|
|
|
|
Braun 199573 WCC Maryland, US (38°N) [329893] |
• Health status |
Any |
• Assay method |
RIA (Horris 1993) |
• 25(OH)D levels between cases and controls |
|
X |
|
|
X |
|
|
|
• Mean age (range), y |
55 (nd) |
|
|
|
|
|
|
|
|
|
||
|
|
• Male (%) |
nd |
• Season blood drawn |
Fall |
• Colon cancer risk stratified by baseline 25(OH)D quintiles |
|
|
|
|
|
|
|
|
Feskanich 200470 NHS US (various) [15342452] |
• Health status |
Any |
• Assay method |
RIA (Horris 1997) |
Colorectal cancer risk stratified by baseline 25(OH)D quintiles |
X |
X |
X |
X |
X |
X |
Aspirin user (>10 y): 10%; Hormone replacement therapy: 34% |
|
|
• Mean age (range), y |
60 (43-70) |
|
|
|
|
|
|
|
|
||
|
|
• Male (%) |
0 |
• Season blood drawn |
All |
|
|
|
|
|
|
|
|
|
Garland 198972 WCC Maryland, US (38°N) [2572900] |
• Health status |
Any |
• Assay method |
HPLA (Clemens 1982) |
• 25(OH)D levels between cases and controls |
|
X |
|
|
X |
|
White: 100% |
|
• Mean age (range), y |
63 (nd) |
|
|
|
|
|
|
|
|
|
||
|
|
• Male (%) |
50 |
• Season blood drawn |
Fall |
• Colon cancer risk stratified by baseline 25(OH)D quintiles |
|
|
|
|
|
|
|
|
Otani 200768 Japan PHC Japan (various) [17622244] |
• Health status |
Any |
• Assay method |
CPBA (Haddad 1971) |
• 25(OH)D levels between cases and controls |
X |
X |
X |
X |
X |
X |
|
|
• Mean age (range), y |
Men: 57 (40-69); Women: 56 (40-69) |
|
|
|
|
|
|
|
|
|
||
|
|
• Male (%) |
|
• Season blood drawn |
All |
• Colorectal cancer risk stratified by baseline 25(OH)D quartiles |
|
|
|
|
|
|
|
|
Author Year Study Name Location (Latitude) [PMID] |
Population |
Vitamin D Concentration |
Comparisons |
Confounders/Effect Modifiers Adjusted |
Comments |
|||||||
|
Nutrients |
Demograph |
Anthrop |
Medical |
UV exposure |
Lifestyle |
|||||||
|
Tangrea 199767 ATBC Finland (~60°N) [9242478] |
• Health status |
SmokerB |
• Assay method |
RIA (Horris 1993) |
Colorectal cancer risk stratified by baseline 25(OH)D quartiles |
X |
X |
X |
|
X |
X |
|
|
• Mean age (range), y |
60 (50-69) |
|
|
|
|
|
|
|
|
|||
|
|
• Male (%) |
100 |
• Season blood drawn |
All |
|
|
|
|
|
|
|
|
|
Wactawski-Wende 200671 WHI US (various) [16481636] |
• Health status |
Postmenopausal womenC |
• Assay method |
RIA (DiaSorin) |
Colorectal cancer risk stratified by baseline 25(OH)D quartiles |
|
X |
X |
X |
|
X |
White: 83%; Black: 9%; Hispanic: 4% Others: 4% |
|
• Mean age (range), y |
nd (50-79) |
|
|
|
|
|
|
|
|
|||
|
|
• Male (%) |
0 |
• Season blood drawn |
All |
|
|
|
|
|
|
|
|
|
Wu 200769 HPFS US (various) [17623801] |
• Health status |
Smoker 5% |
• Assay method |
RIA (Horris 1997) |
• 25(OH)D levels between cases and controls |
X |
X |
X |
X |
X |
X |
Aspirin user in 1994: 40%; Current smoker: 5% |
|
• Mean age (range), y |
66 (nd) |
|
|
|
|
|
|
|
|
|||
|
|
• Male (%) |
100 |
• Season blood drawn |
All |
• Colorectal cancer risk stratified by baseline 25(OH)D quintiles |
|
|
|
|
|
|
|
|
A This table is ordered alphabetically by study author. B Participants of a lung cancer prevention 2 by 2 RCT of alpha-tocopherol and beta-carotene. C Participants of a hip fracture prevention RCT of vitamin D3 and calcium |
||||||||||||
Table 23. Vitamin D and colorectal cancer: Results of observational studies
|
Author Year Study Name [PMID] |
Life Stage |
Outcome (n/N; Incidence) |
Followup Duration (Time to Dx) |
25(OH)D Concentration, nmol/L |
No. of Cases |
No. in Category |
Adjusted OR |
95% CI |
P for Trend |
Study Quality |
|
Cohort study |
||||||||||
|
Colorectal cancer mortality |
||||||||||
|
Women |
||||||||||
|
Freedman 200753 [17971526] |
19-50† 51-70 ≥71 |
Colorectal Cancer Mortality (66/16818; 0.004) |
nd |
<50 |
28 |
~5606 |
1 |
Reference |
0.02 |
B |
|
|
|
|
|
50-80 |
24 |
~5606 |
0.44 |
0.20, 0.95* |
|
|
|
|
|
|
|
≥80 |
14 |
~5606 |
0.28 |
0.11, 0.68* |
|
|
|
Nested case-control study |
||||||||||
|
Colorectal cancer |
||||||||||
|
Men |
||||||||||
|
Otani 200768 Japan PHC [17622244] |
19-50 51-70† |
Colorectal cancer (N=196 cases; 392 controls) |
1-13 |
<57.2 |
43 |
74 |
1 |
Reference |
0.39 |
B |
|
|
|
|
|
57.2-69.0 |
40 |
85 |
0.76 |
0.42, 1.4 |
|
|
|
|
|
|
|
69.0-80.2 |
36 |
85 |
0.76 |
0.39, 1.5 |
|
|
|
|
|
|
|
≥80.2 |
44 |
80 |
0.73 |
0.35, 1.5 |
|
|
|
Wu 200769 HPFS [17623801] |
19-50 51-70† ≥71 |
Colorectal cancer (179 cases; 356 controls) |
1-9 |
46, median |
45 |
71 |
1 |
Reference |
0.24A |
B |
|
|
|
|
|
62.5 |
44 |
71 |
0.97 |
0.55, 1.70 |
|
|
|
|
|
|
|
72.8 |
30 |
68 |
0.66 |
0.35, 1.24 |
|
|
|
|
|
|
|
83.3 |
23 |
74 |
0.51 |
0.27, 0.97* |
|
|
|
|
|
|
|
98.5 |
37 |
72 |
0.83 |
0.45, 1.52 |
|
|
|
|
19-50 51-70† |
Colorectal cancer, age <65 |
|
48.2, median |
25 |
34 |
1 |
Reference |
0.13 |
|
|
|
|
|
|
66.8 |
15 |
28 |
1.03 |
0.36, 2.91 |
|
|
|
|
|
|
|
80.0 |
9 |
30 |
0.38 |
0.12, 1.26 |
|
|
|
|
|
|
|
97.0 |
14 |
36 |
0.45 |
0.15, 1.40 |
|
|
|
|
51-70† ≥71 |
Colorectal cancer, age ≥65 |
|
48.2, median |
34 |
55 |
1 |
Reference |
0.34 |
|
|
|
|
|
|
66.8 |
36 |
61 |
0.97 |
0.50, 1.87 |
|
|
|
|
|
|
|
80.0 |
19 |
58 |
0.56 |
0.27, 1.15 |
|
|
|
|
|
|
|
97.0 |
27 |
54 |
0.83 |
0.39, 1.75 |
|
|
|
Tangrea 199767 ATBC [9242478] |
19-50 51-70† |
Colorectal cancer (146 cases; 292 controls) |
1-8 |
≤24.5 |
46 |
72 |
1 |
Reference |
0.13 |
B |
|
|
|
|
|
24.5-34.7 |
35 |
73 |
0.7 |
0.4, 1.3 |
|
|
|
|
|
|
|
34.7-48.2 |
36 |
73 |
0.8 |
0.4, 1.3 |
|
|
|
|
|
|
|
>48.2 |
29 |
72 |
0.6 |
0.3, 1.1 |
|
|
|
Author Year Study Name [PMID] |
Life Stage |
Outcome (n/N; Incidence) |
Followup Duration (Time to Dx) |
25(OH)D Concentration, nmol/L |
No. of Cases |
No. in Category |
Adjusted OR |
95% CI |
P for Trend |
Study Quality |
|
Women |
||||||||||
|
Wactawski-Wende 200671 WHI [16481636] |
Post-menopausal women |
Colorectal cancer (306 cases; 306 controls) |
1-12 |
<31.0 |
88 |
67 |
2.53 |
1.49, 4.32 |
0.02 |
B |
|
|
|
|
|
31.0-42.3 |
80 |
73 |
1.96 |
1.18, 3.24* |
|
|
|
|
|
|
|
42.4-58.3 |
78 |
73 |
1.95 |
1.18, 3.24* |
|
|
|
|
|
|
|
≥58.4 |
60 |
93 |
1 |
Reference |
|
|
|
Feskanich 200470 NHS [15342452] |
19-50 51-70† |
Colorectal cancer (192 cases; 384 controls) |
1-11 |
40.2, median |
53 |
77 |
1 |
Reference |
0.02B |
B |
|
|
|
|
|
55.1 |
47 |
79 |
0.93 |
0.53, 1.63 |
|
|
|
|
|
|
|
66.7 |
35 |
75 |
0.79 |
0.44, 1.40 |
|
|
|
|
|
|
|
77.5 |
29 |
77 |
0.58 |
0.31, 1.07 |
|
|
|
|
|
|
|
99.1 |
29 |
75 |
0.53 |
0.27, 1.04 |
|
|
|
Otani 200768 Japan PHC [17622244] |
19-50 51-70† |
Colorectal cancer (179 cases; 358 controls) |
1-13 |
<57.2 |
41 |
77 |
1 |
Reference |
0.74 |
B |
|
|
|
|
|
57.2-69.0 |
34 |
73 |
1.0 |
0.55, 1.9 |
|
|
|
|
|
|
|
69.0-80.2 |
44 |
71 |
1.2 |
0.65, 2.3 |
|
|
|
|
|
|
|
≥80.2 |
41 |
76 |
1.1 |
0.50, 2.3 |
|
|
|
Colon cancer |
||||||||||
|
Both sexes |
||||||||||
|
Braun 199573 WCC [329893] |
19-50 51-70† ≥71 |
Colon cancer (57 cases; 114 controls) |
1-17 |
<43 |
nd |
nd |
1 |
Reference |
0.57 |
C |
|
|
|
|
|
43.0-51.5 |
nd |
nd |
0.3 |
0.1, 1.0 |
|
|
|
|
|
|
|
51.5-61.8 |
nd |
nd |
0.5 |
0.2, 1.5 |
|
|
|
|
|
|
|
61.8-75.3 |
nd |
nd |
0.7 |
0.2, 2.0 |
|
|
|
|
|
|
|
≥75.3 |
nd |
nd |
0.4 |
0.1, 1.4 |
|
|
|
Garland 198972 WCC [2572900] |
19-50 51-70† ≥71 |
Colon cancer (34 cases; 67 controls) |
1-9 |
10 to <50 |
9 |
8 |
1 |
Reference |
0.41 |
C |
|
|
|
|
|
50.0-67.5 |
7 |
13 |
0.48 |
0.13, 1.80 |
|
|
|
|
|
|
|
67.5-82.5 |
5 |
18 |
0.25 |
0.06, 0.98* |
|
|
|
|
|
|
|
82.5-105 |
4 |
17 |
0.21 |
0.05, 0.89* |
|
|
|
|
|
|
|
105-227.5 |
9 |
11 |
0.73 |
0.20, 2.66 |
|
|
|
Men |
||||||||||
|
Otani 200768 Japan PHC [17622244] |
19-50 51-70† |
Colon cancer (141 cases; 282 controls) |
1-13 |
<57.2 |
25 |
54 |
1 |
Reference |
0.70 |
B |
|
|
|
|
|
57.2-69.0 |
27 |
55 |
0.98 |
0.48, 2.0 |
|
|
|
69.0-80.2 |
29 |
66 |
1.0 |
0.48, 2.3 |
||||||
|
|
|
|
|
≥80.2 |
38 |
62 |
1.2 |
0.51, 2.7 |
|
|
|
Author Year Study Name [PMID] |
Life Stage |
Outcome (n/N; Incidence) |
Followup Duration (Time to Dx) |
25(OH)D Concentration, nmol/L |
No. of Cases |
No. in Category |
Adjusted OR |
95% CI |
P for Trend |
Study Quality |
|
Wu 200769 HPFS [17623801] |
19-50 51-70† ≥71 |
Colon cancer (139 cases; 276 controls) |
1-9 |
48.3, median |
49 |
66 |
1 |
Reference |
0.005C |
B |
|
|
|
|
|
66.8 |
44 |
68 |
0.74 |
0.42, 1.33 |
|
|
|
|
|
|
|
80.0 |
17 |
68 |
0.29 |
0.14, 0.59* |
|
|
|
|
|
|
|
97.0 |
29 |
74 |
0.46 |
0.24, 0.89* |
|
|
|
Tangrea 199767 ATBC [9242478] |
19-50 51-70† |
Colon cancer (91 cases; 182 controls) |
1-8 |
≤24.5 |
30 |
47 |
1 |
Reference |
0.69D |
B |
|
|
|
|
|
24.5-34.7 |
18 |
47 |
0.6 |
0.3, 1.2 |
|
|
|
|
|
|
|
34.7-48.2 |
22 |
45 |
0.8 |
0.4, 1.6 |
|
|
|
|
|
|
|
>48.2 |
21 |
42 |
0.8 |
0.4, 1.6 |
|
|
|
Women |
||||||||||
|
Feskanich 200470 NHS [15342452] |
19-50 51-70† |
Colon cancer (148 cases; 296 controls) |
1-11 |
41.2, median |
41.2 |
75 |
1 |
Reference |
0.17 |
B |
|
|
|
|
|
59.7 |
59.7 |
71 |
1.03 |
0.56, 1.89 |
|
|
|
|
|
|
|
73.3 |
73.3 |
77 |
0.54 |
0.28, 1.03 |
|
|
|
|
|
|
|
98.1 |
98.1 |
72 |
0.70 |
0.35, 1.38 |
|
|
|
Otani 200768 Japan PHC [17622244] |
19-50 51-70† |
Colon cancer (115 cases; 230 controls) |
1-13 |
<57.2 |
21 |
53 |
1 |
Reference |
0.12 |
B |
|
|
|
|
|
57.2-69.0 |
27 |
48 |
1.7 |
0.78, 3.6 |
|
|
|
|
|
|
|
69.0-80.2 |
27 |
41 |
2.1 |
0.90, 4.7 |
|
|
|
|
|
|
|
≥80.2 |
31 |
53 |
2.1 |
0.78, 5.6 |
|
|
|
Rectal cancer |
||||||||||
|
Men |
||||||||||
|
Otani 200768 Japan PHC [17622244] |
19-50 51-70† |
Rectal cancer (55 cases; 110 controls) |
1-13 |
<57.2 |
18 |
20 |
1 |
Reference |
0.06 |
B |
|
|
|
|
|
57.2-69.0 |
13 |
30 |
0.17 |
0.02, 1.2 |
|
|
|
|
|
|
|
69.0-80.2 |
7 |
19 |
0.25 |
0.05, 1.3 |
|
|
|
|
|
|
|
≥80.2 |
6 |
18 |
0.075 |
0.005, 0.99 |
|
|
|
Tangrea 199767 ATBC [9242478] |
19-50 51-70† |
Rectal cancer (55 cases; 110 controls) |
1-8 |
≤24.5 |
16 |
25 |
1 |
Reference |
0.06E |
B |
|
|
|
|
|
24.5-34.7 |
17 |
26 |
0.9 |
0.4, 2.4 |
|
|
|
|
|
|
|
34.7-48.2 |
14 |
28 |
0.8 |
0.3, 2.0 |
|
|
|
|
|
|
|
>48.2 |
8 |
30 |
0.4 |
0.1, 1.1 |
|
|
|
Author Year Study Name [PMID] |
Life Stage |
Outcome (n/N; Incidence) |
Followup Duration (Time to Dx) |
25(OH)D Concentration, nmol/L |
No. of Cases |
No. in Category |
Adjusted OR |
95% CI |
P for Trend |
Study Quality |
|
Wu 200769 HPFS [17623801] |
19-50 51-70F ≥71 |
Rectal cancer (40 cases; 80 controls) |
1-9 |
53.0, median |
11 |
30 |
1 |
Reference |
0.08 |
B |
|
|
|
|
|
73.3 |
15 |
28 |
1.74 |
0.61, 5.00 |
|
|
|
|
|
|
|
93.5 |
14 |
22 |
3.32 |
0.87, 12.69 |
|
|
|
Women |
|
|
|
|
|
|
|
|
|
|
|
Otani 200768 Japan PHC [17622244] |
19-50 51-70† |
Rectal cancer (64 cases; 128 controls) |
1-13 |
<57.2 |
20 |
24 |
1 |
Reference |
0.17 |
B |
|
|
|
|
|
57.2-69.0 |
7 |
25 |
0.26 |
0.07, 1.0 |
|
|
|
|
|
|
|
69.0-80.2 |
17 |
30 |
0.46 |
0.15, 14 |
|
|
|
|
|
|
|
≥80.2 |
10 |
23 |
0.33 |
0.08, 1.3 |
|
|
|
Feskanich 200470 NHS [15342452] |
19-50 51-70† |
Rectal cancer (44 cases; 88 controls) |
1-11 |
44.4, median |
24 |
31 |
1 |
Reference |
0.03 |
B |
|
|
|
|
|
66.2 |
10 |
26 |
0.52 |
0.14, 1.93 |
|
|
|
92.4 |
10 |
31 |
0.31 |
0.08, 1.31 |
|
|
||||
|
* Statistically significant (P<0.05) A P for trend = 0.31 when cases diagnosed within 2 years of blood collection were excluded. B Results were not notably changed when cases diagnosed within the first year after blood collection were excluded (P for trend not reported). Subgroup analyses per age were also reported as follows: Age ≥ 60, OR = 0.35 (95% CI 0.14, 0.87) between the lowest and highest quintiles; P for trend = 0.006. Age < 60, OR = 1.36 (95% CI 0.48, 3.92) between the lowest and highest quintiles; P for trend = 0.70. C P for trend = 0.008 when cases diagnosed within 2 years of blood collection were excluded. D P for trend = 0.58 when cases diagnosed within 2 years of blood collection were excluded. E P for trend = 0.04 when cases diagnosed within 2 years of blood collection were excluded. F Most representative life stage |
||||||||||

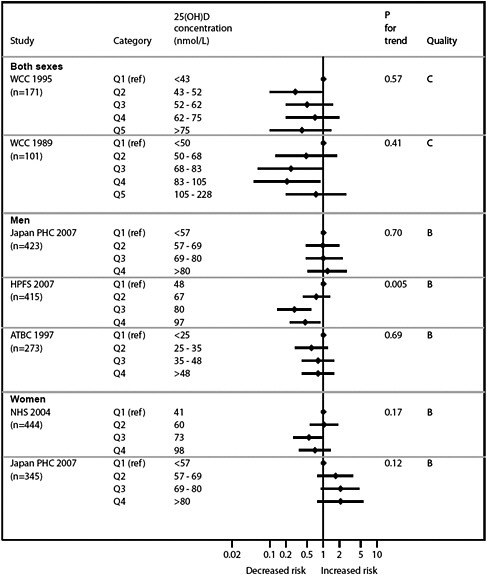
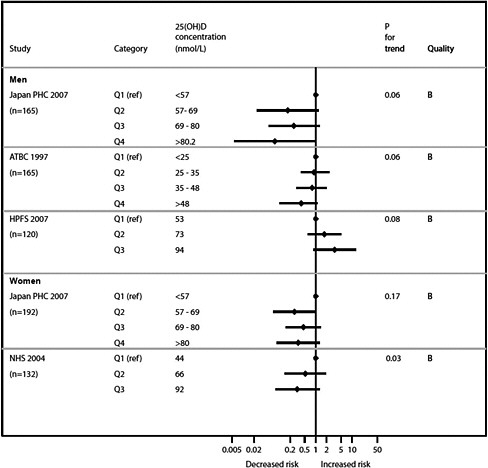
Colorectal adenoma
Synopsis
No systematic reviews have evaluated the association between 25(OH)D concentrations and the risk of colorectal adenoma. One B quality nested case-control study in women found no significant association between 25(OH)D concentrations and the risk of colorectal adenoma.
Detailed presentation (Tables 24 & 25)
One nested case-control study within the NHS evaluated the relationship between 25(OH)D concentrations and the risk of colorectal adenoma in women.74 At 5 years, an adjusted analysis found no significant association between 25(OH)D concentrations and the incidence of colorectal adenoma by trend analysis. Subgroup analyses also found no significant association between 25(OH)D concentrations and the incidence of colon or rectal adenoma. No subgroup data were available regarding age or other special populations (e.g., obese, smokers, ethnic groups, or users of contraceptives). This study was rated B because it excluded more than 50 percent of participants of the original cohort because their blood samples were not available.
Findings by life stage
-
0 – 6 mo Not reviewed
-
7 mo – 2 y Not reviewed
-
3 – 8 y Not reviewed
-
9 – 18 y Not reviewed
-
19 – 50 y A proportion of participants in the NHS was in this life stage. No unique conclusions are possible for this life stage separate from those for people 51 to 70 years.
-
51 – 70 y The analysis of the NHS included female participants mostly within this life stage. The study found no association between 25(OH)D and the incidence of colorectal adenoma.
-
≥71 y A proportion of participants in the NHS was in this life stage. No unique conclusions are possible for this life stage separate from those for people 51 to 70 years.
-
Postmenopause The analysis of NHS partially included postmenopausal women. However, no unique conclusions are possible for this life stage separate from those for people 51 to 70 years.
-
Pregnant & lactating women Not reviewed
Table 24. Vitamin D and colorectal adenoma: Characteristics of observational studies
|
Author Year Study Name Location (Latitude) [PMID] |
Population |
Vitamin D Concentration |
Comparisons |
Confounders/Effect Modifiers Adjusted |
Comments |
|||||||
|
Nutrients |
Demograph |
Anthrop |
Medical |
UV exposure |
Lifestyle |
|||||||
|
Nested case-control |
|
|
|
|
|
|
|
|
|
|
|
|
|
Platz 200074 NHS US (various) [11045788] |
• Health status |
Any |
• Assay method |
RIA (Horris 1993) |
• Colorectal adenoma risk stratified by baseline 25(OH)D quartiles |
X |
X |
X |
X |
X |
X |
Aspirin user: 26%; Hormone replacement therapy: 36% |
|
• Mean Age |
59 (7) |
|
|
|
|
|
|
|
||||
|
• Male % |
0 |
• Season blood drawn |
All |
|
|
|
|
|
|
|
||
Table 25. Vitamin D and colorectal adenoma: Results of observational studies
|
Author Year Study Name [PMID] |
Life Stage |
Outcome (n/N; Incidence) |
Followup Duration (Time to Dx) |
25(OH)D Concentration, nmol/L |
No. of Cases |
No. in Category |
Adjusted OR |
95% CI |
P for Trend |
Study Quality |
|
Nested case-control study |
||||||||||
|
Colorectal adenoma |
|
|
|
|
|
|
|
|
|
|
|
Women |
|
|
|
|
|
|
|
|
|
|
|
Platz 200074 |
19-50 |
Colorectal adenoma (326 cases; 326 controls) |
5 |
16.3, median |
103 |
82 |
1 |
Reference |
1.0 |
B |
|
NHS |
51-70† |
|
|
|
|
|
|
|
|
|
|
[11045788] |
≥71 |
|
|
|
|
|
|
|
|
|
|
|
|
|
|
22.6 |
62 |
80 |
0.64 |
0.41, 1.00 |
|
|
|
|
|
|
|
28.3 |
61 |
82 |
0.58 |
0.36, 0.95 |
|
|
|
|
|
|
|
38.0 |
100 |
82 |
1.04 |
0.66, 1.66 |
|
|
|
Colon adenoma |
|
|
|
|
|
|
|
|
|
|
|
Women |
|
|
|
|
|
|
|
|
|
|
|
Platz 200074 |
19-50 |
Colon adenoma (261 cases; 261 controls) |
5 |
16.3, median |
79 |
64 |
1 |
Reference |
1.0 |
B |
|
NHS |
51-70A |
|
|
|
|
|
|
|
|
|
|
[11045788] |
≥71 |
|
|
|
|
|
|
|
|
|
|
|
|
|
|
22.6 |
55 |
64 |
0.71 |
0.43, 1.18 |
|
|
|
|
|
|
|
28.3 |
51 |
69 |
0.60 |
0.35, 1.02 |
|
|
|
|
|
|
|
38.0 |
76 |
64 |
1.02 |
0.60, 1.73 |
|
|
|
Rectal adenoma |
|
|
|
|
|
|
|
|
|
|
|
Women |
|
|
|
|
|
|
|
|
|
|
|
Platz 200074 |
19-50 |
Rectal adenoma (65 cases; 65 controls) |
5 |
16.3, median |
24 |
18 |
1 |
Reference |
0.9 |
B |
|
NHS |
51-70† |
|
|
|
|
|
|
|
|
|
|
[11045788] |
≥71 |
|
|
|
|
|
|
|
|
|
|
|
|
|
|
22.6 |
7 |
16 |
0.38 |
0.12, 0.19 |
|
|
|
|
|
|
|
28.3 |
10 |
13 |
0.34 |
0.08, 1.42 |
|
|
|
|
|
|
|
38.0 |
24 |
18 |
1.59 |
0.50, 5.03 |
|
|
|
* Statistically significant (P<0.05) A Most representative life stage |
||||||||||
Breast cancer
Synopsis
No qualified systematic reviews evaluated the association between vitamin D and calcium intake or serum 25(OH)D concentration and risk of breast cancer. One cohort study compared serum 25(OH)D concentrations and the risk of breast cancer-specific mortality,53 and two nested case-control studies compared 25(OH)D concentrations and the risk of breast cancer.75,76 The cohort study utilizing NHANES III data found significant decrease in breast cancer-specific mortality during 9 years of followup in those with serum concentration of 25(OH)D greater than 62 nmol/L. The Nurses’ Health Study and Prostate, Lung, Colorectal, and Ovarian (PLCO) Cancer Screening Trial, however, found no significant relationship between serum concentration of 25(OH) D and risk of breast cancer diagnosis in either pre- or postmenopausal women during 7 to 12 years of followup.75,76 All three studies were rated B quality.
Detailed presentation (Tables 26 & 27)
The NHANES III study followed 16,818 adults with a mean age of 44 years with a background calcium intake on average of about 812 mg/day (from diet and supplements). 53 The study included 71% non-Hispanic white, 14% non-Hispanic black, 6% Mexican American, and 9% from other races. During 9 years of followup, women with serum concentration of 25(OH) D greater than 62 nmol/L had a hazard ratio of 0.28 for breast cancer-specific mortality compared to those with 62 nmol/L or lower (95% CI 0.08-0.93). The breast cancer-specific mortality was one of many cancer-specific mortality outcomes reported in this study.
Two nested case-control studies of women with a mean age of 57 years and 67 years, respectively, found no relationship between serum 25(OH)D concentrations and risk of breast cancer.75,76 However, in the second study, when compared with the lowest quintile, quintiles 3 to 5 were associated with nonsignificantly elevated risks. In multivariable adjusted analyses, the risk associated with 25(OH)D levels below 15 ng/mL compared with higher levels was 0.81 (95% CI 0.59, 1.12).76
Findings by age and sex
In the one nested case-control study (methodological quality B) including both premenopausal and postmenopausal women, no relationship was found between vitamin D levels and risk of breast cancer. However, in this study, there was a statistically significant trend towards decreased risk of breast cancer among women older than 60 years of age with serum concentration of 25(OH)D greater than 62 nmol/L.
Findings by life stage
-
0 – 6 mo Not applicable
-
7 mo – 2 y Not applicable
-
3 – 8 y Not applicable
-
9 – 18 y Not applicable
-
19 – 50 y A followup study of NHANES III including women with a mean age of 44 years found a decreased mortality (hazard ratio 0.28) due to breast cancer among those with serum concentration of 25(OH)D greater than 62 nmol/L.
-
51 – 70 y Two nested case-control studies of women with a mean age of 57 years and 67 years, respectively, found no relationship between vitamin D levels and risk of
-
breast cancer. However, in one of these studies, there was a statistically significant trend towards decreased risk of breast cancer among women older than 60 years of age with serum concentration of 25(OH)D greater than 62 nmol/L.
-
≥71 y Not reviewed
-
Postmenopause Not reviewed
-
Pregnant & lactating women Not reviewed
Table 26. Vitamin D and breast cancer: Characteristics of observational studies
|
Author Year Study Name Location (Latitude) [PMID] |
Population |
Vitamin D Concentration |
Comparisons |
Confounders/Effect Modifiers Adjusted |
Comments |
|||||||
|
Nutrients |
Demograph |
Anthrop |
Medical |
UV exposure |
Lifestyle |
|||||||
|
Cohort |
|
|
|
|
|
|
|
|
|
|
|
|
|
Freedman 200753 NHANES III US (38º N) [17971526] |
• Health status |
Noninstitutionalized |
• Assay method |
RIA |
Breast cancer risks: Quintile 1 vs. Quintile 2 |
X |
X |
X |
|
X |
X |
|
|
• Mean age (range/SD), y |
44 (ND) |
|
|
|
|
|
|
|
|
|
||
|
|
|
• Season blood drawn |
All year |
|
|
|
|
|
|
|
|
|
|
Nested Case-Control |
|
|
|
|
|
|
|
|
|
|
|
|
|
Bertone-Johnson 200575 NHS US (38º N) [16103450] |
• Health status |
No Cancer |
• Assay method |
RIA |
Breast cancer risks: Quintile 1 vs. Quintile 2, 3, 4, 5 |
X |
X |
X |
X |
|
X |
|
|
• Mean age (range/SD), y |
57 (7.0) |
|
|
|
|
|
|
|
|
|
||
|
|
|
• Season blood drawn |
All year |
|
|
|
|
|
|
|
|
|
|
Freedman 200876 PLCO Trial US (38º N) [18381472] |
• Health status |
No Cancer |
• Assay method |
RIA |
Breast cancer risks: Quintile 1 vs. Quintile 2, 3, 4, 5 |
X |
X |
X |
X |
|
X |
|
|
• Mean age (range/SD), y |
67 (ND) |
|
|
|
|
|
|
|
|
|
||
|
|
|
• Season blood drawn |
Dec- Sep |
|
|
|
|
|
|
|
|
|
Table 27. Vitamin D and breast cancer: Results of observational studies
|
Author Year Study Name [PMID] |
Life Stage |
Outcome (n/N; Incidence) |
Followup Duration (Time to Dx) |
Vit D Measure |
Concentration, nmol/L |
No. of Cases |
No. in Category |
Adjusted RR |
95% CI |
P for Trend |
Study Quality |
|
Cohort |
|
|
|
|
|
|
|
|
|
|
|
|
Freedman 200753 NHANES III [17971526] |
All Adults |
Breast cancer mortality (28/ND)A |
105 mo |
25(OH)D |
<63 |
20 |
ND |
1 |
Reference |
NS |
B |
|
|
|
|
|
≥63 |
8 |
ND |
HR 0.28 |
0.08, 0.93* |
|
|
|
|
Nested Case- Control |
|
|
|
|
|
|
|
|
|
|
|
|
Bertone-Johnson 200575 NHS [16103450] |
Pre- and Post-menopausal |
Breast cancer (701/1425) |
<1-82 mo |
25(OH)D |
≤50 (1st batch) |
159 |
297 |
1 |
Reference |
nd |
B |
|
|
|
≤70 (2nd batch) |
|
|
|
|
|
|
|||
|
|
|
|
|
≤45 (3rd batch) |
|
|
|
|
|
|
|
|
|
|
|
|
|
51 - 70 |
149 |
278 |
0.95 |
0.66, 1.36 |
|
|
|
|
|
|
|
|
72 - 85 |
|
|
|
|
|
|
|
|
|
|
|
|
47 to 60 |
|
|
|
|
|
|
|
|
|
|
|
|
72 - 82 |
125 |
266 |
0.74 |
0.51, 1.06 |
|
|
|
|
|
|
|
|
87 - 97 |
|
|
|
|
|
|
|
|
|
|
|
|
62 - 72 |
|
|
|
|
|
|
|
|
|
|
|
|
85 - 97 |
144 |
296 |
0.80 |
0.58, 1.11 |
|
|
|
|
|
|
|
|
100 - 117 |
|
|
|
|
|
|
|
|
|
|
|
|
75 - 90 |
|
|
|
|
|
|
|
|
|
|
|
|
≥100 |
124 |
265 |
0.73 |
0.49, 1.07 |
|
|
|
|
|
|
|
|
≥120 |
|
|
|
|
|
|
|
|
|
|
|
|
≥92 |
|
|
|
|
|
|
|
|
|
Breast cancer <60 y (701/1425) |
|
|
|
97 |
191 |
1 |
Reference |
NS |
|
|
|
|
|
|
|
|
84 |
170 |
0.96 |
0.62, 1.49 |
|
|
|
|
|
|
|
|
|
77 |
164 |
0.80 |
0.51, 1.26 |
|
|
|
|
|
|
|
|
|
90 |
192 |
0.85 |
0.55, 1.32 |
|
|
|
|
|
|
|
|
|
70 |
146 |
0.92 |
0.57, 1.48 |
|
|
|
|
|
Breast cancer ≥60 y (701/1425) |
|
|
|
62 |
109 |
1 |
Reference |
0.03 |
|
|
|
|
|
|
|
|
65 |
114 |
1.07 |
0.60, 1.92 |
|
|
|
|
|
|
|
|
|
48 |
105 |
0.64 |
0.35, 1.16 |
|
|
|
|
|
|
|
|
|
54 |
99 |
0.68 |
0.38, 1.24 |
|
|
|
|
|
|
|
|
|
54 |
125 |
0.57 |
0.31-1.04 |
|
|
Pancreatic cancer
Synopsis
No qualified systematic reviews evaluated associations between serum vitamin D concentrations and the incidence of pancreatic cancer. Two nested case-control studies, rated A in methodological quality, evaluated the association between serum 25(OH) concentration and the risk of developing pancreatic cancer in two different populations. One study found that older adult male smokers living in Finland with higher baseline serum 25(OH)D concentration had an increased risk of exocrine pancreatic cancer compared with those with lower concentration (>65.5 vs. <32 nmol/L; OR=2.92; P for trend=0.001). The other study found that baseline 25(OH)D concentrations were not associated with the risk of overall pancreatic cancer (>82.3 vs. <45.9 nmol/L; OR=1.45; P for trend=0.49) among older adults living in the United States. However, there was an increased risk of pancreatic cancer among the study participants with higher compared to lower 25(OH)D concentrations (>78.4 vs. <49.3 nmol/L; OR=4.03) only in those living in low residential UVB exposure areas but not among those living in moderate or high residential UVB exposure areas.
Detailed presentation (Tables 28 & 29)
51 - 74 years
One nested case-control study based on the Alpha-Tocopherol, Beta-Carotene Cancer Prevention Study (ATBC) in older adult male smokers aged 54 to 62 years in Finland identified 200 cases of incident exocrine pancreatic cancer.77 These cases were matched to 400 controls. Baseline serum 25(OH)D concentration was stratified into quintiles. The odds ratio for exocrine pancreatic cancer was 2.92 (95% CI 1.56, 5.48) comparing 5th quintile (>65.5 nmol/L) to 1st quintile (<32 nmol/L). The result was adjusted for age, month of blood drawn, years smoked, number of cigarettes smoked per day, reporting to have quit smoking more than three consecutive visits (>1 y) during the trial (1985-1993), occupational physical activity, education, and serum retinol. The study authors excluded islet cell carcinomas from analysis because the etiology for their pathogenesis might be different from that of exocrine tumors.
Another nested case-control study based on the Prostate, Lung, Colorectal, and Ovarian Screening (PLCO) trial in older men and women aged 55 to 74 years in the United Stated identified 184 cases of incident pancreatic cancer.78 These cases were matched to 368 controls. Baseline serum 25(OH)D concentration was stratified into quintiles. The odds ratio for exocrine pancreatic cancer was 1.45 (95% CI 0.66, 3.15) comparing 5th quintile (>82.3 nmol/L) to 1st quintile (<45.9 nmol/L). The result was adjusted for age, race, sex, date of blood draw based on 2-month blocks, BMI and smoking. The association was not significantly modified by season of blood collection (P for interaction > 0.14); but estimated residential annual solar UVB exposure significantly modified the 25(OH)D concentration and pancreatic cancer association (P for interaction = 0.015). In the joint effects models, among subjects with low estimated annual UBV residential exposure, higher compared with lower 25(OH)D concentrations were positively associated with pancreatic cancer (compared with 1st quartile, the ORs for each respective quartile were 2.52, 2.33, and 4.03; 95% CI 1.38, 11.79), whereas among subjects with moderate to high residential UBV exposure, 25(OH)D concentrations were not associated with pancreatic cancer. There was no significant interaction of 25(OH)D concentration and pancreatic cancer by smoker status, sex, physical activity, or total vitamin A intake.
Findings by life stage
-
0 – 6 mo not reviewed
-
7 mo – 2 y not reviewed
-
3 – 8 y not reviewed
-
9 – 18 y not reviewed
-
19 – 50 y No study specifically targeted this age group.
-
51 – 70 y One nested case-control study found that male smokers living in Finland with higher baseline serum 25(OH)D concentration had an increased risk of pancreatic cancer compared with those with lower concentration (5th vs. 1st quintile, >65.5 vs. <32 nmol/L: OR 2.92, 95% CI 1.56, 5.48, P for trend = 0.001). Another study found that baseline 25(OH)D concentrations were not associated with risk of pancreatic cancer overall among older adults living in the United States (5th vs. 1st quintile, >82.3 vs. <45.9 nmol/L: OR 1.45, 95% CI 0.66, 3.15; P for trend=0.49). However, there was an increased risk of pancreatic cancer among the study participants living in low residential UVB exposure areas (4th vs. 1st quartile >78.4 vs. <49.3 nmol/L: OR=4.03; 95% CI 1.38, 11.79).
-
≥71 y No study specifically targeted this age group.
-
Postmenopause not reviewed
-
Pregnant & lactating women not reviewed
Table 28. Vitamin D and pancreatic cancer: Characteristics of observational studies
|
Author Year Trial/Cohort Country (Latitude) [PMID] |
Population |
25(OH)D |
Comparisons |
Confounders/Effect Modifiers Adjusted |
Comments |
|||||||
|
Nutrients |
Demographic |
Anthrop |
Medical |
UV exposure |
Life styles |
|||||||
|
Stolzenberg-Solomon 200677 ATBC Finland (60°N) [17047087] |
Health status |
All smokers |
Assay |
RIA (DiaSorin) |
Exocrine pancreatic risk stratified by baseline 25(OH)D quintiles |
X |
X |
|
|
X |
X |
|
|
Mean age (range/SD), y |
58 |
|
|
|
|
|
|
|
|
|
||
|
Male (%) |
100 |
Season blood drawn |
nd; but result adjusted for this variable |
|
|
|
|
|
|
|
||
|
Stolzenberg-Solomon 200978 PLCO US (various) [19208842] |
Health status |
DM: 10.5% |
Assay |
RIA (Heartland Assays lab) |
Pancreatic risk stratified by baseline 25(OH)D quintles |
|
X |
X |
|
X |
X |
|
|
Mean age (range), y |
66 (55-74) |
|
|
|
|
|
|
|
|
|||
|
Male (%) |
65.2 |
Season blood drawn |
All seasons |
|
|
|
|
|
|
|
||
|
|
|
|
|
Pancreatic risk stratified by residential sun exposure levels and baseline 25(OH)D quartiles |
|
|
|
|
|
|
|
|
Table 29. Vitamin D and pancreatic cancer: Results of observational studies
|
Author Year Study Name PMID |
Life Stage, y |
Outcome (no. of cases; no. of control) |
Time to diagnosis, y |
25(OH)D concentration, nmol/L |
No. of cases |
No. of control |
Adjusted OR |
95% CI |
P for trend |
Study Quality |
|
Stolzenberg-Solomon 200677 ATBC Finland (60°N) [17047087] |
51-70, male only |
Exocrine pancreatic cancer (200; 400) |
11.8 (median) |
|
|
|
|
|
0.001 |
A |
|
|
<32 |
27 |
80 |
1 |
Reference |
|||||
|
|
|
|
32-41.1 |
34 |
80 |
1.30 |
0.70, 2.40 |
|
|
|
|
|
|
|
41.1-51.1 |
47 |
80 |
2.12 |
1.15, 3.90* |
|
|
|
|
|
|
|
51.1-65.5 |
35 |
81 |
1.50 |
0.81, 2.76 |
|
|
|
|
|
|
|
>65.5 |
57 |
79 |
2.92 |
1.56, 5.48* |
|
|
|
|
Stolzenberg-Solomon both 200978 PLCO US (various) [19208842] |
51-70, both sexes |
Pancreatic cancer (184; 368) |
5.4 (median), up to 11 y |
≤45.9 |
44 |
74 |
|
|
0.49 |
A |
|
|
|
|
|
|
1 |
Reference |
|
|
||
|
|
|
|
>45.9 to ≤60.3 |
40 |
74 |
0.97 |
0.47-1.98 |
|
|
|
|
|
|
|
>60.3 to ≤69.5 |
27 |
73 |
0.86 |
0.40-1.84 |
|
|
|
|
|
|
|
>69.5 to ≤82.3 |
31 |
74 |
0.84 |
0.39-1.80 |
|
|
|
|
|
|
|
>82.3 |
42 |
73 |
1.45 |
0.66-3.15 |
|
|
|
|
|
|
Pancreatic cancer: Low residential sun exposure area (91; 167) |
nd |
|
|
|
|
|
P for interaction between low and moderate/high residential sun exposure = 0.015 |
|
|
|
|
|
<49.3 |
22 |
44 |
1 |
Reference |
|
||
|
|
|
|
|
>49.3 to <65.2 |
22 |
42 |
2.52 |
0.92-6.90 |
|
|
|
|
|
|
|
>65.2 to <78.4 |
21 |
43 |
2.33 |
0.83-6.48 |
|
|
|
|
|
|
|
>78.4 |
26 |
38 |
4.03 |
1.38-11.79* |
|
|
|
|
|
Pancreatic cancer: Moderate residential sun exposure area (91; 167) |
nd |
|
|
|
|
|
|
|
|
|
|
|
<49.3 |
33 |
48 |
1.97 |
0.80-4.82 |
|
|
|
|
|
|
|
|
>49.3 to <65.2 |
15 |
50 |
0.66 |
0.22-2.01 |
|
|
|
|
|
|
|
>65.2 to <78.4 |
18 |
49 |
0.91 |
0.31-2.71 |
|
|
|
|
|
|
|
>78.4 |
24 |
54 |
1.45 |
0.53-3.96 |
|
|
|
* Statistically significant (P<0.05) |
||||||||||
Vitamin D and immunologic outcomes
We reviewed primary studies that evaluated relationships between vitamin D and any immune function related outcomes.
Synopsis
Analyses using NHANES III data (general adult populations living in the US) showed no significant association between baseline 25(OH)D concentrations and infectious disease mortality.
One cohort study from UK suggested a relationship between maternal 25(OH)D concentration and the risk of eczema in their children, but the analysis did not control for important potential confounders, and the 25(OH)D concentrations in children were not measured.
Detailed presentation (Tables 30 &31)
One study analyzed NHANES III data and showed no association between baseline 25(OH)D concentrations and infectious disease.47 NHANES III cohort represents general adult populations living in the United States. This studywas rated quality C.
One cohort study from UK analyzed the serum 25(OH)D concentration in 440 white women in late pregnancy (~33 wk) and found their infants’ risk of eczema at age 9 months was higher in those mothers in the top quartile of the distribution of serum 25(OH)D (>50 nmol/L) compared with those at the bottom quartile (<30 nmol/L), although the results were not statistically significant.42 However, this analysis did not control for important potential confounders, and the 25(OH)D concentrations in children were not measured. This study was rated quality C.
Findings by life stage
-
0 – 6 mo No data
-
7 mo – 2 y No data
-
3 – 8 y No data
-
9 – 18 y No data
-
19 – 50 y NHANES III data include people in this life stage. Analyses using NHANES III data (general adult populations living in the US) showed no significant association between baseline 25(OH)D concentrations and infectious disease mortality.
-
51 – 70 y NHANES III data also include people in this life stage.
-
≥71 y NHANES III data also include people in this life stage
-
Postmenopause No data
-
Pregnant & lactating women One cohort study from UK analyzed the serum 25(OH)D concentration in white women in late pregnancy (~33 wk) and showed a relationship between maternal 25(OH)D concentration and the risk of eczema in their children. However, this analysis did not control for important confounders, and the 25(OH)D concentrations in children were not measured.
Table 30. Vitamin D (mother) and immunologic outcomes (offspring): Characteristics of cohort studies
|
Author Year Study Name Location (Latitude) [PMID] |
Population |
Vitamin D Concentration |
Comparisons |
Confounders/Effect Modifiers Adjusted |
Comments |
|||||||
|
Nutrients |
Demograph |
Anthrop |
Medical |
UV exposure |
Lifestyle |
|||||||
|
Melamed 200847 NHANES III US (various) [18695076] |
• Health status |
DM 7.4%, history of CVD 7.9%, HTN 25% |
• Assay method |
RIA (DiaSorin) |
Infectious disease mortality stratified by baseline 25(OH)D quartiles |
X |
X |
X |
X |
X |
X |
|
|
• Mean age (range), y |
45 (≥20) |
|
|
|
|
|
|
|
|
|||
|
• Male (%) |
46 |
• Season blood drawn |
All |
|
|
|
|
|
|
|
||
|
Gale 200842 PAHSG UK (50ºN) [17311057] |
• Health status |
singleton pregnancy <17 wk 26.3 |
• Assay method |
RIA |
Length and weight in offspring stratified by mother’s 25(OH)D |
|
X |
|
|
X |
|
White only |
|
• Mean age (range/SD), y |
26.3 |
|
|
|
|
|
|
|
|
|||
|
|
• Male (%) |
0 |
• Season blood drawn |
nd |
|
|
|
|
|
|
|
|
Table 31. Vitamin D (mother) and immunologic outcomes (offspring): Results of cohort studies
|
Author Year Study Name [PMID] |
Life Stage |
Outcome (n/N; Incidence) |
Followup Duration (Time to Dx) |
Vit D Measure |
Concentration, nmol/L |
No. of Cases |
No. in Category |
Adjusted OR |
95% CI |
P for Trend |
Study Quality |
|
Melamed 200847 NHANES III US (various) [18695076] |
Adults, both sexes |
Infectious disease mortality (N=13,331) |
Median 8.7 (IRQ 7.1- 10.2) y |
25(OH)D |
<44 |
nd |
13331 (Total) |
0.84 |
0.38, 1.86 |
nd |
C |
|
|
|
|
|
|
44-60 |
nd |
nd |
0.87 |
0.43, 1.74 |
|
|
|
|
|
|
|
|
61-80 |
nd |
nd |
1.01 |
0.53, 1.93 |
|
|
|
|
|
|
|
|
>80 |
nd |
nd |
1 |
Reference |
|
|
|
Gale 200842 PAHSG UK (54°N) [17311057] |
Pregnant women; infant at 9 mo |
Atopic eczema at 9 mo (48/440; 0.11) |
9 mo |
Maternal 25(OH)D at late pregnancy |
<30 (Quartile) |
9 |
440 (total) |
1 |
Reference |
nd |
C |
|
|
|
|
|
|
30-50 |
10 |
1.11A |
0.43, 2.84 |
|
|
|
|
|
|
|
|
|
50-75 |
15 |
1.75A |
0.73, 4.17 |
|
|
|
|
|
|
|
|
|
>75 |
14 |
1.62A |
0.67, 3.89 |
|
|
|
|
ACrude OR |
|||||||||||
Vitamin D and pregnancy-related outcomes
Preeclampsia
Synopsis
A single nested case-control study found an association between low 25(OH)D concentration (<37.5 nmol/L) early in pregnancy and preeclampsia. The study was rated B for methodological quality.
Detailed presentation (Tables 32 & 33)
A nested case-control study evaluated the association between 25(OH)D concentration and risk of preeclampsia.79 The study found an association between 25(OH)D concentrations less than 37.5 nmol/L (measured approximately 30 wk before outcome assessment) and increased risk of preeclampsia. The study was rated B for methodological quality.
Findings by life stage
-
0 – 6 mo No data
-
7 mo – 2 y Not applicable
-
3 – 8 y Not applicable
-
9 – 18 y Not applicable
-
19 – 50 y See pregnant and lactating women.
-
51 – 70 y Not applicable
-
≥71 y Not applicable
-
Postmenopause Not applicable
-
Pregnant & lactating women A single nested case-control study found an association between low 25(OH)D concentration (<37.5 nmol/L) early in pregnancy and preeclampsia.
Other outcomes
Synopsis
We did not identify any eligible studies on the relationship of vitamin D with or without calcium and high blood pressure, preterm birth, or small infant for gestational age.
Table 32. Vitamin D and preeclampsia: Characteristics of nested case-control studies
|
Author Year Study Name Location (Latitude) [PMID] |
Population |
Vitamin D Concentration |
Comparisons |
Confounders/Effect Modifiers Adjusted |
|||||||
|
Nutrients |
Demograph |
Anthrop |
Medical |
UV exposure |
Lifestyle |
||||||
|
Bodnar 200779 PEPPSA US (41°N) [17535985] |
• Health status |
Healthy |
• Assay method |
ELISA |
Comparison of mean 25(OH)D levels in cases and controls |
|
x |
x |
|
|
|
|
• Age range, y |
20-29 |
|
|
|
|
|
|
|
|
||
|
• Male (%) |
0 |
• Season blood drawn |
ND |
|
|
|
|
|
|
|
|
|
A Pregnancy Exposures and Preeclampsia Prevention Study |
|||||||||||
Table 33. Vitamin D and preeclampsia: Results of nested case-control studies
|
Author Year Study Name Location (Latitude) [PMID] |
Life Stage |
Outcome (n/N; Incidence) |
Followup Duration (Time to Dx) |
Vit D Measure |
Concentration, nmol/L |
No. of Cases |
No. in Category |
Adjusted OR |
95% CI |
Study Quality |
|
Bodnar 200779A PEPPSB US (41°N) [17535985] |
Pregnancy |
Preeclampsia (55/1198; 4.%) C |
ND |
25(OH)DD |
<37.5 (vs. >37.5) |
49 |
265 |
5.0 |
1.7, 14.1 |
B |
|
A This is a nested case-control study B Pregnancy Exposures and Preeclampsia Prevention Study C Incidence obtained from the “parent” cohort study in which this case control study is nested. D Early in pregnancy, approximately 30 wk before outcome assessment |
||||||||||
Vitamin D and clinical outcomes of bone health
For bone health outcomes (e.g., bone mineral density, fracture, fall or muscle strength), we relied on a recent comprehensive systematic review (Effectiveness and Safety of Vitamin D in Relation to Bone Health) performed by the Ottawa EPC (Table 28).6 Because the Ottawa’s EPC report did not report separate analyses for the effect of vitamin D supplementation alone, the results for the effect of vitamin D alone or in combination with calcium supplementation were presented in the “Combined Vitamin D and Calcium” section. The Ottawa EPC report also did not report separate analyses by study designs (i.e., RCTs, prospective cohorts, before and after study, and case-control studies), although the report primarily included RCTs.
The Ottawa EPC report was updated with literature published between January 2006 and September 2008, selected according to our eligibility criteria. Only RCTs qualified for inclusion.
Rickets
Synopsis
The Ottawa EPC report concluded that there is fair evidence for an association between low serum 25(OH)D concentrations and confirmed rickets, regardless of the types of assay measures of 25(OH)D concentrations (RIA, CPBA, HPLC). According to the report, there is inconsistent evidence to determine whether there is a threshold concentration of serum 25(OH)D above which rickets do not occur.
Our updated search did not identify new RCTs examining the effect of vitamin D supplementation on rickets.
Detailed presentation (Table 34)
Ottawa EPC Report: Rickets - infants (0 through 12 months) and young children (1 through 5 years)
Overall, there is fair evidence for an association between low serum 25(OH)D concentrations and confirmed rickets, regardless of the types of assay measures of 25(OH)D concentrations (RIA, CPBA, HPLC). There is inconsistent evidence to determine whether there is a threshold concentration of serum 25(OH)D above which rickets do not occur.
Six studies (one RCT, three before-after and two case-control studies) reported mean or median serum 25(OH)D concentrations < 30 nmol/L in children with rickets whereas the other studies reports the mean or median 25(OH)D concentrations were above 30 nmol/L (and up to 50 nmol/L). In seven of eight case-control studies, serum 25(OH)D concentrations were lower in the children with rickets compared with controls.
Findings by life stage
-
0 – 6 mo The Ottawa EPC report included infants and young children and concluded that there is fair evidence for an association between low serum 25(OH)D concentrations and confirmed rickets, regardless of the types of assay measures of 25(OH)D concentrations (RIA, CPBA, HPLC). There were no new data since the Ottawa EPC report.
-
7 mo – 2 y The Ottawa EPC report included infants and young children. There were no new data since the Ottawa EPC report.
-
3 – 8 y The Ottawa EPC report included young children. There were no new data since the Ottawa EPC report.
-
9 – 18 y Not reviewed
-
19 – 50 y Not reviewed
-
51 – 70 y Not reviewed
-
≥71 y Not reviewed
-
Postmenopause Not reviewed
-
Pregnant & lactating women Not reviewed
Table 34. Summary of systematic review of the effect of vitamin D on bone health
|
Author Year [PMID] |
Cranney6 2007 [18088161] |
|||
|
Design |
Systematic review of RCTs and observational studies |
|||
|
Population |
|
|||
|
Intervention (Exposure) and Comparator |
Intervention (Exposure):
Comparator:
|
|||
|
Results |
See text for summary results for the following outcomes in both vitamin D and combined vitamin D and calcium sections of the report: |
|||
|
|
|
|||
|
Comments |
Case-control studies were included but always summarized separately from cohort studies and RCTs. Meta-analyses were performed to pool results from RCTs only. |
|||
|
AMSTAR |
||||
|
A priori design? |
Yes |
Study quality assessment performed? |
Yes |
|
|
Two independent reviewers? |
Yes |
Study quality appropriately used in analysis? |
Yes |
|
|
Comprehensive literature search? |
Yes |
Appropriate statistical synthesis? |
Yes |
|
|
All publication types and languages included? |
No |
Publication bias assessed? |
No |
|
|
Included and excluded studies listed? |
Yes |
Conflicts of interest stated? |
Yes |
|
|
Study characteristics provided? |
Yes |
|
|
|
Fractures, falls, or performance measures
Synopsis
Overall, the Ottawa EPC report concluded that the associations between serum 25(OH)D concentrations and the risk of fractures, falls, and performance measures among postmenopausal women or elderly men are inconsistent.6
Findings from three additional RCTs (published after the Ottawa EPC report)80-82 also did not show significant effects of either vitamin D2 or D3 supplementation (daily doses ranged from 400 IU to 822 IU) in reducing the risk of total fractures or falls in elderly populations (≥71 years old).
Detailed presentation (Tables 35 & 36)
Ottawa EPC Report: Fractures - Postmenopausal women or elderly men
Overall, there is inconsistent evidence for an association between serum 25(OH)D concentrations and the risk of fractures. Fifteen studies (three prospective cohorts and twelve case-controls) reported on the association between serum 25(OH)D concentrations and fracture rates. One of three cohorts reported an inverse association between serum 25(OH)D concentrations and fracture rates, and nine of twelve case-control studies found significantly lower 25(OH)D concentrations in cases versus controls. Differences in results may be attributed to whether all relevant confounders were controlled for and differences in baseline serum 25(OH)D concentrations. Other factors may also contribute to the heterogeneity, such as diagnosis of fractures.
Ottawa EPC Report: Falls - Postmenopausal women or elderly men
Overall, there is fair evidence of an association between lower serum 25(OH)D concentrations and an increased risk of falls in institutionalized elderly. One study suggested a serum 25(OH)D concentration below 39 nmol/L was associated with an increased risk of falls.
Five studies (one RCT, three cohorts and one case-control) evaluated the association between serum 25(OH)D concentrations and risk of falls. One RCT, two of the three cohorts and one case-control study reported an inverse association between serum 25(OH)D concentrations and a risk of falls. In one cohort with a low percentage of vitamin D deficient participants, the association did not persist after adjustment for age and illness severity. In another cohort with an undetermined proportion of vitamin D deficient participants no significant association between serum 25(OH)D concentrations and risk of falls was observed. One case-control studyreported no significant association between serum 25(OH)D concentrations and risk of falls after adjusting for serum PTH.
Ottawa EPC Report: Performance measures - Postmenopausal women or elderly men
Overall, there is inconsistent evidence for an association of serum 25(OH)D concentrations with performance measures. In studies that reported a positive association, specific concentrations below which, declines in performance measures were increased, ranged from 50 to 87 nmol/L.
Seven studies (three RCTs and four cohorts) assessed the relation between 25(OH)D concentrations and performance related measures. Two of the three RCTs and two of the four cohorts reported an association between 25(OH)D concentrations and performance measures. The other studies did not find an association between 25(OH)D concentrations and performance measures.
Additional RCTs published after the Ottawa EPC report
We identified three additional RCTs (published after the Ottawa EPC report)80-82 that examined the effect of either vitamin D2 or D3 supplementation on total fractures, falls, or performance in elderly populations (≥71 years old). All three RCTs were rated C. In two of the three RCTs80,81 calcium supplementation (800 or 1200 mg/d) was given to all participants. Baseline serum 25(OH)D concentrations were less than 40 nmol/L. The other RCT did not provide any information on background calcium intake or baseline serum 25(OH)D concentrations.82 All three RCTs reported no significant reduction in the risk of total fracture or falls in elderly populations at daily vitamin D doses ranging from 400 IU to 822 IU.80-82 Only one of the three new RCTs among elderly reported data on performance measures. Vitamin D supplementation (400 IU/d) improved gait speed and body sway in healthy elderly subjects.80
Findings by life stage
-
0 – 6 mo Not reviewed
-
7 mo – 2 y Not reviewed
-
3 – 8 y Not reviewed
-
9 – 18 y Not reviewed
-
19 – 50 y No data
-
51 – 70 y The Ottawa EPC report concluded that the associations between serum 25(OH)D concentrations and risk of fractures, falls, and performance measures are inconsistent. There were no new data since the Ottawa report
-
≥71 y Findings from three new RCTs did not show significant effects of either vitamin D2 or D3 supplementation (daily doses ranged from 400 IU to 822 IU) in reducing the risk of total fractures or falls among men and women in this life stage.
-
Postmenopause The Ottawa EPC report concluded that the associations between serum 25(OH)D concentrations and risk of fractures, falls, and performance measures are inconsistent. There were no new data since the Ottawa report
-
Pregnant & lactating women Not reviewed
Table 35. Vitamin D and bone health: Characteristics of RCTs published after the Ottawa EPC report
|
Author Year Study Name Location (Latitude) [PMID] |
Population |
Background Calcium Intake & Vitamin D Data |
Comparisons |
Compliance |
Comments |
|
|
Lyons 200782 South Wales, UK (52°N) [17473911] |
• Health status |
Living in care facilities including some elderly with mobility, cognitive, visual, hearing or communication impairments |
nd |
Vit D2 100,000 IU 4-monthly vs. placebo |
80% (percentage of occasions observed to take tablets) |
|
|
|
• Mean age (SD), y |
84 (62-107) |
|
|
|
|
|
|
• Male (%) |
23.7 |
|
|
|
|
|
Burleigh 200781 Scotland (55° 57'N) [17656420] |
• Health status |
Inpatient with high levels of comorbidity, mortality and polypharmacy |
25(OH)D: 22.0 nmol/L |
Vit D3 800 IU/d + Ca carbonate 1200 mg/d vs. Ca carbonate 1200 mg |
Ca group=87%, Vit D+Ca group=89% (total study drug taken/total study drug prescribed, as recorded in drug prescription charts) |
|
|
|
• Mean age (range), y |
83 (7.6) |
|
|
||
|
|
• Male (%) |
40 |
|
|
|
|
|
Bunout 200680 Chile (32°S) [16797903] |
• Health status |
Healthy |
25(OH)D: ≤40 nmol/L |
Ca 800 mg/d vs. Ca 800 mg/d + Vit D 400 IU/d (with and without exercise training) |
92% (tablet counting) |
|
|
• Mean age (SD), y |
76 (4) |
|
|
|
||
|
|
• Male (%) |
11.6 |
|
|
|
|
Table 36. Vitamin D and bone health: Results of RCTs published after the Ottawa EPC report
|
Author Year Study Name [PMID] |
Life Stage |
Outcome |
1°/2° |
Mean Followup |
Interventions, Daily Dose |
n Event |
N Total |
Outcome Metric (Comparison) |
Result |
95% CI |
P Btw |
Study Quality |
|
Lyons 200782 [17473911] |
≥71 both sexes |
First fracture |
1° |
Median time to first fracture = 387 (IQR: 220–582) d in Vit D2 group; 367 (IQR: 139–618) d in placebo group |
Vit D2 ~822 IUA |
205 |
1670 |
HR Vit D/placebo |
0.95 |
0.79, 1.15 |
NS |
C |
|
|
|
Placebo |
218 |
1673 |
|
|
|
|
|
|||
|
Burleigh 200781 [17656420] |
≥71 both sexes |
Fall |
1° |
Median 1 (IQR 15–71 d) |
Vit D3 800 IU + Ca carbonate 1200 mg |
36 |
100 |
RR (Vit D+Ca)/Ca |
0.82 |
0.59, 1.16 |
NS |
C |
|
|
|
|
Ca carbonate 1200 mg |
45 |
103 |
|
|
|
|
|
||
|
|
|
Fracture |
1° |
Median 1 (IQR 15–71 d) |
Vit D3 800 IU + Ca carbonate 1200 mg |
1 |
100 |
nd |
nd |
|
NS |
|
|
|
|
|
|
|
Ca carbonate 1200 mg |
3 |
103 |
|
|
|
|
|
|
Bunout 200680 [16797903] |
≥71 both sexes |
Fall |
2° |
9 mo |
Ca 800 mg |
13B |
24 |
Fall free survival curve |
nd |
|
NS |
C |
|
|
|
|
Ca 800 mg + exercise training |
6B |
22 |
|
|
|
|
|
||
|
|
|
|
|
|
Vit D 400 IU + Ca 800 mg |
9B |
24 |
|
|
|
|
|
|
|
|
|
|
|
Vit D 400 IU + Ca 800 mg + Exercise training |
8B |
22 |
|
|
|
|
|
|
A Daily dose was calculated from the intermittent doses that were used in the study (i.e., 100,000 IU tablets every 4 months) B Estimated from figure |
||||||||||||
Vitamin D and all-cause mortality
Synopsis
This synopsis is based on our reanalysis of a systematic review of RCTs on vitamin D supplementation for mortality.i In addition, it summarizes four observational studies on the association of vitamin D and all-cause mortality.
Three RCTs from the previous systematic review and an additional C rated RCT were included in our reanalysis. Three used daily doses that ranged between 400 and 880 IU, and one used 100,000 IU every 3 months. Our meta-analysis of the 4 RCTs (13,833 participants) shows absence of significant effects of vitamin D supplementation on all-cause mortality (RR = 0.97, 95% CI: 0.92, 1.02; random effects model). There is little evidence for between-study heterogeneity in these analyses.
One cohort study (rated B for methodological quality) found a significant trend for lower odds for death with increasing 25(OH)D concentrations. Three other cohort studies did not find a significant association between 25(OH)D concentrations and allcause mortality. These three studies were rated C for their methodological quality.
The above are applicable to older (50-70 y) and elderly (≥71 y) men and women (mean age was >70 y in the included studies).
Detailed presentation (Tables 37, 38 & 39)
As mentioned in the Methods section, we updated and reanalyzed published meta-analyses of mortality outcomes. We drew our own conclusions based on our analyses. We also comment on the concordance of our conclusions with those of the published meta-analyses.
Relevant published systematic reviews of RCTs (with meta-analyses)
We identified two systematic reviews (with meta-analyses) of RCTs that summarized the effect of vitamin D supplementation with or without calcium on mortality.83,84 One systematic review (Avenell 2008) examined only trials on fall prevention, and briefly described results on mortality.84 The second meta-analysis (Autier 2007) focused specifically on mortality.83 It included all RCTs identified in the first, as well as additional trials (which were not eligible for the primary analysis of the Avenell 2008 systematic review, namely prevention of falls).83 Therefore, the Autier 2007 meta-analysis was used as the basis for our reanalysis.
Table 37 summarizes the findings of the Autier 2007 systematic review.
Table 37. Summary of systematic review on vitamin D supplementation and all-cause mortality
|
Author Year [PMID] |
Autier 200783 [17846391] |
|||
|
Design (Search Years) |
Randomized controlled trials (1992-2006) |
|||
|
Population |
Community dwelling or institutionalized adults |
|||
|
Intervention (Exposure) and Comparator |
Supplementary vitamin D (at least 1000 mg/d) without calcium vs. placebo or no treatment |
|||
|
Results |
18 trials of combined vitamin D and vitamin D + calcium RR: 0.93 (95% CI 0.87, 0.99); favoring vitamin D (± calcium) supplementation Statistically homogeneous In our reanalysis we and excluded 3 of 18 trials and separated studies with vitamin D only from those with vitamin D and calcium combination. For details and results of our reanalysis, see text. |
|||
|
Comments |
See text in vitamin D and vitamin D + calcium sections for reanalyses of the separated trials. Study participants, vitamin D assays, and vitamin D status are not described in detail. |
|||
|
AMSTAR Criteria |
||||
|
A priori design? |
Yes |
Study quality assessment performed? |
No |
|
|
Two independent reviewers? |
No |
Study quality appropriately used in analysis? |
NA |
|
|
Comprehensive literature search? |
Yes |
Appropriate statistical synthesis? |
Yes |
|
|
All publication types and languages included? |
Yes |
Publication bias assessed? |
No |
|
|
Included and excluded studies listed? |
No |
Conflicts of interest stated? |
Yes |
|
|
Study characteristics provided? |
Yes |
The meta-analysis did not perform quality assessment (neither using individual quality items nor using quality scores) |
||
Additional identified RCTs (not included in published systematic reviews)
Lyons 2007 (n=3343, 24% males) used monthly supplementation with 100,000 IU of vitamin D2, orally for 3 years.82 The trial took place in South Wales (latitude ~52°N) and included older people (mean age 84 y) living in sheltered accommodation. The primary outcome was prevention of fractures. The Lyons 2007 RCT received grade “C” for the all-cause mortality outcome, because of inconsistencies in the reported data. This RCT is included in the reanalysis described below.
Reanalysis
We excluded 5 of 18 trials in the Autier 2007 meta-analysis: One trial was on patients with congestive heart failure,85 one was published only in abstract form,86 in one trial the controls also received supplementation with vitamin D, albeit with a smaller dose,87 and two trials used vitamin D injections.88,89 One additional eligible RCT (Lyons 2007)82 was identified and included in our meta-analysis.
Overall, four trials (13,899 patients) used only vitamin D supplementation without calcium. Among the four trials, sample sizes ranged from 2578 to 5292 participants. Followup periods ranged from 36 to 60 months. Vitamin D doses in most trials ranged between 400 and 830 IU per day.
Overall, there were no significant effects of vitamin D supplementation on mortality. The RR was 0.97 (95% CI 0.92, 1.02), with no evidence for between study heterogeneity (P=0.39, I2=0%).
Cohort studies
We identified four prospective cohort studies described in 5 publications.47,90-93 The characteristics of the four cohorts are shown in Table 38. One was rated “B” 90 for methodological quality and the remaining were rated “C”.
Table 39 summarizes the findings of the four studies. Briefly, only Jia 200790 found a statistically significant trend between increasing 25(OH)D concentrations and lower odds for all-cause mortality (P=0.03). However, none of the odds ratios of the different 25(OH)D categories was significant, and if anything, they suggest an U shaped relationship between 25(OH)D and
mortality. All other cohorts did not find significant associations. Melamed 200847 performed analyses in subgroups of men and women, and <65 or ≥65 years of age, and found no significant associations (Table 33).
Findings by life stage
-
0 – 6 mo No data
-
7 mo – 2 y No data
-
3 – 8 y No data
-
9 – 18 y No data
-
19 – 50 y A subgroup analysis of people younger than 65 years in NHANES III (Melamed 2008) found no significant associations between 25(OH)D concentrations and all cause mortality.
-
51 – 70 y Overall, there were no significant effects of vitamin D supplementation on mortality.
-
In a random effects model meta-analysis of five RCTs (n=13,899) the summary RR was 0.97 (95% CI 0.92, 1.02), with no evidence for between-study heterogeneity (p=0.39, I2=0%). The mean participant age was more than 70 years in these RCTs.
-
Overall, data from four cohorts suggest no association between baseline 25(OH)D measurements and all-cause mortality (one cohort found a statistically significant trend for). A subgroup analysis of people aged 65 years or older in NHANES III (Melamed 2008) found no significant associations between 25(OH)D concentrations and all cause mortality.
-
-
≥71 y The above (51–70 y) are applicable.
-
Postmenopause No data
-
Pregnant & lactating women No data
Table 38. Vitamin D and all-cause mortality: Characteristics of cohort studies
|
Author Year Study Name Location (Latitude) [PMID] |
Population |
Vitamin D Concentration |
Comparisons |
Confounders/Effect Modifiers Adjusted |
|||||||
|
Nutrients |
Demograph |
Anthrop |
Medical |
UV exposure |
Lifestyle |
||||||
|
Jia 200790 UK (57°N) [17442130] |
• Health status |
Not terminally ill or demented |
• Assay method |
RIA |
Comparison of various 25(OH)D concentration categories |
|
X |
|
X |
X |
X |
|
• Age range, y |
>75 |
|
|
|
|
|
|
|
|
||
|
|
• Male (%) |
52 |
• Season blood drawn |
ND |
|
|
|
|
|
|
|
|
Shambrook 2004 & 200691,92 FREEA Australia (33°S) [15531500 & 16598375] |
• Health status |
Not bedridden |
• Assay method |
RIA (Diasorin) |
Association with log 25(OH)D |
|
X |
|
X |
|
|
|
• Age range, y |
>65 |
|
|
|
|
|
|
|
|
|
|
|
• Male (%) |
22 |
• Season blood drawn |
ND |
|
|
|
|
|
|
|
|
|
Visser 200693 Longitudinal Aging Study Netherlands (52°N) [16960177] |
• Health status |
General populationB |
• Assay method |
Competitive protein binding |
Comparison of various 25(OH)D concentration categories |
|
X |
X |
|
|
X |
|
• Age range, y |
>65 |
|
|
|
|
|
|
|
|
||
|
• Male (%) |
51 |
• Season blood drawn |
ND |
|
|
|
|
|
|
|
|
|
Melamed 200847 NHANES III US (various) [18695076] |
• Health status |
General population |
• Assay method |
RIA (Diasorin) |
Comparison of various 25(OH)D concentration categories |
X |
X |
X |
X |
X |
X |
|
• Age mean (range), y |
45 (>=20) |
|
|
|
|
|
|
|
|
||
|
|
• Male (%) |
46 |
• Season blood drawn |
ND |
|
|
|
|
|
|
|
|
A Fracture Risk Epidemiology in the Elderly B ~40% with CVD and ~60% arthritis |
|||||||||||
Table 39. Vitamin D and all-cause mortality: Results of cohort studies
|
Author Year Study Name Location (Latitude) [PMID] |
Age range, sex |
Outcome |
Followup Duration (Time to Dx) |
Vit D Measure |
Concentration, nmol/L |
No. of Cases |
No. in Category |
Adjusted OR |
95% CI |
P for trend |
Study Quality |
|
Jia 200790 UK (57°N) [17442130] |
>75, both sexes |
Mortality |
69 |
25(OH)D |
6.0-23.0 (M)/7.0-19.0 (F) |
41 |
75 |
1.74 |
0.91, 3.34 |
0.03 |
B |
|
|
|
|
|
|
23.1-30.0 (M)/29.1-24.0 (F) |
34 |
86 |
1.40 |
0.73, 2.70 |
|
|
|
|
|
|
|
|
30.1-37.0 (M)/24.1-30.2 (F) |
21 |
80 |
0.90 |
0.45, 1.79 |
|
|
|
|
|
|
|
|
37.1-47.0 (M)/30.3-39.0 (F) |
17 |
78 |
0.80 |
0.39, 1.62 |
|
|
|
|
|
|
|
|
47.1-82.0 (M)/39.1-82.0 (F) |
16 |
79 |
1.00 |
Reference |
|
|
|
Shambrook 2004 & 200691,92 FREEA Australia (33°S) [15531500 & 16598375] |
>65, both sexes |
Mortality |
27 |
25(OH)D |
NA |
559 |
1112 |
0.87B |
0.75, 1.01 |
nd |
C |
|
Visser 200693 Longitudinal Aging Study Netherlands (52°N) [16960177] |
>65, both sexes |
Mortality |
72 |
25(OH)D |
<25 |
66 |
127 |
1.28 |
0.85, 1.92 |
0.19 |
C |
|
|
|
|
|
|
25-49.9 |
42 |
462 |
1.00 |
0.72, 1.40 |
|
|
|
|
|
|
|
|
50-74.9 |
30 |
440 |
0.91 |
0.65, 1.26 |
|
|
|
|
|
|
|
|
≥75 |
29 |
231 |
1.00 |
Reference |
|
|
|
Melamed 200847 NHANES III US (various) [18695076] |
>20, both sexes |
Mortality |
104 |
25(OH)D |
<17.8 |
nd |
nd |
1.26 |
1.08, 1.46 |
nd |
C |
|
|
|
|
|
|
17.8-24.3 |
nd |
nd |
1.06 |
0.89, 1.24 |
|
|
|
|
|
|
|
|
24.4-32.1 |
nd |
nd |
0.93 |
0.79, 1.10 |
|
|
|
|
|
|
|
|
>32.1 |
nd |
nd |
1.00 |
Reference |
|
|
|
Melamed 200847 NHANES III US (various) [18695076] |
>20, men only |
Mortality |
104 |
25(OH)D |
<17.8 |
nd |
nd |
1.04 |
0.83, 1.30 |
nd |
C |
|
|
|
|
|
|
17.8-24.3 |
nd |
nd |
0.94 |
0.75, 1.19 |
|
|
|
|
|
|
|
|
24.4-32.1 |
nd |
nd |
0.82 |
0.64, 1.05 |
|
|
|
|
|
|
|
|
>32.1 |
nd |
nd |
1.00 |
Reference |
|
|
Vitamin D and hypertension and blood pressure
We searched for systematic reviews and primary studies that evaluated associations between vitamin D supplementation or serum concentrations and incidence of hypertension and change in blood pressure. For the outcome incidence of hypertension, we reviewed RCTs and other longitudinal studies. For the outcome change in blood pressure, we reviewed only RCTs. The EPC and the TEP agreed that due to the large volume of literature, the limited resources would not be expended on reviewing observational studies for the surrogate outcome blood pressure. We included only studies of adults. Studies of pregnancy-related hypertension and blood pressure control are included in the “Pregnancy-related outcomes” section.
Hypertension
Synopsis
No systematic reviews evaluated the association between vitamin D intake or serum 25(OH)D concentrations and incidence of hypertension. A combined analysis of a small subset of the Health Professionals Follow-up (HPFS) and Nurses Health Studies (NHS) evaluated the association with serum 25(OH)D concentrations. The analysis found higher incidence of hypertension at 4 and 8 years in men with baseline 25(OH)D concentration less than 37.5 nmol/L (OR~3-6). In women, serum 25(OH)D concentrations less than 37.5 nmol/L also had a significantly higher incidence of hypertension at 4 years (OR~3), but not at 8 years (OR~1.5).
Detailed presentation (Tables 40 & 41)
One analysis (methodological quality B) evaluated the incidence of hypertension in a combined set of 613 men from the HPFS and 1198 women from the NHS who had serum 25(OH)D concentrations measured.94 The men were on average 65 years old and the women 57 years old. Among the men at 4 years, those with serum 25(OH)D concentrations less than 37.5 nmol/L were significantly more likely to have new onset hypertension than either men with 25(OH)D concentrations above 75 nmol/L (OR=6.1) or above 37.5 nmol/L (OR=5.7). The association remained significant at 8 years, although with a smaller effect size (OR=3.5 and 3.0, respectively). In women, a similar, though weaker, effect was seen at 4 years, such that those with 25(OH)D concentrations less than 37.5 nmol/L were significantly more likely to have new onset hypertension than either women with 25(OH)D concentrations above 75 nmol/L (OR=2.7) or above 37.5 nmol/L (OR=3.0). However, this effect was smaller and nonsignificant at 8 years (OR=1.7 and 1.4, respectively). The study was limited primarily by its inclusion of only a relatively small subset of participants and its reliance on self-reported hypertension without assessment of blood pressure measurements.
In the second analysis by the same investigators, the NHS 2 study was analyzed for the association between serum 25(OH)D concentration and hypertension as a nested case-control study.95 These women were on average 43 years old. Cases and controls (per the 2005 biennial questionnaire) were chosen from among those women without hypertension, cardiovascular disease, diabetes, obesity, or cancer at baseline (blood samples drawn from 1997 to 1999). After approximately 7 years, a statistically significant trend was found such that women in the three quartiles with serum 25(OH)D concentrations of 80.5 nmol/L or less were about 50 to 60 percent more likely to develop hypertension than those women with higher serum concentrations of 25(OH)D (adjusted OR = 1.52 to 1.66, each of which was statistically significant compared to
the highest quartile). The study was graded methodological quality B for similar reasons as the analysis of the HPFS and NHS studies.
Findings per vitamin D concentration
The HPFS and NHS studies were analyzed with 25(OH)D cutpoints of 37.5 and 75 nmol/L. Significant associations were found for those with serum concentrations below 37.5 nmol/L. The NHS 2 study was analyzed with 25(OH)D quartiles, such that significant associations were found for those with serum concentrations of 80.5 nmol/L or less.
Findings per age and sex
See above Detailed presentation of the HPFS and NHS for the separate analyses by sex. No subgroup analyses were reported by life stage. The participants in the studies were approximately 40 to 80 years old.
Findings by life stage
-
0 – 6 mo Not reviewed
-
7 mo – 2 y Not reviewed
-
3 – 8 y Not reviewed
-
9 – 18 y Not reviewed
-
19 – 50 y The NHS 2 included all women within the life stage. After approximately 7 years, those with serum 25(OH)D concentrations of 80.5 nmol/L or less were about 50 to 60 percent more likely to develop hypertension.
-
51 – 70 y HPFS and NHS included participants mostly within this life stage. In men and women, the study found higher incidence of hypertension at 4 years followup in those with serum 25(OH)D concentrations less than 37.5 nmol/L; at 8 years, the association was significant only for men.
-
≥71 y A minority of the men and few of the women appear to have been in this life stage. No unique conclusions are possible for this life stage separate from those for people 51 to 70 years.
-
Postmenopause The majority of the women in NHS were postmenopausal. A significant association between serum 25(OH)D concentrations less than 37.5 nmol/L and increased hypertension was found at 4 years, but not 8 years followup.
-
Pregnant & lactating women Not reviewed
Table 40. Vitamin D and hypertension: Characteristics of cohort studies
|
Author Year Study Name Location (Latitude) [PMID] |
Population |
Vitamin D Concentration |
Comparisons |
Confounders/Effect Modifiers Adjusted |
Comments |
|||||||
|
Nutrients |
Demograph |
Anthrop |
Medical |
UV exposure |
Lifestyle |
|||||||
|
Forman 200794 HPFS, NHS US (various) [17372031] |
• Health status |
Any |
• Assay method |
RIA |
Hypertension incidence stratified by 25(OH)D categories (2 and 3 categories) |
|
X |
X |
|
|
X |
|
|
• Mean age (SD), y |
Men 65 (8) Women 57 (7) |
|
|
|
|
|
|
|
|
|
||
|
• Male (%) |
34 |
• Season blood drawn |
All |
|
|
|
|
|
|
|
||
|
Forman 200895 NHS 2 US (various) [18838623] |
• Health status |
No HTN, CVD, DM, obesity, cancer |
• Assay method |
EIA |
Hypertension incidence stratified by 25(OH)D categories (2 and 3 categories) |
X |
X |
X |
|
X |
||
|
• Mean age (SD), y |
43 (40-46) |
|
|
|
|
|
|
|
|
|
||
|
• Male (%) |
0 |
• Season blood drawn |
All |
|
|
|
|
|
|
|
||
Table 41. Vitamin D and hypertension: Results of cohort and nested case control studies
|
Author Year Study Name [PMID] |
Mean (SD) Age, Sex |
Outcome (n/N; Incidence) |
Followup Duration |
Vit D Measure |
Concentration, nmol/L |
No. of Cases |
No. in Category |
Adjusted OR |
95% CI |
P for Trend |
Study Quality |
|
Men |
|||||||||||
|
Forman 200794 HPFS [17372031] |
65 (8), Men |
Hypertension (61/613; 0.100) |
4 y |
25(OH)D |
<37.5 |
6 |
33 |
6.13 |
1.00, 37.8* |
nd |
B |
|
|
|
|
|
|
37.5-75 |
33 |
247 |
1.12 |
0.51, 2.48 |
|
|
|
|
|
|
|
|
≥75 |
22 |
233 |
1 |
Reference |
|
|
|
|
|
|
|
|
<37.5 |
6 |
33 |
5.68 |
1.01, 32.3* |
<0.05 |
|
|
|
|
|
|
|
≥37.5 |
55 |
580 |
1 |
Reference |
|
|
|
|
|
Hypertension (131/613; 0.214) |
8 y |
25(OH)D |
<37.5 |
9 |
33 |
3.53 |
1.02, 12.3* |
nd |
|
|
|
|
|
|
|
37.5-75 |
nd |
247 |
nd |
nd |
|
|
|
|
|
|
|
|
≥75 |
nd |
233 |
1 |
Reference |
|
|
|
|
|
|
|
|
<37.5 |
9 |
33 |
3.03 |
0.94, 9.76 |
NS |
|
|
|
|
|
|
|
≥37.5 |
124 |
580 |
1 |
Reference |
|
|
|
Women |
|||||||||||
|
Forman 200895 NHS 2 [18838623] |
43 (40-46, range), Women |
Hypertension (742 cases; 742 controls) Nested case control |
~7 y |
25(OH)D |
41.75 (15.5-52.5) |
208 |
371 |
1.66 |
1.11, 2.48 |
0.01 |
B |
|
|
|
|
|
|
59.5 (52.75-66.25) |
188 |
370 |
1.55 |
1.07, 2.23 |
|
|
|
|
|
|
|
|
73.0 (66.5-80.5) |
195 |
374 |
1.52 |
1.06, 2.18 |
|
|
|
|
|
|
|
|
94.75 (80.75-224) |
151 |
369 |
1 |
Reference |
|
|
|
Forman 200794 NHS [17372031] |
57 (7), Women |
Hypertension (129/1198; 0.108) |
4 y |
25(OH)D |
<37.5 |
11 |
ndA |
2.67 |
1.05, 6.79* |
nd |
B |
|
|
|
|
|
|
37.5-75 |
60 |
nd |
0.85 |
0.53, 1.34 |
|
|
|
|
|
|
|
|
≥75 |
58 |
nd |
1 |
Reference |
|
|
|
|
|
|
|
|
<37.5 |
11 |
nd |
2.98 |
1.24, 7.20* |
<0.05 |
|
|
|
|
|
|
|
≥37.5 |
118 |
nd |
1 |
Reference |
|
|
|
|
|
Hypertension (274/613; 0.229) |
8 y |
25(OH)D |
<37.5 |
20 |
ndA |
170 |
0.92, 3.16 |
nd |
|
|
|
|
|
|
|
37.5-75 |
nd |
nd |
nd |
nd |
|
|
|
|
|
|
|
|
≥75 |
nd |
nd |
1 |
Reference |
|
|
|
|
|
|
|
|
<37.5 |
20 |
nd |
1.42 |
0.79, 2.56 |
NS |
|
|
|
|
|
|
|
≥37.5 |
254 |
nd |
1 |
Reference |
|
|
|
* Statistically significant (P<0.05) A Due to formatting error in study table, no data on numbers of women in each category. |
|||||||||||
Vitamin D and blood pressure
Synopsis
No qualified systematic reviews have evaluated the association between vitamin D intake or serum 25(OH)D concentrations and changes in blood pressure. No cohort studies evaluated serum vitamin D concentrations and blood pressure. Three trials from Germany, UK, and India compared different doses of vitamin D (800 IU daily, a single dose of 100,000 IU, or 120,000 IU every 2 weeks) with placebo, with or without supplemental calcium in both groups. The study participants also varied: either older men, older men and women, or men mostly in their 40s. Both recruited older adults (over 63 or 70 years). All trials reported no significant effect on diastolic blood pressure. The A quality British study of a single dose of vitamin D 100,000 IU found no difference in systolic blood pressure after 5 weeks. The B quality German study found a significant net reduction of 7 mm Hg after 8 weeks in older women taking vitamin D 800 IU daily. The B quality Indian study of obese men mostly in their 40s, found a nearly significant net increase of 4 mm Hg after 6 weeks of vitamin D 120,000 IU every 2 weeks. No long term data were available.
Detailed presentation (Tables 42 & 43)
The A quality trial of single-dose vitamin D, performed in Cambridge, UK, recruited older adults (63 to 76 years, mean 70 years) who were not taking antihypertensive medications.96 During the winter, they were given either a one-time dose of vitamin D3 (100,000 IU [2.5 mg]) or placebo, and blood pressure was rechecked at 5weeks. In both study arms, systolic and diastolic blood pressures fell by equal amounts, resulting in no net difference between vitamin D supplemented and placebo groups. No subgroup analyses were reported.
The German B quality trial of supplementation with combined vitamin D and calcium versus calcium alone recruited older women (70 to 86 years) without severe hypertension.97 For 8 weeks, the women took either vitamin D3 800 IU and calcium carbonate 1200 mg or calcium carbonate 1200 mg alone daily. Systolic blood pressure decreased by 13 mm Hg in those supplemented with vitamin D and calcium compared with a 6 mm Hg decrease in those taking calcium alone (P=0.02). Diastolic blood pressure declined by 7 mm Hg in both groups. No subgroup analyses were reported. The study was limited by inadequate reporting of its study methods and lack of blinding.
The Indian B quality study compared every other week vitamin D3 supplementation 120,000 IU with placebo for 3 weeks in generally healthy but obese men without hypertension.51 The men who received the vitamin D supplements had a net increase in systolic blood pressure of 4 mm Hg, which was close to statistically significant (P=0.06), but no significant difference in diastolic blood pressure. The study was limited by a high dropout rate (26 percent).
Findings per intake level
No conclusions can be reached about an intake level threshold. In individual trials, a single dose of 100,000 IU of cholecalciferol had no significant effect on systolic and diastolic blood pressure after 5 weeks, a daily dose of vitamin D3 800 IU together with calcium significantly lowered systolic blood pressure more than calcium alone, but every other week vitamin D3 120,000 IU resulted in a nearly statistically significant increase in systolic blood pressure.
Findings per age and sex
No conclusions can be reached about differences in effect based on age or sex. The study of older women found a significant decrease in systolic blood pressure with relatively low dose vitamin D, a higher dose study of similarly aged men and women found no effect on blood pressure, and the highest dose study of men mostly in their 40s found an increase in systolic blood pressure.
Findings by life stage
-
0 – 6 mo Not reviewed
-
7 mo – 2 y Not reviewed
-
3 – 8 y Not reviewed
-
9 – 18 y Not reviewed
-
19 – 50 y A single study of men in this life stage found a near significant increase in systolic blood pressure with vitamin D and no effect on diastolic blood pressure.
-
51 – 70 y One trial included people with an average age of 70 years, implying that about half were within this life stage. No significant effect on blood pressure was found of a single large dose of vitamin D.
-
≥71 y Both trials included people within this life stage. The trial of people with an average age of 70 years found no significant effect of a single large dose of vitamin D. The single trial of women over age 70 years found a significant benefit for systolic blood pressure for vitamin D3 800 IU and calcium carbonate 1200 mg compared with calcium carbonate 1200 mg alone.
-
Postmenopause The women in both trials were postmenopausal. See the ≥71 y life stage.
-
Pregnant & lactating women Not reviewed
Table 42. Vitamin D and blood pressure: Characteristics of RCTs
|
Author Year Study Name Location (Latitude) [PMID] |
Population |
Background Calcium Intake & Vitamin D Data |
Comparisons |
Compliance |
Comments |
|
|
Scragg 199596 Cambridge, UK (52°N) [7498100] |
• Health status |
No HTN |
25(OH)D: 34.5 nmol/L (treatment group), 32.25 nmol/L (control group) |
Vit D3 100,000 IU (2.5 mg) one-time dose vs. Placebo |
nd |
Complete trial performed in winter |
|
• Mean age (range), y |
70 (63-76) |
|
||||
|
|
• Male (%) |
46% |
|
|
|
|
|
Pfeifer 200197 Lower Saxony, Germany (52°N) [11297596] |
• Health status |
Healthy, low Vit D |
25(OH)D < 50 nmol/L |
Vit D3 + Ca supplement vs. Ca supplement |
95±12% for the Ca tablets and 96±10% for the Vit D3 + Ca tablets (pill counting) |
|
|
• Mean age (range), y |
75 (70-86) |
|
|
|||
|
|
• Male (%) |
0 |
|
|
|
|
|
Nagpal 200951 New Delhi, India (28.5°N) [19125756] |
• Health status |
Healthy, obese |
25(OH)D: 36.5 nmol/L (treatment group), 30.0 nmol/L (control group) |
Vit D3 120,000 IU every 2 weeks vs. Placebo |
100% (implied); supervised home visits |
Excluded subjects who refused subsequent blood draws |
|
• Mean age (SD), y |
44 (8) |
|||||
|
• Male (%) |
100% |
|
|
|
||
Table 43. Vitamin D and blood pressure: Results of RCTs
|
Author Year Study Name [PMID] |
Age Range, Sex |
Outcome |
1°/2° |
Mean Followup |
Interventions, Daily Dose |
No. Analyzed |
Unit |
Baseline |
Change |
Change 95% CI |
Net Diff |
Net Diff 95% CI |
P Btw |
Study Quality |
|
SYSTOLIC BLOOD PRESSURE |
||||||||||||||
|
Scragg 199596 UK [7498100] |
63-76 y, Both |
SBP |
1° |
5 wk |
Vit D3 100,000 IU (2.5 mg), 1 dose |
95 |
mm Hg |
149 |
−5 |
−14.4, 4.4A |
0 |
−4.2, 4.2A |
0.81 |
A |
|
|
|
|
|
Placebo |
94 |
|
147 |
−5 |
−17.9, 7.9A |
|
|
|
|
|
|
Pfeifer 200197 Germany [11297596] |
70-86 y, Women |
SBP |
1° |
8 wk |
Vit D3 800 IU +Ca carbonate 1200 mg |
73 |
mm Hg |
144.1 |
−13.1 |
nd |
−7.4 |
−13.6, −1.2A |
0.02 |
B |
|
Ca carbonate 1200 mg |
72 |
|
140.6 |
−5.7 |
nd |
|
|
|
|
|||||
|
Nagpal 200951 New Delhi, India [19125756] |
44 (8, SD) Men |
SBP |
2° |
6 wk |
Vit D3 120,000 IU every 2 wk |
35 |
mm Hg |
124 |
+0.6 |
−2.7, 3.9 |
+4.0 |
−0.02, 8.0 |
0.06 |
B |
|
Placebo |
36 |
|
124 |
−3.4 |
−5.8, −1.0 |
|
|
|
|
|||||
|
DIASTOLIC BLOOD PRESSURE |
||||||||||||||
|
Scragg 199596 UK [7498100] |
63-76 y, Both |
DBP |
1° |
5 wk |
Vit D3 100,000 IU (2.5 mg), 1 dose |
95 |
mm Hg |
82 |
−1 |
−6.8, 4.8A |
0 |
−2.8, 2.8A |
0.92 |
A |
|
|
|
|
|
Placebo |
94 |
|
82 |
−1 |
−6.8, 4.8A |
|
|
|
|
|
|
Pfeifer 200197 Germany [11297596] |
70-86 y, Women |
SBP |
1° |
8 wk |
Vit D3 800 IU +Ca carbonate 1200 mg |
73 |
mm Hg |
84.7 |
−7.2 |
nd |
−0.3 |
−0.7, −0.1A |
0.10 |
B |
|
|
|
|
|
Ca carbonate 1200 mg |
72 |
|
82.6 |
6.9 |
nd |
|
|
|
|
|
|
Nagpal 200951 New Delhi, India [19125756] |
44 (8, SD) Men |
SBP |
2° |
6 wk |
Vit D3 120,000 IU every 2 wk |
35 |
mm Hg |
78 |
+0.4 |
−2.1, 3.0 |
+1.7 |
−1.5, 4.9 |
0.31 |
B |
|
Placebo |
36 |
77 |
−1.3 |
−3.2, 0.7 |
||||||||||
|
A Estimated from available data |
||||||||||||||
Vitamin D and bone mineral density or bone mineral content
For bone health outcomes (e.g., bone mineral density, fracture, fall or muscle strength), we relied on a recent comprehensive systematic review performed by the Ottawa EPC (Table 28).6 Because the Ottawa’s EPC report did not have separate analyses on the effect of vitamin D supplementation alone, the results for the effect of vitamin D alone or in combination with calcium supplementation are presented in “Combined vitamin D and Calcium” section.
The Ottawa EPC report was updated with literature published between January 2006 and September 2008, selected according to our eligibility criteria. For adults, we included only bone mineral density (BMD) indices. For children, we included only bone mineral content (BMC) indices. Only RCTs with duration more than 1 year qualified for inclusion.
Synopsis
The Ottawa EPC report concluded that observational studies suggested a correlation between higher serum 25(OH)D concentrations and larger values of BMC indices for older children and adolescents (6 months through 18 years old). Furthermore, Based on results of the observational studies, there is fair evidence to support an association between serum 25(OH)D and BMD or changes in BMD at the femoral neck in postmenopausal women and elderly men. However, there was discordance between the results from RCTs and the majority of observational studies.6 Three new RCTs identify from our updated search all showed no significant effects of vitamin D supplementation on BMC or BMD in children or adults, respectively.
Our updated search did not identify any new RCTs examining the effect of vitamin D on BMD and related outcomes in pregnant or lactating women.
Detailed presentation (Tables 44 & 45)
Ottawa EPC Report: Bone mineral content - Infants (0 through 12 months)
Overall, there is inconsistent evidence for an association between a specific serum 25(OH)D concentration and the bone health outcome BMC in infants. Of the two RCTs examining BMC, one demonstrated no significant benefit of higher serum 25(OH)D concentrations on radial bone mass while the other showed a transient increase of BMC compared to the unsupplemented group at 12 weeks but not 26 weeks. Of the three case-control studies, whole body BMC was positively related and lumbar spine negatively related to serum 25(OH)D concentrations.
Ottawa EPC Report: Bone mineral content or density - Older children (6 months through before puberty) and adolescents (the onset of puberty through 18 years)
Overall, there was fair evidence of an association between 25(OH)D concentrations and baseline BMD and change in BMD or BMC indices from the studies in older children and adolescents. However, the results from two RCTs of vitamin D supplementation have not confirmed a consistent benefit on BMD or BMC across sites and age groups.
There were seven studies in older children and adolescents (two RCTs, three cohorts, one case-control and one before-after study) that evaluated the relationship between serum 25(OH)D concentrations and BMC or BMD. In older children, there was one RCT, one prospective cohort and one before-after study. One RCT did not find an association between serum 25(OH)D concentrations and distal radial BMC. Two of three studies found a positive association between baseline serum 25(OH)D concentrations and BMC or BMD. The effect of bone size and muscle mass on these outcomes in relation to baseline serum 25(OH)D concentrations was not reported. One RCT demonstrated a significant relation between baseline serum 25(OH)D concentrations
and baseline BMD of the lumbar spine, femoral neck and radius. However, only high dose supplementation with 14,000 IU/wk of vitamin D3 increased BMC of the total hip.
Ottawa EPC Report: Bone mineral density – Postmenopausal women and elderly men
Overall, there was discordance between the results from RCTs and the majority of observational studies that may be due to the limitations of observational studies to control for all relevant confounders. Five RCTs, and three cohort studies did not find an association between serum 25(OH)D concentrations and BMD or bone loss. Four cohort studies found a significant association between 25(OH)D concentrations and bone loss, which was most evident at the hip sites but the evidence for an association between 25(OH)D concentrations and lumbar spine BMD was weak. Six case-control studies suggested an association between 25(OH)D concentrations and BMD and the association was most consistent at the femoral neck BMD.
Based on the results from the observational studies, there is fair evidence to support an association between serum 25(OH)D and BMD or changes in BMD at the femoral neck. Specific circulating concentrations of 25(OH)D below which bone loss at the hip was increased ranged from 30-80 nmol/L.
Ottawa EPC Report: Bone mineral density - pregnant or lactating women
One cohort study did not find an association between serum 25(OH)D concentrations and change in BMD that occurred during lactation. Limitations in the study design and sources of bias highlight the need for additional research on vitamin D status in pregnancy and lactation, and the association with bone health outcomes.
Additional studies published after the Ottawa EPC report
One A quality RCT compared the effect of vitamin D2 supplementation on hip BMC in 256 elderly women between 70 and 90 years of age.98 All elderly women in this trial had normal physical functioning. They were randomly assigned to receive either vitamin D2 (1000 IU/d) plus calcium (1200 mg/d) supplement or calcium (1200 mg/d) supplement alone for one year. The mean baseline dietary calcium intake was 1097 mg/d and mean 25(OH)D concentration was 44.3 nmol/L. Total hip BMD increased significantly in both groups, with no difference between the vitamin D2 plus calcium and calcium alone groups (hip BMD change: vitamin D, +0.5%; control, +0.2%).
One B quality RCT analyzed 89 and 83 healthy adult women and men separately.99 The participants were Pakistani immigrants living in the Copenhagen area of Denmark (latitude 55 N°). Women and men were randomly assigned to receive either daily dose of 400 IU or 800 IU vitamin D3, or placebo for one year. For women, the mean baseline dietary calcium intake was 495 mg/d and mean 25(OH)D concentration was 12 nmol/L. For men, the mean baseline dietary calcium intake was 548 mg/d and mean 25(OH)D concentration was 21 nmol/L. At the end of study, in both women and men, there were no significant differences in lumbar spine BMD changes between the two doses of vitamin D3 (400 IU/d or 800 IU/d) and the placebo groups.
Two RCTs, both rated C, compared the effect of vitamin D supplementation on BMC in healthy girls, aged between 10 and 17 years old.35,99 First RCT analyzed 26 healthy girls, who were Pakistani immigrants primarily living in the Copenhagen area Denmark (latitude 55 N°).99 Girls were randomly assigned to receive either daily dose 400 IU or 800 IU vitamin D3, or placebo for one year. The mean baseline dietary calcium intake was 510 mg/d and mean 25(OH)D concentration was 11 nmol/L. At the end of study, there were no significant differences in whole body BMC changes between the two doses of vitamin D3 (400 IU/d or 800 IU/d) and the placebo groups. Second RCT analyzed 168 healthy girls, living in the Greater
Beirut area, Lebanon (latitude 33°N).35 Girls were randomly assigned to receive either weekly oral vitamin D doses of 1400 IU (equivalent to 200 IU/d) or 14,000 IU (equivalent to 2000 IU/d) or placebo for one year. The mean baseline dietary calcium intake was 677 mg/d and mean 25(OH)D concentration was 35 nmol/L. At the end of study, there were no significant differences in whole body BMC changes between either low-dose vitamin D (200 IU/d) or high-dose vitamin D (2000 IU/d) and the placebo groups. The same findings were seen when analyses were restricted to either premenarchal or postmenarchal girls. Both RCTs were rated C because the results were not adjusted for important potential confounders, such as height, bone area, lean mass, sun exposure, and pubertal status.
Findings by life stage
-
0 – 6 mo The Ottawa EPC report concluded that there is inconsistent evidence for an association between a specific serum 25(OH)D concentration and the bone health outcome BMC in infants. There were no new data since the Ottawa report.
-
7 mo – 2 y The Ottawa EPC report concluded that there was fair evidence of an association between 25(OH)D concentrations and baseline BMD and change in BMD or BMC indices from the studies in older children and adolescents. There were no new data since the Ottawa report.
-
3 – 8 y The Ottawa EPC report concluded that there was fair evidence of an association between 25(OH)D concentrations and baseline BMD and change in BMD or BMC indices from the studies in older children and adolescents. There were no new data since the Ottawa report.
-
9 – 18 y The Ottawa EPC report concluded that there was fair evidence of an association between 25(OH)D concentrations and baseline BMD and change in BMD or BMC indices from the studies in older children and adolescents. Two new RCTs enrolled only girls in this life stage. The results showed no significant differences in whole body BMC changes between either lower doses of vitamin D (200 or 400 IU/d) or higher dose of vitamin D (800 or 2000 IU/d) and the placebo groups.
-
19 – 50 y The Ottawa EPC report concluded that there was discordance between the results from RCTs and the majority of observational studies in postmenopausal women and elderly men. Based on results of the observational studies, there is fair evidence to support an association between serum 25(OH)D and BMD or changes in BMD at the femoral neck. One new RCT enrolled primarily men and women in this life stage. The results showed that there were no significant differences in lumbar spine BMD changes between the two doses of vitamin D3 (400 IU/d or 800 IU/d) and the placebo groups.
-
51 – 70 y The Ottawa EPC report concluded that there was discordance between the results from RCTs and the majority of observational studies in postmenopausal women and elderly men. Based on results of the observational studies, there is fair evidence to support an association between serum 25(OH)D and BMD or changes in BMD at the femoral neck. One new RCT enrolled some men in this life stage. The results showed that there were no significant differences in lumbar spine BMD changes between the two doses of vitamin D3 (400 IU/dor 800 IU/d) and the placebo groups.
-
≥71 y The Ottawa EPC report concluded that there was discordance between the results from RCTs and the majority of observational studies in postmenopausal women and elderly men. Based on results of the observational studies, there is fair evidence to
-
support an association between serum 25(OH)D and BMD or changes in BMD at the femoral neck. One new RCT enrolled only elderly women in this life stage. The results showed that vitamin D2 supplementation (1000 IU/d) had no additional effect on hip BMD compared to calcium supplementation alone.
-
Postmenopause There were no new data since the Ottawa report.
-
Pregnant & lactating women There were no new data since the Ottawa report.
Table 44. Vitamin D and bone mineral density: Characteristics of RCTs published after the Ottawa EPC Report
|
Author Year Study Name Location (Latitude) [PMID] |
Population |
Background Calcium Intake & Vitamin D Data |
Comparisons |
Compliance |
Comments |
|
|
Zhu 200898 Perth, Australia (32 °S) [18410225] |
• Health status |
nd (based on the inclusion and exclusion criteria, assume subjects were not very healthy but normal physical functioning) |
25(OH)D: 44.3 nmol/L |
Vit D2 1000 IU/d + Ca citrate 1200 mg/d vs. Ca citrate 1200 mg/d |
86.7% and 86.8% in the vitamin D and the control groups (tablet counting) |
|
|
Ca: 1097 mg/d |
|
|||||
|
|
• Mean age (SD), y |
77 (4.5) |
|
|||
|
|
• Male (%) |
0 |
|
|
|
|
|
Andersen 200899 Copenhagen, Denmark (55 N°) [18208636] |
• Health status |
Healthy |
25(OH)D: Adolescent girls: 11 nmol/L Women: 12 nmol/L Men: 21 nmol/L |
Vit D3 400 IU/d, or Vit D3 800 IU/d vs. placebo |
The median compliance was 85 (range 43-100), 92 (42-115) and 93 (33-105)% for girls, women, and men, respectively (pill counting) |
Pakistani, living in Denmark. Compliance was lower for girls. |
|
• Mean age (range), y |
Adolescent girls: 12.2 (10.1-14.7) Women: 36.2 (18.1-52.7) Men: 38.3 (17.9-63.5) |
|||||
|
|
• Male (%) |
42 |
|
|
||
|
|
|
|
Ca: Adolescent girls: 510 mg/d Women: 495 mg/d Men: 548 mg/d |
|
|
|
|
El-Hajj 200635 Beirut, Lebanon (33°53′N) [16278262] |
• Health status |
Healthy |
25(OH)D: 34.9 nmol/L |
Weekly oral Vit D doses of 1400 IU (=Vit D 200 IU/d ) or 14,000 IU (Vit D 2000 IU/d) vs. placebo |
Placebo - 98%, Low dose group - 98%, High dose group - 97% (pill counting) |
|
|
• Mean age (range), y |
13.2 (10-17) |
|
|
|||
|
|
Ca: 677 mg/d |
|
||||
|
|
• Male (%) |
0 |
|
|
||
Table 45. Vitamin D and bone mineral density or bone mineral contents: Results of RCTs published after the Ottawa EPC report
|
Author Year Study Name Location (Latitude) (PMID] |
Life Stage |
Outcome |
1°/2° |
Mean Followup, mo |
Interventions, Daily Dose |
No. Analyzed |
Unit |
Baseline |
Change |
Change 95% CI |
Net Diff |
Net Diff 95% CI |
P Btw |
Study Quality |
|
Zhu 200898 Perth, Australia (32 °S) [18410225] |
71+ Women only |
Hip BMD |
1° |
12 |
Vit D2 1000 IU + Ca citrate 1200 mg |
123 |
mg/cm2 |
851 |
0.5% |
−0.09, 1.09 |
0.3% |
nd |
NS |
A |
|
|
|
|
|
Ca citrate 1200 mg |
133 |
|
826 |
0.2% |
−0.19, 0.59 |
|
|
|
|
|
|
Andersen 200899 Copenhagen, Denmark (55 N°) [18208636] |
18-53, Women only |
Lumbar spine BMD |
1° |
12 |
Vit D3 400 |
30/21A |
mg/cm2 |
1.06 |
0% |
nd |
−1% |
nd |
NS |
B |
|
|
|
Vit D3 800 |
30/21 |
|
0.98 |
1% |
nd |
0% |
nd |
NS |
|
|||
|
|
|
|
|
Placebo |
29/18 |
|
0.99 |
1% |
nd |
|
|
|
|
|
|
Andersen 200899 Copenhagen, Denmark (55 N°) [18208636] |
18-64, Men only |
Lumbar spine BMD |
1° |
12 |
Vit D3 400 |
25/19A |
mg/cm2 |
1.03 |
2% |
nd |
0% |
nd |
NS |
B |
|
|
|
Vit D3 800 |
31/26 |
|
0.92 |
7% |
nd |
5% |
nd |
NS |
|
|||
|
|
|
|
|
Placebo |
27/19 |
|
1.03 |
2% |
nd |
|
|
|
|
|
|
Andersen 200899 Copenhagen, Denmark (55 N°) [18208636] |
10-15 y girls |
BMC |
1° |
12 |
Vit D3 400 |
9/7A |
kg |
1.3 |
22% |
nd |
7% |
nd |
NS |
CB |
|
|
|
|
|
Vit D3 800 |
9/7 |
|
1.5 |
10% |
nd |
−5% |
nd |
NS |
|
|
|
|
|
|
|
Placebo |
8/7 |
|
1.7 |
15% |
nd |
|
|
|
|
|
|
El-Hajj 200635 Beirut, Lebanon (33°N) [16278262] |
10-17 y girls |
BMC |
1° |
12 |
Vit D 2000 IU |
55 |
kg |
1.2 |
6.2% |
4.7, 7.7 |
0.1% |
−1.1, 2.0C |
NS |
C |
|
|
|
|
|
Vit D 200 IU |
58 |
|
1.1 |
6.1% |
4.6, 7.6 |
1.1% |
−0.8, 3.2C |
NS |
|
|
|
|
|
|
|
Placebo |
55 |
|
1.1 |
5.0% |
3.8, 6.2 |
|
|
|
|
|
|
|
Subgroup–Premenarchal girls, mean age 10 y |
BMC |
1° |
12 |
Vit D 2000 IU |
14 |
kg |
0.8 |
11.6% |
9.4, 13.8 |
4.2% |
0.7, 7.7C |
NS |
|
|
|
|
|
|
Vit D 200 IU |
12 |
|
0.7 |
11.4% |
9.1, 13.7 |
4.0% |
0.5, 7.5C |
NS |
|
|
|
|
|
|
|
|
Placebo |
8 |
|
0.8 |
7.4% |
4.7, 10.1 |
|
|
|
|
|
A Baseline/final sample size B Downgraded to C because very small sample size (insufficient power) and no adjustments for confounders C Estimated from available data |
||||||||||||||
Calcium and health outcomes
Calcium and growth
We reviewed systematic reviews and primary studies that evaluated relationships between calcium intake and growth parameters in infants and children.
Synopsis
One systematic review and three primary studies evaluated supplemental intake of calcium and growth parameters in infants and children. The systematic review with a meta-analysis of 17 RCTs did not find an effect on bodyweight and height gain attributable to calcium supplementation in children and adolescents (3 to 18 y) from developed and developing countries, compared to usual calcium intake of 280 to 1200 mg/d. Three additional primary studies reported similar findings. Overall, the studies reviewed did not find a relationship between supplemental calcium intake and growth parameters.
Detailed presentation (Tables 46, 47 & 48)
0 - 6 months; 3 - 8 years; 9 - 18 years; pregnant women
One systematic review of RCTs of supplemental calcium on bone related outcomes in children (age 3-18 y) also examined changes in height and weight at followup.100 The systematic review (comprised of studies in Australia, China, Gambia, Israel, Switzerland, and US) conducted a meta-analysis of 17 RCTs with a total of 2088 subjects and found no significant difference in body weight (weighted mean difference +0.14 kg (favors control)(95% CI −0.28, +0.57 kg)) and height gain (weighted mean difference +0.22 cm (favors control)(95% CI −0.30, +0.74 cm)) between those who were supplemented with calcium ranged from 300 to 1200 mg/d lasting from 0.7 to 4 years and those who were not supplemented and consuming usual calcium intake of 280 to 1200 mg/d. There was no significant statistical heterogeneity in the included studies. The majority of the supplement used was calcium carbonate. This systematic review met seven of 11 AMSTARi quality checklist items.
Two primary studies rated B in methodological quality and one primary study rated C provided additional information. One RCT from Denmark randomly assigned 110 girls (mean age 13 years) with either low (<713 mg/d) or medium (1000 to 1304 mg/d) habitual calcium intake to a supplement of calcium 500 mg/d (calcium carbonate) or placebo for 1 year.101 There was no significant difference in height or weight gain among the groups at followup. One post hoc analysis of an RCT in Nebraska on bone mass analyzed 59 girls (mean age 9.5 years) who were randomly assigned to either a calcium enriched diet, supplying at least 1500 mg of calcium per day (~1656 mg/d), or usual diet (961 mg/d).102 There was no significant difference in weight gain at 2 years followup. A cohort study in Washington DC analyzed dietary intake data from 322 pregnant African American women (mean age 21.6 years; 39% 16-19 years) and found that “none of the food energy and nutrient intakes [mean calcium intake 933 mg ± 52 (SE)] was significantly correlated with any of the pregnancy outcome measures”. No specific
quantitative relationship between calcium intake and infant birth weight or length was reported.103
Findings by life stage
-
0 – 6 mo A cohort study of dietary intake in 322 pregnant African American women found that calcium intake was not significantly correlated with any pregnancy outcome measures, including infant birth weight or length.
-
7 mo – 2 y No study covered this life stage.
-
3 – 8 y One meta-analysis of 17 RCTs in children and adolescents (ages 3-18 y) from developed and developing countries found no significant difference in weight and height gain between those who were supplemented with calcium ranged from 300 to 1200 mg/d lasting from 0.7 to 4 years and those who were not and consuming usual calcium intake of 280 to 1200 mg/d.
-
9 – 18 y In addition to the findings from the above meta-analysis, two primary studies provided additional information. One RCT of calcium 500 mg/d (calcium carbonate) versus placebo for 1 year found no significant difference in height or weight gain among the 110 girls (mean age 13 years) at followup. A post hoc analysis of an RCT of calcium enriched diet (~1656 mg/d) versus usual diet (~961 mg/d) on bone mass found no significant difference in weight gain at 2 years followup in 59 girls (mean age 9.5 years).
-
19 – 50 y Not reviewed
-
51 – 70 y Not reviewed
-
≥71 y Not reviewed
-
Postmenopause Not reviewed
-
Pregnant & lactating women See 0 – 6 month results.
Table 46. Summary of systematic review of calcium on growth in children
|
Author Year [PMID] |
Winzenberg 2007100 [17636098] |
|||
|
Design (Search Years) |
Randomized controlled trials (1966-2005) |
|||
|
Population |
Children <18 y |
|||
|
Intervention (Exposure) and Comparator |
Supplemental calcium 300-1200 mg/d vs. placebo |
|||
|
Results |
17 trials (2088 participants) Weighted mean difference: +0.14 (95% CI −0.28, +0.57) kg; favors control Weighted mean difference: +0.22 (95% CI −0.30, +0.74) cm; favors control |
|||
|
|
No significant statistical heterogeneity |
|||
|
Comments |
Post hoc analysis performed on trials identified for a meta-analysis of randomized controlled trials of calcium on bone outcomes |
|||
|
AMSTAR |
||||
|
A priori design? |
Yes |
Study quality assessment performed? |
Yes |
|
|
Two independent reviewers? |
Yes |
Study quality appropriately used in analysis? |
No |
|
|
Comprehensive literature search? |
Yes |
Appropriate statistical synthesis? |
Yes |
|
|
All publication types and languages included? |
No |
Publication bias assessed? |
Yes |
|
|
Included and excluded studies listed? |
No |
Conflicts of interest stated? |
No |
|
|
Study characteristics provided? |
Yes |
Unclear if all languages included; study quality assessed but Not factored into the M-A |
|
|
Table 47. Calcium and growth: Characteristics of primary studies
|
Author Year Study Name Location (Latitude) [PMID] |
Population |
Background Calcium Intake & Vitamin D Data |
Comparisons |
Confounders/Effect Modifiers Adjusted |
Comments |
||||||
|
Nutrients |
Demograph |
Anthrop |
Medical |
UV exposure |
Lifestyle |
||||||
|
Lorenzen 2006101 Denmark (55ºN) [16400044] |
• Health status |
no specific health issue reported |
88-item FFQ (no internal validation); dietary calcium: 957 mg/d; 25(OH)D: 34.5 nmol/L |
Ca CO3 (Ca 500 mg/d) × 1 y vs. placebo |
x |
x |
x |
|
|
|
RCT; Danish surnames only |
|
• Mean age (range/SD), y |
13 |
|
|
|
|
|
|
|
|
||
|
|
• Male (%) |
0 |
|
|
|
|
|
|
|
|
|
|
Lappe 2004102 Omaha, NE US (41ºN) [15354150] |
• Health status |
healthy |
3-d food record (no internal validation); dietary intake calcium: 819 mg/d; dietary vit D 180 IU/d (4.5 µg/d) |
Calcium rich diet (~1656 mg/d) vs. usual diet (~961 mg/d); wt & ht change at 2 y |
x |
x |
x |
|
|
x |
Post hoc of RCT on bone mass; 95% white, 5% black |
|
• Mean age (range/SD), y |
9.5 |
|
|
|
|
|
|
||||
|
• Male (%) |
0 |
|
|
|
|
|
|
||||
|
Johnson 1994103 Washington DC, US (38ºN) [8201444] |
• Health status |
pregnant; no DM, sickle, thalassemia, HbC disease |
FFQ (no internal validation); calcium 933.4 mg/d |
Relationship between maternal calcium intake and birth weight, height |
Cohort study; all African American; Total Ca (from food) |
||||||
|
• Mean age (range/SD), y |
22 (39% 16-19) |
|
|
|
|
|
|
||||
|
|
• Male (%) |
0 |
|
|
|
|
|
|
|
|
|
Table 48. Calcium and growth: Results of primary studies
|
Author Year Study Name PMID |
Life Stage |
Outcome |
1°/2° |
Mean Followup, Y |
Interventions, Ca daily Dose |
No. Analyzed |
Unit |
Baseline |
Change |
Change 95% CI |
Net Diff |
Net Diff 95% CI |
P Btw |
Study Quality |
|
RCT |
||||||||||||||
|
Lorenzen 2006101 (55ºN) [16400044] |
9-18 female |
wt in medium Ca intake group (1000-1304 mg/d) |
1º |
1 |
500 mg/d × 1 y |
30 |
kg |
51.8 |
5.1 |
1.7, 8.5A |
0.2 |
−4.4, 4.9A |
NS |
B |
|
Placebo |
30 |
kg |
50.7 |
4.9 |
1.8, 8.0A |
|
|
|
|
|||||
|
|
|
wt in low Ca intake group (<713 mg/d) |
1º |
1 |
500 mg/d × 1 y |
30 |
kg |
52.2 |
4.1 |
0.7, 7.5 |
1.1 |
−3.6, 5.8 |
NS |
|
|
|
Placebo |
30 |
kg |
49.5 |
3.0 |
−0.2, 6.2A |
|
|
|
|
||||
|
|
|
ht in medium Ca intake group (1000-1304 mg/d) |
1º |
1 |
500 mg/d × 1 y |
30 |
cm |
162.5 |
3.7 |
1.6, 5.8A |
−0.3 |
−3.3, 2.8A |
NS |
|
|
Placebo |
30 |
cm |
161.9 |
4.0 |
1.7, 6.3A |
|
|
|
|
|||||
|
|
|
ht in low Ca intake group (<713 mg/d) |
1º |
1 |
500 mg/d × 1 y |
30 |
cm |
159.6 |
3.6 |
1.1, 6.1A |
0.5 |
−3.3, 4.3A |
NS |
|
|
Placebo |
30 |
cm |
160.1 |
3.1 |
0.3, 5.9A |
|
|
|
|
|||||
|
Post hoc analysis of an RCT on bone outcomes |
||||||||||||||
|
Lappe 2004102 (41ºN) [15354150] |
9-18 female |
wt |
2º |
2 |
Ca enriched diet (~1656 mg) |
27 |
kg |
32.2 |
10.7 |
8.2, 13.2A |
−0.2 |
−4.1, 3.7A |
NS |
B |
|
Usual diet (~961 mg) |
32 |
kg |
33.2 |
10.9 |
7.9, 13.9A |
|||||||||
|
|
|
ht |
2º |
2 |
Ca enriched diet (~1656 mg) |
27 |
cm |
137 |
14 |
11.5, 16.5A |
1 |
−2, 4A |
NS |
|
|
Usual diet (~961 mg) |
32 |
cm |
138 |
13 |
11, 15A |
|||||||||
|
Cohort |
||||||||||||||
|
Johnson 1994103 (38ºN) [8201444] |
9-18 female; infant 0-6 mo |
birth wt & length |
1° |
until delivery |
322 African American women with a mean dietary calcium intake of 933 mg/d; “None of the food energy and nutrient intakes was significantly correlated with any of the pregnancy outcome measures”. No specific quantitative relationship between calcium intake and infant birth weight or length was reported. |
C |
||||||||
|
A Estimated from reported data |
||||||||||||||
Calcium and cardiovascular disease
Synopsis
No qualified systematic reviews evaluated the association between calcium intake and incidence of cardiovascular disease. No calcium intervention trials evaluated cardiovascular outcomes. Ten longitudinal cohort studies and one nested case-control study analyzed associations with various specific cardiovascular events. In all studies, baseline calcium intake, assessed by food frequency questionnaires, were analyzed as predictors of long-term cardiovascular outcomes. We point out where there were “suggestions” of associations in cases where P values were about 0.10 and/or there were consistent, though not statistically significant differences in risk compared to the lowest risk category of at least 20 percent.
Notably, the implied ranges of calcium intake within studied populations varied widely across studies. At one extreme, men and women in the Japan CC study had mean calcium intakes in the lowest quintile of 250 or 266 mg/day and in the highest quintile of 665 and 667 mg/day. The Japan PHC study and the Taiwanese CVD-FACTS study had similarly low calcium intake. The study with the highest calcium intake was the ATBC study of men in Finland. Median calcium intakes in the lowest and highest quintiles were 876 and 1916 mg/day, respectively; the overall median intake was 1379 mg/day.
Cardiovascular death was analyzed in two large studies analyzed, separately in men and women. Neither found a significant association between calcium intake and cardiovascular death after 9 or 28 years in either men or women.
Combined fatal and nonfatal cardiac events were analyzed in two large and one relatively small studies, in either both sexes together or just men. None found a significant association between calcium intake and cardiac events after 10 to 13 years.
Cardiac death was analyzed in three large and one relatively small studies, separately in men and women. Overall, no consistent significant association between calcium intake and cardiac death after 8, 9, 12, or 28 years of followup was found in the various studies, in either men or women. One study (the Iowa WHS) found a significant association between calcium intake of less than 696 mg/day and higher risk of ischemic heart disease death in white women aged 55 to 69 years.
Nonfatal myocardial infarction was analyzed by one large study of men. No significant association was found with calcium intake after 12 years of followup.
Total strokes were analyzed in five large and one relatively small studies, in both sexes combined, and separately for men and women. The studies had disparate findings. A Japanese and a Taiwanese study of men and women (40-59 y and ≥40 y, respectively) found progressively lower risks for stroke in people in higher quintiles of calcium intake after 13 and 11 years, respectively, in the setting of overall relatively low dietary calcium intake. A small Finnish study of both men and women (65-99 y) found no significant association after 10 years. The two studies of men (40 to 75 years old) found suggestions of associations (not statistically significant), though with trends in opposite directions; one suggested the highest risk for stroke in men with calcium intake below approximately 750 mg/day after 8 years; one suggested the highest risk for cerebral infarctions in men with calcium intake above about 1000 mg/day after 14 years. The study of women (32-57 y) found a nonsignificant trend after 14 years, but significantly higher stroke risk in those with calcium intake less than about 500 mg/day compared with women in the next two higher quintiles of calcium intake.
Fatal strokes were analyzed in one large cohort study and a nested case-control study, separately in men and women. None found a significant association between calcium intake and cardiac events after 10 to 13 years of followup.
Detailed presentation (Tables 49 & 50, Figures 11 & 12)
Cardiovascular death
Two longitudinal cohort studies analyzed risk of cardiovascular death (death from cardiac or cerebrovascular events), separately in men and women, according to quintiles.
In the Japan Collaborative Cohort (Japan CC),104 about 23,000 men aged 40 to 79 years without a history of cardiovascular disease were followed for 8.9 years; 3 percent died of a cardiovascular event. Men within the calcium quintiles had mean calcium intakes that ranged from 250 to 665 mg/day. No significant association was found between calcium quintile and cardiovascular death risk. In a study of Dutch civil servants (and spouses),105 1340 men aged 40 to 65 years (regardless of cardiovascular history) were followed for 28 years. About 27 percent (age-adjusted) had a cardiovascular death. The calcium intake quintiles ranged from less than 585 mg/day to more than 1245 mg/day. No significant associations were found between calcium intake and risk of cardiovascular death; however, men in the lowest quintile (≤585 mg/day) had an adjusted odds ratio of cardiovascular death of 1.3 (95% CI 0.8, 1.9) compared to those in the highest quintile. Both studies had methodological quality B. The Japanese study did not define cardiovascular mortality and the Dutch study did not report a complete analysis of the calcium intake quintiles.
In the Japan CC, about 35,600 women aged 40 to 79 years without a history of cardiovascular disease were followed for 8.9 years; 1.8 percent died of a cardiovascular event. Women within the calcium quintiles had mean calcium intakes that ranged from 266 to 667 mg/day. No significant trend across quintiles or associations among quintiles was found for risk of cardiovascular death. However, women in the lowest quintile had about 25to 30 percent lower risks of cardiovascular death than women in the next two higher quintiles. In the Dutch civil servants study, 1265 women were followed for 28 years. About 14 percent had a cardiovascular death. The calcium intake quintiles ranged from less than 445 mg/day to more than 850 mg/day. No significant associations were found between calcium intake and risk of cardiovascular death.
Cardiac events, total
Three longitudinal cohort studies analyzed combined fatal and nonfatal cardiac events, including coronary heart disease, acute myocardial infarction, and ischemic heart disease; two combined both sexes, one included only men.
In the Japan Public Health Center (Japan PHC) study (methodological quality A),106 about 41,500 people aged 40 to 59 years, without cardiovascular disease, were followed for 13 years; 0.8 percent had cardiac events. People within the calcium intake quintiles had median calcium intakes that ranged from 233 to 753 mg/day. No association was found between calcium intake and risk of coronary heart disease events. In a small Finnish longitudinal study,48 755 people aged 65 to 99 years, regardless of cardiovascular history were followed for 10 years; 17 percent had a cardiac event. No significant association was found between tertiles of calcium intake and all acute myocardial infarctions. This methodological quality C study did not report relevant data including information on the calcium intake within the tertiles.
In the Health Professionals Follow-up Study (HPFS),107 about 39,000 men with a mean age of 54 years, without cardiovascular disease were followed for 12 years; 3.7 percent had an
ischemic heart disease event. The study was of methodological quality A. Men within the calcium quintiles had mean calcium intakes that ranged from 523 to 1377 mg/day. No significant association was found between calcium intake and risk of cardiac events.
Cardiac death
Four longitudinal cohort studies analyzed death from cardiac events, separately in men (3 studies) and women (3 studies).
In the three studies of men, all found no significant association between calcium intake and cardiac death. All three studies are described above. In HPFS 1.1% of men died of a cardiac event during 12 years of followup.107 In the Japan CC study 0.6% of men died of a cardiac event during 9 years of followup (methodological quality A for this outcome).104 In the Dutch civil servants study about 15 percent (age adjusted) died of a cardiac event during 28 years of followup.105
Three studies analyzed cardiac death in women. In two studies, both described above, there was no significant association between calcium intake and cardiac death. In the Japan CC study 0.3 percent of women died of a cardiac event during 9 years of followup.104 In the Dutch civil servants study about 6 percent (age-adjusted) died of a cardiac event during 28 years of followup.105 The Iowa Women’s Health Study (Iowa WHS) analyzed about 34,500 white women, aged 55 to 69 years, without ischemic heart disease. During 8 years of followup, 1.1% died of a cardiac event. However, the study was of methodological quality B for this outcome because the outcome was not fully ascertained. The calcium intake quartiles ranged from less than 696 mg/day to more than 1425 mg/day. There was a suggestion of an association between lower calcium intake and higher risk of cardiac death, with a P value of 0.09 for the trend across quartiles and statistically significant adjusted relative risks of cardiac death for women with calcium intakes above 696 mg/day of 0.62 to 0.75 (compared to the lowest quartile).
Cardiac events, nonfatal
Only the HPFS, described above, analyzed nonfatal cardiac events (methodological quality A).107 During 12 years of followup 2.6 percent of almost 40,000 men had nonfatal myocardial infarctions. No significant association was found between calcium intake and nonfatal cardiac events.
Stroke, total
Six longitudinal cohort studies analyzed combined fatal and nonfatal strokes, in either both sexes combined, or men and women separately.
In the Japan PHC study, described above (cardiac events, total), 3 percent of people suffered strokes during 13 years of followup (methodological quality A).106 The study found a significant association between baseline calcium intake and risk of stroke. The risk of stroke was progressively lower in progressively higher quintiles of calcium intake. People with a median calcium intake of 439 mg/day (middle quintile) had a statistically significant adjusted hazard ratio (HR) of 0.79 compared to those with a median calcium intake of 233 mg/day. Those in higher quintiles had lower HRs; across quintiles, the trend had a P value of 0.02. As is evident from the median calcium intake levels within the quintiles, the middle-aged Japanese in this study had considerably lower average calcium intake than in most other studies (particularly those performed in the US). Compared to similar studies evaluated here, the calcium intake was approximately half of that in the HPFS or Iowa WHS. The CVD-FACTS study, performed in men and women at least 40 years old in Taiwan, evaluated ischemic strokes.108 After a mean followup of 10.6 years, 7.4 percent of the cohort had an ischemic stroke. The B quality study
divided the cohort into tertiles. Similar to the Japanese study, the typical calcium intake was relatively low by Western standards (the average dietary calcium intake was approximately 520 mg/day). Those in the lower two tertiles had about a 50 percent increased risk of ischemic stroke than those in the highest tertile (>591 mg/day). While the adjusted OR for each tertile were not quite statistically significant (1.52 [95% CI 0.98-2.35] for lowest tertile; 1.49 [95% CI 0.99-2.24] for middle tertile; compared to highest tertile), the trend across tertiles had a P value of 0.03. The third study of combined men and women, of older Finns (described above under Cardiac events, total), found no significant association with stroke among 755 people followed for 10 years (stroke incidence 9.3%; methodological quality C).48
Both studies of men alone suggest trends across quintiles of calcium intake and stroke risk; however, the associations were in opposite directions. The HPFS, described above (cardiac events, total; methodological quality A) had a stroke incidence of 0.75 percent during 8 years of followup. Men in higher quintiles of calcium intake had generally lower adjusted relative risks (RR) of stroke compared to the lowest quintile (median calcium intake 500 mg/day); though none of the RRs was statistically significant and the P value for the trend across quintiles was 0.10. Notably, the RR of stroke for men in the middle quintile (median calcium intake 800 mg/day) was 0.72 (95% CI 0.50, 1.03); though the RRs for men in higher quintiles were closer to 1 with wider 95 percent confidence intervals. In the Alpha-Tocopherol, Beta-Carotene Cancer Prevention (ATBC) Study, performed in southern Finland, about 26,500 men aged 50 to 69 years without a history of stroke were followed for almost 14 years; 10 percent suffered a stroke. The study was of methodological quality C because there was large misclassification of stroke outcomes in a sample of subjects (5-21%). Men in the lowest quintile of calcium intake (median 876 mg/day) had the lowest adjusted RR for cerebral infarction. Men in all higher quintiles (medians ranging from 1178 to 1916 mg/day) all had RR of about 1.10 that were near statistical significance (e.g., 95% CI for highest quartile was 0.98, 1.26). The P value of the trend of association across quintiles was 0.09.
One study evaluated total strokes in women alone. The Nurses Health Study (NHS) evaluated about 86,000 women aged 32 to 57 years with no history of cardiovascular disease. The study was rated methodological quality A. During 14 years of followup 0.8 percent of women suffered a stroke. The women in the four quintiles above the lowest quintile (who had a median calcium intake of 395 mg/day) all had similar adjusted RR of stroke (0.71-0.87); the RRs of those women in the second and third quintiles were statistically significant. However, the trend of associations across quintiles was not statistically significant.
Stroke death
One longitudinal cohort study (with subanalyses in men and women separately) and one nested case-control study (in men) evaluated fatal strokes.
Both studies of men found no significant association between calcium intake and risk of stroke death. In the Japan CC study (described above, methodological quality A for this outcome) 1.4 percent of men died of stroke during 9 years of followup. The second study was a nested case-control study performed in China. In a prospective cohort of about 18,000 men aged 45 to 64 years, regardless of cardiovascular history, 245 died of stroke (1.3%) during 12 years of followup. These cases were matched with 1225 controls. The remaining 17,000 men were omitted from the analysis. The study also did not report data on the calcium intake within the tertiles. The methodological quality was C.
In the Japan CC study, 0.9 percent of women died of stroke. The study also found no consistent association between calcium intake and stroke death.
Findings per calcium intake level
Among the outcomes for which studies had either statistically significant associations or suggestions of associations between calcium intake and cardiovascular events, the following findings of calcium intake level were reported.
Regarding the risk of overall cardiovascular mortality, one of two studies in women (Japan CC) found a suggestion that higher calcium intake may be associated with increased risk of cardiovascular death. The association can be seen for quintiles 2 to 4, where women in the lowest quintile had a median calcium intake of 266 mg/day and those in the second quintile had a median calcium intake of 379 mg/day.
Regarding the risk of cardiac mortality, one of three studies in women (Iowa WHS) found that women in the lowest quartile of calcium intake, below 696 mg/day, had the highest risk of cardiac mortality.
Regarding the risk of stroke, among studies of both sexes combined, two (Japan PHC and the Taiwanese CVD-FACTS) of three studies found a statistically significant association between lower calcium intake and higher risk of stroke. In Japan PHC, those in the third to fifth quintiles, with median calcium intakes of 439 mg/day or higher, had lower risks than those in the lowest quintile. Those in the second quintile had a median calcium intake of 344 mg/day and those in the lowest quintile 233 mg/day. In CVD-FACTS, those in the two tertiles with calcium intake below 591 mg/day had about a 50 percent increased risk of stroke compared to those with higher calcium intake. The two studies restricted to men had opposite findings. The HPFS found lower risks of stroke among men in the third to fifth quintiles of calcium intake (median 800 mg/day or higher) compared to the lowest quintile (median 500 mg/day). Those in the second quintile had a median calcium intake of 700 mg/day. In contrast, the ATBC study in Finland found somewhat higher risks of stroke (RR~1.1) in all quintiles above the lowest quintile. The median calcium intakes in the first and second quintiles were 876 and 1178 mg/day, respectively. The one study of women (NHS) had lower risks of stroke in all quintiles above the lowest quintile. The median calcium intakes in the first and second quintiles were 395 and 645 mg/day, respectively.
Findings per age and sex
The majority of studies (and the large majority of individuals) included mostly people between the ages of about 40 and 70 years. The youngest individuals included were 32 year old women in the NHS. Apparently very few individuals were over the age of 70 years. Only a small Finnish study (Marniemi 200548) restricted the study cohort to only older adults (65 years and older). This study found no significant associations between calcium intake and cardiovascular events. No study reported a subgroup analysis based on age. The reported data do not allow further conclusions based on age.
Almost all studies or analyses separately evaluated men and women. The findings that could be interpreted as an association between calcium intake and cardiovascular risk were mostly found in women (low calcium intake being associated with increased risk of cardiac death (in one of three studies) and stroke (in a single study), but with lowered risk of overall cardiovascular death (in one of two studies). The only potentially positive associations between calcium intake and cardiovascular events in men were found for stroke; however, the two studies had opposite findings about the direction of the association.
Findings by life stage
-
0 – 6 mo Not reviewed
-
7 mo – 2 y Not reviewed
-
3 – 8 y Not reviewed
-
9 – 18 y Not reviewed
-
19 – 50 y Overall, the studies included relatively few people in this life stage. All were at least 32 years old, and most were at least 40 to 45 years old. However, the one study of stroke in women was conducted in women who were mostly in this life stage. Those in the lowest quintile of the NHS appear to have had higher risks of stroke than those women with greater calcium intake.
-
51 – 70 y The majority of evidence regards people in this life stage. Overall, the majority of analyses found no significant association between calcium intake and most cardiovascular events. Only for stroke did at least two studies find significant associations between calcium intake and the outcome. In two Asian studies, where the average dietary calcium intake was about half that in the US and which also included people in the younger life stage, stroke risk was progressively higher in lower quantiles (maximum quantiles were median of 753 mg/day and >591 mg/day). For studies of people within this life stage, other significant associations were found in one of three studies of cardiac death in women (calcium intake below 696 mg/day was associated with increased risk) and in one of two studies of cardiovascular death in women (calcium intake above about 300 mg/day may be associated with increased risk).
-
≥71 y Few studies included people in this life stage. The one study of people in this life stage found no association between calcium intake and cardiac events or stroke in a relatively small, quality C study.
-
Postmenopause Only the Iowa WHS included primarily postmenopausal women. In their analysis, calcium intake below 696 mg/day was associated with increased risk of ischemic heart disease death.
-
Pregnant & lactating women Not reviewed
Table 49. Calcium and cardiovascular outcomes: Characteristics of cohort studiesB
|
Author Year Study Name Location (Latitude) [PMID] |
Population |
Dietary Calcium intake |
Comparisons |
Confounders/Effect Modifiers Adjusted |
Specific CVD Outcomes |
|||||||
|
Nutrients |
Demograph |
Anthrop |
Medical |
UV exposure |
Lifestyle |
|||||||
|
Al-Delaimy 2003107 HPFS US (various) [12663277] |
• Health status |
No CVD |
• Dietary assessment method |
FFQ |
Outcome stratified by total Ca intake quintiles |
X |
X |
X |
X |
|
X |
IHD MI Cardiac death |
|
• Mean age (SD), y |
54 (9) |
|
|
|
|
|
|
|
|
|||
|
|
|
|
|
|
|
|
|
|
Total Ca (both) |
|||
|
• Male (%) |
100 |
• Internal validation? (y/n) |
Yes |
|
|
|
|
|
|
|
||
|
Ascherio 1998109 HPFS US (various) [9743511] |
• Health status |
No CVD |
• Dietary assessment method |
FFQ |
Outcome stratified by total Ca intake quintiles |
X |
X |
X |
X |
|
X |
Stroke |
|
• Mean age (range), y |
nd (40-75) |
|
|
|
|
|
|
|
Total Ca (both) |
|||
|
|
• Male (%) |
100 |
• Internal validation? (y/n) |
Yes |
|
|
|
|
|
|
|
|
|
Bostick 1999110 Iowa WHS Iowa (42°) [9921960] |
• Health status |
No IHD |
• Dietary assessment method |
FFQ |
Outcome stratified by total Ca intake quartiles |
X |
X |
X |
X |
|
X |
Cardiac death |
|
• Mean age (range), y |
61 (55-69) |
|
|
|
|
|
|
|
Total Ca (both) |
|||
|
|
• Male (%) |
0 |
• Internal validation? (y/n) |
Yes |
|
|
|
|
|
|
|
|
|
Iso 1999111 NHS US (various) [10471422] |
• Health status |
No CVD |
• Dietary assessment method |
FFQ |
Outcome stratified by total Ca intake quintiles |
|
X |
|
|
|
X |
Stroke |
|
• Mean age (range), y |
46 (32-57) |
|
|
|
|
|
|
|
Total Ca (food) |
|||
|
|
• Male (%) |
0 |
• Internal validation? (y/n) |
No |
|
|
|
|
|
|
|
|
|
Larsson 2008112 ATBC SW Finland (~60°N) [18332289] |
• Health status |
No stroke |
• Dietary assessment method |
FFQ |
Outcome stratified by total Ca intake quintiles |
X |
X |
X |
X |
|
X |
Stroke (cerebral infarct) |
|
• Mean age (range), y |
57 (50-69) |
|
|
|
|
|
|
|
||||
|
|
|
|
|
|
|
|
|
Total Ca (food) |
||||
|
|
• Male (%) |
100 |
• Internal validation? (y/n) |
No |
|
|
|
|
|
|
|
|
|
Marniemi 200548 Turku Finland (60°N) [15955467] |
• Health status |
Any |
• Dietary assessment method |
Interview |
Outcome stratified by total Ca intake tertiles |
X |
X |
|
|
|
X |
MI Stroke |
|
• Mean age (range), y |
79 (65-99) |
|
|
|
|
|
|
|
||||
|
|
|
|
|
|
|
|
|
|
Total Ca (both) |
|||
|
|
• Male (%) |
48% |
• Internal validation? (y/n) |
No |
|
|
|
|
|
|
|
|
|
Author Year Study Name Location (Latitude) [PMID] |
Population |
Dietary Calcium intake |
Comparisons |
Confounders/Effect Modifiers Adjusted |
Specific CVD Outcomes |
|||||||
|
Nutrients |
Demograph |
Anthrop |
Medical |
UV exposure |
Lifestyle |
|||||||
|
Ross 1997113A Shanghai China (31°N) [9236416] |
• Health status |
Cases & controls |
• Dietary assessment method |
FFQ |
Outcome stratified by total Ca intake tertiles |
|
X |
X |
X |
|
X |
Fatal stroke |
|
|
|
|
|
|
|
|
|
Total Ca (food) |
||||
|
• Mean age (range), y |
nd (45-64) |
|
|
|
|
|
|
|
|
|||
|
|
• Male (%) |
100 |
• Internal validation? (y/n) |
nd |
|
|
|
|
|
|
|
|
|
Umesawa 2006104 Japan CC Japan (various) [16339476] |
• Health status |
No CVD |
• Dietary assessment method |
FFQ |
Outcome stratified by total Ca intake quintiles |
X |
X |
X |
X |
|
X |
Cardiac death Stroke death CVD death |
|
• Mean age (range), y |
56 (40-79) |
|
|
|
|
|
|
|
|
|||
|
|
|
|
|
|
|
|
|
|
|
Total Ca (food) |
||
|
|
• Male (%) |
39 |
• Internal validation? (y/n) |
No |
|
|
|
|
|
|
|
|
|
Umesawa 2008106 Japan PHC Japan (various) [18635855] |
• Health status |
No CVD |
• Dietary assessment method |
FFQ |
Outcome stratified by total Ca intake quintiles |
X |
X |
X |
X |
|
X |
CHD Stroke |
|
• Mean age (range), y |
49 (40-59) |
|
|
|
|
|
|
|
|
|||
|
|
|
|
|
|
|
|
|
|
|
Total Ca (food) |
||
|
|
• Male (%) |
48 |
• Internal validation? (y/n) |
Yes |
|
|
|
|
|
|
|
|
|
van der Vijver 1992105 Dutch civil servants Amsterdam Netherlands (52°) [1544755] |
• Health status |
Any |
• Dietary assessment method |
FFQ |
Outcome stratified by total Ca intake quintiles |
|
X |
X |
|
|
X |
Cardiac death CVD death |
|
• Mean age (range), y |
52 (40-65) |
|
|
|
|
|
|
|
|
|||
|
|
|
|
|
|
|
|
|
|
|
Total Ca (food) |
||
|
• Male (%) |
51 |
• Internal validation? (y/n) |
No |
|
|
|
|
|
|
|
|
|
|
Weng 2008108 CVD—FACTS Taiwan (22°-25°) [18988909] |
• Health status |
No stroke, cancer |
• Dietary assessment method |
FFQ |
Outcome stratified by total Ca intake quartiles (top 2 quartiles combined) |
|
X |
X |
X |
|
X |
Ischemic stroke |
|
• Mean age y (range), |
57 (≥40) |
|
|
|
|
|
|
|
|
Total Ca (both) |
||
|
|
• Male (%) |
44 |
• Internal validation? (y/n) |
No |
|
|
|
|
|
|
|
|
|
A Nested case-control study B This table is ordered alphabetically by study author |
||||||||||||
Table 50. Calcium and cardiovascular outcomes: Results of cohort studies
|
Author Year Study Name PMID |
Age Range, Sex |
Outcome (n/N; Incidence) |
Followup Duration |
Total Ca Intake, mg/day |
No. of Cases |
No. in Category |
Adjusted OR |
95% CI |
P for Trend |
Study Quality |
|
CVD Death |
||||||||||
|
Men |
||||||||||
|
Umesawa 2006104 Japan CC [16339476] |
40-79 y, Men |
CVD death (685/23,117; 0.030) |
8.9 y |
250, mean |
140 |
4623 |
1 |
Reference |
0.95 |
B |
|
|
|
|
|
363 |
141 |
4624 |
0.98 |
0.75, 1.30 |
|
|
|
|
|
|
|
449 |
135 |
4623 |
0.93 |
0.67, 1.29 |
|
|
|
|
|
|
|
536 |
135 |
4624 |
0.92 |
0.64, 1.32 |
|
|
|
|
|
|
|
665 |
134 |
4623 |
0.97 |
0.64, 1.48 |
|
|
|
van der Vijver 1992105 Dutch civil servants [1544755] |
40-65 y, Men |
CVD death (nd/1340; ~0.27, age-adjusted) |
28 y |
≤585 |
31.9%, age-adjusted |
271 |
1.3 |
0.8, 1.9 |
nd |
B |
|
|
|
|
|
585-1245 |
26.7% |
798 |
1.1 |
0.8, 1.5 |
|
|
|
|
|
|
|
>1245 |
24.9% |
271 |
1 |
Reference |
|
|
|
Women |
||||||||||
|
Umesawa 2006104 Japan CC [16339476] |
40-79 y, Women |
CVD death (644/35,609; 0.018) |
8.9 y |
266, mean |
153 |
7121 |
1 |
Reference |
0.14 |
B |
|
|
|
|
|
379 |
156 |
7122 |
1.29 |
0.99, 1.67 |
|
|
|
|
|
|
|
462 |
136 |
7122 |
1.24 |
0.90, 1.69 |
|
|
|
|
|
|
|
545 |
98 |
7122 |
0.92 |
0.64, 1.34 |
|
|
|
|
|
|
|
667 |
101 |
7122 |
1.14 |
0.74, 1.74 |
|
|
|
van der Vijver 1992105 Dutch civil servants [1544755] |
40-65 y, Women |
CVD death nd/1265; ~0.14, age-adjusted) |
28 y |
≤445 |
14.6%, age-adjusted |
258 |
1.1 |
0.6, 2.0 |
nd |
B |
|
|
|
|
|
445-850 |
14.4% |
750 |
1.1 |
0.7, 1.7 |
|
|
|
|
|
|
|
>850 |
12.6% |
257 |
1 |
Reference |
|
|
|
Cardiac Events, Total |
||||||||||
|
Both Sexes |
||||||||||
|
Umesawa 2008106 Japan PHC [18635855] |
40-59 y, Both |
CHD (322/41,526; 0.0078) |
13 y |
233, median |
72 |
~8305 |
1 |
Reference |
NS |
A |
|
|
|
|
|
344 |
72 |
~8305 |
1.18 |
0.83, 1.68 |
|
|
|
|
|
|
|
439 |
56 |
~8305 |
0.91 |
0.60, 1.37 |
|
|
|
603 |
58 |
~8305 |
1.08 |
0.71, 1.65 |
||||||
|
|
|
|
|
753 |
64 |
~8305 |
0.93 |
0.58, 1.50 |
|
|
|
Author Year Study Name PMID |
Age Range, Sex |
Outcome (n/N; Incidence) |
Followup Duration |
Total Ca Intake, mg/day |
No. of Cases |
No. in Category |
Adjusted OR |
95% CI |
P for Trend |
Study Quality |
|
Marniemi 200548 (Finland) [15955467] |
65-99 y, Both |
AMI (130/755; 0.172) |
10 y |
nd |
nd |
~252 |
1 |
Reference |
nd |
C |
|
|
|
|
|
nd |
nd |
~252 |
0.87 |
0.57, 1.37 |
|
|
|
|
|
|
|
nd |
nd |
~252 |
1.14 |
0.70, 1.84 |
|
|
|
Men |
||||||||||
|
Al-Delaimy 2003107 HPFS [12663277] |
Mean (SD) 54 (9) y, Men |
IHD, total (1458/39,800; 0.037) |
12 y |
523, mean |
300 |
7960 |
1 |
Reference |
0.43 |
A |
|
|
|
|
|
670 |
296 |
7960 |
1.03 |
0.88, 1.22 |
|
|
|
|
|
|
|
803 |
267 |
7960 |
0.92 |
0.78, 1.09 |
|
|
|
|
|
|
|
995 |
299 |
7960 |
1.01 |
0.85, 1.19 |
|
|
|
|
|
|
|
1377 |
296 |
7960 |
0.94 |
0.79, 1.11 |
|
|
|
Cardiac Death |
||||||||||
|
Men |
||||||||||
|
Al-Delaimy 2003107 HPFS [12663277] |
Mean (SD) 54 (9) y, Men |
IHD death (428/39,800; 0.011) |
12 y |
523, mean |
88 |
7960 |
1 |
Reference |
0.72 |
A |
|
|
|
|
|
670 |
90 |
7960 |
1.17 |
0.87, 1.50 |
|
|
|
|
|
|
|
803 |
70 |
7960 |
0.93 |
0.67, 1.29 |
|
|
|
|
|
|
|
995 |
79 |
7960 |
1.06 |
0.77, 1.47 |
|
|
|
|
|
|
|
1377 |
101 |
7960 |
1.10 |
0.79, 1.51 |
|
|
|
Umesawa 2006104 Japan CC [16339476] |
40-79 y, Men |
CHD death (148/23,117; 0.0064) |
8.9 y |
250, mean |
37 |
4623 |
1 |
Reference |
0.43 |
A |
|
|
|
|
|
363 |
26 |
4624 |
0.84 |
0.47, 1.50 |
|
|
|
|
|
|
|
449 |
33 |
4623 |
1.20 |
0.62, 2.30 |
|
|
|
|
|
|
|
536 |
32 |
4624 |
1.27 |
0.60, 2.68 |
|
|
|
|
|
|
|
665 |
20 |
4623 |
0.92 |
0.37, 2.29 |
|
|
|
van der Vijver 1992105 Dutch civil servants 1544755 |
40-65 y, Men |
CHD death (nd/1340; ~0.15, age-adjusted) |
28 y |
≤585 |
16.6%, age-adjusted |
271 |
0.9 |
0.6, 1.6 |
nd |
B |
|
|
|
|
|
585-1245 |
15.1% |
798 |
1.0 |
0.6, 1.5 |
|
|
|
|
|
|
|
>1245 |
14.5% |
271 |
1 |
Reference |
|
|
|
Women |
||||||||||
|
Umesawa 2006104 Japan CC [16339476] |
40-79 y, Women |
CHD death (116/35,609; 0.0033) |
8.9 y |
266, mean |
38 |
7121 |
1 |
Reference |
0.50 |
A |
|
|
|
|
|
379 |
21 |
7122 |
0.88 |
0.48, 1.62 |
|
|
|
|
|
|
|
462 |
25 |
7122 |
1.28 |
0.62, 2.61 |
|
|
|
|
|
|
|
545 |
17 |
7122 |
0.84 |
0.35, 2.02 |
|
|
|
|
|
|
|
667 |
15 |
7122 |
0.87 |
0.31, 2.45 |
|
|
|
Author Year Study Name PMID |
Age Range, Sex |
Outcome (n/N; Incidence) |
Followup Duration |
Total Ca Intake, mg/day |
No. of Cases |
No. in Category |
Adjusted OR |
95% CI |
P for Trend |
Study Quality |
|
Bostick 1999110 Iowa WHS [9921960] |
55-69 y, Women |
IHD death (387/34,486; 0.011) |
8 y |
<696 |
127 |
~8621 |
1 |
Reference |
0.09 |
B |
|
|
|
|
|
696-1051 |
84 |
~8621 |
0.62 |
0.45, 0.85* |
|
|
|
|
|
|
|
1052-1425 |
94 |
~8621 |
0.75 |
0.55, 1.03 |
|
|
|
|
|
|
|
>1425 |
82 |
~8621 |
0.67 |
0.47, 0.94* |
|
|
|
van der Vijver 1992105 Dutch civil servants [1544755] |
40-65 y, Women |
CHD death (nd/1265; ~0.06, age-adjusted) |
28 y |
≤445 |
6.2%, age-adjusted |
258 |
1.1 |
0.5, 2.5 |
nd |
B |
|
|
|
|
|
445-850 |
6.3% |
750 |
1.2 |
0.6, 2.3 |
|
|
|
|
|
|
|
>850 |
4.4% |
257 |
1 |
Reference |
|
|
|
Cardiac Event, Nonfatal |
||||||||||
|
Men |
||||||||||
|
Al-Delaimy 2003107 HPFS [12663277] |
Mean (SD) 54 (9) y, Men |
Nonfatal MI (1030/39,800; 0.026) |
12 y |
523, mean |
212 |
7960 |
1 |
Reference |
0.43 |
A |
|
|
|
|
|
670 |
206 |
7960 |
1.01 |
0.83, 1.23 |
|
|
|
|
|
|
|
803 |
197 |
7960 |
0.96 |
0.78, 1.17 |
|
|
|
|
|
|
|
995 |
220 |
7960 |
1.04 |
0.85, 1.28 |
|
|
|
|
|
|
|
1377 |
195 |
7960 |
0.92 |
0.74, 1.14 |
|
|
|
Stroke |
||||||||||
|
Both Sexes |
||||||||||
|
Umesawa 2008106 Japan PHC [18635855] |
40-59 y, Both |
Stroke, Total (1321/41,526; 0.032) |
13 y |
233, median |
314 |
~8305 |
1 |
Reference |
0.02 |
A |
|
|
|
|
|
344 |
257 |
~8305 |
0.94 |
0.79, 1.13 |
|
|
|
|
|
|
|
439 |
252 |
~8305 |
0.79 |
0.65, 0.97* |
|
|
|
|
|
|
|
603 |
247 |
~8305 |
0.78 |
0.63, 0.96* |
|
|
|
|
|
|
|
753 |
251 |
~8305 |
0.71 |
0.56, 0.89* |
|
|
|
Weng 2008108 CVD—FACTS [18988909] |
≥40 y Both |
Stroke, Ischemic (132/1772; 0.074) |
10.6 y |
<451 |
nd |
443 |
1.52 |
0.98, 2.35 |
0.03 |
B |
|
|
|
|
|
451-591 |
nd |
443 |
1.49 |
0.99, 2.24 |
|
|
|
|
|
|
|
>591 |
nd |
886 |
1 |
Reference |
|
|
|
Marniemi 200548 (Finland) [15955467] |
65-99 y, Both |
Stroke, Total (70/755; 0.093) |
10 y |
nd |
nd |
~252 |
1 |
Reference |
nd |
C |
|
|
|
|
|
nd |
nd |
~252 |
0.981 |
0.53, 1.81 |
|
|
|
|
|
|
|
nd |
nd |
~252 |
1.34 |
0.70, 2.55 |
|
|
|
Men |
||||||||||
|
Author Year Study Name PMID |
Age Range, Sex |
Outcome (n/N; Incidence) |
Followup Duration |
Total Ca Intake, mg/day |
No. of Cases |
No. in Category |
Adjusted OR |
95% CI |
P for Trend |
Study Quality |
|
Ascherio 1998109 HPFS [9743511] |
40-75 y, Men |
Stroke, Total (328/43,738; 0.0075) |
8 y |
500, median |
75 |
~8748 |
1 |
Reference |
0.10 |
A |
|
|
|
|
|
700 |
69 |
~8748 |
0.95 |
0.68, 1.32 |
|
|
|
|
|
|
|
800 |
51 |
~8748 |
0.72 |
0.50, 1.03 |
|
|
|
|
|
|
|
1000 |
63 |
~8748 |
0.84 |
0.60, 1.19 |
|
|
|
|
|
|
|
1400 |
70 |
~8748 |
0.88 |
0.63, 1.23 |
|
|
|
Larsson 2008112 ATBC [18332289] |
50-69 y, Men |
Cerebral infarction (2702/26,556; 0.102) |
13.6 y |
876, median |
518 |
~5311 |
1 |
Reference |
0.09 |
C |
|
|
|
|
|
1178 |
541 |
~5311 |
1.08 |
0.95, 1.22 |
|
|
|
|
|
|
|
1379 |
542 |
~5311 |
1.09 |
0.96, 1.23 |
|
|
|
|
|
|
|
1581 |
546 |
~5311 |
1.11 |
0.98, 1.26 |
|
|
|
|
|
|
|
1916 |
555 |
~5311 |
1.10 |
0.98, 1.26 |
|
|
|
Women |
||||||||||
|
Iso 1999111 NHS [10471422] |
32-57 y, Women |
Stroke, Total (690/85,764; 0.0080) |
14 y |
395, median |
165 |
~17153 |
1 |
Reference |
NS |
A |
|
|
|
|
|
645 |
132 |
~17153 |
0.79 |
0.63, 1.00* |
|
|
|
|
|
|
|
675 |
117 |
~17153 |
0.71 |
0.56, 0.90* |
|
|
|
|
|
|
|
837 |
142 |
~17153 |
0.87 |
0.70, 1.09 |
|
|
|
|
|
|
|
1145 |
134 |
~17153 |
0.83 |
0.66, 1.04 |
|
|
|
Stroke, Fatal |
||||||||||
|
Men |
||||||||||
|
Umesawa 2006104 Japan CC [16339476] |
40-79 y, Men |
Stroke death (322/23,117; 0.014) |
8.9 y |
250, mean |
61 |
4623 |
1 |
Reference |
0.95 |
A |
|
|
|
|
|
363 |
76 |
4624 |
1.14 |
0.76, 1.70 |
|
|
|
|
|
|
|
449 |
69 |
4623 |
0.90 |
0.56, 1.45 |
|
|
|
|
|
|
|
536 |
59 |
4624 |
0.69 |
0.40, 1.18 |
|
|
|
|
|
|
|
665 |
57 |
4623 |
0.68 |
0.37, 1.26 |
|
|
|
Ross 1997113A (China) [9236416] |
45-64 y, Men |
Stroke death (245/18,244;0.013) [245 cases vs. 1225 controls] |
12 y |
nd |
103 |
460 controls |
1 |
Reference |
NS |
C |
|
|
|
|
|
nd |
68 |
369 controls |
0.8 |
0.6, 1.6 |
|
|
|
|
|
|
|
nd |
74 |
396 controls |
1.0 |
0.8, 1.4 |
|
|
|
Women |
||||||||||
|
Umesawa 2006104 Japan CC [16339476] |
40-79 y, Women |
Stroke death (322/35,609; 0.0090) |
8.9 y |
266, mean |
70 |
7121 |
1 |
Reference |
0.50 |
A |
|
|
|
|
|
379 |
82 |
7122 |
1.38 |
0.95, 2.01 |
|
|
|
|
|
|
|
462 |
73 |
7122 |
1.24 |
0.79, 1.95 |
|
|
|
|
|
|
|
545 |
42 |
7122 |
0.69 |
0.40, 1.18 |
|
|
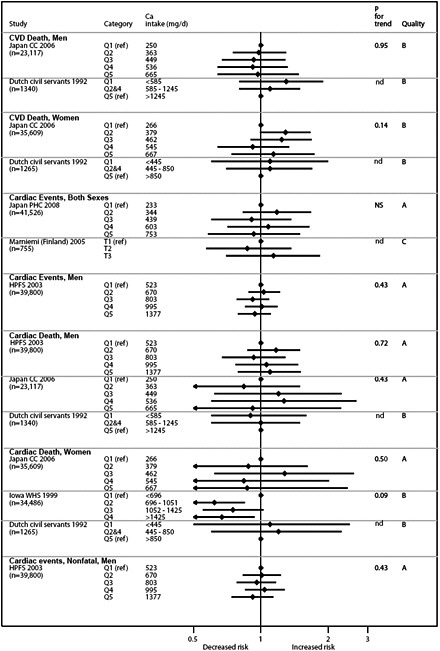
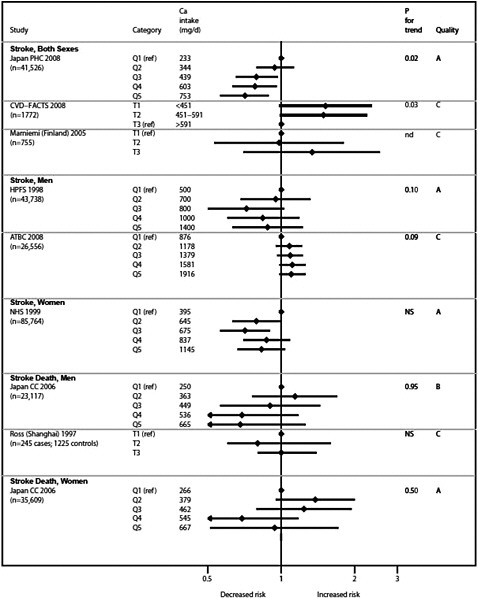
Calcium and body weight
We searched for systematic reviews and primary studies that evaluated associations between calcium intake or body stores and incidence of overweight or obesity; no such studies were found. For the outcome weight change (in kilograms or body mass index units), we included only randomized controlled trials. The EPC and the TEP agreed that the limited resources would not be expended on reviewing observational studies for the surrogate outcome body weight (where overweight or obesity are considered to be the clinical outcomes). We included only studies of adults. Studies of weight gain in children are included in the “Growth” section.
Synopsis
No studies evaluated the association of calcium intake and incidence of overweight or obesity. We identified three systematic reviews that evaluated RCTs of calcium intake and changes in body weight. Eight additional trials not identified by these systematic reviews met eligibility criteria for this report and are summarized together with the systematic reviews. Altogether, 49 trials have been identified by the previous and current systematic reviews. Because the systematic reviews all used somewhat different eligibility criteria, they included overlapping groups of trials. No one or two systematic reviews captured most of the relevant trials; therefore, all systematic reviews are included here.
The three systematic reviews performed separate analyses for calcium supplementation and dairy product intake. Only one of the systematic reviews separately analyzed studies of people on isocaloric diets (where weight loss was not a goal) and studies of people on energy-restricted diets. Overall, 24 included trials investigated calcium supplementation and 15 investigated dairy product intake; 29 trials had isocaloric background diets and 13 evaluated calcium supplementation in the setting of an energy-restricted (weight loss) diets. Although there was not complete agreement among the systematic reviews, overall, the trials in the systematic review do not support an effect of calcium (or dairy) supplementation on body weight. No systematic review analyzed effects of calcium supplementation based on life stage or calcium dose.
Seven of the eight additional trials investigated calcium supplements in the setting of isocaloric diets; two of the trials investigated calcium supplements in overweight people on energy-restricted diets. All these trials found no significant effect of calcium supplementation on body weight.
Detailed presentation (Tables 51, 52, & 53)
The three systematic reviews explicitly or implicitly used generally different eligibility criteria, resulting in large overlaps in the trials included among the reports.114-116. Overall, the systematic reviews included 42 trials. All systematic reviews separately analyzed calcium supplementation and dairy product intake. The largest, most recent systematic review114 included trials up to 2007, separated isocaloric from energy-restricted trials, but did not perform meta-analysis. The next largest systematic review115 included trials through 2004. The last systematic review,116 through 2001, also did not perform meta-analyses. All the dairy product trials in this review were also included in the most recent systematic review and are thus not discussed further here. Seven more recent calcium supplementation trials not included in any of the systematic reviews were found.117-123
Isocaloric trials
The systematic review by Lanou et al. (2008)114 evaluated 19 isocaloric trials of increased calcium intake in adults. Nine trials compared calcium supplements to placebo; 10 trials compared high calcium dairy intake to lower calcium nondairy intake. The systematic review did not provide details of every included trial, nor was meta-analysis performed. In summary, 16 trials (8 calcium supplement, 8 dairy product) of the 19 trials reported no significant effect of increased calcium intake on body weight, 1 calcium trial found significantly greater weight loss in those receiving calcium supplements, and 2 dairy trials found significantly greater weight gain in those in the dairy product group. This latter finding was theorized to be due to the extra calories from the dairy products.
Seven additional isocaloric trials were not included in the systematic reviews.117-122,124 Four of these trials were conducted in postmenopausal women, two in young women (age early 20s), and one in men and women aged 30 to 34 years. The trials used a variety of calcium compounds with doses ranging from 800 to 2000 mg; one compared dairy (~1250 mg calcium) to nondairy (~375 mg calcium) intakes.120 The studies ranged in duration from 1 month to almost 3 years. Among the studies, one was of methodological quality A, three B, and three C. Methodological limitations included inadequate reporting of methodology or outcomes, statistical issues, high dropout rates, and large difference in baseline weights between groups. The participants’ weights were generally stable, on average changing less than 1 kg during 6 weeks to 3 years of followup. The net weight changes (calcium group minus control group) ranged from −0.8 to +0.5 kg. No trial found a significant effect of calcium.
Findings per calcium intake level
Overall, there was no evidence of different effects related to calcium intake level. No study directly compared a range of calcium intake levels.
Findings per age and sex
The systematic review did not address the question of different effects based on age or sex. Among the additional trials reviewed here, no significant difference was found across trials of different populations. Most were conducted in postmenopausal women.
Energy-restricted diets
The systematic review by Lanou et al. (2008)114 evaluated 11 trials that compared dairy intake (6 trials) or calcium supplements (5 trials) in the setting of energy-restricted diets with the goal of weight loss. Of the six dairy product trials, three were conducted by the same investigators. These three trials all reported significantly more weight loss in participants with high dairy product intake than those with low or no dairy product intake (1137 vs. 430 mg Ca; 1100 vs. 500 mg; 3 vs. <1 servings). The systematic review authors note that due to incomplete reporting in the trials, it was impossible to determine whether the difference in weight loss may have been due to differences in calcium (or dairy) intake or differential compliance with the calorie restriction protocol. One of the five calcium supplement trials, which was part of one of the positive dairy trials by the same researchers, found greater weight loss with calcium supplementation; the others found no significant effect.
The two additional trials not included in the systematic reviews reported no significant effects of calcium supplementation on body weight loss.119,123 Both trials were conducted in overweight women, one trial with a mean age of 49 years and one trial of postmenopausal women. One trial compared two different formulations of 500 mg calcium with placebo in the setting of a low calcium intake (350 mg/day); the other compared higher (1200 mg) to lower
(400 mg) doses of calcium citrate. Over 3 or 6 weeks, women in all trial groups lost between 3.3 and 4.3 kg, with no significant differences between those with higher than lower calcium intake.
Findings per calcium intake level
Overall, there was no evidence of different effects related to calcium intake level. No study directly compared a range of calcium intake levels.
Findings per age and sex
The systematic review did not address the question of different effects based on age or sex. The two additional trials did not add any information regarding age or sex subgroups.
Combined isocaloric and energy-restricted diets
Two of the systematic reviews did not separately analyze studies based on background diet (regarding weight). The systematic review by Trowman et al. (2006)115 performed meta-analyses of 13 trials, separately for calcium supplement and dairy product trials. This systematic review found a significant effect of calcium supplements (weighted mean difference = −1.79 [95% CI −3.04, −0.55]) suggesting greater weight loss (or smaller weight gain) in adults taking calcium supplements. However, the investigators noted that the difference in effect of calcium supplement trials may be due to significant differences (in aggregate) in the baseline weights of the two arms. Across studies, the calcium supplement group participants had significantly lower body weights at baseline. The meta-analysis of dairy trials found no significant effect of dairy products on body weight. The systematic review by Barr et al. (2003)116 reviewed both calcium supplement and dairy trials; however, the dairy trials were all included in the later systematic review by Lanou et al. (2008)114 and are thus not repeated here. Among the eight trials of calcium supplementation, all but one found no significant effect on body weight. Between the two systematic reviews, over two-thirds of the trials were conducted in post- or perimenopausal women; the mean age of participants (among trials with data reported in the systematic reviews) ranged from 36 to 72 years. Only four of the trials were conducted in men. The range of calcium supplement doses was 700 to 1600 mg/day, with most studies using 1000 mg. The range of calcium intake among the dairy trials was 610 to 2400 mg/day. In the Trowman et al. (2006) systematic review,115 the range of followup durations of the trials was 12 weeks to 3 years. The Barr et al. (2003) systematic review116 included longer duration trials, ranging from 6 months to 4 years.
Findings per calcium intake level
The systematic reviews did not find evidence of differential effects based on calcium intake level (supplement dose or dairy calcium).
Findings per age and sex
The large majority of trials reviewed in the systematic reviews were conducted in postmenopausal women. The systematic reviews did not find evidence of differential effects based on age or sex.
Findings by life stage
-
0 – 6 mo Not reviewed
-
7 mo – 2 y Not reviewed
-
3 – 8 y Not reviewed
-
9 – 18 y Not reviewed
-
19 – 50 y Many of the trials are applicable to people within this life stage; though relatively few trials included men. For both people on energy-restrictive diets and on isocaloric diets, overall, the evidence suggests no significant effect on bodyweight with increased calcium intake, either as supplements or from dairy product intake.
-
51 – 70 y The majority of studies are applicable to women within this life stage; few trials included men. The conclusions are the same as for those in the 19-50 y life stage.
-
≥71 y The evidence is scant for this life stage. Few of the studies appear to have included people over age 70 years.
-
Postmenopause The majority of studies are applicable to postmenopausal women. The conclusions are the same as for those in the 19-50 y life stage.
-
Pregnant & lactating women Not reviewed
Table 51. Systematic reviews of calcium supplementation and weight
|
Author Year [PMID] |
Lanou 2008114 [18454813] |
||||
|
Design (Search Years) |
Randomized controlled trials (1966-2007) |
||||
|
Population |
All, generally healthy (adults and children, only studies of adults included here) |
||||
|
Intervention and Comparator |
Calcium supplements or dairy intake versus no supplement or low calcium intake |
||||
|
Results |
29 trialsA No energy restriction |
||||
|
|
|
Calcium supplement: 8/9 trials no significant effect. 1 found significantly more weight loss on calcium supplement. Dairy supplementation: 8/10 trials no significant effect. 2 found significantly more weight gain among those on dairy |
|||
|
|
Energy restriction |
||||
|
|
|
Calcium supplement: 4/5 trials no significant effect. 1 found significantly more weight loss with calcium. Dairy supplementation: 3/6 trials significantly more weight loss on high calcium intake All 4 trials with significant differences were by same study investigators |
|||
|
Comments |
|||||
|
AMSTAR |
|||||
|
A priori design? |
Yes |
Study quality assessment performed? |
No |
||
|
Two independent reviewers? |
nd |
Study quality appropriately used in analysis? |
NA |
||
|
Comprehensive literature search? |
Yes |
Appropriate statistical synthesis? |
None |
||
|
All publication types and languages included? |
No |
Publication bias assessed? |
No |
||
|
Included and excluded studies listed? |
No |
Conflicts of interest stated? |
No |
||
|
Study characteristics provided? |
|
Only published trials. Excluded studies not enumerated or listed. |
|||
|
Author Year [PMID] |
Trowman 2006115 [16768823] |
||||
|
Design (Search Years) |
Randomized controlled trials (1800B/2002-2004) |
||||
|
Population |
Nonpregnant, nonlactating, ≥18 y |
||||
|
Intervention and Comparator |
Calcium supplements or dairy intake versus no supplement or low calcium intake |
||||
|
Results |
13 trials |
||||
|
|
Calcium supplement |
WMD = −1.79 (−3.04, −0.55)C, statistically homogeneous |
|
||
|
|
Dairy supplementation |
WMD = +0.85 (−4.39, +6.08), statistically heterogeneous |
|
||
|
|
|
ANCOVA, adjusting for baseline weight: |
|||
|
|
|
Calcium |
|
Effect = −0.41 (−1.07, +0.25) kg |
|
|
|
|
Dairy |
|
Effect = +0.23 (−2.88, +3.34) kg |
|
|
Comments |
Apparent difference in effect of calcium supplement trials may be due to significant differences (in aggregate) in baseline weights of two arms across studies (intervention arm participants were significantly lighter at baseline). |
||||
|
AMSTAR |
|||||
|
A priori design? |
Yes |
Study quality assessment performed? |
No |
||
|
Two independent reviewers? |
nd |
Study quality appropriately used in analysis? |
NA |
||
|
Comprehensive literature search? |
Yes |
Appropriate statistical synthesis? |
Debatable |
||
|
All publication types and languages included? |
Yes |
Publication bias assessed? |
Yes (implied) |
||
|
Included and excluded studies listed? |
No |
Conflicts of interest stated? |
Yes |
||
|
Study characteristics provided? |
Yes |
Excluded studies not enumerated or listed. Used WMD instead of net difference, then needed to perform an ANCOVA to adjust for baseline differences. |
|||
Table 52. Calcium and weight: Characteristics of RCTs
|
Author Year Study Name Location (Latitude) [PMID] |
Population |
Background Calcium Intake & Vitamin D Data |
Comparisons |
Compliance |
Comments |
|
|
Yamamoto 1995117 TOHP US (various) [7795837] |
• Health status |
Healthy |
Ca 970 mg/d |
Ca carbonate vs placebo |
Eligibility for randomization required consumption of at least two-thirds of 6 wks of supplement placebo dosing. During the study, pill counts averaged 95% (with three-fourths taking at least 95% of their supplements). |
|
|
• Mean age (range), y |
43 (30-54) |
|
|
|
||
|
• Male (%) |
69 |
|
|
|
||
|
van Beresteyn 1986118 Netherlands (52°N) [3788835] |
• Health status |
Healthy |
nd |
Ca carbonate vs placebo |
nd |
|
|
• Mean age (range/SD), y |
21 (20-23) |
|
|
|
||
|
• Male (%) |
0 |
|
|
|
||
|
Cifuentes 2004119 New Brunswick, NJ (40°N) [15213038] |
• Health status |
Overweight, postmenopause |
nd |
Ca supplement vs placebo |
nd |
Factorial design with weight loss and maintenance diets |
|
• Mean age (range), y |
61 (52-75) |
|
|
|||
|
• Male (%) |
0 |
|
|
|
|
|
|
Ghadirian 1995120 Montreal, Canada (46°N) [7493659] |
• Health status |
Healthy, postmenopause |
Ca 776 mg/d |
Dairy vs dairy free intake |
Non-compliant and those who provided incomplete data were excluded. |
|
|
• Mean age (range), y |
~80 (~≥50) |
|
|
|
||
|
• Male (%) |
0 |
|
|
|
||
|
Aloia 1995121 Mineola, NY (41°N) [7892882] |
• Health status |
Healthy, postmenopause |
nd |
Ca supplement vs placebo (Vit in both groups) |
nd |
|
|
• Mean age (SD), y |
53 (0.6) |
|
|
|
||
|
• Male (%) |
0 |
|
|
|
||
|
Thomsen 1987122 Copenhagen, Denmark (55°N) [3307307] |
• Health status |
Healthy, postmenopause |
nd |
Combination Ca lactategluconate & Ca carbonate vs placebo |
nd |
|
|
• Mean age (range/SD), y |
nd |
|
|
|||
|
• Male (%) |
0 |
|
|
|
||
|
Bortolotti 2008124 Lausanne, Switzerland (47°N) [18842771] |
• Health status |
Healthy |
Ca 586 (137 SE) mg/d, all |
Ca phosphate vs placebo |
Measured but not reported |
Crossover study (5 wk with 10 wk washout), 1° outcomes were metabolic |
|
• Mean age (SE), y |
22 (1.2) |
<800 mg/d |
||||
|
• Male (%) |
30 |
|
|
|||
|
Kabrnova-Hlavata 2008123 Lausanne, Czech Rep (50°N) [17552880] |
• Health status |
Overweight, healthy |
nd |
Ca carbonate vs “lactoval” vs placebo |
nd (a dietitian checked that subjects took tablets) |
Energy restriction |
|
• Mean age (SD), y |
49 (12) |
|
|
|||
|
• Male (%) |
0 |
|||||
|
• Male (%) |
0 |
|||||
Table 53. Calcium and weight: Results of RCTs
|
Author Year Study Name [PMID] |
Age Range, Sex |
Outcome |
1°/2° |
Mean Followup |
Interventions, Daily Dose |
No. Analyzed |
Unit |
Baseline |
Change |
Change 95% CI |
Net Diff |
Net Diff 95% CI |
P Btw |
Study Quality |
|
Isocaloric |
||||||||||||||
|
Yamamoto 1995117 TOHP [7795837] |
30-54 y, Both |
BMI |
2° |
6 mo |
Ca carbonate 1000 mg |
217 |
Kg/m2 |
27.4 |
+0.07 |
−0.05, 0.19 |
0.05A |
−0.23, 0.13 |
NS |
A |
|
Placebo |
218 |
|
27.0 |
+0.12 |
−0.02, 0.26 |
|
|
|
|
|||||
|
van Beresteyn 1986118 Netherlands [3788835] |
20-23 y, Women |
Weight |
2° |
6 wk |
Ca carbonate 1500 mg |
29 |
Kg |
61.8 |
−0.3 |
−2.7, 2.1B |
−0.8 |
−4.3, 2.7B |
NS |
B |
|
Placebo |
29 |
62.5 |
+0.5 |
−2.0, 3.0B |
|
|||||||||
|
BMI |
2° |
Ca |
29 |
Kg/m2 |
20.8 |
−0.1 |
−0.8, 0.6B |
−0.2 |
−1.2, 0.8B |
NS |
|
|||
|
|
Placebo |
29 |
|
21.0 |
+0.1 |
−0.6, 0.8B |
|
|
|
|
||||
|
Cifuentes 2004119 New Jersey [15213038] |
52-75 y, Women |
Weight |
1° |
6 wk |
Ca citrate 1200 mg |
10 |
Kg |
70.9 |
0 |
−3.3, 3.3B |
0.4C |
−5.5, 4.7B |
NS |
B |
|
Ca citrate 400 mg |
15 |
|
68.0 |
+0.4 |
−3.4, 4.2B |
|
|
|
|
|||||
|
Ghadirian 1995120 Canada [7493659] |
~>=50 y, Women |
Weight |
2° |
1 mo |
Dairy intake (1242 mg Ca) |
81 |
Kg |
59.84 |
+0.10 |
−2.4, 2.6B |
+0.5 |
−3.7, 4.7B |
NS |
C |
|
Nondairy intake (377 mg) |
77 |
|
59.65 |
−0.40 |
−3.8, 3.0B |
|
|
|
|
|||||
|
Aloia 1995121 New York [7892882] |
Mean (SD) 53 (0.6) y, Women |
Weight |
2° |
2.9 y |
Ca 1700 mgD + Vit D 400 IU |
36 |
Kg/y |
65.8 |
+0.1 |
nd |
0 |
nd |
NS |
C |
|
Vit D 400 IU |
28 |
|
65.6 |
+0.1 |
nd |
|
|
|
|
|||||
|
Thomsen 1987122 Denmark [3307307] |
Early postmenopause, Women |
Weight |
2° |
1 y |
Ca lactate gluconate & carbonate 2000 mg |
14 |
Kg |
60.6 |
+0.4 |
−2.4, 3.2B |
0.2 |
8.0, 7.6B |
NS |
C |
|
Placebo |
14 |
|
66.4 |
+0.6 |
−6.7, 7.9B |
|
|
|
|
|||||
|
Bortolotti 2008124 Switzerland [18842771] |
Mean (SE) 22 (1.2) y, Both |
Weight |
2° |
5 wk |
Ca phosphate 800 mg |
10E |
Kg |
78.1 |
Final 80.0 |
|
Diff Final +0.4 |
5.7, +6.5 |
NS |
B |
|
Placebo |
79.6 |
|
||||||||||||
|
Energy Restricted |
|
|
|
|
|
|
|
|
|
|
|
|
||
|
Author Year Study Name [PMID] |
Age Range, Sex |
Outcome |
1°/2° |
Mean Followup |
Interventions, Daily Dose |
No. Analyzed |
Unit |
Baseline |
Change |
Change 95% CI |
Net Diff |
Net Diff 95% CI |
P Btw |
Study Quality |
|
Kabrnova-Hlavata 2008123 Czech Rep [17552880] |
49 (SD) y, Women |
Weight |
2° |
3 wk |
Ca carbonate 500 mg + 350 mg Ca in diet (4.5 MJ/d) |
21 |
Kg |
85.37 |
−4.34 |
−4.9, −3.8 |
−0.47 |
1.4, 0.4B |
NS |
B |
|
|
|
|
|
|
Lactoval (Ca phosphate, citrate, & lactate) 500 mg + 350 mg Ca in diet (4.5 MJ/d) |
25 |
|
84.95 |
−3.34 |
−4.0, −2.6 |
+0.53 |
0.5, 1.5B |
NS |
|
|
|
|
|
|
|
Placebo + 350 mg Ca in diet (4.5 MJ/d) |
21 |
|
83.43 |
−3.87 |
−4.6, −3.2 |
|
|
|
|
|
Cifuentes 2004119 New Jersey [15213038] |
52-75 y, Women |
Weight |
1° |
6 wk |
Ca citrate 1200 mg (>=2.5% wt loss goal) |
16 |
Kg |
71.5 |
−3.6 |
6.4, −0.8B |
−0.3E |
4.8, 4.2 |
NS |
B |
|
Ca citrate 400 mg (>=2.5% loss goal) |
16 |
|
74.5 |
−3.3 |
−6.8, 0.2B |
|
|
|
||||||
|
A Subgroup data available for black and white men and women (4 groups). No substantive differences among groups. All statistically nonsignificant. B Estimated from reported data C Adjusted for multiple factors, including baseline weight. D No data on calcium type E Crossover study F Adjusted for multiple factors, including baseline weight |
||||||||||||||
Calcium and cancer
Cancer from all cause and total cancer mortality
Synopsis
No qualified systematic review evaluated associations between calcium intake and incidence of all cancer and total cancer mortality. One RCT showed a borderline nonsignificant reduction of the risk of total cancer among healthy postmenopausal women (>55 years old) living in Nebraska (latitude 41°N) who received calcium supplementation (either calcium citrate 1400 mg/d or calcium carbonate 1500 mg/d). However, one cohort study analyzed US AARP cohort (men and women 50-71 y) showed that that total calcium intake was not associated with the risk of total cancer incident.
There is insufficient data to draw a conclusion regarding association between dietary calcium intakes and total cancer mortality.
Detailed presentation (Tables 54, 55, 56 & 57)
A 4-year population-based RCT,52 sampled from a 9-county, largely rural area in eastern Nebraska (latitude 41°N), aimed to compare the efficacy of vitamin D3 (1000 IU/d) plus calcium (either calcium citrate 1400 mg/d or calcium carbonate 1500 mg/d) or calcium alone (either calcium citrate 1400 mg/d or calcium carbonate 1500 mg/d) to placebo in reducing fracture incidence. Incidence of cancer was a secondary outcome of this trial. A total of 743 postmenopausal women over 55 years old were analyzed for the effect of calcium supplementation alone. The mean serum 25(OH)D concentration at baseline was 72 nmol/L.
At the end of study the relative risk of developing cancer was 0.53 (95 % CI 0.27, 1.03; P=0.06) comparing calcium supplementation (either calcium citrate 1400 mg/d or calcium carbonate 1500 mg/d) to the placebo. This study was rated B.
A cohort study analyzed data from AARP (the American Association of Retired Persons) members, aged 50 to 71 years old, living in six specific states in the US.125 During 3,383,377 person-years of followup (over 7 years), a total of 36,965 cancer cases in men and 16,605 cancer cases in women were identified. The results showed that that total calcium intake was not associated with the risk of total cancer after controlling for potential risk factors pertinent to individual cancers. Methodological quality of this study was rated B.
Findings by age, sex and/or ethnicity
A cohort study analyzing a total of 1553 men and 1397 women, aged between 40 and 65 years, living in Amsterdam (52°N) showed that there was no significant association between dietary calcium from foods and total cancer mortality in either men or in women after 28 years of followup.126 This study was rated C because the food frequency questionnaire was not internally validated and could not estimate usual intake through 1-week food frequency recall.
Findings by life stage
-
0 – 6 mo No data
-
7 mo – 2 y No data
-
3 – 8 y No data
-
9 – 18 y No data
-
19 – 50 y A cohort study in Amsterdam included some men and women in this life stage. However, this study provided insufficient data regarding association between dietary calcium intakes and total cancer mortality.
-
51 – 70 y The cohort study in Amsterdam also included some men and women in this life stage. However, this study provided insufficient data regarding association between dietary calcium intakes and total cancer mortality. One study analyzed US AARP cohort with men and women in this life stage showed that that total calcium intake was not associated with the risk of total cancer incident
-
≥71 y No data
-
Postmenopause One RCT with healthy postmenopausal women showed a borderline nonsignificant reduction of risk of total cancer by calcium supplementation (either calcium citrate 1400 mg/d or calcium carbonate 1500 mg/d).
-
Pregnant & lactating women No data
Table 54. Calcium and total cancer mortality: Characteristics of RCTs
|
Author Year Study Name Location (Latitude) [PMID] |
Population |
Background Calcium Intake & Vitamin D Data |
Comparisons |
Compliance |
Comments |
|
|
Lappe 200752 Nebraska, US 41º N [17556697] |
• Health status |
Mentally and physically fit |
25(OH)D: 71.8 nmol/L |
Vit D3 1000 IU/d + Ca (citrate 1400 mg/d or carbonate 1500 mg/d) vs. Ca (citrate 1400 mg/d or carbonate 1500 mg/d) vs. placebo |
|
|
|
• Mean age (range/SD), y |
67 (7.3) |
|
|
|
||
|
|
• Male (%) |
0 |
|
|
|
|
Table 55. Calcium and total cancer incidence or mortality: Characteristics of cohort studies
|
Author Year Study Name Location (Latitude) [PMID] |
Population |
Dietary Calcium intake |
Comparisons |
Confounders/Effect Modifiers Adjusted |
Comments |
|||||||
|
Nutrients |
Demograph |
Anthrop |
Medical |
UV exposure |
Lifestyle |
|||||||
|
Cohort |
||||||||||||
|
Park 2009125 NIH-AARP US 38º N [19237724] |
• Health status |
No cancer |
• Dietary assessment method |
FFQ (NCI-DHQ) USDA Nutrient Database |
Total cancer risk stratified by quintile of total calcium intake |
X |
X |
X |
X |
|
X |
Total calcium intake from diet and supplement |
|
• Mean age (range/), y |
50-71 |
|
|
|
|
|
|
|||||
|
|
• Male (%) |
60 |
• Internal validation? (y/n) |
y |
|
|
|
|
|
|
|
|
|
Slob 1993126 Amsterdam 52° N [8478144] |
• Health status |
nd |
• Dietary assessment method |
FFQ |
Cancer mortality stratified by dietary calcium intake quintiles (from foods only) |
X |
X |
|
|
|
|
|
|
• Mean age (range), y |
53 (40-65) |
|
|
|
|
|
|
|
|
|
||
|
|
• Male (%) |
51 |
• Internal validation? (y/n) |
no |
|
|
|
|
|
|
|
|
Table 56. Calcium and total cancer mortality: Results of RCTs
|
Author Year Study Name [PMID] |
Life Stage |
Outcome |
1°/2° |
Followup, y |
Interventions, Daily Dose |
n Event |
N Total |
Outcome Metric (Comparison) |
Result |
95% CI |
P Btw |
Study Quality |
|
Lappe 200752 nd [17556697] |
Post-menopausal women |
Incident cancer (all causes) |
2° |
4 |
Ca (citrate 1400 mg or carbonate 1500 mg) |
17 |
445 |
RR Ca/placebo |
0.53 |
0.27, 1.03 |
0.06 |
B |
|
|
|
|
|
Placebo |
20 |
288 |
|
|
|
|
|
|
|
|
Post-menopausal women |
Incident cancer restrict to subjects who were free of cancer at 1 y intervention) |
2° |
4 |
Ca (citrate 1400 mg or carbonate 1500 mg) |
15 |
416 |
RR Ca/placebo |
0.59 |
0.29, 1.21 |
0.147 |
|
|
|
|
|
|
Placebo |
18 |
266 |
|
|
|
|
|
Table 57. Calcium and total cancer incidence or mortality: Results of cohort studies
|
Author Year Study Name [PMID] |
Life Stage |
Outcome (n/N; Incidence) |
Followup Duration (Time to Dx) |
Total Ca Intake, mg/day |
No. of Cases |
No. in Category |
Adjusted OR |
95% CI |
P for Trend |
Study Quality |
|
Park 2009125 NIH-AARP [19237724] |
50-71, males |
Total cancer (36,965/3,383,377 person-years) |
7 y |
526 |
36,965 (total) |
3,383,377 person-years (total, both males and females) |
1 (HR) |
Reference |
0.74 |
B |
|
|
|
|
|
498 |
|
|
0.99 |
0.96, 1.03 |
|
|
|
|
|
|
|
857 |
|
|
0.99 |
0.96, 1.03 |
|
|
|
|
|
|
|
1073 |
|
|
0.95A |
0.96, 1.03 |
|
|
|
|
|
|
|
1530 |
|
|
0.99 |
0.95, 1.03 |
|
|
|
|
50-71, females |
Total cancer (16,605/3,383,377 person-years) |
7 y |
494 |
16,605 (total) |
3,383,377 person-years (total, both males and females) |
1 (HR) |
Reference |
0.23 |
|
|
|
|
|
|
717 |
|
|
0.98 |
0.93-1.03 |
|
|
|
|
|
|
|
969 |
|
|
0.94 |
0.89-0.99* |
|
|
|
|
|
|
|
1296 |
|
|
0.93 |
0.88-0.98* |
|
|
|
|
|
|
|
1881 |
|
|
0.96 |
0.91-1.02 |
|
|
|
Slob 1993126 nd [8478144] |
40-65 y, males |
Cancer mortality (232/1553; 0.15) |
28 y |
≤585 |
nd |
nd |
1.0 |
0.6, 1.6 |
nd |
C |
|
|
|
|
|
585 to ≤725 |
nd |
nd |
1.0 |
0.6, 1.6 |
|
|
|
|
|
|
|
725 to ≤935 |
nd |
nd |
1.0 |
0.6, 1.5 |
|
|
|
|
|
|
|
935 to ≤1245 |
nd |
nd |
0.8 |
0.5, 1.3 |
|
|
|
|
|
|
|
>1245 |
nd |
nd |
1.0 |
Reference |
|
|
|
|
40-65 y, females |
Cancer mortality (127/1397; 0.09) |
28 y |
≤445 |
nd |
nd |
1.1 |
0.6, 2.1 |
nd |
|
|
|
|
|
|
445 to ≤540 |
nd |
nd |
0.8 |
0.4, 1.5 |
|
|
|
|
|
|
|
540 to ≤640 |
nd |
nd |
1.6 |
0.9, 2.8 |
|
|
|
|
|
|
|
640 to ≤850 |
nd |
nd |
1.4 |
0.7, 2.5 |
|
|
|
|
|
|
|
>850 |
nd |
nd |
1.0 |
Reference |
|
|
|
A Not a reasonable number based on the reported confidence interval; probably a typographical error in the article. |
||||||||||
Prostate cancer
We reviewed primary studies that evaluated associations between calcium intake and incidence and mortality of prostate cancer.
Synopsis
No trials of calcium interventions evaluated prostate cancer. Four cohort studies rated A in methodological quality reported on the association between total calcium intake and the risk of prostate cancer. Three studies found significant associations between higher calcium intake and increased risk of prostate cancer. One study found the risk was higher in the group that took more than 1500 mg/d of calcium compared to those that took less than 700 mg/d (adjusted RR 1.3). A second study found only the group that took more than 2000 mg/d of calcium had higher risk of prostate cancer compared to those that took 500 to 749 mg/d of calcium (adjusted RR 1.26). A third study also found that male smokers who took more than 2000 mg/d of calcium had higher risk compared to those who took less than 1000 mg/d (adjusted RR 1.63). The fourth study found no relation between calcium intake (<500 to ≥2000 mg/d) and the risk of prostate cancer in men aged 50-70 years.
Detailed presentation (Tables 58 & 59; Figure 13)
A total of 12 cohort studies in 13 publications reported on the association between calcium intake and the risk of prostate cancer.56,127-138 One of the studies also provided a post hoc analysis of an RCT on calcium supplement.56 The incidence of prostate cancer in these studies ranged from 0.008 to 0.10. Most of the studies were conducted in Europe or North America, one study was conducted in Japan. Mean age of the subjects ranged from 53 to 67 years. Total calcium intake ranged from less than 500 mg/d to at least 2000 mg/d. Time between dietary assessment and the diagnosis of prostate cancer varied from 1 to 17 years. Methodological quality of four studies was rated A, seven studies were rated B, and one study was rated C.
19-50 years
No study specifically targeted men between 19 to 50 years old.
51-70 years
Twelve studies reported data on subjects with a mean age ranged from 53 to 67 years. Seven studies did not find an association between calcium intake and the risk of prostate cancer.56,130,131,133,134,136,137 Five studies found that the risk was higher in the groups that took more calcium compared to the groups that took lower amount (adjusted OR 1.2-2.2).127,129,132,135,138 The higher amount ranged from 921 to at least 2000 mg/d of calcium; the lower amount ranged from 455 to 1000 mg/d. Three studies also reported on the association between calcium intake and mortality from prostate cancer. Two studies found no association130,134 and one study found an increased risk comparing the group that took at least 2000 mg/d of calcium with the group that took 500 to 749 mg/d (adjusted RR 2.02, 95% CI 1.14, 3.58).129 One study was a post hoc analysis of an RCT of high calcium supplement (1200 mg/d) to prevent colorectal adenoma.56 This study did not find an increased risk of prostate cancer in those supplemented with calcium compared to those who were not (unadjusted RR 0.83, 95% CI 0.52, 1.32). This study did not adjust for factors potentially relevant to prostate cancer.
Findings by life stage
-
0 – 6 mo Not applicable
-
7 mo – 2 y Not applicable
-
3 – 8 y Not applicable
-
9 – 18 y Not reviewed
-
19 – 50 y No study specifically targeted men 19 to 50 years old.
-
51 – 70 y Seven studies did not find an association between calcium intake and the risk of prostate cancer. Five studies found that the risk was higher in the groups that took more calcium compared to the groups that took lower amount (adjusted OR 1.2-2.2). The higher amount ranged from 921 to at least 2000 mg/d; the lower amount ranged from 455 to 1000 mg/d.
-
≥71 y No study specifically targeted men older than 70 years.
-
Postmenopause Not applicable
-
Pregnant & lactating women Not applicable
Table 58. Calcium and prostate cancer: Characteristics of observational studies
|
Author, Year Trial/Cohort Name Country (Latitude) [PMID] |
Population |
Dietary calcium intake |
Comparisons |
Confounders/Effect Modifiers Adjusted |
||||||||
|
Nutrients |
Demographic |
Anthrop |
Medical |
UV exposure |
Life styles |
Comments |
||||||
|
Park 2007134 NIH-AARP Diet & Health US (multiple latitudes) [18000020] |
Health status |
12% current smoker |
Dietary assessment method |
124-item FFQ |
Prostate cancer risk stratified by different intakes of calcium (dietary and supplement combined) |
X |
X |
X |
X |
|
X |
92% white; Total Ca (both) |
|
|
Mean age (range/SD), y |
50-71(est.) |
|
|
|
|
|
|
|
|
|
|
|
|
Male (%) |
100 |
Internal validation? (y/n) |
y |
|
|
|
|
|
|
|
|
|
Rodriguez 2003135 CPS II Nutrition Cohort US (multiple latitudes) [12869397] |
Health status |
9.5% current smoker |
Dietary assessment method |
68-item FFQ (modified Block) |
Prostate cancer risk stratified by different intakes of calcium (dietary and supplement combined & dietary calcium alone) |
X |
X |
X |
|
|
X |
Total Ca (both) |
|
|
Mean age (range/SD), y |
64 |
|
|
|
|
|
|
|
|
|
|
|
|
Male (%) |
100 |
Internal validation? (y/n) |
y |
|
|
|
|
|
|
|
|
|
Giovannucci 2006128 2007129 HPFS US (multiple latitudes) [16492906] [17450530] |
Health status |
~10% current smoker |
Dietary assessment method |
Semi-quantitative FFQ |
Prostate cancer risk stratified by different intakes of calcium (dietary and supplement combined) |
X |
X |
X |
X |
|
X |
>91% white; Total Ca (both) |
|
|
Mean age (range/SD), y |
40-75 |
|
|
|
|
|
|
|
|
|
|
|
|
Male (%) |
100 |
Internal validation? (y/n) |
y |
|
|
|
|
|
|
|
|
|
Mitrou 2007132 ATBC Finland (60°N) [17106437] |
Health status |
all smokers |
Dietary assessment method |
276-item FFQ |
Prostate cancer risk stratified by different intakes of calcium (dietary and supplement combined) |
X |
X |
X |
X |
|
X |
100% white; Total Ca (food) |
|
|
Mean age (range/SD), y |
57 (est.) |
|
|
|
|
|
|
|
|
||
|
|
Male (%) |
100 |
Internal validation? (y/n) |
y |
|
|
|
|
|
|
|
|
|
Park 2007133 MCS, HI, CA US (multiple latitudes) [17925283] |
Health status |
~17% current smoker |
Dietary assessment method |
self-administered FFQ |
Prostate cancer risk stratified by different intakes of dietary calcium |
X |
X |
X |
|
|
X |
~equal % of African Americans, native Hawaiians, Japanese Americans, Hispanics, whites; Total Ca (both) |
|
|
Mean age (range/SD), y |
45-75 |
|
|
|
|
|
|
|
|
|
|
|
|
Male (%) |
100 |
Internal validation? (y/n) |
y |
|
|
|
|
|
|
|
|
|
Author, Year Trial/Cohort Name Country (Latitude) [PMID] |
Population |
Dietary calcium intake |
Comparisons |
Confounders/Effect Modifiers Adjusted |
||||||||
|
Nutrients |
Demographic |
Anthrop |
Medical |
UV exposure |
Life styles |
Comments |
||||||
|
Chan 2001127 PHS US (multiple latitudes) [11566656] |
Health status |
on ASA, β-carotene, placebo trial; ~11% current smoker |
Dietary assessment method |
short self-administered questionnaire |
Prostate cancer risk stratified by different intakes of dietary calcium |
|
X |
X |
|
|
X |
Total Ca (dairy) |
|
Mean age (range/SD), y |
53 |
|
|
|
|
|
|
|
|
|
||
|
Male (%) |
100 |
Internal validation? (y/n) |
n |
|
|
|
|
|
|
|
||
|
Koh 2006130 HAH US (multiple latitudes) [17106437] |
Health status |
7.5% smoker |
Dietary assessment method |
23-item FFQ (Willett 1985, 1987) |
Prostate cancer risk stratified by different intakes of dietary calcium |
X |
X |
X |
|
|
X |
Total Ca (dairy) |
|
Mean age (range/SD), y |
67 |
|
|
|
|
|
|
|
||||
|
Male (%) |
100 |
Internal validation? (y/n) |
n |
|
|
|
|
|
|
|
||
|
Schurrman 1999137 Netherlands Cohort (52°N) [10362125] |
Health status |
nd |
Dietary assessment method |
150-item semi-quantitative FFQ |
Prostate cancer risk stratified by quintile of dietary calcium intakes |
X |
X |
|
|
|
|
Total Ca (food) |
|
Mean age (range/SD), y |
61 |
|
|
|
|
|
|
|
||||
|
Male (%) |
100 |
Internal validation? (y/n) |
n |
|
|
|
|
|
|
|
||
|
Kurahashi 2008131 Japan PHC (multiple latitudes) [18398033] |
Health status |
~44% current smoker |
Dietary assessment method |
FFQ |
Prostate cancer risk stratified by quartiles of dietary calcium intakes |
X |
X |
|
|
|
X |
Total Ca (food) |
|
Mean age (range/SD), y |
45-74 |
|
|
|
|
|
|
|
||||
|
Male (%) |
100 |
Internal validation? (y/n) |
y |
|
|
|
|
|
|
|
||
|
Rohrmann 2007136 WCC, MD US (39ºN) [17315319] |
Health status |
17% current smoker |
Dietary assessment method |
60-item FFQ (Block) |
Prostate cancer risk stratified by tertiles of calcium intakes (dietary and supplement combined) |
X |
X |
X |
|
|
|
99% white; Total Ca (both) |
|
Mean age (range/SD), y |
54 |
|
|
|
|
|
|
|
|
|
||
|
Male (%) |
100 |
Internal validation? (y/n) |
n |
|
|
|
|
|
|
|
|
|
|
Author, Year Trial/Cohort Name Country (Latitude) [PMID] |
Population |
Dietary calcium intake |
Comparisons |
Confounders/Effect Modifiers Adjusted |
|
|||||||
|
Nutrients |
Demographic |
Anthrop |
Medical |
UV exposure |
Life styles |
Comments |
||||||
|
Tseng 2005138 NHEFS US (multiple latitudes) [15883441] |
Health status |
nd |
Dietary assessment method |
105-item FFQ |
Prostate cancer risk stratified by tertiles of calcium intakes (dietary and supplement combined) |
X |
X |
|
|
X |
X |
88% white; 11% black; Total Ca (both) |
|
Mean age (range/SD), y |
58(14.6) |
|
|
|
|
|
|
|
||||
|
Male (%) |
100 |
Internal validation? (y/n) |
n |
|
|
|
|
|
|
|
||
|
Baron 200556 CPP US (multiple latitudes) [15767334] |
Health status |
had >1 colon adenoma removal |
Dietary assessment method |
FFQ (Block, 1986) |
Prostate cancer risk stratified by tertiles of dietary calcium intakes |
X |
X |
|
|
|
|
5% black; Total Ca (suppl) |
|
Mean age (range/SD), y |
62 (8.7) |
|
|
|
|
|
|
|
||||
|
Male (%) |
100 |
Internal validation? (y/n) |
N |
|
|
|
|
|
|
|
|
|
Table 59. Calcium and prostate cancer: Results of observational studies
|
Author Year Study Name [PMID] |
Life Stage (male), y |
Outcome (n/N; Incidence) |
Followup Duration |
Total Ca intake in mg/d |
No. of Cases |
Total no. in Category |
Adjusted RR |
95% CI |
P for Trend |
Study Quality |
|
Park 2007134 NIH-AARP Diet & Health [18000020] |
51-70 |
Prostate cancer (10,180/293,888; 0.035) |
8 y |
<500 |
767 |
nd |
1.01 |
0.93, 1.10 |
0.41 |
A |
|
|
|
|
500-<750 |
2927 |
nd |
1 |
Reference |
|||
|
|
|
|
|
750-<1000 |
2808 |
nd |
0.99 |
0.93, 1.04 |
||
|
|
|
|
|
1000-<1500 |
2572 |
nd |
0.99 |
0.93, 1.05 |
||
|
|
|
|
|
1000-<1500 |
2572 |
nd |
0.99 |
0.93, 1.05 |
||
|
|
|
|
|
≥2000 |
309 |
nd |
0.97 |
0.85, 1.10 |
||
|
|
|
Mortality Prostate cancer |
|
<500 |
11 |
nd |
0.76 |
0.38, 1.53 |
0.99 |
|
|
|
|
|
|
500-<750 |
43 |
nd |
1 |
Reference |
||
|
|
|
|
|
750-<1000 |
56 |
nd |
1.50 |
0.97, 2.32 |
||
|
|
|
|
|
1000-<1500 |
50 |
nd |
1.42 |
0.86, 2.35 |
||
|
|
|
|
|
1500-<2000 |
18 |
nd |
1.05 |
0.54, 2.05 |
||
|
|
|
|
|
≥2000 |
0 |
nd |
- |
- |
||
|
Rodriguez 2003135 CPS II [12869397] |
51-70 |
Prostate cancer (3811/65,321; 0.058) |
≤7 y |
<700 |
1323 |
23,653 |
1 |
Reference |
0.02 |
A |
|
|
|
|
700-999 |
1293 |
nd |
1.0 |
0.9, 1.1 |
|||
|
|
|
|
1000-1499 |
835 |
nd |
1.0 |
0.9, 1.1 |
|||
|
|
|
|
|
1500-1999 |
265 |
nd |
1.3 |
1.1, 1.5* |
||
|
|
|
|
|
≥2000 |
95 |
1330 |
1.2 |
1.0, 1.6* |
||
|
Glovannucci 2006128 2007129 HPFS [16492906] [17450530] |
19-50 51-70 |
Prostate cancer (3544/47,750; 0.074) |
≤16 y |
<500 |
183 |
nd |
0.98 |
0.84, 1.15 |
0.10 |
A |
|
|
|
|
750-999 |
1099 |
nd |
1.07 |
0.98, 1.16 |
|||
|
|
|
|
|
500-749 |
1072 |
nd |
1 |
Reference |
||
|
|
|
|
|
1500-1999 |
207 |
nd |
1.06 |
0.91, 1.23 |
||
|
|
|
|
|
1000-1499 |
898 |
nd |
1.03 |
0.94, 1.14 |
||
|
|
|
|
|
≥2000 |
85 |
nd |
1.28 |
1.02, 1.60* |
||
|
|
|
Mortality Prostate cancer |
|
<500 |
21 |
nd |
1.05 |
0.65, 1.69 |
0.01 |
|
|
|
|
|
|
750-999 |
81 |
nd |
0.95 |
0.70, 1.28 |
||
|
|
|
|
|
500-749 |
94 |
nd |
1 |
Reference |
||
|
|
|
|
|
1500-1999 |
26 |
nd |
1.56 |
1.0, 2.43* |
||
|
|
|
|
|
1000-1499 |
76 |
nd |
1.04 |
0.77, 1.42 |
||
|
|
|
|
|
≥2000 |
14 |
nd |
2.02 |
1.14, 3.58* |
|
Author Year Study Name [PMID] |
Life Stage (male), y |
Outcome (n/N; Incidence) |
Followup Duration |
Total Ca intake in mg/d |
No. of Cases |
Total no. in Category |
Adjusted RR |
95% CI |
P for Trend |
Study Quality |
|
Mitrou 2007132 ATBC [17106437] |
51-70 |
Prostate cancer (1267/27,028; 0.047) |
≤17 y |
<1000A |
151 |
nd |
1 |
Reference |
<0.0001 |
A |
|
|
|
|
1000-1499 |
611 |
nd |
1.28 |
1.07, 1.54* |
|||
|
|
|
|
1500-1999 |
402 |
nd |
1.38 |
1.14, 1.67* |
|||
|
|
|
|
≥2000 |
103 |
nd |
1.63 |
1.27, 2.10* |
|||
|
Park 2007133 MCS [17925283] |
19-50 51-70 |
Prostate cancer (4404/82,483; 0.053) |
8 y |
<470 |
706 |
nd |
1 |
Reference |
0.69 |
B |
|
|
|
|
470-692 |
925 |
nd |
1.03 |
0.93, 1.15 |
|||
|
|
|
|
692-935 |
949 |
nd |
1.04 |
0.93, 1.17 |
|||
|
|
|
|
935-1300 |
936 |
nd |
1.05 |
0.93, 1.18 |
|||
|
|
|
|
≥1301 |
888 |
nd |
1.04 |
0.91, 1.20 |
|||
|
Chan 2001127 PHS [11566656] |
51-70 |
Prostate cancer (1012/20,885; 0.048) |
≤11 y |
0-150A |
155 |
nd |
1 |
Reference |
0.05 |
B |
|
|
|
|
151-300 |
206 |
nd |
1.21 |
0.96, 1.53 |
|||
|
|
|
|
301-600 |
377 |
nd |
1.35 |
1.09, 1.66* |
|||
|
|
|
|
>600 |
274 |
nd |
1.29 |
1.04, 1.62* |
|||
|
Koh 2006130 HAH [17106437] |
51-70 |
Prostate cancer (815/10,011; 0.081) |
≤10 y |
0-199A |
209 |
nd |
1 |
Reference |
0.64 |
B |
|
|
|
|
200-449 |
167 |
nd |
0.81 |
0.64, 1.02 |
|||
|
|
|
|
450-599 |
238 |
nd |
0.91 |
0.73, 1.14 |
|||
|
|
|
|
≥600 |
201 |
nd |
0.91 |
0.70, 1.18 |
|||
|
|
|
Mortality Prostate cancer |
|
0-199 |
30 |
nd |
1.00 |
Reference |
0.52 |
|
|
|
|
|
|
200-449 |
21 |
nd |
0.57 |
0.27, 1.19 |
||
|
|
|
|
|
450-599 |
23 |
nd |
0.60 |
0.29, 1.22 |
||
|
|
|
|
|
≥600 |
25 |
nd |
0.81 |
0.38, 1.71 |
||
|
Schuurman 1999137 Netherlands Cohort [10362125] |
51-70 |
Prostate cancer (704/58,279; 0.012) |
≤6.3 y |
120 |
nd |
1 |
Reference |
0.34 |
B |
|
|
|
|
|
780 |
126 |
nd |
1.10 |
0.80, 1.51 |
|||
|
|
|
|
911 |
127 |
nd |
1.04 |
0.76, 1.42 |
|||
|
|
|
|
1064 |
140 |
nd |
1.21 |
0.89, 1.66 |
|||
|
|
|
|
1329 |
129 |
nd |
1.09 |
0.79, 1.50 |
|||
|
Kurahashi 2008131 Japan PHC [18398033] |
19-50 51-70 |
Prostate cancer (329/43,435; 0.008) |
≤7.5 y |
56 |
nd |
1 |
Reference |
0.16 |
B |
|
|
|
|
|
404 |
68 |
nd |
1.03 |
0.70, 1.51 |
|||
|
|
|
|
522 |
98 |
nd |
1.32 |
0.92, 1.90 |
|||
|
|
|
|
725 |
107 |
nd |
1.24 |
0.85, 1.81 |
|||
|
Rohrmann 2007136 WCC [17315319] |
51-70 |
Prostate cancer (199/3892; 0.051) |
≤15 y |
<686 |
58 |
nd |
1 |
Reference |
0.99 |
B |
|
|
|
|
686-958 |
65 |
nd |
0.98 |
0.72, 1.47 |
|||
|
|
|
|
>958 |
76 |
nd |
0.99C |
0.70, 1.41 |
|
Author Year Study Name [PMID] |
Life Stage (male), y |
Outcome (n/N; Incidence) |
Followup Duration |
Total Ca intake in mg/d |
No. of Cases |
Total no. in Category |
Adjusted RR |
95% CI |
P for Trend |
Study Quality |
|
Tseng 2005138 NHEFS [15883441] |
51-70 |
Prostate cancer (131/3779; 0.035) |
7.7 y |
455B |
28 |
nd |
1 |
Reference |
0.001 |
B |
|
|
|
|
642 |
37 |
nd |
1.0 |
0.6, 1.7 |
|||
|
|
|
|
921 |
66 |
nd |
2.2 |
1.4, 3.5* |
|||
|
Baron 200556 CPP [15767334] |
51-70 |
Prostate cancer (70/672; 0.10) |
12 y |
nd |
nd |
1 |
Reference |
0.51 |
C |
|
|
|
|
|
675-991 |
nd |
nd |
1.48 |
0.81, 2.70 |
|||
|
|
|
|
>991 |
nd |
nd |
1.20 |
0.64, 2.23 |
|||
|
* Statistically significant (P<0.05) A Dietary calcium B median of tertile, quartile or quintile C Adjusted hazard ratio |
||||||||||
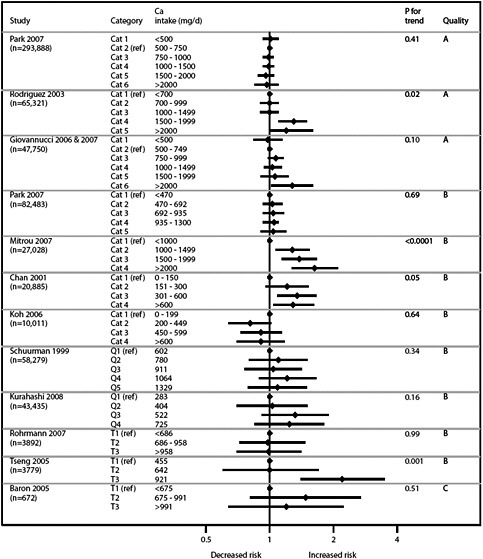
Colorectal cancer
Synopsis
This synopsis is based on one systematic review, 19 cohort studies in 20 publications, and one nested case-control study. The systematic review of two RCTs that evaluated high risk population found no difference in colorectal cancer incidence between those participants who received supplemental calcium and those who did not. Among five cohort studies and one nested case-control study with methodological quality B, two cohort studies showed a significant inverse association between total calcium intake and colorectal cancer. Among 14 cohort studies with methodological quality C, five studies showed a significant inverse association between total calcium intake and colorectal cancer, one found an inverse association between total calcium intake and colon cancer, and two showed an inverse association between calcium and rectal cancer. All the studies that found a significant association recruited men or women who were followed for a period that ranged between 1.4 and 11.3 years. None of these studies included participants younger than 45 years.
Detailed presentation (Tables 60, 61, 62 & 63; Figures 14, 15, 16, 17 & 18)
One systematic review of two RCTs of supplemental calcium on prevention of recurrent colorectal adenoma comprising 1346 adults (mean age 59 to 61 years) examined colorectal cancer incidence.139 A fixed-effects model meta-analysis found no significant difference in colorectal cancer incidence between supplemental calcium and no supplements. This meta-analysis is considered inconclusive because only 5 colorectal cancer cases were diagnosed during the study period.
Nineteen cohort studies in 20 publications125,140-158 and one nested case-control study159 evaluated the association between calcium intake and colorectal, colon, or rectal cancer. Sample sizes ranged from 1954 to 492,810. Half of the studies were conducted in the US (latitude ranged from 21° N to 54° N),125,140,142,144,145,147,150-152,154,155,158 one study was conducted in China (latitude 31° N),149 and the rest were conducted in Europe including France (latitude 46° N),141 the Netherlands (latitude 52° N),159 the United Kingdom (latitude ranged between 54° N and 55° N),156 and Scandinavia (latitude ranged between 59° N and 69° N).143,146,148,153,157 For colorectal cancer, the incidence ranged from 0.003 to 0.025 for cohorts, while in the nested case-control study, the colorectal cancer incidence was 0.142; for colon cancer, the incidence ranged from 0.003 to 0.024; and for rectal cancer, the incidence ranged from 0.003 to 0.004. The participants’ mean age ranged from 7.6 to 61.9 years. Average followup ranged from 1.4 to 19.6 years. Only one study reported that exposure assessors were blinded to outcome.154 No studies mentioned that outcome assessors were blinded to exposure. None of the studies reported power calculations. The majority of the studies evaluated the potential effect of various factors besides calcium on colorectal cancer. All performed analyses adjusted at least for age. Except for four studies151,156-158 that used dietary history, all other studies used a food frequency questionnaire to assess dietary intake. More than half of the studies did not confirm all or part of cancer cases with pathology reports. Six studies125,140-143,159 were rated B, and 15 publications144-158 were rated C for methodological quality.
Findings by age, sex and/or ethnicity
One cohort study analyzed a total of 4374 children (IQR 4-11 years old) living in the United Kingdom. It found no significant association between total calcium intake and colorectal cancer in these children after 65 years of followup.156
One cohort study analyzed a total of 127,749 adults aged between 50 and 74 years old living in US. It found an inverse association between total calcium intake and colorectal cancer.145 However, another cohort study and one nested case-control study did not find such an association.157,159 The only cohort study that analyzed subjects older than 15 years did not find a significant association between total calcium intake and colon cancer as well as rectal cancer in subgroup analyses.157 Out of seven cohort studies125,140,143-145,148,154 that analyzed male adults older than 40 years living in US, or Scandinavia, five125,143-145,148 found an inverse association between total calcium intake and colorectal cancer. Out of eleven cohort studies125,140-142,144-147,149,154,155 that analyzed women, four125,144,146,147 found an inverse association between total calcium intake and colorectal cancer.
Out of four cohort studies145,148,151,153 that analyzed men, one145 found an inverse association between total calcium intake and colon cancer in a subgroup analysis. Out of four cohort studies146,147,150,153 that analyzed women, none found an association between total calcium intake and colon cancer. For rectal cancer, one148 of two145,148 studies that analyzed men and one152 of three146,147,152 studies that analyzed women found an inverse association between total calcium intake and rectal cancer.148,152
One cohort study in the US found an inverse association between total calcium intake and colorectal cancer in a subgroup analysis of Japanese Americans aged 45 to 75 years, and a borderline inverse association in Caucasians of the same age range; however, the same cohort study did not find any significant association in subgroup analyses of African Americans, Native Hawaiians, and Latinos.144 Another cohort study in the US that recruited only Japanese American men living in Hawaii did not find an association between total calcium intake and colon cancer.151 One cohort study did not find any association in Chinese women (aged 40 to 70 years) living in Shanghai,149
Findings by life stage
-
0 – 6 mo No data
-
7 mo – 2 y No data
-
3 – 8 y One study that followed up children with an interquartile range of age of 4 to 11 years for 65 years found no significant association between total calcium intake at baseline and the risk of colorectal cancer.
-
9 – 18 y Three studies included some children and/or adolescents in this life stage, but no studies adequately evaluated this life stage.
-
19 – 50 y Four studies included people with a mean or median age ranging from 39 to 50 years. No significant association was found between total calcium intake and colorectal cancer risk. Ten additional studies may have included participants in this life stage; however in these studies, no conclusions are possible for the subgroup in this life stage.
-
51 – 70 y One inconclusive meta-analysis of 2 RCTs in adults with previous adenomatous polyps (mean age 59-61 years) found no significant difference in colorectal cancer incidence between those who were and those who were not supplemented at followup. Ten studies included people with a mean or median age ranged from 53 to 69
-
years. An association between higher total calcium intake and lower colorectal cancer risk was found in three studies in men and two studies in women. Another study of women found an association between higher total calcium intake and lower rectal cancer risk. Ten additional studies may also have included participants in this life stage An association between higher total calcium intake and lower colorectal cancer risk was found in two studies in men and two studies in women. However in these studies, the results are inconclusive for the subgroup in this life stage.
-
71+ One study that specifically included people in the retirement community found no association between total calcium intake and colorectal cancer risk. Nine additional studies may have also recruited participants in this life stage; however in these studies, no conclusions are possible for the subgroup in this life stage.
-
Postmenopause One study focused on postmenopausal women. This study found an association between higher calcium intake and lower rectal cancer risk. However, it did not find any association for colon cancer risk.
-
Pregnant & lactating women No data
Table 60. Systematic review of calcium supplementation and colorectal cancer incidence or adenoma recurrence
|
Author Year [PMID] |
Weingarten, 2008139 [18254022] |
|||
|
Design |
Randomized controlled trials: Cochrane Library Issue 2, 2007, the Cochrane Colorectal Cancer Group (CCCG) specialized register, MEDLINE (1966 to July 2007), Cancerlit (1963 to April 2002), Embase (1980 to July 2007) |
|||
|
Population |
Healthy adults and studies of adults at higher risk of colon cancer due to family history, previous adenomatous polyps, or inflammatory bowel disease |
|||
|
Intervention (Exposure) and Comparator |
Calcium (>1200 mg/d) vs. placebo |
|||
|
Results |
Calcium vs. placebo Colorectal cancer incidence: OR 0.34, CI 0.05-2.15, P=0.20 (I2=0%) Colorectal adenoma recurrence: OR 0.74; 95%CI 0.58, 0.95, P=0.02 (I2=0%) At least one adverse event requiring discontinuation: OR 0.93; 95% CI 0.42, 2.05, P=0.80 |
|||
|
Comments |
Based only on two RCTs (1346 participants). Heterogeneity due to different dose of supplementation (one RCT supplemented with 1200 mg/d and the other RCT with 2000 mg/d). Analysis based on fixed effects model; however, considering there are only two studies, random effects model might have been more appropriate. The result of no significant difference in colorectal cancer incidence is inconclusive since there were only 5 colorectal cancer cases during the study period. Analysis on adverse events is based only on reported data of one out of the two RCTs (Barron 1999).160 Only participants with high risk due to previous adenomas were recruited in these two RCTs; therefore, applicability of the results can only be considered for high risk population. Insufficient evidence to recommend the general use of calcium supplements to prevent colorectal adenoma or colorectal cancer |
|||
|
AMSTAR |
||||
|
A priori design? |
X |
Study quality assessment performed? |
X |
|
|
Two independent reviewers? |
X |
Study quality appropriately used in analysis? |
X |
|
|
Comprehensive literature search? |
X |
Appropriate statistical synthesis? |
X |
|
|
All publication types and languages included? |
|
Publication bias assessed? |
|
|
|
Included and excluded studies listed? |
X |
Conflicts of interest stated? |
X |
|
|
Study characteristics provided? |
X |
|
|
|
Table 61. Calcium and colorectal cancer: Characteristics of observational studies
|
Author, Year Trial/Cohort Name Country (Latitude) [Pubmed ID] |
Population |
Dietary Calcium intake |
Comparisons |
Confounders/Effect Modifiers Adjusted |
Comments |
|||||||
|
Nutrients |
Demographic |
Anthrop |
Medical |
Seasons |
Life styles |
|||||||
|
Cohort |
||||||||||||
|
Park, 2009125 NIH-AARP Diet & Health (various) US [19237724] |
• Health status |
Generally healthy men and women |
• Dietary assessment method |
Semi-quantitative FFQ (NCIDHQ) |
CRC across 5 categories of total calcium intake |
X |
X |
X |
X |
|
X |
White Male ~92%; Female -89%; Total Ca (both) |
|
• Mean age range, yr |
50-71 |
|
|
|
|
|
|
|
|
|
||
|
|
• Male (%) |
60 |
• Internal validation? (y/n) |
y |
|
|
|
|
|
|
|
|
|
Wu, 2002140 HPFS NHS (various) US [11904316] |
• Health status |
HPFS: generally healthy male health professional NHS: generally healthy female nurses |
• Dietary assessment method |
HPFS: 131-item semi-quantitative FFQ (by Willet) NHS: 61-item semi-quantitative FFQ (by Willet) |
For HPFS, NHS separately: CRC across 7 categories of cumulative average calcium intake |
X |
X |
X |
X |
|
X |
Total Ca (both) |
|
|
• Mean age (range/SD), yr |
HPFS: 54.4 NHS: 46.6 |
|
|
|
|
|
|
|
|
|
|
|
|
• Male (%) |
HPFS: 100 NHS: 0 |
• Internal validation? (y/n) |
y |
|
|
|
|
|
|
|
|
|
Kesse, 2005141 Etude Epidémiologi que auprès de femmes de l’Education Nationale France (46°N) [15880532] |
• Health status |
Generally healthy women |
• Dietary assessment method |
FFQ |
CRC across total calcium intake quartiles |
X |
X |
X |
|
|
X |
Total Ca (both) |
|
• Mean age (range/SD), yr |
52.7 |
|
|
|
|
|
|
|
|
|
||
|
• Male (%) |
0 |
• Internal validation? (y/n) |
y |
|
|
|
|
|
|
|
|
|
|
Lin, 2005142 WHS US (various) [15800268] |
• Health status |
Generally healthy women |
• Dietary assessment method |
131-item FFQ |
CRC across total calcium intake quintiles |
X |
X |
X |
X |
|
X |
Total Ca (food) |
|
• Mean age (range/SD), yr |
nd |
|
|
|
|
|
|
|
|
|
||
|
|
• Male (%) |
0 |
• Internal validation? (y/n) |
y |
|
|
|
|
|
|
|
|
|
Author, Year Trial/Cohort Name Country (Latitude) [Pubmed ID] |
Population |
Dietary Calcium intake |
Comparisons |
Confounders/Effect Modifiers Adjusted |
Comments |
|||||||
|
Nutrients |
Demographic |
Anthrop |
Medical |
Seasons |
Life styles |
|||||||
|
Pietinen, 1999143 ATBC Finland (~64°N) [10530608] |
• Health status |
Generally healthy men; smokers |
• Dietary assessment method |
276-item FFQ |
CRC across total calcium intake quartiles |
X |
X |
X |
|
|
X |
Total Ca (food) |
|
• Mean age (range/SD), yr |
Median, cases: 60.1; non cases: 57.1 |
|
|
|
|
|
|
|
|
|
|
|
|
|
• Male (%) |
100 |
• Internal validation? (y/n) |
y |
|
|
|
|
|
|
|
|
|
Park, 2007144 The Multiethnic Cohort Study US (various) [17215380] |
• Health status |
Generally healthy men and women |
• Dietary assessment method |
FFQ |
CRC per gender across total calcium intake quintiles |
X |
X |
X |
X |
|
X |
Total Ca (both) |
|
• Mean age (range/SD), yr |
nd |
|
|
|
|
|
|
|
|
|
||
|
• Male (%) |
45 |
• Internal validation? (y/n) |
y |
|
|
|
|
|
|
|
|
|
|
McCullough, 2003145 CPS II US (various) [12708719] |
• Healthstatus |
Generally healthy men and women |
• Dietary assessment method |
68-item semi-quantitative FFQ (modification of the brief Health Habits and History Questionnaire (HHHQ) by Block) |
CRC across total calcium intake quintiles |
X |
X |
X |
X |
|
X |
Total Ca (both) |
|
• Mean age (range/SD), yr |
nd |
|
|
|
|
|
|
|
|
|||
|
|
Subgroup analyses per gender |
|
|
|
|
|
|
|
||||
|
|
|
For men, subgroup analyses per site (colon, rectal) |
||||||||||
|
|
• Male (%) |
48 |
• Internal validation? (y/n) |
y |
|
|
|
|
|
|
|
|
|
Shin, 2006149 Shanghai Women’s Health Study China (31°N) [17019716] |
• Health status |
Generally healthy women |
• Dietary assessment method |
77-item FFQ used in Shanghai Women’s Health Study |
CRC across total calcium intake quintiles |
X |
X |
|
X |
|
X |
Chinese; Total Ca (food) |
|
• Mean age (range/SD), yr |
Cases: 59 (8.5); non-cases: 52 (9.1) |
|
|
|
|
|
|
|
|
|||
|
Subgroup analyses per site (colon, rectal) |
||||||||||||
|
|
• Male (%) |
0 |
• Internal validation? (y/n) |
y |
|
|
|
|
|
|
|
|
|
Author, Year Trial/Cohort Name Country (Latitude) [Pubmed ID] |
Population |
Dietary Calcium intake |
Comparisons |
Confounders/Effect Modifiers Adjusted |
Comments |
|||||||
|
Nutrients |
Demographic |
Anthrop |
Medical |
Seasons |
Life styles |
|||||||
|
Terry, 2002146 Swedish Mammography Screening Cohort Sweden (59°N) [12467133] |
• Health status |
Generally healthy men and women |
• Dietary assesment method |
Self-administered 67-item FFQ |
CRC across total calcium intake quartiles |
X |
X |
X |
|
|
X |
Total Ca (food) |
|
• Mean age (range/SD), yr |
nd |
|
|
|
|
|
|
|
|
|
|
|
|
|
|
|
Subgroup analyses per site (colon, rectal) |
|
|
|
|
|
|
|
||
|
• Male (%) |
0 |
• Internal validation? (y/n) |
y |
|
|
|
|
|
|
|
||
|
|
|
|
|
|
Subgroup analyses per age (< 55 vs. ≥ 55 years old) and site (colon, rectal) |
|
|
|
|
|
|
|
|
Gaard, 1996153 nd Norway (60°-69°N) [9061275] |
• Health status |
Generally healthy men and women |
• Dietary assessment method |
semi-quantitative FFQ (Oslo University) |
Colon cancer per gender across total calcium intake quartiles |
|
X |
X |
|
|
X |
Total Ca (food) |
|
• Mean age (range/SD), yr |
43 |
|
|
|
|
|
|
|
|
|||
|
|
• Male (%) |
49 |
• Internal validation? (y/n) |
y |
|
|
|
|
|
|
|
|
|
Flood, 2005147 The Breast Cancer Detection Demonstration Project (BCDDP) US (various) [15668485] |
• Health status |
Generally healthy women |
• Dietary assessment method |
62-item semi-quantitative FFQ (by Block) |
CRC cancer across total calcium intake quintiles |
X |
X |
X |
X |
|
X |
Total Ca (both) |
|
• Mean age (range/SD), yr |
61.9 |
|
|
|
|
|
|
|
|
|||
|
|
|
Subgroup analyses per site (colon, rectal) |
|
|
|
|
|
|
|
|||
|
• Male (%) |
0 |
• Internal validation? (y/n) |
y |
|
|
|
|
|
|
|
|
|
|
Larsson, 2006148 The Cohort of Swedish Men Sweden (59°N) [16522915] |
• Health status |
Generally healthy men |
• Dietary assessment method |
96-item semi-quantitative FFQ |
CRC across total calcium intake quartiles |
X |
X |
X |
X |
|
X |
Total Ca (both) |
|
• Mean age (range/SD), yr |
60.3 |
|
|
|
|
|
|
|
|
|||
|
|
|
|
Subgroup analyses per site (colon, rectal) |
|
|
|
|
|
|
|
||
|
• Male (%) |
100 |
• Internal validation? (y/n) |
y |
|
|
|
|
|
|
|
||
|
Bostick, 1993150 Iowa Women’s Health Study US (40°N ) [8333412] |
• Health status |
Generally healthy post-menopausal women |
• Dietary assessment method |
127-item semi-quantitative FFQ (by Willet) |
Colon cancer across total calcium intake quintiles |
X |
X |
X |
|
|
|
Same cohort as Zheng 1998; Total Ca (both) |
|
• Mean age (range/SD), yr |
61.5 |
|
|
|
|
|
|
|
|
|
||
|
|
• Male (%) |
0 |
• Internal validation? (y/n) |
y |
|
|
|
|
|
|
|
|
|
Author, Year Trial/Cohort Name Country (Latitude) [Pubmed ID] |
Population |
Dietary Calcium intake |
Comparisons |
Confounders/Effect Modifiers Adjusted |
Comments |
|||||||
|
Nutrients |
Demographic |
Anthrop |
Medical |
Seasons |
Life styles |
|||||||
|
Zheng, 1998152 Iowa Women’s Health Study US (40°N) [9521437] |
• Health status |
Generally healthy post-menopausal women |
• Dietary assessment method |
127-item semi-quantitative FFQ (by Willet) |
Rectal cancer across total calcium intake tertiles |
X |
X |
X |
X |
|
X |
Same cohort as Bostick 1993; Total Ca (both) |
|
• Mean age (range/SD), yr |
61.5 |
|
|
|
|
|
|
|
|
|
||
|
|
• Male (%) |
0 |
• Internal validation? (y/n) |
y |
|
|
|
|
|
|
|
|
|
Kato, 1997155 New York University Women’s Health Study US (various) [9343837] |
• Health status |
Generally healthy women |
• Dietary assessment method |
70-item semi-quantitative FFQ (slightly modified from Block’s) |
CRC across total calcium intake quartiles |
X |
X |
|
|
|
|
Total Ca (food) |
|
• Mean age (range/SD), yr |
nd |
|
|
|
|
|
|
|
|
|
||
|
|
• Male (%) |
0 |
• Internal validation? (y/n) |
y |
|
|
|
|
|
|
|
|
|
Wu, 1987154 US (21°N) [3620314] |
• Health status |
Generally healthy men and women |
• Dietary assessment method |
56-item FFQ |
CRC per gender across total calcium intake tertiles |
|
X |
|
|
|
|
Total Ca (dairy) |
|
• Mean age (range/SD), yr |
nd |
|
|
|
|
|
|
|
|
|
|
|
|
|
• Male (%) |
33 |
• Internal validation? (y/n) |
n |
|
|
|
|
|
|
|
|
|
Jarvinen, 2001157 nd Finland (64°N) [11641750] |
• Health status |
Generally healthy men and women |
• Dietary assessment method |
Diet history |
CRC across total calcium intake quartiles |
X |
X |
X |
|
|
X |
Total Ca (food) |
|
• Mean age (range/SD), yr |
39.1 |
|
|
|
|
|
|
|
|
|
|
|
|
|
|
|
Subgroup analyses per site (colon, rectal) |
|
|
|
|
|
|
|
||
|
|
• Male (%) |
nd |
• Internal validation? (y/n) |
y |
|
|
|
|
|
|
|
|
|
Stemmermann, 1990151 Japan Hawaii Cancer Study US (21°N) [2311461] |
• Health status |
Generally healthy men |
• Dietary assessment method |
24-hour diet recall interview |
Colon cancer across total calcium intake tertiles |
|
X |
|
|
|
|
Japanese; Total Ca (food) |
|
• Mean age (range/SD), yr |
nd |
|
|
|
|
|
|
|
|
|||
|
• Male (%) |
100 |
• Internal validation? (y/n) |
y |
|
|
|
|
|
|
|
|
|
|
Author, Year Trial/Cohort Name Country (Latitude) [Pubmed ID] |
Population |
Dietary Calcium intake |
Comparisons |
Confounders/Effect Modifiers Adjusted |
Comments |
|||||||
|
Nutrients |
Demographic |
Anthrop |
Medical |
Seasons |
Life styles |
|||||||
|
van der Pols, 2007156 The Boyd Orr Cohort UK (54°-55°N) [8333412] |
• Health status |
Generally healthy children |
• Dietary assessment method |
7-day household inventory method |
CRC between lowest and highest total calcium intake groups |
X |
X |
X |
|
|
X |
Total Ca (food) |
|
• Mean age (range/SD), yr |
7.6 |
|
|
|
|
|
|
|
|
|||
|
• Male (%) |
49.5 |
• Internal validation? (y/n) |
n |
|
|
|
|
|
|
|
|
|
|
Garland, 1985158 Western Electric Health Study US (41°N) [2857364] |
• Health status |
Generally healthy men |
• Dietary assessment method |
28-day diet histories |
CRC across total calcium intake quartiles |
X |
X |
X |
|
|
X |
Total Ca (food) |
|
• Mean age (range/SD), yr |
48.7 (4.4) |
|
|
|
|
|
|
|
|
|
||
|
• Male (%) |
100 |
• Internal validation? (y/n) |
n |
|
|
|
|
|
|
|
|
|
|
Nested case-control |
||||||||||||
|
Kampman, 1994159 The Netherlands Cohort Study Netherlands (52°N) [8205538] |
• Health status |
Generally healthy men and women |
• Dietary assessment method |
150-item semi-quantitative FFQ |
CRC across total calcium intake quintiles |
X |
X |
|
X |
|
X |
Total Ca (food) |
|
• Mean age (range/SD), yr |
nd |
|
|
|
|
|
|
|
|
|
|
|
|
• Male (%) |
nd |
• Internal validation? (y/n) |
y |
|
|
|
|
|
|
|
|
|
Table 62. Calcium and colorectal cancer: Results of cohort studies
|
Author Year Study Name Location (Latitude) PMID |
Life Stage |
Outcome (n/N, Incidence) |
Total Ca Intake, mg/day |
No. of Cases |
No. in Category |
Follow up Duration (Time to Dx) |
Adjusted RR |
95% CI |
P for Trend |
Study Quality |
|
Park, 2009125 NIH-AARP Diet & Health US (various) [19237724] |
Male adult (50-71 y) |
CRC (nd) |
526 |
nd |
nd |
84 mo |
1.0 |
Reference |
0.001 |
B |
|
|
|
CRC (nd) |
498 |
nd |
nd |
84 mo |
0.89 |
0.80, 0.98* |
|
|
|
|
|
CRC (nd) |
857 |
nd |
nd |
84 mo |
0.83 |
0.75, 0.93* |
|
|
|
|
|
CRC (nd) |
1073 |
nd |
nd |
84 mo |
0.87 |
0.78, 0.97* |
|
|
|
|
|
CRC (nd) |
1530 |
nd |
nd |
84 mo |
0.79 |
0.70, 0.89* |
|
|
|
|
Female adult (50-71 y) |
CRC (nd) |
494 |
nd |
nd |
84 mo |
1.0 |
Reference |
0.001 |
|
|
|
|
CRC (nd) |
717 |
nd |
nd |
84 mo |
0.87 |
0.75, 1.01 |
|
|
|
|
|
CRC (nd) |
969 |
nd |
nd |
84 mo |
0.83 |
0.71, 0.97* |
|
|
|
|
|
CRC (nd) |
1296 |
nd |
nd |
84 mo |
0.71 |
0.60, 0.84* |
|
|
|
|
|
CRC (nd) |
1881 |
nd |
nd |
84 mo |
0.72 |
0.61, 0.86* |
|
|
|
Wu 2002140 HPFS: Health Professionals Follow-up Study NHS: Nurses’ Health Study US (various) [11904316] |
Male adult (40-75 y) |
CRC (nd) |
≤ 500 |
47 |
nd |
nd |
1.0 |
Reference |
0.17 |
B |
|
|
|
CRC (nd) |
501-600 |
48 |
nd |
nd |
0.69 |
0.46, 1.04 |
|
|
|
|
|
CRC (nd) |
601-700 |
58 |
nd |
nd |
0.69 |
0.47, 1.01 |
|
|
|
|
|
CRC (nd) |
701-800 |
51 |
nd |
nd |
0.60 |
0.40, 0.90* |
|
|
|
|
|
CRC (nd) |
801-1000 |
81 |
nd |
nd |
0.67 |
0.47, 0.97* |
|
|
|
|
|
CRC (nd) |
1001-1250 |
84 |
nd |
nd |
0.62 |
0.42, 0.92* |
|
|
|
|
|
CRC (nd) |
>1250 |
60 |
nd |
nd |
0.64 |
0.43, 0.95* |
|
|
|
|
Female adult (30-55 y) |
CRC (nd) |
≤ 500 |
70 |
nd |
nd |
1.0 |
Reference |
0.35 |
|
|
|
|
CRC (nd) |
501-600 |
79 |
nd |
nd |
1.19 |
0.86, 1.64 |
|
|
|
|
|
CRC (nd) |
601-700 |
83 |
nd |
nd |
1.07 |
0.77, 1.47 |
|
|
|
|
|
CRC (nd) |
701-800 |
90 |
nd |
nd |
1.18 |
0.86, 1.63 |
|
|
|
|
|
CRC (nd) |
801-1000 |
130 |
nd |
nd |
1.04 |
0.77, 1.40 |
|
|
|
|
|
CRC (nd) |
1001-1250 |
106 |
nd |
nd |
1.05 |
0.77, 1.44 |
|
|
|
|
|
CRC (nd) |
>1250 |
68 |
nd |
nd |
0.94 |
0.66, 1.33 |
|
|
|
Author Year Study Name Location (Latitude) PMID |
Life Stage |
Outcome (n/N, Incidence) |
Total Ca Intake, mg/day |
No. of Cases |
No. in Category |
Follow up Duration (Time to Dx) |
Adjusted RR |
95% CI |
P for Trend |
Study Quality |
|
Kesse 2005141 Etude Epidémiologique auprès de femmes de l’Education Nationale France (46°N) [15880532] |
Female adult (40-65 y) |
CRC (nd) |
<766.22 |
163 |
nd |
82.8 mo |
1.0 |
Reference |
0.08 |
B |
|
|
|
CRC (nd) |
766.22-962.63 |
154 |
nd |
82.8 mo |
0.94 |
0.63, 1.41 |
|
|
|
|
|
CRC (nd) |
962.63-1201.81 |
150 |
nd |
82.8 mo |
0.78 |
0.51, 1.19 |
|
|
|
|
|
CRC (nd) |
> 1201.81 |
131 |
nd |
82.8 mo |
0.72 |
0.47, 1.10 |
|
|
|
Lin 2005142 The Women’s Health Study US (various) [15800268] |
Female adult (≥ 45 y) |
CRC (41/7691; 0.01) |
<614 |
41 |
7691 |
120 mo |
1.0 |
Reference |
0.21 |
B |
|
|
|
CRC (nd) |
614-785 |
31 |
nd |
120 mo |
0.74 |
0.46, 1.18 |
|
|
|
|
|
CRC (0.01) |
785-1016 |
52 |
7690 |
120 mo |
1.19 |
0.78, 1.81 |
|
|
|
|
|
CRC (nd) |
1016-1357 |
41 |
nd |
120 mo |
0.92 |
0.58, 1.44 |
|
|
|
|
|
CRC (58/7690; 0.01) |
> 1357 |
58 |
7690 |
120 mo |
1.20 |
0.79, 1.85 |
|
|
|
Pietinen 1999143 ATBC Finland (~64°N) [10530608] |
Male adult (50-69 y) |
CRC (nd) |
Median Q1, 856 |
60 |
nd |
96 mo |
1.0 |
Reference |
0.04 |
B |
|
|
|
CRC (nd) |
Median Q2, 1241 |
41 |
nd |
96 mo |
0.7 |
0.5, 1.0 |
|
|
|
|
|
CRC (nd) |
Median Q3, 1484 |
45 |
nd |
96 mo |
0.7 |
0.5, 1.1 |
|
|
|
|
|
CRC (nd) |
Median Q4, 1789 |
39 |
nd |
96 mo |
0.6 |
0.6, 0.9* |
|
|
|
Author Year Study Name Location (Latitude) PMID |
Life Stage |
Outcome (n/N, Incidence) |
Total Ca Intake, mg/day |
No. of Cases |
No. in Category |
Follow up Duration (Time to Dx) |
Adjusted RR |
95% CI |
P for Trend |
Study Quality |
|
Park 2007144 The Multiethnic Cohort Study US (various) [17215380] |
Male adult (45-75 y) |
CRC (nd) |
< 288 /1000 kcal |
342 |
nd |
87.6 mo |
1.0 |
Reference |
0.006 |
C |
|
|
|
CRC (nd) |
288-369 /1000 kcal |
271 |
nd |
87.6 mo |
1.02 |
0.86, 1.22 |
|
|
|
|
|
CRC (nd) |
369-457 /1000 kcal |
258 |
nd |
87.6 mo |
1.08 |
0.89, 1.31 |
|
|
|
|
|
CRC (nd) |
457-611 /1000 kcal |
177 |
nd |
87.6 mo |
0.85 |
0.68, 1.07 |
|
|
|
|
|
CRC (nd) |
611 /1000 kcal |
90 |
nd |
87.6 mo |
0.70 |
0.52, 0.93* |
|
|
|
|
Female adult (45-75 y) |
CRC (nd) |
< 288 /1000 kcal |
172 |
nd |
87.6 mo |
1.0 |
Reference |
0.003 |
|
|
|
|
CRC (nd) |
288-369 /1000 kcal |
175 |
nd |
87.6 mo |
0.77 |
0.60, 0.97* |
|
|
|
|
|
CRC (nd) |
369-457 /1000 kcal |
194 |
nd |
87.6 mo |
0.76 |
0.60, 0.97* |
|
|
|
|
|
CRC (nd) |
457-611 /1000 kcal |
197 |
nd |
87.6 mo |
0.74 |
0.57, 0.94* |
|
|
|
|
|
CRC (nd) |
611 /1000 kcal |
234 |
nd |
87.6 mo |
0.64 |
0.50, 0.83* |
|
|
|
McCullough 2003145 CPS II US (various) [12708719] |
Adult (50-74 y) |
CRC (nd) |
<561 |
156 |
nd |
nd |
1.0 |
Reference |
0.02 |
C |
|
|
|
CRC (nd) |
561-731 |
165 |
nd |
nd |
1.05 |
0.84, 1.31 |
|
|
|
|
|
CRC (nd) |
732-925 |
137 |
nd |
nd |
0.88 |
0.70, 1.12 |
|
|
|
|
|
CRC (nd) |
926-1255 |
108 |
nd |
nd |
0.72 |
0.56, 0.93* |
|
|
|
|
|
CRC (nd) |
>1255 |
117 |
nd |
nd |
0.87 |
0.67, 1.12 |
|
|
|
|
Male adult (50-74 y) |
CRC (nd) |
<561 |
89 |
nd |
nd |
1.0 |
Reference |
0.04 |
|
|
|
|
CRC (nd) |
561-731 |
106 |
nd |
nd |
1.01 |
0.76, 1.34 |
|
|
|
|
|
CRC (nd) |
732-925 |
98 |
nd |
nd |
0.93 |
0.70, 1.25 |
|
|
|
|
|
CRC (nd) |
926-1255 |
70 |
nd |
nd |
0.71 |
0.52, 0.98* |
|
|
|
|
|
CRC (nd) |
>1255 |
58 |
nd |
nd |
0.82 |
0.58, 1.16 |
|
|
|
Author Year Study Name Location (Latitude) PMID |
Life Stage |
Outcome (n/N, Incidence) |
Total Ca Intake, mg/day |
No. of Cases |
No. in Category |
Follow up Duration (Time to Dx) |
Adjusted RR |
95% CI |
P for Trend |
Study Quality |
|
|
|
Colon cancer (nd) |
<561 |
64 |
nd |
nd |
1.0 |
Reference |
0.02 |
|
|
|
|
Colon cancer (nd) |
561-731 |
82 |
nd |
nd |
1.08 |
0.77, 1.50* |
|
|
|
|
|
Colon cancer (nd) |
732-925 |
67 |
nd |
nd |
0.89 |
0.63, 1.27* |
|
|
|
|
|
Colon cancer (nd) |
926-1255 |
51 |
nd |
nd |
0.72 |
0.49, 1.05* |
|
|
|
|
|
Colon cancer (nd) |
>1255 |
38 |
nd |
nd |
0.74 |
0.49, 1.12* |
|
|
|
|
|
Rectal cancer (nd) |
<561 |
23 |
nd |
nd |
1.0 |
Reference |
0.71 |
|
|
|
|
Rectal cancer (nd) |
561-731 |
22 |
nd |
nd |
0.78 |
0.43, 1.41 |
|
|
|
|
|
Rectal cancer (nd) |
732-925 |
29 |
nd |
nd |
1.02 |
0.58, 1.79 |
|
|
|
|
|
Rectal cancer (nd) |
926-1255 |
16 |
nd |
nd |
0.60 |
0.31, 1.16 |
|
|
|
|
|
Rectal cancer (nd) |
>1255 |
19 |
nd |
nd |
1.01 |
0.53, 1.93 |
|
|
|
|
Female adult (50-74 y) |
CRC (nd) |
<561 |
67 |
nd |
nd |
1.0 |
Reference |
0.31 |
|
|
|
|
CRC (nd) |
561-731 |
59 |
nd |
nd |
1.16 |
0.82, 1.66 |
|
|
|
|
|
CRC (nd) |
732-925 |
39 |
nd |
nd |
0.80 |
0.54, 1.21 |
|
|
|
|
|
CRC (nd) |
926-1255 |
38 |
nd |
nd |
0.78 |
0.51, 1.18 |
|
|
|
|
|
CRC (nd) |
>1255 |
59 |
nd |
nd |
0.94 |
0.63, 1.39 |
|
|
|
Shin 2006149 Shanghai Women’s Health Study China (31°N) [17019716] |
Female adult (40-70) |
CRC (nd) |
≤ 291.9 |
nd |
nd |
Median, 68.9 mo |
1.0 |
Reference |
0.48 |
C |
|
|
|
CRC (nd) |
≤ 389.9 |
nd |
nd |
Median, 68.9 mo |
1.0 |
0.7, 1.4 |
|
|
|
|
|
CRC (nd) |
≤ 488.2 |
nd |
nd |
Median, 68.9 mo |
1.0 |
0.7, 1.4 |
|
|
|
|
|
CRC (nd) |
≤ 610.8 |
nd |
nd |
Median, 68.9 mo |
0.9 |
0.6, 1.3 |
|
|
|
|
|
CRC (nd) |
> 610.8 |
nd |
nd |
Median, 68.9 mo |
0.9 |
0.6, 1.3 |
|
|
|
Author Year Study Name Location (Latitude) PMID |
Life Stage |
Outcome (n/N, Incidence) |
Total Ca Intake, mg/day |
No. of Cases |
No. in Category |
Follow up Duration (Time to Dx) |
Adjusted RR |
95% CI |
P for Trend |
Study Quality |
|
Terry 2002146 Swedish Mammography Screening Cohort Sweden (59°N) [12467133] |
Female adult (≤ 76 y) |
CRC (nd) |
Mean (SD) Q1, 486 (79) |
156 |
nd |
135.6 mo |
1.0 |
Reference |
0.02 |
C |
|
|
|
CRC (nd) |
Mean (SD) Q2, 631 (34) |
149 |
nd |
135.6 mo |
0.97 |
0.77, 1.21 |
|
|
|
|
|
CRC (nd) |
Mean (SD) Q3, 747 (37) |
145 |
nd |
135.6 mo |
0.95 |
0.75, 1.20 |
|
|
|
|
|
CRC (nd) |
Mean (SD) Q4, 914 (136) |
122 |
nd |
135.6 mo |
0.72 |
0.56, 0.93* |
|
|
|
|
|
Colon cancer (nd) |
Mean (SD) Q1, 486 (79) |
100 |
nd |
135.6 mo |
1.0 |
Reference |
0.06 |
|
|
|
|
Colon cancer (nd) |
Mean (SD) Q2, 631 (34) |
97 |
nd |
135.6 mo |
0.97 |
0.74, 1.30 |
|
|
|
|
|
Colon cancer (nd) |
Mean (SD) Q3, 747 (37) |
92 |
nd |
135.6 mo |
0.93 |
0.70, 1.24 |
|
|
|
|
|
Colon cancer (nd) |
Mean (SD) Q4, 914 (136) |
82 |
nd |
135.6 mo |
0.74 |
0.54, 1.01 |
|
|
|
|
|
Rectal cancer (nd) |
Mean (SD) Q1, 486 (79) |
55 |
nd |
135.6 mo |
1.0 |
Reference |
0.12 |
|
|
|
|
Rectal cancer (nd) |
Mean (SD) Q2, 631 (34) |
48 |
nd |
135.6 mo |
0.89 |
0.60, 1.32 |
|
|
|
|
|
Rectal cancer (nd) |
Mean (SD) Q3, 747 (37) |
49 |
nd |
135.6 mo |
0.94 |
0.63, 1.39 |
|
|
|
|
|
Rectal cancer (nd) |
Mean (SD) Q4, 914 (136) |
39 |
nd |
135.6 mo |
0.70 |
0.45, 1.09 |
|
|
|
|
Female adult (< 55 y) |
CRC (nd) |
176-568 |
nd |
nd |
135.6 mo |
1.0 |
Reference |
0.77 |
|
|
|
|
CRC (nd) |
568-688 |
nd |
nd |
135.6 mo |
1.06 |
0.68, 1.66 |
|
|
|
|
|
CRC (nd) |
688-816 |
nd |
nd |
135.6 mo |
1.11 |
0.71, 1.73 |
|
|
|
|
|
CRC (nd) |
816-1300 |
nd |
nd |
135.6 mo |
0.91 |
0.56, 1.48 |
|
|
|
|
Female adult (≥ 55 y) |
CRC (nd) |
176-568 |
nd |
nd |
135.6 mo |
1.0 |
Reference |
0.008 |
|
|
|
|
CRC (nd) |
568-688 |
nd |
nd |
135.6 mo |
0.93 |
0.71, 1.21 |
|
|
|
|
|
CRC (nd) |
688-816 |
nd |
nd |
135.6 mo |
0.89 |
0.68, 1.17 |
|
|
|
|
|
CRC (nd) |
816-1300 |
nd |
nd |
135.6 mo |
0.66 |
0.49, 0.89* |
|
|
|
|
Female adult (< 55 y) |
Colon cancer (nd) |
176-568 |
nd |
nd |
135.6 mo |
1.0 |
Reference |
0.92 |
|
|
|
|
Colon cancer (nd) |
568-688 |
nd |
nd |
135.6 mo |
1.32 |
0.75 2.30 |
|
|
|
|
|
Colon cancer (nd) |
688-816 |
nd |
nd |
135.6 mo |
1.02 |
0.55, 1.85 |
|
|
|
|
|
Colon cancer (nd) |
816-1300 |
nd |
nd |
135.6 mo |
1.11 |
0.60, 2.05 |
|
|
|
Author Year Study Name Location (Latitude) PMID |
Life Stage |
Outcome (n/N, Incidence) |
Total Ca Intake, mg/day |
No. of Cases |
No. in Category |
Follow up Duration (Time to Dx) |
Adjusted RR |
95% CI |
P for Trend |
Study Quality |
|
|
Female adult (≥ 55 y) |
Colon cancer (nd) |
176-568 |
nd |
nd |
135.6 mo |
1.0 |
Reference |
0.02 |
|
|
|
|
Colon cancer (nd) |
568-688 |
nd |
nd |
135.6 mo |
0.89 |
0.64, 1.23 |
|
|
|
|
|
Colon cancer (nd) |
688-816 |
nd |
nd |
135.6 mo |
0.91 |
0.65, 1.26 |
|
|
|
|
|
Colon cancer (nd) |
816-1300 |
nd |
nd |
135.6 mo |
0.64 |
0.44, 0.92* |
|
|
|
|
Female adult (< 55 y) |
Rectal cancer (nd) |
176-568 |
nd |
nd |
135.6 mo |
1.0 |
Reference |
0.75 |
|
|
|
|
Rectal cancer (nd) |
568-688 |
nd |
nd |
135.6 mo |
0.33 |
0.34, 1.59 |
|
|
|
|
|
Rectal cancer (nd) |
688-816 |
nd |
nd |
135.6 mo |
1.30 |
0.66, 2.56 |
|
|
|
|
|
Rectal cancer (nd) |
816-1300 |
nd |
nd |
135.6 mo |
0.70 |
0.31, 1.62 |
|
|
|
|
Female adult (≥ 55 y) |
Rectal cancer (nd) |
176-568 |
nd |
nd |
135.6 mo |
1.0 |
Reference |
0.15 |
|
|
|
|
Rectal cancer (nd) |
568-688 |
nd |
nd |
135.6 mo |
0.96 |
0.61, 1.52 |
|
|
|
|
|
Rectal cancer (nd) |
688-816 |
nd |
nd |
135.6 mo |
0.79 |
0.48, 1.29 |
|
|
|
|
|
Rectal cancer (nd) |
816-1300 |
nd |
nd |
135.6 mo |
0.70 |
0.42, 1.19 |
|
|
|
Gaard 1996153 Norway (60°-69°N) [9061275] |
Male adult (20-53 y) |
Colon cancer (nd) |
<758 |
22 |
nd |
134.4 mo |
1.0 |
Reference |
0.15 |
C |
|
|
|
Colon cancer (nd) |
759-912 |
24 |
nd |
134.4 mo |
1.02 |
0.57, 1.83 |
|
|
|
|
|
Colon cancer (nd) |
913-1066 |
24 |
nd |
134.4 mo |
1.04 |
0.58, 1.86 |
|
|
|
|
|
Colon cancer (nd) |
>1067 |
13 |
nd |
134.4 mo |
0.57 |
0.29, 1.13 |
|
|
|
|
Female adult (20-53 y) |
Colon cancer (nd) |
<527 |
15 |
nd |
134.4 mo |
1.0 |
Reference |
0.94 |
|
|
|
|
Colon cancer (nd) |
528-628 |
20 |
nd |
134.4 mo |
1.25 |
0.63, 2.46 |
|
|
|
|
|
Colon cancer (nd) |
629-743 |
7 |
nd |
134.4 mo |
0.46 |
0.19,1.12 |
|
|
|
|
|
Colon cancer (nd) |
>744 |
18 |
nd |
134.4 mo |
1.20 |
0.60, 2.39 |
|
|
|
Author Year Study Name Location (Latitude) PMID |
Life Stage |
Outcome (n/N, Incidence) |
Total Ca Intake, mg/day |
No. of Cases |
No. in Category |
Follow up Duration (Time to Dx) |
Adjusted RR |
95% CI |
P for Trend |
Study Quality |
|
Flood 2005147 The Breast Cancer Detection Demonstration Project (BCDDP) US (various) [15668485] |
Female adult (nd) |
CRC (nd) |
<472 |
102 |
nd |
17 mo |
1.0 |
Reference |
0.02 |
C |
|
|
|
CRC (nd) |
472-635 |
110 |
nd |
17 mo |
1.03 |
0.79, 1.35 |
|
|
|
|
|
CRC (nd) |
636-844 |
86 |
nd |
17 mo |
0.80 |
0.60, 1.06 |
|
|
|
|
|
CRC (nd) |
845-1270 |
106 |
nd |
17 mo |
0.96 |
0.73, 1.26 |
|
|
|
|
|
CRC (nd) |
>1270 |
80 |
nd |
17 mo |
0.74 |
0.55, 0.99* |
|
|
|
|
|
Colon cancer (nd) |
<472 |
nd |
nd |
17 mo |
1.0 |
Reference |
0.10 |
|
|
|
|
Colon cancer (nd) |
472-635 |
nd |
nd |
17 mo |
0.84 |
0.59, 1.18 |
|
|
|
|
|
Colon cancer (nd) |
636-844 |
nd |
nd |
17 mo |
0.66 |
0.46, 0.96* |
|
|
|
|
|
Colon cancer (nd) |
845-1270 |
nd |
nd |
17 mo |
0.78 |
0.55, 1.11 |
|
|
|
|
|
Colon cancer (nd) |
>1270 |
nd |
nd |
17 mo |
0.69 |
0.48, 0.99* |
|
|
|
|
|
Rectal cancer (nd) |
<472 |
nd |
nd |
17 mo |
1.0 |
Reference |
0.30 |
|
|
|
|
Rectal cancer (nd) |
472-635 |
nd |
nd |
17 mo |
1.19 |
0.57, 2.48 |
|
|
|
|
|
Rectal cancer (nd) |
636-844 |
nd |
nd |
17 mo |
1.10 |
0.52, 2.32 |
|
|
|
|
|
Rectal cancer (nd) |
845-1270 |
nd |
nd |
17 mo |
1.23 |
0.60, 2.53 |
|
|
|
|
|
Rectal cancer (nd) |
>1270 |
nd |
nd |
17 mo |
0.93 |
0.43, 2.01 |
|
|
|
Larsson 2006148 The Cohort of Swedish Men Sweden (59°N) [16522915] |
Male adult (45-79 y) |
CRC (111/11,341; 0.011) |
<956 |
127 |
11,348 |
80.4 mo |
1.0 |
Reference |
0.01 |
C |
|
|
|
CRC (107/11295; 0.010) |
956-1179 |
111 |
11,341 |
80.4 mo |
0.80 |
0.61, 1.04 |
|
|
|
|
|
CRC (104/11,322; 0.009) |
1180-1444 |
107 |
11,295 |
80.4 mo |
0.73 |
0.56, 0.96* |
|
|
|
|
|
CRC (67/11,322; 0.009) |
>1445 |
104 |
11,322 |
80.4 mo |
0.68 |
0.51, 0.91* |
|
|
|
|
|
Colon cancer (77/11,348; 0.006) |
<956 |
67 |
11,322 |
80.4 mo |
0.72 |
0.50, 1.04 |
0.15 |
|
|
|
|
Colon cancer (70/11,295; 0.007) |
956-1179 |
77 |
11,348 |
80.4 mo |
1.0 |
Reference |
|
|
|
Author Year Study Name Location (Latitude) PMID |
Life Stage |
Outcome (n/N, Incidence) |
Total Ca Intake, mg/day |
No. of Cases |
No. in Category |
Follow up Duration (Time to Dx) |
Adjusted RR |
95% CI |
P for Trend |
Study Quality |
|
|
|
Colon cancer (67/11,322; 0.006) |
1180-1444 |
70 |
11,295 |
80.4 mo |
0.80 |
0.57, 1.12 |
|
|
|
|
|
Colon cancer (50/11,348; 0.006) |
>1445 |
67 |
11,322 |
80.4 mo |
0.72 |
0.50, 1.04 |
|
|
|
|
|
Rectal cancer (49/11,341; 0.004) |
<956 |
50 |
11,348 |
80.4 mo |
1.0 |
Reference |
0.02 |
|
|
|
|
Rectal cancer (37/11,295; 0.004) |
956-1179 |
49 |
11,341 |
80.4 mo |
0.91 |
0.61, 1.37 |
|
|
|
|
|
Rectal cancer (37/11,322; 0.003) |
1180-1444 |
37 |
11,295 |
80.4 mo |
0.63 |
0.40, 0.98* |
|
|
|
|
|
Rectal cancer (37/11,322; 0.003) |
>1445 |
37 |
11,322 |
80.4 mo |
0.61 |
0.38, 0.98* |
|
|
|
Bostick 1993150 Iowa Women’s Health Study US (40°N) [8333412] |
Female adult (55-69 y) |
Colon cancer (nd) |
<629 |
54 |
nd |
nd |
1.0 |
Reference |
0.22 |
|
|
|
|
Colon cancer (nd) |
629-896 |
44 |
nd |
nd |
0.89 |
0.59, 1.33 |
|
|
|
|
|
Colon cancer (nd) |
897-1188 |
42 |
nd |
nd |
0.88 |
0.58, 1.33 |
|
|
|
|
|
Colon cancer (nd) |
1189-1547 |
44 |
nd |
nd |
0.97 |
0.63, 1.50 |
|
|
|
|
|
Colon cancer (nd) |
>1548 |
28 |
nd |
nd |
0.68 |
0.41, 1.11 |
|
|
|
Zheng 1998152 Iowa Women’s Health Study US (40°N) [9521437] |
Female adult, (55-69 y) |
Rectal cancer (nd) |
<800.8 |
56 |
nd |
108 mo |
1.0 |
Reference |
0.02 |
C |
|
|
|
Rectal cancer (nd) |
800.8-1278.7 |
52 |
nd |
108 mo |
0.90 |
0.61, 1.33 |
|
|
|
|
|
Rectal cancer (nd) |
≥1278.7 |
36 |
nd |
108 mo |
0.59 |
0.37, 0.94* |
|
|
|
Author Year Study Name Location (Latitude) PMID |
Life Stage |
Outcome (n/N, Incidence) |
Total Ca Intake, mg/day |
No. of Cases |
No. in Category |
Follow up Duration (Time to Dx) |
Adjusted RR |
95% CI |
P for Trend |
Study Quality |
|
Kato 1997155 New York University Women’s Health Study US (various) [9343837] |
Female adult (34-65 y) |
CRC (nd) |
Lowest, Q1 (nd) |
nd |
nd |
85.2 mo |
1.0 |
Reference |
0.18 |
C |
|
|
|
CRC (nd) |
Q2 (nd) |
nd |
nd |
85.2 mo |
1.15 |
0.67, 1.95 |
|
|
|
|
|
CRC (nd) |
Q3 (nd) |
nd |
nd |
85.2 mo |
0.90 |
0.52, 1.57 |
|
|
|
|
|
CRC (nd) |
Highest Q4 (nd) |
nd |
nd |
85.2 mo |
0.71 |
0.39, 1.28 |
|
|
|
Wu 1987154 US (21°N) [3620314] |
Male adult (nd) |
CRC (nd) |
Low tertile (nd) |
nd |
nd |
nd |
1.0 |
Reference |
ns |
C |
|
|
|
CRC (nd) |
Medium tertile (nd) |
nd |
nd |
nd |
1.19 |
0.6, 2.2 |
|
|
|
|
|
CRC (nd) |
High tertile (nd) |
nd |
nd |
nd |
0.86 |
0.4, 1.7 |
|
|
|
|
Female adult (nd) |
CRC (nd) |
Low tertile (nd) |
nd |
nd |
nd |
1.0 |
Reference |
ns |
|
|
|
|
CRC (nd) |
Medium tertile (nd) |
nd |
nd |
nd |
0.9 |
0.5, 1.6 |
|
|
|
|
|
CRC (nd) |
High tertile (nd) |
nd |
nd |
nd |
0.89 |
0.5, 1.6 |
|
|
|
Jarvinen 2001157 Finland (64°N) [11641750] |
Adolescent and adult (> 15 y) |
CRC (nd) |
Male: <1178.2 Female: <862.5 |
20 |
nd |
235.2 mo |
1.0 |
Reference |
0.97 |
C |
|
|
|
CRC (nd) |
Male: 1178.2-1557.1 Female: 862.5-1110.7 |
19 |
nd |
235.2 mo |
1.17 |
0.60, 2.27 |
|
|
|
|
|
CRC (nd) |
Male: 1557.2-1953.2 Female: 1110.8-1416.6 |
18 |
nd |
235.2 mo |
1.37 |
0.67, 2.81 |
|
|
|
|
|
CRC (nd) |
Male: > 1953.3 Female: > 1416.7 |
15 |
nd |
235.2 mo |
1.43 |
0.61, 3.39 |
|
|
|
Author Year Study Name Location (Latitude) PMID |
Life Stage |
Outcome (n/N, Incidence) |
Total Ca Intake, mg/day |
No. of Cases |
No. in Category |
Follow up Duration (Time to Dx) |
Adjusted RR |
95% CI |
P for Trend |
Study Quality |
|
|
|
Colon cancer (nd) |
Male: <1178.2 Female: <862.5 |
10 |
nd |
235.2 mo |
1.0 |
Reference |
0.17 |
|
|
|
|
Colon cancer (nd) |
Male: 1178.2-1557.1 Female: 862.5-1110.7 |
14 |
nd |
235.2 mo |
1.44 |
0.61, 3.39 |
|
|
|
|
|
Colon cancer (nd) |
Male: 1557.2-1953.2 Female: 1110.8-1416.6 |
9 |
nd |
235.2 mo |
1.04 |
0.38, 2.83 |
|
|
|
|
|
Colon cancer (nd) |
Male: > 1953.3 Female: > 1416.7 |
5 |
nd |
235.2 mo |
0.63 |
0.17, 2.35 |
|
|
|
|
|
Rectal cancer (nd) |
Male: <1178.2 Female: <862.5 |
10 |
nd |
235.2 mo |
1.0 |
Reference |
0.19 |
|
|
|
|
Rectal cancer (nd) |
Male: 1178.2-1557.1 Female: 862.5-1110.7 |
5 |
nd |
235.2 mo |
0.77 |
0.25, 2.37 |
|
|
|
|
|
Rectal cancer (nd) |
Male: 1557.2-1953.2 Female: 1110.8-1416.6 |
9 |
nd |
235.2 mo |
1.88 |
0.67, 5.30 |
|
|
|
|
|
Rectal cancer (nd) |
Male: > 1953.3 Female: > 1416.7 |
10 |
nd |
235.2 mo |
3.01 |
0.93, 9.73 |
|
|
Author Year Study Name Location (Latitude) PMID |
Life Stage |
Outcome (n/N, Incidence) |
Total Ca Intake, mg/day |
No. of Cases |
No. in Category |
Follow up Duration (Time to Dx) |
Adjusted RR |
95% CI |
P for Trend |
Study Quality |
|
Stemmermann 1990151 Japan Hawaii Cancer Study US (21°N) [2311461] |
Male adult (nd) |
Colon cancer (74/2466; 0.02) |
Low (nd) |
74 |
2466 |
nd |
1.3 |
0.9, 1.8 |
0.16 |
C |
|
|
|
Colon cancer (57/2456; 0.02) |
Medium (nd) |
57 |
2456 |
nd |
1.0 |
0.7, 1.4 |
|
|
|
|
|
Colon cancer (58/2461; 0.03) |
High (nd) |
58 |
2461 |
nd |
1.0 |
Reference |
|
|
|
van der Pols 2007156 The Boyd Orr Cohort UK (54°-55°N) [8333412] |
Children (IQR 4-11 y) |
CRC (nd) |
Lowest Q1, (nd) |
nd |
nd |
nd |
1.0 |
Reference |
0.18 |
C |
|
|
|
CRC (nd) |
Highest Q4, (nd) |
nd |
nd |
nd |
1.91 |
0.84, 4.32 |
|
|
|
Garland 1985158 Western Electric Health Study US (41°N) [2857364] |
Male adult (40-55 y) |
CRC (19/488; 0.04) |
102-241/1000 kcal |
19 |
488 |
nd |
nd |
nd |
nd |
C |
|
|
|
CRC (12/489; 0.02) |
242-306/1000kcal |
12 |
489 |
nd |
nd |
nd |
|
|
|
|
|
CRC (12/489; 0.02) |
307-383/1000 kcal |
12 |
489 |
nd |
nd |
nd |
|
|
|
|
|
CRC (6/458; 0.01) |
384-906/1000 kcal |
6 |
458 |
nd |
nd |
nd |
|
|
Table 63. Calcium and colorectal cancer: Results of nested case-control studies
|
Author Year Study Name Location (Latitude) PMID |
Life Stage |
Outcome (n/Incidence) |
Total Ca Intake, mg/day |
No. of Cases |
No. in Category |
Follow up Duration (Time to Dx) |
Adjusted RR |
95% CI |
P for Trend |
Study Quality |
|
Kampman 1994159 Netherlands Cohort Study Netherlands (52° N) [8205538] |
Adult (55-69 y) |
CRC (443/3111, 0.14) |
Median Q1, 596 |
98 |
623 |
39.6 mo |
1.0 |
Reference |
0.89 |
B |
|
|
|
|
Median Q2, 768 |
89 |
619 |
39.6 mo |
0.83 |
0.58, 1.22 |
|
|
|
|
|
|
Median Q3, 893 |
87 |
622 |
39.6 mo |
0.96 |
0.67, 1.39 |
|
|
|
|
|
|
Median Q4, 1032 |
81 |
627 |
39.6 mo |
0.93 |
0.64, 1.36 |
|
|
|
|
|
|
Median Q5, 1288 |
88 |
620 |
39.6 mo |
0.92 |
0.64, 1.34 |
|
|
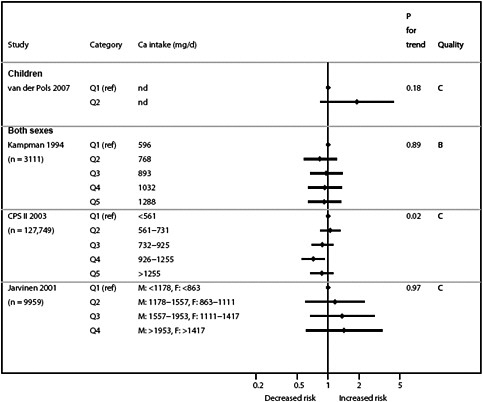
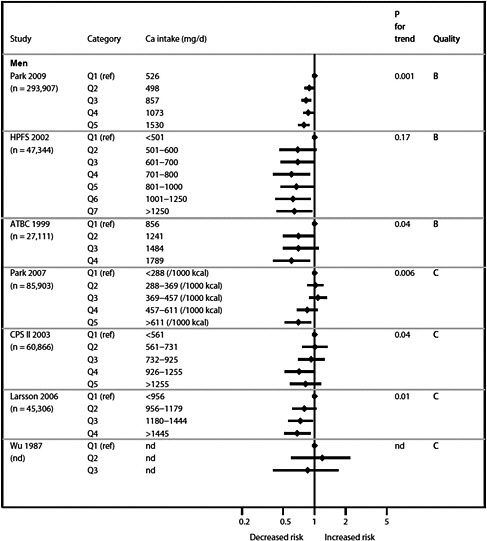
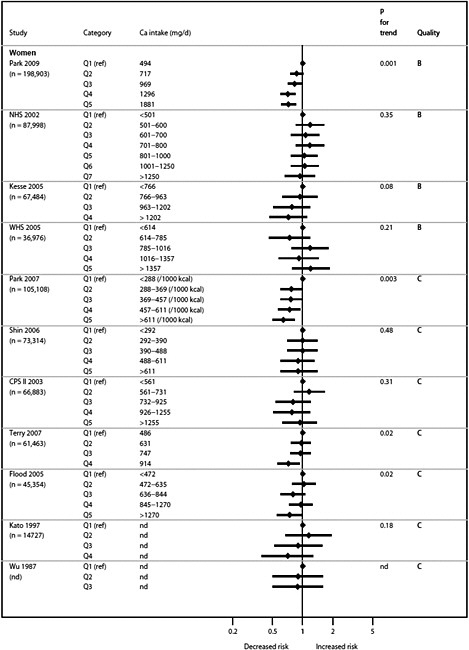
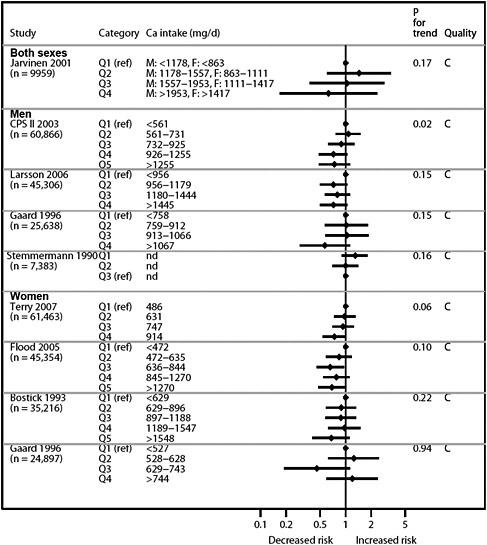
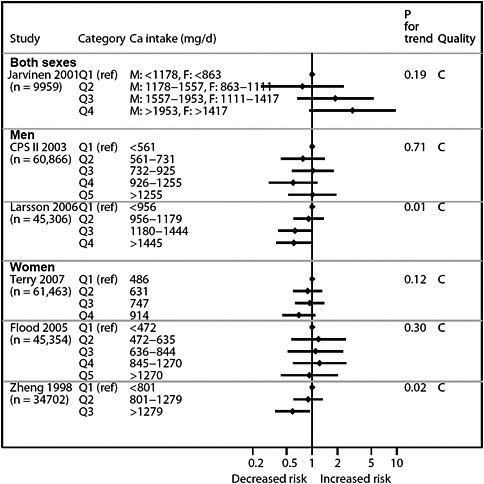
Colorectal adenoma
Synopsis
This synopsis is based on one systematic review, two comparative trials (one post hoc followup study of an RCT and one nonrandomized trial), and four cohort studies. The systematic review that included two RCTs which evaluated high risk population for the prevention of colorectal adenoma recurrence showed a reduction in the risk of colorectal adenoma with calcium supplementation (OR 0.74, 95 % CI 0.58, 0.95; P=0.02). The B quality long-term followup study of an RCT of calcium supplementation (1200 mg/d) versus placebo in healthy adults showed no significant difference in the risk of recurrence of colorectal adenoma. The nonrandomized comparative trial (methodological quality C) also found a significant reduction in adenoma recurrence risk among healthy adults who received calcium supplementation. Among four cohort studies (methodological quality B), two found an inverse association between total calcium intake and the risk of colorectal adenoma, while the others found no significant association.
Detailed presentation (Tables 64, 65, 66, 67 & 68; Figure 19)
One systematic review included two RCTs that recruited high risk population for colorectal adenoma due to previous adenomatous polyps.139 A total of 1346 participants were analyzed for the effect of calcium supplementation (1200 to 2000 mg elemental calcium daily). The odds ratio of colorectal adenoma recurrence was 0.74 (95 % CI 0.58, 0.95; P=0.02), comparing calcium supplementation to the placebo. A B quality post hoc followup analysis161 of one of the two RCTs that were included in the meta-analysis examined the long-term effect of calcium supplementation to prevent colorectal adenoma recurrence. The trial recruited participants with previous colorectal adenoma, and compared the preventative efficacy of calcium supplementation (1200 mg/d) to placebo. Adenoma recurrence at 4 years was the original primary outcome. During the followup period after the trial treatment, about 50% of participants in both groups took some calcium supplements. In 347 participants who underwent colonoscopy during the first 5 years after the intervention period, the relative risk of adenoma recurrence was 0.63 (95 % CI 0.46, 0.87; P=0.005) comparing calcium supplementation to placebo, whereas no difference was found in 424 participants who underwent colonoscopy in the subsequent 5 to 10 years after the trial treatment.
A nonrandomized comparative study162 presented the percentage of adenoma recurrence in a group of men and women who underwent polypectomy, and received calcium supplementation (2000 mg/d) as chemoprevention. The same study also presented the percentage of adenoma recurrence in a group of men and women who underwent polypectomy but were not supplemented with calcium. The intervention group included 175 participants while the nonsupplemented group included nine patients. The two groups were followed for an average of 3.1 years. The trial was rated C for methodological quality. In this study,162 the percentage of participants with adenoma recurrence was lower in the intervention group compared to the nonsupplemented participants (13% versus 55%); however, no further statistical analysis was provided.
Four cohort studies evaluated the association between calcium intake and colorectal adenoma.141,163-165 Three studies were conducted in the US (latitude range between 33°N and 38°N), and one in France (latitude 46°N). Sample sizes ranged from 1304 to 48,115. Two studies recruited participants with a history of colorectal adenoma, and the other two recruited
healthy subjects without a history of adenoma. The incidence rate of colorectal adenomas ranged between 0.003 and 0.025. The participants’ mean age ranged from 52.7 to 61.1 years. Average followup ranged from 36.8 to 44.4 months. Three of the four studies did not report information on assessor blinding.141,164,165 All studies assessed dietary intake with food frequency questionnaires and confirmed cases with pathology reports. The quality of all four studies was rated B.
Findings by age and sex
One cohort study165 that analyzed men and women (aged 40-80 y) with a history of colorectal adenoma found an inverse association between total calcium intake and colorectal adenoma recurrence after an average of 3.1 years of followup (RR 0.62, highest [>1279 mg/d] compared with lowest intake [<778 mg/d]; P for trend = 0.005). The study did not test statistically whether the strength of the association differed between men and women. Another study of both men and women with previous adenomatous polyps found no significant association between total calcium intake and colorectal adenoma recurrence.
One cohort study that analyzed exclusively women (aged 40-65 y) without a history of colorectal adenoma found an inverse association between total calcium intake and colorectal adenoma (RR 0.80, highest [>1226 mg/d] compared with lowest intake [<786 mg/d]; P for trend = 0.04).141 Another study of women without previous adenomatous polyps found no significant association.163
Findings by life stage
-
0 – 6 mo No data
-
7 mo – 2 y No data
-
3 – 8 y No data
-
9 – 18 y No data
-
19 – 50 y One cohort study of women age 30 to 55 years found no association between total calcium intakes and colorectal adenoma. Three additional studies included some men or women in this life stage. Two of these studies reported a significant inverse association between total calcium intake and colorectal adenoma. However, their results are inconclusive for adults in this life stage.
-
51 – 70 y One meta-analysis of 2 RCTs in adults with previous adenomatous polyps (mean age 59 to 61 years) found a significant decrease in colorectal adenoma recurrence in supplemental calcium (1200 to 2000 mg elemental calcium daily) compared to no supplements (odds ratio, 0.74 [95 % CI 0.58, 0.95]; P=0.02). A long-term followup study of one of the two trials found no difference in recurrence after 5 to 10 years after the intervention. One nonrandomized comparative trial also found a significant reduction in adenoma recurrence risk among healthy adults with a mean age 55 years who received calcium supplementation compared to no supplements (13% vs. 55%; P value not reported). Two cohort studies evaluated participants with a mean age 53 and 61 years respectively. One additional study recruited adults in this life stage. Two of the three studies, one including adults with a history of adenoma and another including women without adenoma history, found an inverse association between total calcium intake and colorectal adenoma.
-
71+ No studies specifically focused on this life stage. Two studies also included some men and women with a history of adenoma corresponding to this life
Table 64. Calcium and colorectal adenoma: Characteristics of interventional studies
|
Author, Year Trial/Cohort Name Country (Latitude) [Pubmed ID] |
Population |
Vit D & Ca Background Diets |
Interventions |
Compliance |
Comments |
|
|
RCTs |
||||||
|
Grau, 2007161 Calcium Polyp Prevention StudyA US (34°-44°N) [17227996] |
• Health status |
Generally healthy men and women with a recent colorectal adenoma |
Calcium, mean: 876 mg/dayB |
Elemental calcium, 1200 mg/d |
nd |
Duplicated with Wallace; results during the observational post-intervention phase (5-10 years) |
|
• Mean age (range/SD), y |
60.6 |
|
|
|
||
|
• Male (%) |
71.7 |
|
|
|
||
|
Nonrandomized comparative study |
|
|
|
|
|
|
|
Duris, 1996162 nd Slovakia (48°N) [8682453] |
• Health status |
Generally healthy men and women; history of adenomatous polyps after polypectomy |
nd |
Calcium carbonicum (2 g/d) |
|
No statistical comparison between groups |
|
|
• Mean age (range/SD), y |
54.7 |
|
|
|
|
|
|
• Male (%) |
62 |
|
|
|
|
|
A A post-hoc followup study (Calcium Follow-up Study) of a RCT (Calcium Polyp Prevention Study). B Two percent of the participants in the both groups took calcium supplements during the intervention period. Forty-seven percent in the placebo group and 49 percent in the supplement arm took any calcium supplements during the followup period after the intervention. The dosage was not reported (based on the self-reported data in the earlier report).160 |
||||||
Table 65. Calcium and colorectal adenoma: Characteristics of cohort studies
|
Author, Year Trial/Cohort Name Country (Latitude) [Pubmed ID] |
Population |
Dietary Calcium intake |
Comparisons |
Confounders/Effect Modifiers Adjusted |
Comments |
|||||||
|
Nutrients |
Demographic |
Anthrop |
Medical |
Seasons |
Life styles |
|||||||
|
Cohort |
||||||||||||
|
Oh, 2007163 The Nurses Health Study US (38°N) [17379616] |
• Health status |
Generally healthy women |
• Dietary assessment method |
61-item semi-quantitative FFQ (by Willet) |
Colorectal adenoma across total calcium intake quintiles |
x |
x |
x |
x |
|
x |
Total Ca (both) |
|
• Mean age (range/SD), y |
30-55 |
|
|
|
|
|
|
|
|
|||
|
|
• Male (%) |
0 |
• Internal validation? (y/n) |
y |
|
|
|
|
|
|
|
|
|
Kesse, 2005141 Etude Epidémiologique auprès de femmes de l’Education Nationale France (46°N) [15880532] |
• Health status |
Generally healthy women |
• Dietary assessment method |
FFQ |
Colorectal adenomas across total calcium intake quartiles |
x |
x |
x |
|
|
x |
Total Ca (food) |
|
• Mean age (range/SD), y |
52.7 |
|
|
|
|
|
|
|
|
|
||
|
• Male (%) |
0 |
• Internal validation? (y/n) |
y |
|
|
|
|
|
|
|
|
|
|
Hartman, 2005164 The Polyp Prevention Trial US (38° N) [15671222] |
• Health status |
Generally healthy men and women; history of at least one colorectal adenoma; 90% Caucasian |
• Dietary assessment method |
FFQ |
Adenoma recurrence across total calcium intake quintiles |
x |
x |
x |
x |
|
|
Total Ca (both) |
|
|
• Mean age (range/SD), y |
61.1 (9.9) |
|
|
|
|
|
|
|
|
|
|
|
|
• Male (%) |
64 |
• Internal validation? (y/n) |
y |
|
|
|
|
|
|
|
|
|
Martinez, 2002165 Wheat Bran Fiber (WBF) trial US (33°N) [12020102] |
• Health status |
Generally healthy men and women; history of colorectal adenoma(s) |
• Dietary assessment method |
113-item Arizona Food Frequency Questionnaire (AFFQ) |
Adenoma recurrence across total calcium intake quartiles |
x |
x |
|
x |
|
|
Total Ca (both) |
|
|
|
|
Subgroup analyses per gender |
|
|
|
|
|
|
|
||
|
|
• Mean age (range/SD), y |
nd |
|
|
|
|
|
|
|
|
|
|
|
|
• Male (%) |
57.1 |
• Internal validation? (y/n) |
y |
|
|
|
|
|
|
|
|
Table 66. Calcium and colorectal adenoma recurrence: Results of RCTs
|
Author Year Name Location (Latitude) [PMID] |
Life Stage |
Outcome |
1°/2° |
Mean Followup, mo |
Interventions, Daily Dose |
n Event |
N Total |
Outcome Metric (Comparison) |
Result |
95% CI |
P Btw |
Study Quality |
|
Grau 2007161 Calcium Polyp Prevention Study US (various) [17227996] |
Adult |
All adenomas |
1° |
92.4 |
Calcium carbonate (1200 mg/d) |
82 |
208 |
RR |
1.09 |
0.85, 1.39 |
0.51 |
B |
|
|
|
|
|
Placebo |
82 |
216 |
|
|
|
|
|
Table 67. Calcium and colorectal adenoma recurrence: Results of nonrandomized comparative study
|
Author Year Study Name [PMID] |
Life Stage |
Outcome |
1°/2° |
Mean Followup, mo |
Interventions, Daily Dose |
n Event |
N Total |
Outcome Metric (Comparison) |
Result |
95% CI |
P Btw |
Study Quality |
|
Duris 1996162 Slovakia (48°N) [8682453] |
Adult (30-75 y) |
Adenoma recurrence |
nd |
37.2 |
Calcium carbonicum, 2g/day |
12 |
175 |
RR |
nd |
nd |
nd |
C |
|
|
|
|
|
No chemoprevention |
5 |
9 |
|
|
|
|
|
Table 68. Calcium and colorectal adenoma: Results of cohort studies
|
Author Year Study Name Location (Latitude) [PMID] |
Life Stage |
Outcome (n/N, Incidence) |
Total Ca Intake, mg/day |
No. of Cases |
No. in Category |
Follow up Duration (Time to Dx) |
Adjusted RR |
95% CI |
P for Trend |
Study Quality |
|
Oh 2007163 The Nurses Health Study US (38°N) [17379616] |
Female adult (30-55 y) |
Adenoma (nd) |
Median Q1, 584 |
nd |
nd |
nd |
1.0 |
Reference |
0.06 |
B |
|
|
|
Adenoma (nd) |
Median Q2, 779 |
nd |
nd |
nd |
1.05 |
0.93, 1.20 |
|
|
|
|
|
Adenoma (nd) |
Median Q3, 949 |
nd |
nd |
nd |
0.96 |
0.84, 1.11 |
|
|
|
|
|
Adenoma (nd) |
Median Q4, 1139 |
nd |
nd |
nd |
0.96 |
0.82, 1.12 |
|
|
|
|
|
Adenoma (nd) |
Median Q5, 1451 |
nd |
nd |
nd |
0.88 |
0.74, 1.04 |
|
|
|
Kesse 2005141 Etude Epidémiologique auprès de femmes de l'Education Nationale France (46°N) [15880532] |
Female adult (40-65 y) |
Adenoma (nd) |
<785.62 |
154 |
nd |
44.4 mo |
1.0 |
Reference |
0.04 |
B |
|
|
|
Adenoma (nd) |
785.62-1226.16 |
150 |
nd |
44.4 mo |
0.97 |
0.76, 1.22 |
|
|
|
|
|
Adenoma (nd) |
981.67-1226.16 |
131 |
nd |
44.4 mo |
0.83 |
0.65, 1.07 |
|
|
|
|
|
Adenoma (nd) |
>1226.16 |
156 |
nd |
44.4 mo |
0.80 |
0.62, 1.03 |
|
|
|
Hartman 2005164 The Polyp Prevention Trial US (38° N) [15671222] |
Adult (≥ 35 y) |
Adenoma recurrence (nd) |
< 666 |
156 |
nd |
nd |
1.0 |
Reference |
0.20 |
B |
|
|
|
Adenoma recurrence (nd) |
666-814 |
163 |
nd |
nd |
1.12 |
0.83, 1.51 |
|
|
|
|
|
Adenoma recurrence (nd) |
815-969 |
154 |
nd |
nd |
1.02 |
0.76, 1.38 |
|
|
|
|
|
Adenoma recurrence (nd) |
970-1226 |
150 |
nd |
nd |
1.00 |
0.74, 1.36 |
|
|
|
|
|
Adenoma recurrence (nd) |
>1226 |
131 |
nd |
nd |
0.86 |
0.62, 1.18 |
|
|
|
Author Year Study Name Location (Latitude) [PMID] |
Life Stage |
Outcome (n/N, Incidence) |
Total Ca Intake, mg/day |
No. of Cases |
No. in Category |
Follow up Duration (Time to Dx) |
Adjusted RR |
95% CI |
P for Trend |
Study Quality |
|
Martinez 2002165 Wheat Bran Fiber (WBF) trial US (38° N) [12020102] |
Adult (40-80 y) |
Adenoma recurrence (178/326; 0.55) |
< 778 |
178 |
326 |
36.8 mo |
1.0 |
Reference |
0.005 |
B |
|
|
|
Adenoma recurrence (175/326; 0.54) |
778-996 |
175 |
326 |
36.8 mo |
0.94 |
0.66, 1.32 |
|
|
|
|
|
Adenoma recurrence (148/326; 0.45) |
997-1279 |
148 |
326 |
36.8 mo |
0.68 |
0.48, 0.97* |
|
|
|
|
|
Adenoma recurrence (138/326; 0.42) |
>1279 |
138 |
326 |
36.8 mo |
0.62 |
0.42, 0.90* |
|
|
|
|
Male adult (40-80 y) |
Adenoma recurrence (nd) |
< 778 |
nd |
nd |
36.8 mo |
1.0 |
Reference |
nd |
|
|
|
|
Adenoma recurrence (nd) |
778-996 |
nd |
nd |
36.8 mo |
1.01 |
0.68, 1.51 |
|
|
|
|
|
Adenoma recurrence (nd) |
997-1279 |
nd |
nd |
36.8 mo |
0.83 |
0.54, 1.26 |
|
|
|
|
|
Adenoma recurrence (nd) |
>1279 |
nd |
nd |
36.8 mo |
0.67 |
0.40, 1.10 |
|
|
|
|
Female adult (40-80 y) |
Adenoma recurrence (nd) |
< 778 |
nd |
nd |
36.8 mo |
1.0 |
Reference |
nd |
|
|
|
|
Adenoma recurrence (nd) |
778-996 |
nd |
nd |
36.8 mo |
0.81 |
0.40, 1.64 |
|
|
|
|
|
Adenoma recurrence (nd) |
997-1279 |
nd |
nd |
36.8 mo |
0.42 |
0.21, 1.87 |
|
|
|
|
|
Adenoma recurrence (nd) |
>1279 |
nd |
nd |
36.8 mo |
0.52 |
0.28, 0.98* |
|
|
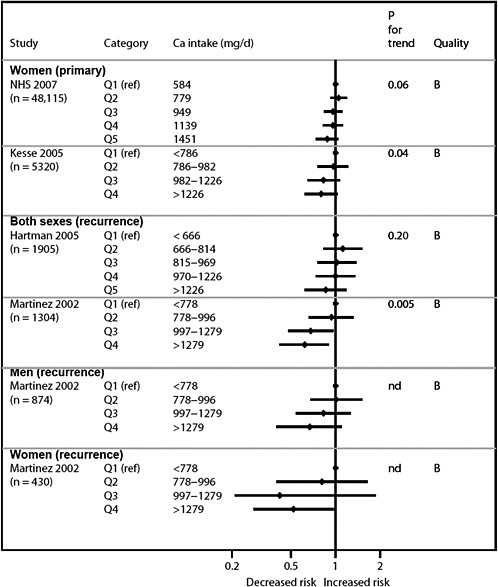
Breast cancer incidence
Synopsis
No qualified systematic reviews evaluated the association between dietary and supplemental calcium intake and the risk of breast cancer. No RCTs were identified. Six cohort studies compared calcium intake and the risk of breast cancer. In four studies, premenopausal women with calcium intakes in the range of 780-1750 mg/d had a decreased risk of incident breast cancer.125,166-170 Only one study reported decreased risk of breast cancer in both premenopausal and postmenopausal women for calcium intake ranged from 1250 to 1750 mg/d compared with the lowest quintile of intake of less than 500 mg/d.168 In two of six studies, there was no association between calcium intake and breast cancer (both overall and by menopausal status).125,170 Five studies were rated B and one study rated C.
Detailed presentation (Tables 69 & 70; Figure 20)
Six studies recruited a total of 452,398 (ranged from 3600 to 198,903) pre-and postmenopausal women and followed them for a period of 7 to 16 years. The participants had an average age ranged from 47 to 63 years. Four studies conducted in the US and one study conducted in Sweden used validated food frequency questionnaire to quantify calcium intake levels. One study conducted in France used computerized questionnaire to quantify calcium intake levels. The incidence of breast cancer in these studies ranged from 2.5 to 4.8 percent. In four of the six cohort studies, premenopausal women with calcium intakes in the range of 780 to 1750 mg/d had a decreased risk of incident breast cancer compared to those with lowest quintile intake levels in each study. There was no association between calcium intake and breast cancer in the two of six studies.125,170
Findings by age and sex
In subgroup analysis of four cohort studies, premenopausal women had a consistently decreased risk of breast cancer. No association was found for postmenopausal women.
Findings by life stage
-
0 – 6 mo Not applicable
-
7 mo – 2 y Not applicable
-
3 – 8 y Not applicable
-
9 – 18 y Not applicable
-
19 – 50 y A cohort study of Nurses’ Health Study including women with an average age of 47 years had a decrease risk (RR 0.75, 95% CI 0.55, 0.99) in breast cancer among those with calcium intake levels of 1000-1250 mg/d compared to those with intake levels lesser than 500 mg/d.
-
51 – 70 y Three of the five cohort studies of women with an average age between 51-63 years, found a decreased risk of breast cancer among those with calcium intakes in the range of 780-1750 mg/d compared to those with lowest quintile intake levels in each study.
-
≥71 y Not reviewed
-
Postmenopause Cohort studies did not find an association between breast cancer risk and calcium intake levels among postmenopausal women.
-
Pregnant & lactating women Not reviewed
Table 69. Calcium and breast cancer: Characteristics of cohort studies
|
Author Year Study Name Location (Latitude) [PMID] |
Population |
Dietary Calcium intake |
Comparisons |
Confounders/Effect Modifiers Adjusted |
Comments |
|||||||
|
Nutrients |
Demograph |
Anthrop |
Medical |
UV exposure |
Lifestyle |
|||||||
|
Cohort |
||||||||||||
|
Park 2009 NIH-AARP US 38º N [19237724] |
• Health status |
No cancer |
• Dietary assessment method |
FFQ (NCI-DHQ) USDA Nutrient Database |
Quintile 1 vs. Quintile 2, 3, 4, 5 |
x |
x |
x |
x |
|
x |
Total calcium intake from diet and supplement |
|
|
• Mean age (range/SD), y |
50-71 |
|
|
|
|
|
|
|
|
|
|
|
|
• |
|
• Internal validation? (y/n) |
y |
|
|
|
|
|
|
|
|
|
Shin 2002169 NHS US 38° N [12208895] |
• Health status |
No cancer |
• Dietary assessment method |
61 item FFQ USDA Nutrient Database |
500 mg vs. 500-600, 600-700, 700-800, 800-1000, 1000-1250, >1250 |
x |
x |
x |
x |
x |
x |
Total calcium intake from diet and supplement |
|
• Mean age (range/SD), y |
47 (ND) |
|
|
|
|
|
|
|||||
|
|
• |
|
• Internal validation? (y/n) |
y |
|
|
|
|
|
|
|
|
|
McCullough 2005168 CPS II Nutrition Cohort US 38° N [16365007] |
• Health status |
No cancer |
• Dietary assessment method |
Modified FFQ of Block et al. |
500 mg vs. 500-750, 750-1000, 1000-1250, 1250-1500, 1500-1750, >1750 |
x |
x |
x |
x |
x |
x |
Total calcium intake from diet and supplement |
|
• Mean age (range/SD), y |
63 (ND) |
|
|
|
|
|
|
|
||||
|
• |
|
• Internal validation? (y/n) |
y |
|
|
|
|
|
|
|
||
|
Larsson 2009170 Swedish Mammography Cohort Sweden 62° N [19056569] |
• Health status |
No cancer |
• Dietary assessment method |
FFQ Swedish National Food Administration Database |
<727 vs. 727-862, 863-980, 980-1125, >1125 |
x |
x |
x |
|
x |
x |
Total calcium intake from diet and supplement |
|
• Mean age (range/SD), y |
53.7 (9.7) |
|
|
|
|
|
|
|
|
|||
|
• |
|
• Internal validation? (y/n) |
y |
|
|
|
|
|
|
|
|
|
|
Lin J 2007167 WHS US 38º N [17533208] |
• Health status |
No cancer or CVD |
• Dietary assessment method |
Willet method USDA Nutrient Database |
Quintile 1 vs. Quintile 2, 3, 4, 5 |
x |
x |
x |
|
x |
x |
Total calcium intake from diet and supplement |
|
• Mean age (range/SD), y |
55 (55-56) |
|
|
|
|
|
|
|
|
|
||
|
|
• |
|
• Internal validation? (y/n) |
y |
|
|
|
|
|
|
|
|
|
Author Year Study Name Location (Latitude) [PMID] |
Population |
Dietary Calcium intake |
Comparisons |
Confounders/Effect Modifiers Adjusted |
Comments |
|||||||
|
Nutrients |
Demograph |
Anthrop |
Medical |
UV exposure |
Lifestyle |
|||||||
|
Kesse-Guyot 2007166 SU.VI.MAX France 46°N [17536191] |
• Health status |
No cancer |
• Dietary assessment method |
Computerized questionnaires |
Quintile 1 vs. Quintile 2, 3, 4 |
x |
x |
x |
|
x |
x |
Dietary calcium intake |
|
• Mean age (range/SD), y |
51 (6.3) |
|
|
|
|
|
|
|
|
|
||
|
|
|
|
• Internal validation? (y/n) |
ND |
|
|
|
|
|
|
|
|
Table 70. Calcium and breast cancer: Results of cohort studies
|
Author Year Study Name [PMID] |
Life Stage |
Outcome (n/N; Incidence) |
Followup Duration (Time to Dx) |
Total Ca Intake, mg/day |
No. of Cases |
No. in Category |
Adjusted RR |
95% CI |
P for Trend |
Study Quality |
|
Park 2009125 NIH-AARP [19237724] |
Pre- and Post-menopausal women |
Breast cancer (5856/198,903; 2.9%) |
7 y |
Q1 |
494 |
5856 |
HR 1 |
Reference |
NS |
B |
|
|
|
|
|
Q2 |
717 |
5856 |
0.96 |
0.88-1.04 |
|
|
|
|
|
|
|
Q3 |
969 |
5856 |
0.95 |
0.87-1.03 |
|
|
|
|
|
|
|
Q4 |
1296 |
5856 |
0.94 |
0.86-1.02 |
|
|
|
|
|
|
|
Q5 |
1881 |
5856 |
0.98 |
0.90-1.07 |
|
|
|
Shin 2002169 NHS [12208895] |
Pre-menopausal women |
Breast cancer (3172/88,381; 3.6%) |
16 y |
≤ 500 |
142 |
ND |
1 |
Reference |
0.05 |
B |
|
|
|
|
|
500-600 |
106 |
ND |
0.88 |
0.68, 1.13 |
|
|
|
|
|
|
|
600-700 |
133 |
ND |
0.97 |
0.76, 1.24 |
|
|
|
|
|
|
|
700-800 |
119 |
ND |
0.95 |
0.74, 1.22 |
|
|
|
|
|
|
|
800-1000 |
161 |
ND |
0.82 |
0.64, 1.05 |
|
|
|
|
|
|
|
1000-1250 |
104 |
ND |
0.75 |
0.57, 0.99* |
|
|
|
|
|
|
|
>1250 |
62 |
ND |
0.80 |
0.58, 1.12 |
|
|
|
|
Post-menopausal women |
|
|
≤ 500 |
240 |
ND |
1 |
Reference |
NS |
|
|
|
|
|
|
500-600 |
216 |
ND |
0.86 |
0.72, 1.04 |
|
|
|
|
|
|
|
600-700 |
293 |
ND |
0.94 |
0.79, 1.12 |
|
|
|
|
|
|
|
700-800 |
292 |
ND |
0.92 |
0.77, 1.10 |
|
|
|
|
|
|
|
800-1000 |
518 |
ND |
0.93 |
0.79, 1.10 |
|
|
|
|
|
|
|
1000-1250 |
433 |
ND |
0.90 |
0.76, 1.07 |
|
|
|
|
|
|
|
>1250 |
353 |
ND |
0.93 |
0.77, 1.12 |
|
|
|
McCullough 2005168 CPS II Nutrition Cohort [16365007] |
Pre- and Post-menopausal women |
Breast cancer (2855/68,567; 4.1%) |
8 y |
≤ 500 |
457 |
10,620 |
1 |
Reference |
0.07 |
B |
|
|
|
|
|
500-750 |
729 |
17,880 |
0.91 |
0.81, 1.02 |
|
|
|
|
|
|
|
750-1000 |
581 |
14,023 |
0.92 |
0.81, 1.04 |
|
|
|
|
|
|
|
1000-1250 |
407 |
9120 |
0.97 |
0.85, 1.11 |
|
|
|
|
|
|
|
1250-1500 |
248 |
6296 |
0.84 |
0.72, 0.98* |
|
|
|
|
|
|
|
1500-1750 |
144 |
3983 |
0.76 |
0.63, 0.92* |
|
|
|
|
|
|
|
1750 |
289 |
6645 |
0.91 |
0.79, 1.06 |
|
|
|
Author Year Study Name [PMID] |
Life Stage |
Outcome (n/N; Incidence) |
Followup Duration (Time to Dx) |
Total Ca Intake, mg/day |
No. of Cases |
No. in Category |
Adjusted RR |
95% CI |
P for Trend |
Study Quality |
|
Larsson 2009170 Swedish Mammography Cohort [19056569] |
Pre- and Post-menopausal women |
Invasive Breast cancer 2952/61,433; 4.8%) |
9 y |
<727 |
595 |
2952 |
1 |
Reference |
NS |
B |
|
|
|
|
|
727-862 |
595 |
2952 |
0.97 |
0.87-1.09 |
|
|
|
|
|
|
|
863-980 |
592 |
2952 |
0.95 |
0.84-1.06 |
|
|
|
|
|
|
|
980-1125 |
571 |
2952 |
0.93 |
0.83-1.04 |
|
|
|
|
|
|
|
>1125 |
599 |
2952 |
0.97 |
0.87-1.09 |
|
|
|
Lin J 2007167 WHS [17533208] |
Pre-menopausal women |
Invasive breast cancer (878/31,487; 2.8%) |
10 y |
<617 |
70 |
10,578 |
HR 1 |
Reference |
.04 |
B |
|
|
|
|
|
617-789 |
65 |
10,578 |
0.84 |
0.59, 1.19 |
|
|
|
|
|
|
|
789-1026 |
44 |
10,578 |
0.60 |
0.41, 0.88* |
|
|
|
|
|
|
|
1026-1366 |
59 |
10,578 |
0.79 |
0.55, 1.14 |
|
|
|
|
|
|
|
≥1366 |
38 |
10,578 |
0.61 |
0.40, 0.92* |
|
|
|
|
Post-menopausal women |
|
|
<617 |
104 |
20,909 |
HR 1 |
Reference |
NS |
|
|
|
|
|
|
617-789 |
116 |
20,909 |
1.21 |
0.95, 1.54 |
|
|
|
|
|
|
|
789-1026 |
112 |
20,909 |
1.09 |
0.85, 1.40 |
|
|
|
|
|
|
|
1026-1366 |
119 |
20,909 |
1.21 |
0.95, 1.55 |
|
|
|
|
|
|
|
≥1366 |
151 |
20,909 |
1.17 |
0.92, 1.50 |
|
|
|
Kesse-Guyot 2007166 SU.VI.MAX trial [17536191] |
Pre- and Post-menopausal |
Breast cancer (92/3627; 2.5%) |
8 y |
<807 |
32 |
3627 |
1 |
Reference |
0.04 |
C |
|
|
|
|
|
807-960 |
24 |
3627 |
0.73 |
0.42, 1.25 |
|
|
|
|
|
|
|
961-1144 |
20 |
3627 |
0.65 |
0.37, 1.14 |
|
|
|
|
|
|
|
>1144 |
16 |
3627 |
0.50 |
0.27, 0.91* |
|
|
|
|
Post-menopausal |
|
|
<807 |
14 |
nd |
1 |
Reference |
0.64 |
|
|
|
|
|
|
807-960 |
13 |
nd |
0.71 |
0.33, 1.54 |
|
|
|
|
|
|
|
961-1144 |
10 |
nd |
0.67 |
0.30, 1.53 |
|
|
|
|
|
|
|
>1144 |
11 |
nd |
0.76 |
0.34, 1.70 |
|
|
|
Author Year Study Name [PMID] |
Life Stage |
Outcome (n/N; Incidence) |
Followup Duration (Time to Dx) |
Total Ca Intake, mg/day |
No. of Cases |
No. in Category |
Adjusted RR |
95% CI |
P for Trend |
Study Quality |
|
|
Pre-menopausal |
|
|
<807 |
18 |
nd |
1 |
Reference |
0.01 |
|
|
|
|
|
|
807-960 |
11 |
nd |
0.77 |
0.36, 1.66 |
|
|
|
|
|
|
|
961-1144 |
10 |
nd |
0.63 |
0.29, 1.38 |
|
|
|
|
|
|
|
>1144 |
5 |
nd |
0.26 |
0.10, 0.71* |
|
|
|
HR: hazard ratio *Statistically significant (P<0.05) |
||||||||||
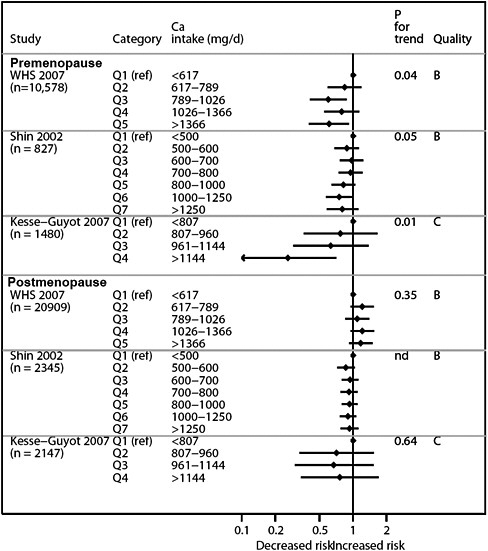
Breast Mammographic Density
Synopsis
No systematic reviews evaluated the association between dietary and supplemental calcium intake and breast mammographic density. No RCTs of calcium intake evaluated breast mammography density. One prospective cohort study evaluated the association of calcium intake and breast mammographic density.171 Both premenopausal and postmenopausal women with calcium intakes in the range of 523 mg/d to greater than 1021 mg/d were followed for almost 40 years, and there was no association between calcium intake and breast mammographic density. The methodological quality of this studywas rated B.
Detailed presentation (Tables 71 & 72)
One prospective cohort study followed from birth of a British national representative sample of 2547 women and followed them for a period of 53 years.171 Women had an average age of 51.5 years. Dietary calcium intake was evaluated using 5-day food records. The breast density in women was assessed through mammography at the ages 36, 43, and 53 years. Since the measurement at the age of 53 years was cross-sectional, this has been excluded from our analyses. There was no linear association between dietary calcium intakes in the range of 523 mg/d to greater than 1021 mg/d and breast mammographic density.
Findings by age and sex
In subgroup analysis by age categories, there was no linear association between calcium intake and breast mammography density.
Findings by life stage
-
0 – 6 mo Not applicable
-
7 mo – 2 y Not applicable
-
3 – 8 y Not applicable
-
9 – 18 y Not applicable
-
19 – 50 y There was no linear association between calcium intake in the range of 523 mg/d to greater than 1021 mg/d and breast mammographic density
-
51 – 70 y No data
-
≥71 y No data
-
Postmenopause No data
-
Pregnant & lactating women Not reviewed
Table 71. Calcium and breast mammography density: Characteristics of cohort studies
|
Author Year Study Name Location [PMID] (Latitude) |
Population |
Dietary Calcium intake |
Comparisons |
Confounders/Effect Modifiers Adjusted |
Comments |
|||||||
|
Nutrients |
Demograph |
Anthrop |
Medical |
UV exposure |
Lifestyle |
|||||||
|
Cohort |
||||||||||||
|
Mishra 2008171 Medical MRC NSHD UK 54º N [18827811] |
• Health status |
No breast cancer |
• Dietary assessment method |
5-day food diaries McCance and Widdowson’s food table |
At age 36 y: <523, 524-648, 652-784, 785-940, >941 |
x |
x |
x |
x |
|
x |
Total calcium intake from diet and supplement |
|
• Mean age (range/SD), y |
52 |
|
|
|
|
|
|
|||||
|
|
|
• Internal validation? (y/n) |
ND |
At age 43 y: <611, 612-735, 736-859, 860-1020, >1021 |
|
|
|
|
|
|
|
|
Table 72. Calcium and breast cancer: Results of cohort studies
|
Author Year Study Name [PMID] |
Life Stage |
Outcome (n/N; Incidence) |
Followup Duration (Time to Dx) |
Total Ca Intake, mg/day |
No. of Cases |
No. in Category |
Adjusted RR |
95% CI |
P for Trend |
Study Quality |
|
Mishra 2008171 Medical MRC NSHD [18827811 |
Premenopausal women |
Breast cancer density (nd; median 21.9%) |
~32 y |
≤523 |
133 |
766 |
β coefficient 1 |
Reference |
NS |
B |
|
|
|
|
~32 y |
524 – 648 |
143 |
766 |
−0.11 |
−0.33, 0.10 |
|
|
|
|
|
|
~32 y |
652 – 784 |
156 |
766 |
−0.05 |
−0.27, 0.17 |
|
|
|
|
|
|
~32 y |
785 – 940 |
160 |
766 |
−0.04 |
−0.27, 0.19 |
|
|
|
|
|
|
~32 y |
≥941 |
174 |
766 |
−0.08 |
−0.32, 0.17 |
|
|
|
|
|
|
~39 y |
≤611 |
145 |
755 |
β coefficient 1 |
Reference |
NS |
|
|
|
|
|
~39 y |
612-735 |
156 |
755 |
−0.13 |
−0.35, 0.09 |
|
|
|
|
|
|
~39 y |
736-859 |
145 |
755 |
−0.06 |
−0.29, 0.17 |
|
|
|
|
|
|
~39 y |
860-1020 |
156 |
755 |
−0.11 |
−0.34, 0.12 |
|
|
|
|
|
|
~39 y |
≥1021 |
153 |
755 |
−0.16 |
−0.42, 0.09 |
|
|
Pancreatic cancer
We reviewed primary studies that evaluated associations between calcium intake and incidence of pancreatic cancer.
Synopsis
Two studies analyzed three US cohorts and found that total daily calcium intake was not associated with the risk of pancreatic cancer in men and women. No RCTs of calcium intake or supplement have evaluated this outcome.
Detailed presentation (Tables 73 & 74)
One study analyzed data from Nurses’ Health Study (NHS) and the Health Professionals Follow-up Study (HPFS).172 The study identified a total of 365 cases of pancreatic cancer (178/75,427 women aged 38 to 65 years from NHS; 178/46,771 men aged 40 to 75 years from HPFS). Comparing the group with at least 1000 mg/d of calcium intake to the group with less than 500 mg/d, there was no significant difference in the relative risk of pancreatic cancer (RR 0.94; 95% CI 0.62, 1.41 for overall; 0.75; 95% CI 0.43, 1.30 for NHS; 1.23; 95% CI 0.67, 2.25 for HPFS). The result was adjusted for age, categories of total vitamin D intake, smoking, diabetes, BMI, height, region of residence, use of multivitamin, and parity (for women). The pancreatic cancer was not stratified into endocrine versus exocrine tumors. Methodological quality of this study was rated A.
Another study analyzed data from AARP (the American Association of Retired Persons) members, aged 50 to 71 years old, living in six specific states in the US.125 The study identified a total of 717 and 384 cases of pancreatic cancer in men and women over 7 years of followup period, respectively. Pancreatic cancer was one of many other cancer outcomes evaluated in this study. The results showed that that total calcium intake was not associated with the risk of pancreatic cancer after controlling for potential risk factors pertinent to individual cancers. The methodological quality of this study was rated B.
Findings by life stage
-
0 – 6 mo Not reviewed
-
7 mo – 2 y Not reviewed
-
3 – 8 y Not reviewed
-
9 – 18 y Not reviewed
-
19 – 50 y One study analyzed two US cohorts (NHS [women 38 - 65 y] and HPFS [men 40 -75 y]) and found that total daily calcium intake was not associated with the risk of pancreatic cancer.
-
51 – 70 y One study analyzed two US cohorts (NHS [women 38 - 65 y] and HPFS [men 40 -75 y]) and found that total daily calcium intake was not associated with the risk of pancreatic cancer. Another study analyzed US AARP cohort with men and women in this life stage found similar result.
-
≥71 y One study that analyzed HPFS included males up to 75 years old and found that total daily calcium intake was not associated with the risk of pancreatic cancer.
-
Postmenopause No data
-
Pregnant & lactating women Not reviewed
Table 73. Calcium and pancreatic cancer: Characteristics of cohort studies
|
Author, Year Study Name Location (Latitude) [PMID] |
Population |
Dietary calcium intake |
Comparisons |
Confounders/Effect Modifiers Adjusted |
Comments |
|||||||
|
Nutrients |
Demograph |
Anthrop |
Medical |
UV exposure |
Life styles |
|||||||
|
Skinner 2006172 NHS, HPFS US (multiple latitudes) [16985031] |
Health status |
DM: NHS 3%; HPFS 1% |
Dietary assessment method |
131-item FFQ (willet, 1990) |
Pancreatic cancer risk stratified by different intakes of calcium (dietary and supplement combined) |
X |
X |
X |
X |
X |
X |
current smoker ~23% |
|
Mean age (range/SD), y |
NHS 51; HPFS 55 |
|
|
|
|
|
|
|
|
|
||
|
|
Male (%) |
NHS 0; HPFS 100 |
Internal validation? (y/n) |
y |
|
|
|
|
|
|
|
|
|
Park 2009125 NIH-AARP US 38º N [19237724] |
• Health status |
No cancer |
• Dietary assessment method |
FFQ (NCI-DHQ) USDA Nutrient Database |
Pancreatic cancer risk stratified by quintile of total calcium intake |
X |
X |
X |
X |
|
X |
Total calcium intake from diet and supplement |
|
• Mean age (range/), y |
50-71 |
|
|
|
|
|
|
|
||||
|
|
• Male (%) |
60 |
• Internal validation? (y/n) |
y |
|
|
|
|
|
|
|
|
Table 74. Calcium and pancreatic cancer: Results of cohort studies
|
Author Year Study Name [PMID] |
Life Stage, y |
Outcome (n/N; Incidence) |
Followup Duration, y |
Total Ca intake in mg/d |
No. of Cases |
Total no. in Category |
Adjusted RR |
95% CI |
P for Trend |
Study Quality |
|
Skinner 2006172 NHS, HPFS US (multiple latitudes) [16985031] |
19-50 |
Pancreatic cancer (365/122,198; 0.003) overall |
14.5 |
<500 |
41 |
nd |
1 |
Reference |
0.29 |
A |
|
51-70 |
500-999 |
228 |
nd |
1.17 |
0.83, 1.66 |
|||||
|
≥71 |
≥1000 |
96 |
nd |
0.94 |
0.62, 1.41 |
|||||
|
19-50 |
Pancreatic cancer (178/75,427; 0.002) NHS |
15.4 |
<500 |
24 |
nd |
1 |
Reference |
0.09 |
||
|
51-70 |
500-999 |
109 |
nd |
1.09 |
0.69, 1.73 |
|||||
|
women |
≥1000 |
45 |
nd |
0.75 |
0.43, 1.30 |
|||||
|
19-50 |
Pancreatic cancer (187/46,771; 0.004) HPFS |
13.1 |
<500 |
17 |
nd |
1 |
Reference |
0.86 |
||
|
51-70 |
500-999 |
119 |
nd |
1.28 |
0.76, 2.18 |
|||||
|
≥71 men |
≥1000 |
51 |
nd |
1.23 |
0.67, 2.25 |
|||||
|
Park 2009 NIH-AARP125 [19237724] |
50-71, men |
Pancreatic cancer (717/293,907; 0.002) |
7 |
526 |
717 (total) |
293,907 (total) |
1 (HR) |
Reference |
0.39 |
B |
|
498 |
|
|
0.93 |
0.74, 1.16 |
||||||
|
857 |
|
|
0.9 |
0.72,1.14 |
||||||
|
1073 |
|
|
0.98 |
0.78, 1.23 |
||||||
|
1530 |
|
|
0.87 |
0.68, 1.11 |
||||||
|
50-71, women |
Pancreatic cancer (384/198,903; 0.002) |
7 |
526 |
384 (total) |
198,903 (total) |
1 (HR) |
Reference |
0.40 |
|
|
|
498 |
|
|
1.03 |
0.75, 1.40 |
|
|||||
|
857 |
|
|
0.93 |
0.67, 1.28 |
|
|||||
|
1073 |
|
|
0.97 |
0.71, 1.34 |
|
|||||
|
1530 |
|
|
0.88 |
0.63, 1.24 |
|
Calcium and pregnancy-related outcomes
Preeclampsia
Synopsis
This summary is primarily based on a systematic review of 12 RCTs (n=15,528 women) of calcium supplementation (≥1000 mg/d) during pregnancy versus placebo for preventing preeclampsia. In addition, it includes findings from two cohort studies (one of which is a reanalysis of one of the 12 RCTs mentioned above).
Overall, the random effects meta-analysis of the 12 RCTs favored calcium supplementation (RR=0.48, 95% CI 0.33, 0.69), albeit with substantial between-study heterogeneity. More than 80 percent of the total number of randomized women (n=12,914) came from two large trials that found no significant effect of calcium supplementation for preventing preeclampsia (RR=0.95, 95% CI 0.89, 1.05). Based on their confidence interval, the two large studies excluded large effects of calcium for preeclampsia prevention. There is no obvious explanation for the observed between-study heterogeneity in the aforementioned meta-analysis. The heterogeneity stems from differences in the effects between smaller trials (claiming protective effects) and large trials (showing no effect).
The two cohort studies did not detect associations between calcium intake during the first or second trimester of pregnancy with preeclampsia. Both cohorts were rated B for methodological and reporting quality.
Based on the above, there is not a clear answer to whether calcium supplementation is effective for preeclampsia prevention.
Detailed presentation (Tables 75, 76 & 77)
Relevant published systematic reviews of RCTs (with meta-analyses)
We identified five systematic reviews173-177 (with meta-analyses) of RCTs on calcium supplementation in the first or second trimester versus placebo for the prevention of preeclampsia (Appendix D). We selected a 2006 Cochrane review as eligible for this section.176 All other systematic reviews were covered by the Cochrane review. We did not identify any RCTs published after the Cochrane review was conducted.
Eligible were RCTs comparing at least 1000 mg/d of calcium versus placebo in pregnant women. Studies were performed in several countries (both developed and developing). The review defined preeclampsia as high gestational blood pressure (diastolic blood pressure >90 mmHg, or increase more than 15 mm Hg in diastolic or more than 30 mm Hg in systolic blood pressure) with significant proteinuria (at least 300 mg/d or at least 500 mg).i
Table 75 summarizes the findings of the Cochrane review. A random effects meta-analysis of all studies suggests that calcium supplementation reduces the risk for preeclampsia (RR=0.48, 95% CI 0.33, 0.69). However, there is substantial heterogeneity among the included studies (P<0.001).
In subgroup analyses, the effects of calcium appear larger in women at high risk for hypertension versus women at low risk for hypertension. The same is observed when trials are grouped according to whether women had adequate average calcium intake versus low average calcium intake.
More than 80 percent of the total number of randomized women in this meta-analysis (n=12,914) came from two large trials that reported no significant effects of calcium supplementation for preeclampsia (RR=0.95, 95% CI 0.89, 1.05; by fixed effects synthesis). Based on their combined confidence interval, these two studies exclude modest and large effects of calcium for preeclampsia prevention. The remaining (smaller) trials show a protective effect. One of the large RCTs was performed in populations with low background calcium diets178 and the other in populations with adequate background calcium diets.179
Allowing for the above, there is no clear explanation for the observed discrepant findings across the trials in the systematic review. The recurrent pattern is that large trials showed no effect for calcium supplementation, whereas smaller trials showed large effects. Calcium supplementation for preeclampsia prevention is a well known example where large trials and smaller trials show systematically different effects. Past methodological explorations (before the publication of the WHO trial178) have hypothesized that effects may be observed mostly among women with low calcium in their background diet.180 However, as mentioned above, this is not supported by the subgroup analyses.
Table 75. Summary table of systematic review on calcium supplementation and preeclampsia, small for gestational age, preterm birth
|
Author Year [PMID] |
Hofmeyr 2006176 [16855957] |
|||
|
Design (Search Years) |
Randomized controlled trials (1988-2006) |
|||
|
Population |
Pregnant women less than 35 weeks of gestation regardless of their risk of hypertensive of pregnancy or their previous calcium intake |
|||
|
Intervention (Exposure) and Comparator |
Calcium supplement (at least 1000 mg/d) vs. placebo |
|||
|
Results |
12 trials (n=15,528)A Preeclampsia (mother):
High blood pressure with or without proteinuria (mother):
Preterm birth:
Small for gestational age (infant):
|
|||
|
Comments |
About 80% of participants are from two well designed and well conducted RCTs.178,179 The two large RCTs show no effects for all four outcomes. |
|||
|
AMSTAR Criteria |
||||
|
A priori design? |
Yes |
Study quality assessment performed? |
Yes |
|
|
Two independent reviewers? |
Yes |
Study quality appropriately used in analysis? |
Yes |
|
|
Comprehensive literature search? |
Yes |
Appropriate statistical synthesis? |
Yes |
|
|
All publication types and languages included? |
Yes |
Publication bias assessed? |
No |
|
|
Included and excluded studies listed? |
Yes |
Conflicts of interest stated? |
Yes |
|
|
Study characteristics provided? |
Yes |
|
|
|
|
A RR <1.0 favors calcium supplementation B 95% confidence interval |
||||
Cohort studies
We identified two eligible prospective cohort studies (Table 76).181,182 Both were rated B for methodological and reporting quality. The first was a reanalysis of a large RCT and reported no associations of dietary calcium intakes during the first and second trimester with preeclampsia.181 The second study was a prospective cohort that again reported no association between dietary calcium intake in the first trimester and risk of preeclampsia.182 (See Table 77)
Findings by life stage
-
0 – 6 mo Not applicable
-
7 mo – 2 y Not applicable
-
3 – 8 y Not applicable
-
9 – 18 y Not applicable
-
19 – 50 y Not applicable
-
51 – 70 y Not applicable
-
≥71 y Not applicable
-
Postmenopause Not applicable
-
Pregnant & lactating women Based on a Cochrane review that synthesized data from 12 RCTs on 15,528 pregnant women, calcium supplementation significantly lowered the risk for preeclampsia during pregnancy. However, this meta-analysis was heterogeneous; significant effects were observed only among small studies, and not in the two largest RCTs that comprised more than 80 percent of the women in the meta-analysis. In addition, two cohort studies found no association between calcium intake and preeclampsia. Overall, the effects of calcium supplementation on preeclampsia are unclear.
Table 76. Calcium and preeclampsia and other pregnancy outcomes: Characteristics of cohort studiesA,B
|
Author Year Study Name Location (Latitude) [PMID] |
Population |
Dietary Calcium intake |
Comparisons |
Confounders/Effect Modifiers Adjusted |
Outcomes and Comments |
|||||||
|
Nutrients |
Demograph |
Anthrop |
Medical |
UV exposure |
Lifestyle |
|||||||
|
Morris 2007181 CPEP reanalysisC US (various) [11262466] |
• Health status |
Healthy |
• Dietary assessment method |
FFQ |
Outcome stratified by total Ca intake quintiles |
|
X |
X |
|
|
X |
Total Ca (both) |
|
• Mean age (SD), y |
ND |
|
|
|
|
|
|
|
||||
|
• Male (%) |
0 |
• Internal validation? (y/n) |
No |
|
|
|
|
|
|
|
|
|
|
Oken 2007182 Project Viva US (42°N) [17521921] |
• Health status |
Healthy |
• Dietary assessment method |
FFQ |
Outcome as a function of Ca intake |
|
X |
X |
|
|
|
Total Ca (both) |
|
• Mean age (SD), y |
[most 30 to <40] |
|
|
|
|
|
|
|
||||
|
• Male (%) |
0 |
• Internal validation? (y/n) |
No |
|
|
|
|
|
|
|
|
|
|
A Both table entries are treated as cohort studies. B In contrast with most other summary tables of study characteristics, this table is ordered alphabetically by study author. C Reanalysis of the CPEP trial (calcium versus placebo) for preeclampsia prevention focusing on calcium content in diet (and including the intervention dose in the analyses) |
||||||||||||
Table 77. Calcium and preeclampsia and other pregnancy outcomes: Results of cohort studies
|
Author Year Study Name Location (Latitude) [PMID] |
Age Range, Sex |
Outcome (n/N; Incidence) |
Followup Duration |
Total Ca Intake, mg/d |
No. of Cases |
No. in Category |
Adjusted OR |
95% CI |
P for Trend |
Study Quality |
|
Preeclampsia |
||||||||||
|
Morris 2007181 CPEP reanalysis US (various) [11262466] |
30-40 y, Women |
Preeclampsia (326/4314; 7.6%) |
ND |
579 |
ND |
ND |
1.00 (ref) |
|
ND |
B |
|
|
|
|
|
580-845 |
ND |
ND |
0.90 |
0.61, 1.30 |
|
|
|
|
|
|
|
846-1131 |
ND |
ND |
0.95 |
0.65, 1.39 |
|
|
|
|
|
|
|
1132-1560 |
ND |
ND |
0.97 |
0.65, 1.45 |
|
|
|
|
|
|
|
1561 |
ND |
ND |
0.78 |
0.49, 1.24 |
|
|
|
Oken 2007 Project Viva US (42°N) [17521921] |
|
Preeclampsia (59/1599; 3.7%)A |
|
~1300 |
59 |
1599 |
1.03B |
0.84, 1.27 |
NS |
B |
|
High blood pressure with or without proteinuria |
|
|
|
|
|
|
|
|
|
|
|
Morris 2007181 CPEP reanalysis US (various) [11262466] |
30-40 y, Women |
High blood pressure with or without proteinuria (747/4314; 17.3%) |
ND |
579 |
ND |
ND |
1.00 (ref) |
|
ND |
B |
|
|
|
|
|
580-845 |
ND |
ND |
1.09 |
0.84, 1.42 |
|
|
|
|
|
|
|
846-1131 |
ND |
ND |
1.10 |
0.83, 1.44 |
|
|
|
|
|
|
|
1132-1560 |
ND |
ND |
1.14 |
0.85, 1.53 |
|
|
|
|
|
|
|
1561 |
ND |
ND |
1.35 |
0.98, 1.86 |
|
|
|
Oken 2007182 Project Viva US (42°N) [17521921] |
|
Pregnancy-induced hypertension (119/1659)C |
ND |
~1300 |
119 |
1659 |
0.99 |
0.85, 1.15 |
NS |
B |
|
A Excludes 119 women with pregnancy-induced hypertension – comparison versus normotensive women B Per 300 mg of Ca intake (from supplement or diet) C Excludes 59 women with preeclampsia – comparison versus normotensive women |
||||||||||
High blood pressure with or without proteinuria during pregnancy
Synopsis
The synopsis of this outcome is based on the same systematic review described under preeclampsia. Overall, the meta-analysis of 11 RCTs favored calcium supplementation RR = 0.70 (95% CI 0.57, 0.86) for the treatment of hypertension during pregnancy, with or without proteinuria. However, there was substantial between-study heterogeneity. (Included in this meta-analysis are the two large trials mentioned in the preeclampsia section, which found no significant effect of calcium supplementation on blood pressure.) The systematic review did not offer a clear explanation for the observed heterogeneity.
Based on the above, there is no clear answer to whether calcium supplementation is effective for preventing high blood pressure (with or without proteinuria) in pregnancy.
Detailed presentation (Tables 75, 76 & 77)
Relevant published systematic reviews (with meta-analyses)
The Cochrane review that was selected for preeclampsia was applicable for hypertension during pregnancyi as well.176Table 75 summarizes the findings of the Cochrane review.
A meta-analysis of 11 trials (14,946 pregnant women) suggested that calcium supplementation reduces the risk for hypertension during pregnancy (RR=0.70, 95% CI 0.57, 0.86). However, there is substantial heterogeneity among the included studies (p<0.001). As described in Table 75, the heterogeneity was not explained by whether the trials included women with low versus adequate background dietary calcium intake.
In subgroup analyses, the effects of calcium appear larger in women at high risk for hypertension versus women at low risk for hypertension. The same is observed when trials are grouped according to whether women had adequate average dietarycalcium intake versus low average calcium intake (see Table 75).
Cohort studies
A single prospective cohort study182 (Table 68) reported no association between calcium intake levels and risk for preeclampsia.182 (See Table 69.)
Findings by life stage
-
0 – 6 mo Not applicable
-
7 mo – 2 y Not applicable
-
3 – 8 y Not applicable
-
9 – 18 y Not applicable
-
19 – 50 y Not applicable
-
51 – 70 y Not applicable
-
≥71 y Not applicable
-
Postmenopause Not applicable
-
Pregnant & lactating women Based on a Cochrane review that synthesized data from 11 RCTs on 14,946 pregnant women, calcium
-
supplementation significantly lowered the risk for hypertension with or without proteinuria during pregnancy. However, this meta-analysis was very heterogeneous; significant effects were observed only among small studies, and not in the two largest RCTs that comprised more than 80 percent of the women in the meta-analysis. In addition, a cohort study found no association between calcium intake and hypertension during pregnancy. Therefore, the effects of calcium supplementation on hypertension with or without proteinuria during pregnancy are unclear.
Preterm birth
Synopsis
The synopsis of this outcome is based on the same systematic review described under preeclampsia. Among 10 RCTs (n=14,751), calcium supplementation has no significant effect on preterm births RR 0.81 (95% CI 0.64, 1.03). (Included in this meta-analysis are the two large trials mentioned in the preeclampsia section, which found no significant effects.)
Based on the above, there is no evidence for an effect of calcium supplementation on preterm births.
Detailed presentation (Table 75)
Relevant published systematic reviews (with meta-analyses)
The Cochrane review that was selected for preeclampsia was applicable for preterm birth as well.176Table 67 summarizes the findings of the Cochrane review.
A meta-analysis of 10 trials suggests that calcium supplementation had no significant effect on preterm births. There is evidence for between-study heterogeneity in this meta-analysis.
In subgroup analyses, the effects of calcium appear larger in women at high risk for hypertension versus women at low risk for hypertension. The same is observed when trials are grouped according to whether women had low average dietary calcium intake versus adequate average dietary calcium intake.
Findings by life stage
-
0 – 6 mo Based on a Cochrane review that synthesized data from ten RCTs on 14,751 pregnant women, calcium supplementation had no significant effect on whether infants were born prematurely or not.
-
7 mo – 2 y Not applicable
-
3 – 8 y Not applicable
-
9 – 18 y Not applicable
-
19 – 50 y Not applicable
-
51 – 70 y Not applicable
-
≥71 y Not applicable
-
Postmenopause Not applicable
-
Pregnant & lactating women Not applicable
Small for gestational age infant
Synopsis
The synopsis of this outcome is based on the same systematic review described under preeclampsia. The overall effects of calcium supplementation were not significant (among three RCTs in 13,091 randomized women RR = 1.10, 95% CI 0.88, 1.37). (Included in this meta-analysis are the two large trials mentioned in the preeclampsia section, which found no significant effects.)
Based on the above, there is no evidence for an effect of calcium supplementation on preterm births.
Detailed presentation (Table 75)
Relevant published systematic reviews (with meta-analyses)
The Cochrane review that was selected for preeclampsia was applicable for this outcome as well.176Table 75 shows that among three trials with pertinent information there was no significant effect of calcium supplementation on the proportion of infants who were small for gestational age.178,179
Findings by life stage
-
0 – 6 mo Based on a Cochrane review that synthesized data from three RCTs on 13,091 pregnant women, calcium supplementation has no significant effect on whether born infants were small for gestational age or not.
-
7 mo – 2 y Not applicable
-
3 – 8 y Not applicable
-
9 – 18 y Not applicable
-
19 – 50 y Not applicable
-
51 – 70 y Not applicable
-
≥71 y Not applicable
-
Postmenopause Not applicable
-
Pregnant & lactating women Not applicable
Calcium and all-cause mortality
Synopsis
One cohort study (rated B for methodological and reporting quality) reported no significant associations between calcium intakes and all-cause mortality in men or women aged between 40-65 years. No RCTs of calcium intake evaluated all-cause mortality.
Detailed presentation (Tables 78 & 79)
One cohort study from Amsterdam, Netherlands (52°N), reported in two publications105,126 evaluated associations between calcium intake and all-cause mortality. The cohort was based on a general population health survey and enrolled civil servants or their spouses (aged 40-65 years). The reports received grade “B” for methodological and reporting quality (Table 70).
The publications reported no association between calcium intake and all-cause mortality among men or women. Table 71 shows the results of the various analyses conducted in the two publications.105,126
Findings by life stage
-
0 – 6 mo No data
-
7 mo – 2 y No data
-
3 – 8 y No data
-
9 – 18 y No data
-
19 – 50 y One cohort study found no associations between calcium intakes and all- cause mortality in men or women aged between 40-65 y.
-
51 – 70 y The above (19-50 y) may be applicable here as well, based on the age range of cohort participants.
-
≥71 y No data
-
Postmenopause No data
-
Pregnant & lactating women No data
Table 78. Calcium intake and all-cause mortality: Characteristics of cohort studies
|
Author Year Study Name Location (Latitude) [PMID] |
Population |
Calcium intake |
Comparisons |
Confounders/Effect Modifiers Adjusted |
Comments |
|||||||
|
Nutrients |
Demograph |
Anthrop |
Medical |
UV exposure |
Lifestyle |
|||||||
|
Van der Vijver 1992105 & Slob 1993126 Netherlands (52°N) [1544755 & 8478144] |
• Health status |
General population |
• Dietary assessment method |
FFQ |
Outcome stratified by total Ca intake quintiles |
X |
X |
X |
|
|
X |
Total Ca (food) |
|
• Age range, y |
40-65y |
|
|
|
|
|
|
|
||||
|
• Male (%) |
51 |
• Internal validation? (y/n) |
No |
|
|
|
|
|
|
|
|
|
Table 79. Calcium intake and all-cause mortality: Results of cohort studies
|
Author Year Study Name Location (Latitude) [PMID] |
Age Range, Sex |
Outcome (n/N; Incidence) |
Followup Duration |
Total Ca Intake, mg/d |
No. of Cases |
No. in Category |
Adjusted OR |
95% CI |
P for Trend |
Study Quality |
|
Van der Vijver 1992105 & Slob 1993126 Netherlands (52°N) [1544755 & 8478144] |
40-65 y, men |
All cause mortality (nd) |
336 mo (28 y) |
≤585 |
nd |
nd |
1.1 |
0.7, 1.6 |
nd |
B |
|
|
|
|
|
585 - 725 |
nd |
nd |
1.1 |
0.7, 1.6 |
|
|
|
|
|
|
|
725 - 935 |
nd |
nd |
0.8 |
0.5, 1.2 |
|
|
|
|
|
|
|
935 - 1245 |
nd |
nd |
0.9 |
0.6, 1.3 |
|
|
|
|
|
|
|
>1245 |
nd |
nd |
1.0 |
Reference |
|
|
|
Van der Vijver 1992105 & Slob 1993126 Netherlands (52°N) [1544755 & 8478144] |
40-65 y, women |
All cause mortality (nd) |
336 mo (28 y) |
≤445 |
nd |
nd |
1.2 |
0.8, 1.9 |
nd |
B |
|
|
|
|
|
445 - 540 |
nd |
nd |
1.1 |
0.7, 1.7 |
|
|
|
|
|
|
|
540 - 640 |
nd |
nd |
1.3 |
0.9, 2.0 |
|
|
|
|
|
|
|
640 - 850 |
nd |
nd |
1.1 |
0.7, 1.7 |
|
|
|
|
|
|
|
>850 |
nd |
nd |
1.0 |
Reference |
|
|
Calcium and hypertension and blood pressure
We searched for systematic reviews and primary studies that evaluated associations between calcium intake or body stores and incidence of hypertension and change in blood pressure. For the outcome incidence of hypertension, we reviewed randomized controlled trials and other longitudinal studies. For the outcome change in blood pressure, we reviewed only randomized controlled trials. The EPC and the TEP agreed that due to the large volume of literature, the limited resources would not be expended on reviewing observational studies for the surrogate outcome blood pressure. We included only studies of adults. Studies of pregnancy-related hypertension and blood pressure control are included in the pregnancy section.
Calcium and hypertension
Synopsis
No systematic reviews evaluated the association between calcium intake and incidence of hypertension. The association has been analyzed in five large studies (6 articles/analyses). No RCTs of calcium intake evaluated hypertension incidence. In analyses of men and women together and of men alone, there was no evidence of an association between calcium intake and risk of hypertension. In the Women’s Health Study (WHS), a highly significant trend was found across quintiles of calcium intake and risk of hypertension, with significantly lower rates of hypertension found among women consuming at least 679 mg calcium per day compared to less than 558 mg calcium per day. The two articles that reported subgroup analyses based on age found associations between lower calcium intake and hypertension among younger adults (below 40 or 50 years of age), but no significant associations in older adults.
Detailed presentation (Tables 80 & 81 and Figure 21)
The six articles, reporting investigations of five studies, included two analyses of combined men and women in the NHANES I study and Navarra, Spain (both methodological quality C),183,184 two analyses of men alone in the Health Professionals Follow-up Study (HPFS) and NHANES I (of methodological quality B and C, respectively),185,186 and three analyses of women alone in the WHS, the Nurses Health Study (NHS), and NHANES I (of methodological quality A, B, and C, respectively).186-188 All studies included only people without hypertension at baseline. Only the A quality analysis, WHS, included elevated blood pressure in their outcome definition of hypertension; all other analyses used self-reported hypertension (generally based on a physician’s diagnosis or treatment). The mean ages of the participants varied widely across studies (36-54 years) among those that reported mean data; the range of ages within studies varied from broad (20-90 years) to narrow (30-55 years) among those that reported ranges. All studies reported adjusted analyses; though each adjusted for different factors. Most of the studies were limited by such factors as reliance on self-reported hypertension (without assessment of blood pressure), exclusion of numerous participants due to lack of data, inadequate reporting of results data, and lack of reporting of definitions (ranges or averages of calcium quintiles).
Two studies reported analyses for combined men and women. These are discussed here. The remaining analyses of men or women separately are discussed below. In analyses of combined men and women (each with almost 7000 participants), neither study reported a significant association. No significant trend or individual analyses of quintiles was found in the short duration (2 years) Spanish cohort study. A poorly reported analysis from NHANES I concluded that there was progressively higher incidence of hypertension in lower quartiles of calcium
intake after 10 years, but no statistical analysis was performed and the definitions of the quartiles were not provided.
Findings per calcium intake level
Among the studies that provided definitions of the compared categories of calcium intake, consistent significant associations were found for calcium intakes below 500 mg/day in men under age 50 years (compared to over 1100 mg/day) and below 558 mg/day in women (compared to over 678 mg/day).
Findings per age and sex
Men alone were analyzed from the PHFS (about 31,000 men) and NHANES I (about 2000 men, split by race). Neither analysis found a significant trend or any significant differences among different calcium intake categories at 4 and 10 years, respectively for the two studies.
Women alone were analyzed from three studies. The studies had heterogeneous findings. The A quality analysis of the WHS (about 29,000 women) found a highly significant trend across quintiles (P<0.0001) at 10 years with a significantly higher rate of hypertension in women in the lowest calcium intake quintile (189-557 mg/day) compared to all quintiles with intakes above 679 mg/day. However, the B quality analysis of the NHS (about 41,500 women) found no significant association by calcium intake at 14 years and the C quality analysis of NHANES I (about 3500 women, split by race) found no consistent association at 10 years.
One C quality analysis of NHANES I assessed subgroups of combined men and women by age (divided at 40 years old). Among people under age 40 years, those in the lowest quartile of calcium intake had significantly higher rates of being treated for hypertension after 10 years; however, the article failed to define the calcium intake quartiles. No significant association was found among older participants. In the HPFS, in men under age 50 years, a higher rate of hypertension at 4 years was found in those with calcium intake less than 500 mg/d compared to over 1100 mg/d; but no association was found in older men.
Findings by life stage
-
0 – 6 mo Not reviewed
-
7 mo – 2 y Not reviewed
-
3 – 8 y Not reviewed
-
9 – 18 y Not reviewed
-
19 – 50 y Five of the six studies included mostly people within this life stage.183-186,188 Overall, there was no evidence of a significant association between calcium intake and risk of hypertension. However, as described in detail in the Findings per age and sex section above, in two subgroup analyses, significant associations were found between the lowest category of calcium intake and increased risk of hypertension in younger people (under age 40 – calcium intake range not reported, or age 50 years – less than 500 mg/d compared to over 1100 mg/d.
-
51 – 70 y Four of the six studies included people largely within this life stage.184,185,187,188 The studies mostly found no significant associations between calcium intake and risk of hypertension, including within the 2 subgroups of adults above 40 or 50 years of age. However, the WHS, which included women mostly within this life stage, found a highly significant trend across quintiles (P<0.0001) at 10 years with a significantly higher rate of hypertension in women in the lowest calcium intake quintile (189-557 mg/d) compared to all quintiles with intakes above 679 mg/d.
-
≥71 y Few of the people in the studies appear to have been in this life stage. Nounique conclusions are possible for this life stage separate from those for people 51 to 70 years.
-
Postmenopause Only the WHS appeared to have included (or analyzed) primarily postmenopausal women. The study found a highly significant trend across quintiles (P<0.0001) at 10 years with a significantly higher rate of hypertension in women in the lowest calcium intake quintile (189-557 mg/d) compared to all quintiles with intakes above 679 mg/d.
-
Pregnant & lactating women Not reviewed
Table 80. Calcium and hypertension incidence: Characteristics of cohort studies
|
Author Year Study Name Location [PMID] |
Population |
Dietary Calcium intake |
Comparisons |
Confounders/Effect Modifiers Adjusted |
Comments |
|||||||
|
Nutrients |
Demograph |
Anthrop |
Medical |
UV exposure |
Lifestyle |
|||||||
|
Alonso 2005183 U Navarra Follow-up Navarra Spain (43°N) [16280427] |
• Health status |
Normotensive |
• Dietary assessment method |
FFQ |
Hypertension incidence stratified by total Ca intake quintiles |
X |
X |
X |
X |
|
X |
Total Ca (both) |
|
• Mean age (range), y |
36 (20-90) |
|
|
|
|
|
|
|
||||
|
• Male (%) |
39 |
• Internal validation? (y/n) |
No |
|
|
|
|
|
|
|
||
|
Dwyer 1996184A NHANES I US (various) [8890661] |
• Health status |
Normotensive |
• Dietary assessment method |
24 recall |
Hypertension incidence stratified by total Ca intake quartiles |
X |
X |
X |
|
|
X |
Total Ca (both) |
|
• Mean age (range), y |
46 (25-74) |
|
|
|
|
|
|
|
||||
|
|
• Male (%) |
63 |
• Internal validation? (y/n) |
nd |
|
|
|
|
|
|
|
|
|
Ascherio 1992185 HPFS US (various) [1330360] |
• Health status |
Normotensive |
• Dietary assessment method |
FFQ |
Hypertension incidence stratified by total Ca intake categories |
|
X |
X |
|
|
X |
Total Ca (both) |
|
• Median age (range), y |
50 (40-75) |
|
|
|
|
|
|
|
||||
|
|
• Male (%) |
100 |
• Internal validation? (y/n) |
Yes |
|
|
|
|
|
|
|
|
|
Ford 1991186B NHANES I US (various) [1937662] |
• Health status |
Normotensive |
• Dietary assessment method |
nd |
Hypertension incidence stratified by total Ca intake quartiles |
X |
X |
|
|
|
|
Total Ca (both) |
|
• Mean age (range), y |
nd (≥25) |
|
|
|
|
|
|
|
||||
|
|
• Male (%) |
35 |
• Internal validation? (y/n) |
nd |
|
|
|
|
|
|
|
|
|
Wang 2008187 WHS US (various) [18259007] |
• Health status |
Normotensive |
• Dietary assessment method |
FFQ |
Hypertension incidence stratified by total Ca intake quintiles |
X |
X |
X |
X |
|
X |
Total Ca (both) |
|
• Mean age (SD, range), y |
54 (6.5; ≥45) |
|
|
|
|
|
|
|
||||
|
|
• Male (%) |
0 |
• Internal validation? (y/n) |
No |
|
|
|
|
|
|
|
|
|
Ascherio 1996188 NHS US (various) [8621198] |
• Health status |
Normotensive |
• Dietary assessment method |
FFQ |
Hypertension incidence stratified by total Ca intake categories |
|
X |
X |
|
|
X |
Total Ca (both) |
|
• Mean age (range), y |
nd (30-55) |
|
|
|
|
|
|
|
||||
|
|
• Male (%) |
0 |
• Internal validation? y/n) |
Yes |
|
|
|
|
|
|
|
|
|
A Overall and age subgroup analyses from NHANES I reported in this study. However, different samples selected; 63% male. B Sex and race subgroup analyses from NHANES I reported in this study. However, different samples selected; 35% male. |
||||||||||||
Table 81. Calcium and hypertension incidence: Results of cohort studies
|
Author Year Study Name [PMID] |
Age Range, Sex |
Outcome (n/N, Incidence) |
Followup Duration (Time to Dx) |
Total Ca Intake, mg/day |
No. of Cases |
No. in Category |
Adjusted OR |
95% CI |
P for Trend |
Study Quality |
|
Both Sexes |
||||||||||
|
Alonso 2005183 U Navarra Follow-up [16280427] |
20-90 y, Both |
Hypertension (180/6686, 0.027) |
2 y |
Mean (SD) 900 (200) |
39 |
~1337 |
1 |
Reference |
0.67 |
C |
|
|
|
|
|
1000 (200) |
39 |
~1337 |
0.98 |
0.62, 1.54 |
|
|
|
|
|
|
|
1200 (200) |
35 |
~1337 |
0.82 |
0.51, 1.30 |
|
|
|
|
|
|
|
1400 (300) |
30 |
~1337 |
0.73 |
0.45, 1.19 |
|
|
|
|
|
|
|
1700 (400) |
37 |
~1337 |
0.97 |
0.61, 1.54 |
|
|
|
Dwyer 1996184A NHANES I [8890661] |
25-74 y, Both |
Hypertension, treated (1704/6634, 0.257) |
10 y |
nd |
nd |
~1658 |
29.8% |
|
nd |
C |
|
|
|
|
|
nd |
nd |
~1658 |
~27% |
|
|
|
|
|
|
|
|
nd |
nd |
~1658 |
~25% |
|
|
|
|
|
|
|
|
nd |
nd |
~1658 |
21.3% |
|
|
|
|
|
≤40 y |
Hypertension, treated (nd/nd) |
10 y |
nd |
nd |
nd |
1 |
Reference |
|
|
|
|
|
|
|
nd |
nd |
nd |
0.70 |
0.54, 0.91C |
nd |
|
|
|
|
|
|
nd |
nd |
nd |
0.79 |
0.66, 0.94C |
|
|
|
|
|
|
|
nd |
nd |
nd |
0.89 |
0.81, 0.97C |
|
|
|
|
>40 y |
Hypertension, treated (nd/nd) |
10 y |
nd |
nd |
nd |
1 |
Reference |
|
|
|
|
|
|
|
nd |
nd |
nd |
1.01 |
0.94, 1.08 |
nd |
|
|
|
|
|
|
nd |
nd |
nd |
1.02 |
0.89, 1.18 |
|
|
|
|
|
|
|
nd |
nd |
nd |
1.04 |
0.84, 1.28 |
|
|
|
Men |
||||||||||
|
Ascherio 1992185 HPFS [1330360] |
40-75 y, Men |
Hypertension (1248/30,681, 0.041) |
4 y |
<500 |
85 |
1677 |
1.17 |
0.91, 1.50 |
0.53 |
B |
|
|
|
|
|
500-700 |
297 |
7504 |
0.91 |
0.77, 1.07 |
|
|
|
|
|
|
|
700-900 |
333 |
8576 |
0.89 |
0.76, 1.04 |
|
|
|
|
|
|
|
900-1100 |
195 |
5038 |
0.91 |
0.76, 1.09 |
|
|
|
|
|
|
|
≥1100 |
338 |
7890 |
1 |
Reference |
|
|
|
|
≤50 y |
Hypertension (nd/14,354) |
4 y |
<500 |
nd |
nd |
1.52 |
nd* |
nd |
|
|
|
|
|
|
500-1100 |
nd |
nd |
0.86 |
nd |
|
|
|
|
|
|
|
≥1100 |
nd |
nd |
1 |
Reference |
|
|
|
|
>50 y |
Hypertension (nd/16,314) |
4 y |
<500 |
nd |
nd |
0.98 |
nd |
|
|
|
|
|
|
|
500-1100 |
nd |
nd |
0.91 |
nd |
|
|
|
|
|
|
|
≥1100 |
nd |
nd |
1 |
Reference |
|
|
|
Author Year Study Name [PMID] |
Age Range, Sex |
Outcome (n/N, Incidence) |
Followup Duration (Time to Dx) |
Total Ca Intake, mg/day |
No. of Cases |
No. in Category |
Adjusted OR |
95% CI |
P for Trend |
Study Quality |
|
Ford 1991186B NHANES I [937662] |
≥25 y, Men (White) |
Hypertension (360/1707, 0.211) |
10 y |
<344 |
47 |
~215 |
1 |
Reference |
nd |
C |
|
|
|
|
|
344-591 |
78 |
~382 |
0.91 |
0.60, 1.38 |
|
|
|
|
|
|
|
591-954 |
104 |
~448 |
1.09 |
0.73, 1.63 |
|
|
|
|
|
|
|
>954 |
131 |
~662 |
0.96 |
0.64, 1.45 |
|
|
|
|
≥25 y, Men (Black) |
Hypertension (64/183, 0.350) |
10 y |
<344 |
20 |
~34 |
1 |
Reference |
nd |
|
|
|
|
|
|
344-591 |
17 |
~45 |
0.68 |
0.28, 1.65 |
|
|
|
|
|
|
|
591-954 |
18 |
~56 |
0.54 |
0.22, 1.33 |
|
|
|
|
|
|
|
>954 |
9 |
~34 |
0.35 |
0.11, 1.13 |
|
|
|
Women |
||||||||||
|
Wang 2008187 WHS [8259007] |
≥45 y, Women |
Hypertension 8529/28,886, 0.295) |
10 y |
189-557 |
1860 |
5777 |
1 |
Reference |
<0.0001 |
A |
|
|
|
|
|
558-678 |
1778 |
5777 |
0.96 |
0.90, 1.03 |
|
|
|
|
|
|
|
679-801 |
1626 |
5777 |
0.89 |
0.83, 0.95C |
|
|
|
|
|
|
|
802-999 |
1634 |
5777 |
0.89 |
0.83, 0.95C |
|
|
|
|
|
|
|
1000-2559 |
1631 |
5777 |
0.87 |
0.81, 0.93C |
|
|
|
Ascherio 1996188 NHS [621198] |
30-55 y, Women |
Hypertension 2526/41,541, 0.061) |
14 y |
<400 |
87 |
5581 person-y |
1 |
Reference |
0.76 |
B |
|
|
|
|
|
400-600 |
608 |
36,605 |
1.07 |
0.85, 1.35 |
|
|
|
|
|
|
|
600-800 |
712 |
42,544 |
1.05 |
0.83, 1.31 |
|
|
|
|
|
|
|
800-1000 |
407 |
24,240 |
1.03 |
0.82, 1.31 |
|
|
|
|
|
|
|
≥1000 |
712 |
41,325 |
1.04 |
0.83, 1.31 |
|
|
|
Ford 1991186B NHANES I [937662] |
≥25 y, Women (White) |
Hypertension (645/3065, 0.210) |
10 y |
<344 |
186 |
~865 |
1 |
Reference |
nd |
C |
|
|
|
|
|
344-591 |
183 |
~806 |
1.11 |
0.87, 1.43 |
|
|
|
|
|
|
|
591-954 |
172 |
~775 |
1.17 |
0.90, 1.51 |
|
|
|
|
|
|
|
>954 |
104 |
~619 |
1.01 |
0.74, 1.38 |
|
|
|
|
≥25 y, Women (Black) |
Hypertension (171/456, 0.375) |
10 y |
<344 |
94 |
~225 |
1 |
Reference |
nd |
|
|
|
|
|
|
344-591 |
35 |
~120 |
0.61 |
0.37, 1.01 |
|
|
|
|
|
|
|
591-954 |
31 |
~74 |
1.11 |
0.62, 2.01 |
|
|
|
|
|
|
|
>954 |
11 |
~37 |
0.77 |
0.33, 1.81 |
|
|
|
* Statistically significant (P<0.05) A Overall and age subgroup analyses from NHANES I reported in this study. However, different samples selected; 63% male. B Sex and race subgroup analyses from NHANES I reported in this study. However, different samples selected; 35% male. C Estimated from available data |
||||||||||
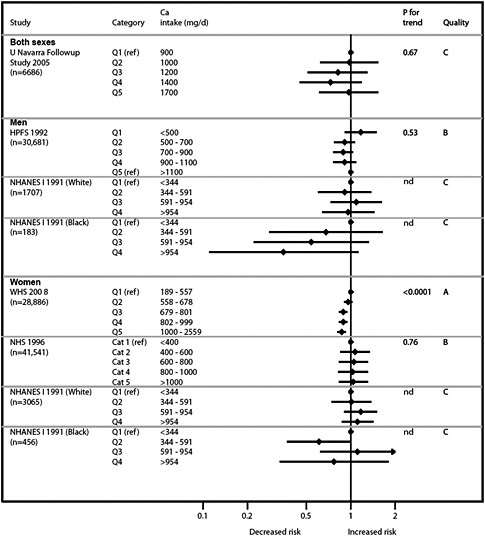
Calcium and blood pressure
Synopsis
We identified six systematic reviews that evaluated RCTs of calcium intake and changes in blood pressure. Five additional trials not identified by these systematic reviews met eligibility criteria for this report and are summarized together with the systematic reviews. Altogether, 69 trials have been identified. The range of intervention calcium doses were approximately 400 to 2000 mg/d, with most studies using 1000 to 1500 mg/d. The systematic reviews followed the patterns of the primary studies in that they were divided among those that focused on studies of people without hypertension, people with hypertension, and general populations (with or without hypertension, without subgroup analyses). Because the systematic reviews all used somewhat different eligibility criteria, they included overlapping groups of trials. No one or two systematic reviews captured most of the relevant trials; therefore, all systematic reviews are included here.
Two overlapping systematic reviews evaluated trials of normotensive individuals. Both found no significant effect of calcium supplementation and blood pressure. The two additional, more recent primary studies of normotensive participants were consistent with this finding.
Four overlapping systematic reviews of the effect of calcium on blood pressure in hypertensive individuals mostly found significant effects on systolic blood pressure (ranging from about −2 to −4 mm Hg). An older, highly selective systematic review found no significant effect. The systematic review that found the largest effect of calcium on systolic blood pressure also found a significant effect on diastolic blood pressure (−1.5 mm Hg), but the other systematic reviews found no significant effect. None of the more recent primary studies were in people exclusively with hypertension.
Four of the systematic reviews performed meta-analyses of all people regardless of hypertension diagnosis. Except for the oldest, highly selective systematic review, they found significant effects on systolic blood pressure (ranging from −1.9 to −0.9 mm Hg). The summary estimates of the effect on diastolic blood pressure ranged from −1.0 to +0.03 mm Hg, which were mostly nonsignificant. The individual, recent primary studies of mixed populations (in terms of hypertension) found larger, though statistically nonsignificant, effects.
The systematic reviews that evaluated factors including age, sex, calcium dose, background dietary calcium, supplement versus dietary source, and other factors found no significant associations (or differences). The five additional primary studies did not provide further insights into these subgroup analyses.
Detailed presentation (Tables 82, 83, & 84)
The six systematic reviews explicitly or implicitly used generally different eligibility criteria, resulting in large overlaps in the trials included.169,189-193. The systematic reviews included a total of 64 trials. The largest systematic review189 included trials up to 1997 and was an update of a previous review191 that reported more analyses. The next largest systematic review190 was one of the more recent systematic reviews (including trials through 2003). The most recent systematic review169 was restricted to trials of people with hypertension. Five more recent trials, not included in any of the systematic reviews were found.120,194-197 Two of the trials were restricted to normotensive individuals; none included only people with hypertension.
Normotensive individuals
The systematic reviews by Bucher et al. (1996)191 and Allender et al. (1996)192 evaluated trials of normotensive individuals. The range of intervention calcium doses were approximately 400 to 2000 mg/d, with most studies using 1000 to 1500 mg/d. Both found no significant effect of calcium supplementation on blood pressure (net effect on systolic blood pressure of −0.27 and −0.53 mm Hg, respectively, and on diastolic blood pressure of −0.33 and −0.28 mm Hg, respectively). The two additional, more recent primary studies of normotensive participants were consistent with this finding. The TOHP trial compared calcium supplement to placebo in people without hypertension but high normal diastolic blood pressure (80-89 mm Hg) and found a nonsignificant net change in blood pressure of approximately −0.5/+0.35 mm Hg (systolic/diastolic) after 18 months.195 Lijnen 1995 also compared calcium supplement to placebo, but in men who had been put on a low calcium run-in diet, and found a nonsignificant net change in blood pressure of approximately −2/−1 mm Hg after 4 months.197 Both trials had methodological quality C due to inadequate reporting of this outcome or of the background calcium intakes of the participants. Bucher et al. (1996) reported a wide range of study quality; Allender et al. (1996) did not evaluate study quality.
Findings per calcium intake level
Neither systematic review performed subgroup analyses of the normotensive individuals to evaluate a dose (calcium intake) effect. Qualitative examination of the data provided in the systematic review tables and the two additional trials did not indicate any dose effect.
Findings per age and sex
Neither systematic review performed subgroup analyses of the normotensive individuals to evaluate age or sex. The trials in the Allender et al. (1996) systematic review and the two additional trials represented a wide range of ages, though apparently all participants were under age 70 years. Studies were of all men, all women, and both sexes. There were no apparent differences based on age or sex.
Hypertensive individuals
Four systematic reviews evaluated trials of hypertensive individuals (Bucher et al. 1996191, Allender et al. 1996192, Cappuccio et al. 1989193, and Dickinson 2006198). Dickinson et al. (2006) included only studies of people with hypertension. The range of supplemental calcium was approximately 400 to 2000 mg/d in most systematic reviews, with most studies using 1000 to 1500 mg/d. The systematic reviews generally found significant effects on systolic blood pressure of about −2 to −4 mm Hg, but no (or small) effects on diastolic blood pressure. The one systematic review that found no effect of calcium supplementation on systolic blood pressure (Cappuccio et al. 1989) was the oldest systematic review (including trials up to only 1988). In addition, the reviewers were highly selective in their eligibility criteria, having excluded trials that did not report various types of baseline data. The one systematic review that found a significant effect of calcium supplementation on diastolic blood pressure (Bucher et al. 1996) meta-analyzed only6 trial subgroups of people with hypertension, compared to 10 to 16 trials in the other systematic reviews. None of the more recent trials provided analyses in only people with hypertension.
Findings per calcium intake level
Only Dickinson et al. (2006), the systematic review of only trials of people with hypertension, evaluated calcium intake (or dose) as a predictor of effect. They found essentially the same overall effects on systolic and diastolic blood pressures in studies that used less than
1200 mg/d or 1200to 2000 mg/d of calcium. Qualitative examination of the data provided in the tables of the remaining systematic reviews did not indicate any dose effect.
Findings per age and sex
No systematic review evaluated the association between age or sex and treatment effect in trials of people with hypertension. Overall, the range of ages of participants was about 20 to 75 years. Studies were of all men, all women, and both sexes. There were no apparent differences based on age or sex.
All trials (combined normotensive and hypertensive individuals)
Five systematic reviews (including one which is an update of a second) combined trials of hypertensive, normotensive, or mixed groups of people (Griffith et al. 1999189, van Mierlo et al. 2006190, Bucher et al. 1996191, Allender et al. 1996192, and Cappuccio et al. 1989193). The range of calcium supplementation was approximately 400 to 2000 mg/d in most systematic reviews, with most studies using 1000 to 1500 mg/d. The systematic reviews generally found a significant effect of calcium supplementation on systolic blood pressure of −0.9 to −1.9 mm Hg (excluding the earliest, highly selective systematic review by Cappuccio et al. (1989)193, as discussed above). The two systematic reviews that included the most studies (Griffith et al. 1999189 and van Mierlo et al. 2006190) found a significant effect on diastolic blood pressure (−0.8 and −1.0 mm Hg, respectively). The smaller, older systematic reviews found no significant effect (Allender et al. 1996192 and Cappuccio et al. 1989193). The reason for the difference in conclusions of the systematic reviews may relate to greater statistical power in the more recent meta-analyses or differences in study eligibility criteria. The systematic reviews that reported on study heterogeneity found significant heterogeneity. Three of the systematic reviews reported data on subgroup or regression analyses to explain the heterogeneity. The only factor that explained a significant amount of the heterogeneity was the difference in effect between studies of people with or without hypertension. (The age, sex, and calcium dose analyses are described below.)
Two recent randomized trials included postmenopausal women (over 50 or 55 years) regardless of their blood pressure;120,194 a third trial enrolled pregnant women and evaluated long-term postpartum blood pressures.196 The trials each compared different interventions: calcium citrate 1000 mg versus placebo; dairy product intake (with a mean of 1242 mg/d calcium) versus nondairy product intake (377 mg/d calcium); and calcium carbonate 2000 mg/d versus placebo in women all taking prenatal vitamins that included 400 IU/d vitamin D2. The calcium citrate trial was of methodological quality B; the other two trials C. The recent trials found broadly similar conclusions to that of the systematic reviews, with women with greater calcium intake having lower systolic blood pressure (−2.2 to −5.4 mm Hg) and smaller decreases in diastolic blood pressure (−0.7 to −2.2 mm Hg); though none of the effects was statistically significant.
Findings per calcium intake
Three systematic reviews190-192 evaluated calcium dose (or intake) as a source of heterogeneity. None found a significant association. Specifically, van Mierlo et al. (2006) found similar (though smaller) effects in studies of over 1000 mg/d of calcium (SBP/DBP −1.75/−0.56) compared to studies of 1000 mg/d of calcium or less (−2.17/−1.41).
Findings per age and sex
Age and sex were evaluated as potential explanations of heterogeneity in two systematic reviews.190,192 Neither found that age or sex were significantly associated with the effect of
calcium on blood pressure. However, these analyses are subject to ecological fallacy, as they used the mean ages and the percent of study participants who were male as proxies for the effects of calcium intake in people of a particular age or sex. Most studies included participants under age 70 years. Studies were of all men, all women, and both sexes.
Findings by life stage
-
0 – 6 mo Not reviewed
-
7 mo – 2 y Not reviewed
-
3 – 8 y Not reviewed
-
9 – 18 y Not reviewed
-
19 – 50 y The majority of studies are applicable to people within this life stage; though people under approximately 40 years are less well represented. The evidence suggests no significant effect of calcium supplementation on blood pressure in normotensive individuals. In people with hypertension, the evidence suggests that calcium supplementation lowers systolic blood pressure by about −2to −4 mm Hg, but does not change diastolic blood pressure. The effect appears to be consistent across calcium supplement doses (specifically above or below 1200 mg/d).
-
51 – 70 y The majority of studies are applicable to people within this life stage. The conclusions are the same as for those in the 19-50 years life stage.
-
≥71 y The evidence is scant for this life stage. Few of the studies appear to have included people over age 70 years.
-
Postmenopause Our review of the evidence does not allow for a definitive conclusion for this life stage. None of the systematic reviews evaluated menopausal status as an explanatory variable for heterogeneity.
-
Pregnant & lactating women Not reviewed
Table 82. Summary of systematic reviews of calcium and blood pressure
|
Author Year [PMID] |
Griffith 1999189 [10075392] |
||||||||
|
Design (Search Years) |
Randomized controlled trials (1966-1997) |
||||||||
|
Population |
Both hypertensive and normotensive participants |
||||||||
|
Intervention and Comparator |
Dietary and nondietary calcium supplementation versus placebo (no supplement) Dose range 600-2000 mg (36% 1000 mg; 26% 1500-1600 mg; 12% 2000 mg) |
||||||||
|
Results |
42 trials SBP: −1.44 (−2.20, −0.68)A; statistically heterogeneous DBP: −0.84 (−1.44, −0.24); statistically heterogeneous Subgroup analyses did not find that heterogeneity could be explained by age, sex, baseline calcium, dietary versus nondietary calcium, or quality. Subgroups with hypertensive versus normotensive people were significantly different (no further details). Conclusions similar to previous systematic review (Bucher 1996191) |
||||||||
|
Comments |
Update of Bucher 1996191 (see below). |
||||||||
|
AMSTAR |
|||||||||
|
A priori design? |
Yes |
Study quality assessment performed? |
Yes |
||||||
|
Two independent reviewers? |
Yes |
Study quality appropriately used in analysis? |
No |
||||||
|
Comprehensive literature search? |
Yes |
Appropriate statistical synthesis? |
Yes |
||||||
|
All publication types and languages included? |
Yes |
Publication bias assessed? |
No |
||||||
|
Included and excluded studies listed? |
Yes |
|
Conflicts of interest stated? |
No |
|||||
|
Study characteristics provided? |
Yes |
Study quality not discussed in conclusions. Funding source reported, but not conflict of interest. |
|
||||||
|
Author Year [PMID] |
van Mierlo 2006190 [16673011] |
||||||||
|
Design (Search Years) |
Randomized controlled trials (1966-2003) |
||||||||
|
Population |
Both hypertensive and normotensive participants |
||||||||
|
Intervention and Comparator |
Calcium supplementation versus placebo (no supplement) Dose range 355-2000 mg (40% 1000 mg; 32% 1500-1600 mg; 6% 2000 mg) |
||||||||
|
Results |
40 trials SBP: −1.86 (95% CI −2.91, −0.81); statistically heterogeneous DBP: −0.99 (95% CI −1.61, −0.37); statistically heterogeneous In multivariable analysis including age, sex, initial calcium intake, calcium dose, and initial blood pressure: |
||||||||
|
SBP |
DBP |
||||||||
|
|
|
Age <45 y |
|
−1.45 (−2.99, +0.09) |
−1.26 (−2.20, −0.33) |
|
|||
|
|
|
≥45 y |
|
−2.33 (−3.69, −0.96) |
−0.80 (−1.62, +0.02) |
|
|||
|
|
|
Male ≤50% |
|
−2.20 (−3.68, −0.72) |
−1.12 (−1.98, −0.26) |
|
|||
|
|
|
>50% |
|
|
−1.77 (−3.13, −0.42) |
−0.84 (−1.65, −0.04) |
|
||
|
|
|
Initial BP |
<140/90 mm Hg |
−2.04 (−3.40, −0.68) |
−1.04 (−1.86, −0.22) |
||||
|
|
|
|
≥140/90 mm Hg |
−1.85 (−3.45, −0.32) |
−0.89 (−1.79, +0.01) |
|
|||
|
|
|
Ca dose |
≤1000 mg |
−2.17 (−3.59, −0.75) |
−1.41 (−2.24, −0.59) |
||||
|
|
|
|
>1000 mg |
−1.75 (−3.20, −0.31) |
−0.56 (−1.40, +0.29) |
|
|||
|
|
Blood pressures not statistically significantly different between any strata. |
||||||||
|
Comments |
|||||||||
|
AMSTAR |
|||||||||
|
A priori design? |
Yes |
Study quality assessment performed? |
Yes |
||||||
|
Two independent reviewers? |
Yes |
Study quality appropriately used in analysis? |
No |
||||||
|
Comprehensive literature search? |
Yes |
Appropriate statistical synthesis? |
Yes |
||||||
|
All publication types and languages included? |
Unclear |
Publication bias assessed? |
Yes |
||||||
|
Included and excluded studies listed? |
Partial |
Conflicts of interest stated? |
Yes |
||||||
|
Study characteristics provided? |
Yes |
No data on inclusion of unpublished data. Excluded studies available from authors |
|
||||||
|
Author Year [PMID] |
Bucher 1996191 [8596234] |
||||||
|
Design (Search Years) |
Randomized controlled trials (1966-1994) |
||||||
|
Population |
Both hypertensive and normotensive participants |
||||||
|
Intervention and Comparator |
Dietary and nondietary calcium supplementation vs. placebo (no supplement) Dose range 406-2000 mg (41% 1000 mg; 31% 1500-1600 mg; 8% 2000 mg) |
||||||
|
Results |
33 trials |
||||||
|
|
[Overall summary results were updated in Griffith 1999189, above] |
||||||
|
|
Studies with specified subgroups of hypertensive and normotensive participants (6 trials): |
||||||
|
|
|
Hypertensives |
SBP −4.30 (−6.47, −2.13) |
DBP −1.50 (−2.77, −0.23) |
|||
|
|
|
Normotensives |
SBP −0.27 (−1.80, +1.27) |
DBP −0.33 (−1.56, +0.90) |
|||
|
|
Regression analyses: |
||||||
|
|
|
BP (continuous scale) |
SBP OR = 0.99 (0.96, 1.01) |
DBP OR = 0.99 (0.96, 1.03) |
|||
|
|
Dose of calcium, duration of supplementation, dietary vs. nondietary calcium supplementation, methodological quality did not demonstrate a relationship with the magnitude of treatment effect. |
||||||
|
Comments |
Updated in Griffith 1999189 (see above) |
||||||
|
AMSTAR |
|||||||
|
A priori design? |
Yes |
Study quality assessment performed? |
Yes |
||||
|
Two independent reviewers? |
Yes |
Study quality appropriately used in analysis? |
Yes |
||||
|
Comprehensive literature search? |
Yes |
Appropriate statistical synthesis? |
Yes |
||||
|
All publication types and languages included? |
Yes |
Publication bias assessed? |
No |
||||
|
Included and excluded studies listed? |
Yes |
Conflicts of interest stated? |
No |
||||
|
Study characteristics provided? |
Yes |
Funding source reported, but not conflict of interest. |
|
||||
|
Author Year [PMID] |
Allender 1996192 [8610952] |
||||||
|
Design (Search Years) |
Randomized controlled trials (1982-1993) |
||||||
|
Population |
Both hypertensive and normotensive participants |
||||||
|
Intervention and Comparator |
Dietary and nondietary calcium supplementation vs. placebo (no supplement) Dose range 400-2160 mg (35% 1000 mg; 29% 1500-1600 mg; 10% 2000 mg) |
||||||
|
Results |
26 trials (22 trials included in meta-analyses) SBP: −0.89 (−1.74, −0.05) DBP: −0.18 (−0.75, +0.40) |
||||||
|
|
|
Hypertensives |
SBP −1.68 (−3.18, −0.18) |
DBP +0.02 (−0.96, +1.00) |
|||
|
|
|
Normotensives |
SBP −0.53 (−1.56, +0.49) |
DBP −0.28 (−0.99, +0.42) |
|||
|
|
By weighted linear regression analyses, age, sex, calcium dose, trial duration were not associated with treatment effect (P>0.10) |
||||||
|
Comments |
|
|
|
|
|
|
|
|
AMSTAR |
|||||||
|
A priori design? |
Yes |
Study quality assessment performed? |
No |
||||
|
Two independent reviewers? |
Yes |
Study quality appropriately used in analysis? |
No |
||||
|
Comprehensive literature search? |
Yes |
Appropriate statistical synthesis? |
No |
||||
|
All publication types and languages included? |
Yes |
Publication bias assessed? |
No |
||||
|
Included and excluded studies listed? |
No |
Conflicts of interest stated? |
No |
||||
|
Study characteristics provided? |
Yes |
Excluded studies not enumerated or listed. Fixed effects models used. |
|
||||
|
Author Year [PMID] |
Cappuccio 1989193 [2697729] |
||||||
|
Design (Search Years) |
Randomized controlled trials (1983-1988) |
||||||
|
Population |
Both hypertensive and normotensive participants |
||||||
|
Intervention and Comparator |
Nondietary calcium supplementation versus placebo (no supplement) or low calcium intake Dose range 800-1600 mg (60% 1000 mg; 27% 1500-1600 mg) |
||||||
|
Results |
15 trials |
||||||
|
|
SBP (supine): −0.13 (−0.46, +0.19) DBP (supine): +0.03 (−0.17, +0.22) |
||||||
|
|
|
Hypertensives |
SBP +0.06 (−0.59, +0.72) |
DBP +0.03 (−0.21, +0.27) |
|||
|
Comments |
|
|
|
|
|
|
|
|
AMSTAR |
|||||||
|
A priori design? |
Yes |
Study quality assessment performed? |
No |
||||
|
Two independent reviewers? |
nd |
Study quality appropriately used in analysis? |
NA |
||||
|
Comprehensive literature search? |
Yes |
Appropriate statistical synthesis? |
No |
||||
|
All publication types and languages included? |
nd |
Publication bias assessed? |
No |
||||
|
Included and excluded studies listed? |
No |
Conflicts of interest stated? |
No |
||||
|
Study characteristics provided? |
Yes |
Excluded studies not enumerated or listed. Fixed effects models used. |
|
||||
|
Author Year [PMID] |
Dickinson 2006198 [16625609]B |
||||||
|
Design (Search Years) |
Randomized controlled trials (1982-2003/2005C) |
||||||
|
Population |
Hypertensive participants |
||||||
|
Intervention and Comparator |
Dietary and nondietary calcium supplementation versus placebo (no supplement) Dose range 400-2000 mg (50% 1000 mg; 25% 1500-1600 mg; 6% 2000 mg) |
||||||
|
Results |
13 trials |
||||||
|
|
SBP: −2.53 (−4.45, −0.60); statistically heterogeneous DBP: −0.81 (−2.07, +0.44); statistically heterogeneous |
||||||
|
|
|
Ca dose <1200 mg |
SBP −2.67 (−5.15, −0.18) |
DBP −0.75 (−2.13, +0.63) |
|||
|
|
|
Ca dose 1200-2000 mg |
SBP −2.69 (−5.86, +0.47) |
DBP −0.78 (−3.82, +2.25) |
|||
|
|
|
Not statistically significantly different by calcium dose |
|||||
|
Comments |
|||||||
|
AMSTAR |
|||||||
|
A priori design? |
Yes |
Study quality assessment performed? |
Yes |
||||
|
Two independent reviewers? |
Yes |
Study quality appropriately used in analysis? |
Yes |
||||
|
Comprehensive literature search? |
Yes |
Appropriate statistical synthesis? |
Yes |
||||
|
All publication types and languages included? |
Yes |
Publication bias assessed? |
Yes |
||||
|
Included and excluded studies listed? |
Yes |
Conflicts of interest stated? |
Yes |
||||
|
Study characteristics provided? |
Yes |
|
|
|
|||
|
A Numbers in parentheses are 95% confidence intervals B A technical update, with no further studies added was published in the Cochrane database in 2008. C Different dates for different databases. |
|||||||
Table 83. Calcium and blood pressure: Characteristics of RCTs
|
Author Year Study Name Location (Latitude) [PMID] |
Population |
Background Calcium Intake & Vitamin D Data |
Comparisons |
Compliance |
Comments |
|
|
Whelton 1997195 TOHP US (various) [9022561] |
• Health status |
No HTN (DBP nd 80-89 mm Hg) |
nd |
Calcium supplement vs. Placebo |
nd |
|
|
• Mean age (range), y |
43 (30-54) |
|
|
|
||
|
• Male (%) |
68 |
|
|
|
|
|
|
Lijnen 1995197 Leuven, Belgium (51°N) [8557965] |
• Health status |
Normotensive |
“Low calcium diet” run-in |
Calcium supplement vs. Placebo |
nd |
With low dairy intake |
|
• Mean age (range), y |
24 (20-44) |
|
|
|
||
|
|
• Male (%) |
100 |
|
|
|
|
|
Reid 2005194 Auckland, New Zealand (36.5°S) [15827103] |
• Health status |
Healthy |
Ca 857 mg/day |
Calcium supplement vs. Placebo |
Calcium group: 55%, Placebo group: 58% |
|
|
• Mean age (range), y |
75 (≥55) |
|
|
|||
|
• Male (%) |
0 |
|
|
|
|
|
|
Ghadirian 1995120 Montreal, Canada (46°N) [7493659] |
• Health status |
Healthy |
Ca 776 mg/day |
Dairy vs. Dairy-free intake |
Non-compliant and those who provided incomplete data were excluded. |
|
|
• Mean age (range), y |
~80 (≥50) |
|
|
|
||
|
|
• Male (%) |
0 |
|
|
|
|
|
Hatton 2003196 CPEP Portland, Oregon (45.5°N) [14553957] |
• Health status |
Pregnant during trial |
nd |
Calcium supplement vs. Placebo (both on prenatal vitamins including Vit D2 400 IU) |
nd (but all had to meet a compliance test prior to randomization) |
Oregon site only. Post-pregnancy followup |
|
• Mean age (range/SD), y |
nd |
|
||||
|
|
• Male (%) |
0 |
|
|
|
|
Table 84. Calcium and blood pressure: Results of RCTs
|
Author Year Study Name [PMID] |
Age Range, Sex; Population |
Outcome |
1°/2° |
Mean Followup, unit |
Interventions, Daily Dose |
No. Analyzed |
Unit |
Baseline |
Change |
Change 95% CI |
Net Diff |
Net Diff 95% CI |
P Btw |
Study Quality |
|
SYSTOLIC BLOOD PRESSURE |
||||||||||||||
|
Normotensive |
||||||||||||||
|
Whelton 1997195 TOHP [9022561] |
30-54 y, Both; No HTN DBP 80-89 mm Hg) |
SBP |
1º |
18 mo |
Ca carbonate 1000 mg |
221 |
mm Hg |
126.0 |
nd |
nd |
~−0.5A |
~−2, −1 |
NS |
C |
|
Placebo |
224 |
|
125.4 |
nd |
nd |
|
|
|
||||||
|
Lijnen 1995197 Belgium [8557965] |
20-44 y, Men No HTN |
SBP, supine |
2° |
4 mo |
Ca gluconate 2000 mg (low dairy intake) |
16 |
mm Hg |
114 |
~−4A |
nd |
~−2 |
nd |
NS |
C |
|
Placebo (low dairy intake) |
16 |
|
114 |
~−2 |
nd |
|
|
|
||||||
|
All women |
||||||||||||||
|
Reid 2005194 New Zealand [15827103] |
≥55 y Women; All BP |
SBP |
2° |
All women 30 mo |
Ca citrate 1000 mg |
732 |
mm Hg |
134.9 |
0.0 |
−0.1, 0.1 |
−2.4 |
−0.8, 5.6 |
0.14 |
B |
|
Placebo |
739 |
|
133.9 |
+2.4 |
2.3, 2.5 |
|
|
|
||||||
|
Ghadirian 1995120 Canada [7493659] |
≥50 y, Women; All BP |
SBP |
2° |
1 mo |
Dairy intake (1242 mg Ca) |
81 |
mm Hg |
140.34 |
−2.69 |
−7.3, 2.0* |
−5.4 |
−12.3, 1.4C |
NS |
C |
|
Dairy-free (377 mg Ca) |
77 |
|
131.71 |
+2.75 |
−2.3, 7.8* |
|
|
|
||||||
|
Hatton 2003196 CPEP [14553957] |
Pregnant, WomenB; All BP |
SBP |
2° |
2 y post-partum |
Ca carbonate 2000 mg (+Vit D2 400 IU) |
37 |
mm Hg |
nd |
|
Final 101.9 |
Difference −2.2 |
−7.8, 3.4C |
NS |
C |
|
Placebo (+Vit D2 400 IU) |
25 |
|
nd |
|
104.1 |
|
|
|
||||||
|
DIASTOLIC BLOOD PRESSURE |
||||||||||||||
|
Normotensive |
||||||||||||||
|
Whelton 1997195 TOHP [9022561] |
30-54 y, Both; No HTN (DBP 80-89 mm Hg) |
DBP |
1º |
18 mo |
Ca carbonate 1000 mg |
221 |
mm Hg |
84.1 |
nd |
nd |
~+0.35A |
−1, 1 |
NS |
C |
|
Placebo |
224 |
|
83.9 |
nd |
nd |
|
|
|
||||||
|
Lijnen 1995197 Belgium [8557965] |
20-44 y, Men No HTN |
DBP, supine |
2° |
4 mo |
Ca gluconate 2000 mg (low dairy intake) |
16 |
mm Hg |
74 |
~−1A |
nd |
−1 |
nd |
NS |
C |
|
Placebo (low dairy intake) |
16 |
|
72 |
~0 |
nd |
|
|
|
||||||
|
All women |
||||||||||||||
|
Reid 2005194 New Zealand [15827103] |
>55 y Women; All BP |
DBP |
2° |
30 mo |
Ca citrate 1000 mg |
732 |
mm Hg |
70.1 |
−0.2 |
−0.2, −0.2 |
−1.0 |
−2.3, 0.3 |
0.13 |
B |
|
Placebo |
739 |
|
69.6 |
+0.8 |
0.8, 0.8 |
|
|
|
||||||
|
Author Year Study Name [PMID] |
Age Range, Sex; Population |
Outcome |
1°/2° |
Mean Followup, unit |
Interventions, Daily Dose |
No. Analyzed |
Unit |
Baseline |
Change |
Change 95% Cl |
Net Diff |
Net Diff 95% CI |
P Btw |
Study Quality |
|
Ghadirian 1995120 Canada [7493659] |
≥50 y, Women; All BP |
DBP |
2° |
1 mo |
Dairy intake (1242 mg Ca) |
81 |
mm Hg |
81.17 |
−7.78 |
−10.0, −5.5* |
−2.2 |
−5.4, 1.0C |
NS |
C |
|
Dairy-free (377 mq Ca) |
77 |
|
79.09 |
−5.59 |
−7.9, −3.3* |
|
|
|
||||||
|
Hatton 2003196 CPEP [14553957] |
Pregnant, WomenB; All BP |
DBP |
2° |
2 y post-partum |
Ca carbonate 2000 mg (+Vit D2 400 IU) |
37 |
mm Hg |
nd |
|
Final 67.1 |
Difference −0.7 |
−4.8, 3.4 |
NS |
C |
|
Placebo (+Vit D2 400 IU) |
25 |
|
nd |
|
67.8 |
|
|
|
||||||
|
A From figure B Blood pressure outcomes are 1 year post-partum C Estimated from available data |
||||||||||||||
Combined vitamin D and calcium and health outcomes
Women’s Health Initiative (WHI) trial
The WHI trial provided data for numerous health outcomes of interest. For this reason and because of some methodological issues unique to this trial, the study is discussed here. The trial compared combined vitamin D3 400 IU and calcium carbonate 1000 mg daily versus placebo in a 7 year trial in 36,282 postmenopausal women (age 50-79 y). The Tufts EPC, members of the Technical Expert Panel, and reviewers of the draft report debated about the quality of this trial. It was generally agreed that the overall methodological rigor and analyses were of good quality for most outcomes. However, there was not complete consensus on how to regard the fact that the women in both groups of this 7 year trial were allowed to take additional vitamin D supplements up to 600 IU and later 1000 IU per day and calcium supplements up to 1000 mg per day. At baseline, about one-third of women in both supplement and placebo groups were taking vitamin D supplements of at least 400 IU/d and 29 percent were taking at least 500 mg/d of supplemental calcium; by the end of the trial 69 percent of women were taking any additional supplemental calcium. During the 7 years, only about 60 percent of women (in any given year) were taking at least 80 percent of the study pills; at the end of the trial, only 76 percent were still taking any study medications. Regarding the overall quality of the study, arguments were put forward that this was a high quality effectiveness trial (in contrast with a more standardized efficacy trial) and thus had increased relevance to the actual use of supplements, that the crossover of interventions affects the applicability more than the methodological quality, and that the trial should not be down graded because data reporting was more complete than for most trials. However, it was the consensus among the Tufts EPC that overall, the methodological quality of the trial was B, particularly when the trial is being used to guide decisions about DRI, as opposed to decisions about whether to actively recommend supplementation for an individual woman.
Combined vitamin D calcium and growth
We reviewed primary studies that evaluated relationships between vitamin D and growth parameters in infants and children.
Synopsis
One C-rated nonrandomized study compared combined vitamin D (1200 IU/d) and calcium (375 mg/d) to no supplementation in women in their third trimester of pregnancy. Infants of women who received supplementation were significantly heavier at birth.
Detailed presentation (Tables 4 & 6)
Infant 0 - 6 months; 7 months - 2 years; pregnant or lactating women
We identified a study from India that included a nonrandomized comparison between combined vitamin D (1200 IU/d) and calcium (375 mg/d) for the expectant mothers versus no supplementation. The outcome was infant birth weight.41 This study has already been described in the “Vitamin D and growth” section, as it also included a vitamin D only intervention arm. The study included expectant mothers with daily milk intake less than 500 mL and estimated daily vitamin D intake less than 30 IU. It was rated C for methodological quality, because of the lack of randomization and incomplete reporting of analyses. According to the reported analysis,
infants of women who received supplementation were significantly heavier at birth by 160 g on average (95% CI 0, 320).
Findings by life stage
-
0 – 6 mo One C-rated nonrandomized study from India compared combined vitamin D (1200 IU/d) and calcium (375 mg/d) to no supplementation in women in their third trimester of pregnancy. Infants of women who received supplementation were significantly heavier at birth by 160 g on average (95% CI 0, 320). (See also the Pregnant & lactating women.)
-
7 mo – 2 y No identified study covered this life stage.
-
3 – 8 y No identified study covered this life stage.
-
9 – 18 y No identified study covered this life stage.
-
19 – 50 y Not reviewed
-
51 – 70 y Not reviewed
-
≥71 y Not reviewed
-
Postmenopause Not reviewed
-
Pregnant & lactating women One C-rated nonrandomized study from India compared combined vitamin D (1200 IU/d) and calcium (375 mg/d) to no supplementation in women in their third trimester of pregnancy. Infants of women who received supplementation were significantly heavier at birth by 160 g on average (95% CI 0, 320). (See also the 0 – 6 mo category.)
Combined vitamin D and calcium and cardiovascular disease
Synopsis
No qualified systematic reviews evaluated the association between combined vitamin D and calcium, body stores, or serum concentrations, and cardiovascular events. A variety of cardiovascular events after 7 years were evaluated in the Women’s Health Initiative (WHI) trial of combined daily vitamin D3 400 IU and calcium carbonate 1000 mg versus placebo in 50 to 79 year old women. No statistically significant effect was found with combined vitamin D and calcium supplementation on any cardiovascular outcome. However, near significant associations were found for three outcomes, suggesting increased risk with supplementation for a composite cardiac outcome that included invasive cardiac interventions, invasive cardiac interventions, and transient ischemic attacks. No significant associations were found for cardiovascular death, a composite cardiac outcome (myocardial infarction or cardiac death), coronary heart disease death, myocardial infarction, hospitalization for heart failure, angina, combined stroke or transient ischemic attack, stroke alone, or cerebrovascular death.
Detailed presentation (Tables 85 & 86)
In the WHI trial, discussed above, the evaluated cardiovascular outcomes were all prespecified secondary outcomes.199,200 On average, the women had normal blood pressure. There were no significant effects of the supplementation on any of the outcomes, though three of the outcomes did approach statistical significance suggesting increased events with supplementation: composite cardiac events (HR = 1.08 [95% CI 0.99, 1.19]), coronary artery bypass grafting or percutaneous coronary interventions (HR=1.09 [95% CI 0.98, 1.22]), and transient ischemic attacks (HR=1.16 [95% CI 0.95, 1.42]). The authors, however, concluded that calcium and vitamin D supplementation neither increased nor decreased coronary or cerebrovascular risk in generally healthy postmenopausal women. The outcomes cardiac death and stroke were evaluated by age decade. No interaction was found with age (no significant difference across age groups). A similar analysis based on total calcium intake (dietary plus supplemental) also found no interaction.
Findings per intake level
No conclusions are possible about a dose effect from this single study, especially since the women were allowed to take additional concurrent calcium and vitamin D supplements. However, no interaction was found with total reported calcium intake.
Findings by age and sex
The study investigated postmenopausal women 50 to 79 years old. No interaction of effects with decade of age was found.
Findings by life stage
-
0 – 6 mo Not reviewed
-
7 mo – 2 y Not reviewed
-
3 – 8 y Not reviewed
-
9 – 18 y Not reviewed
-
19 – 50 y No data available
-
51 – 70 y One large trial that included women mostly within this life stage (WHI) found no significant effect of combined vitamin D3 (400 IU) and calcium carbonate (1000 mg) on cardiovascular outcomes after 7 years.
-
≥71 y Inadequate available data.
-
Postmenopause All women in the WHI trial were postmenopausal. See 51-71 y life stage.
-
Pregnant & lactating women Not reviewed
Table 85. Combined vitamin D and calcium and cardiovascular outcomes: Characteristics of RCTs
|
Author Year Study Name Location (Latitude) [PMID] |
Population |
Background Calcium Intake & Vitamin D Data |
Comparisons |
Compliance |
Comments |
|
|
Hsia 2007199 LaCroix 2009200 WHI US (various) [17309935 19221190] |
• Health status |
Any |
Ca: 1148 (654) mg/d in treatment group; 1154 (658) in placebo group Low Ca intake (<800 mg/day): 34% |
Combined Vit D & Ca supplement vs. Placebo |
See page 242 |
|
|
• Mean age (range), y |
62 (50-79) |
|
|
|||
|
• Male (%) |
0 |
|
|
|
||
Table 86. Combined vitamin D and calcium and cardiovascular ascular outcomes: Results of RCTs
|
Author Year Study Name [PMID] |
Life Stage |
Outcome |
1°/2° |
Mean Followup, y |
Interventions, Daily Dose |
n Event |
N Total |
Outcome Metric (Comparison) |
Result |
95% CI |
P Btw |
Study Quality |
|
Hsia 2007199 LaCroix 2009200 WHI [17309935 19221190] |
50-79 y, Women |
Cardiovascular death |
2° |
7 |
Vit D + Ca |
226 |
18,176 |
HR (Suppl/Placebo) |
0.92* |
0.77, 1.10 |
NS |
B |
|
|
|
|
Placebo |
244 |
18,106 |
|
|
|
|
|
||
|
|
|
Cardiac composite MI, CHD death, CABG, or PCI) |
2° |
|
Vit D3 400 IU + Ca carbonate 1000 mg |
920 |
18,176 |
HR |
1.08 |
0.99, 1.19 |
0.10 |
|
|
|
|
|
Placebo |
841 |
18,106 |
|
|
|
|
|
||
|
|
|
Cardiac composite MI or CHD death) |
2° |
|
Vit D + Ca |
499 |
18,176 |
HR |
1.04 |
0.92, 1.18 |
0.50 |
|
|
|
|
|
Placebo |
475 |
18,106 |
|
|
|
|
|
||
|
|
|
CHD death |
2° |
|
Vit D + Ca |
130 |
18,176 |
HR |
1.01* |
0.79, 1.29 |
0.92 |
|
|
|
|
|
Placebo |
128 |
18,106 |
|
|
|
|
|
||
|
|
|
MI |
2° |
|
Vit D + Ca |
411 |
18,176 |
HR |
1.05 |
0.91, 1.20 |
0.52 |
|
|
|
|
|
Placebo |
390 |
18,106 |
|
|
|
|
|
||
|
|
|
CABG or PCI |
2° |
|
Vit D + Ca |
674 |
18,176 |
HR |
1.09 |
0.98, 1.22 |
0.12 |
|
|
|
|
|
Placebo |
607 |
18,106 |
|
|
|
|
|
||
|
|
|
Hospitalized for heart failure |
2° |
|
Vit D + Ca |
394 |
18,176 |
HR |
0.95 |
0.83, 1.10 |
0.50 |
|
|
|
|
|
Placebo |
407 |
18,106 |
|
|
|
|
|
||
|
|
|
Angina |
2° |
|
Vit D + Ca |
404 |
18,176 |
HR |
1.08 |
0.94, 1.24 |
0.30 |
|
|
|
|
|
Placebo |
377 |
18,106 |
|
|
|
|
|
||
|
|
|
Cerebrovascular composite (Stroke or TIA) |
2° |
|
Vit D + Ca |
563 |
18,176 |
HR |
1.02 |
0.91, 1.15 |
0.75 |
|
|
|
|
|
Placebo |
547 |
18,106 |
|
|
|
|
|
||
|
|
|
Stroke |
2° |
|
Vit D + Ca |
362 |
18,176 |
HR |
0.95 |
0.82, 1.10 |
0.51 |
|
|
|
|
|
Placebo |
377 |
18,106 |
|
|
|
|
|
||
|
|
|
TIA |
2° |
|
Vit D + Ca |
213 |
18,176 |
HR |
1.16 |
0.95, 1.42 |
0.13 |
|
|
|
|
|
Placebo |
182 |
18,106 |
|
|
|
|
|
||
|
|
|
Cerebrovascular death |
2° |
|
Vit D + Ca |
213 |
18,176 |
HR |
0.89* |
0.62, 1.29 |
NS |
|
|
|
|
|
Placebo |
182 |
18,106 |
|
|
|
|
|
Combined vitamin D and calcium and body weight
Synopsis
No qualified systematic reviews evaluated the association between combined vitamin D and calcium, body stores, or serum concentrations, and body weight in adults. One RCT each tested the effect of combined vitamin D and calcium in the setting of either an isocaloric diet or an energy restricted diet. Both used vitamin D2 400 IU/d and calcium carbonate (one 1000 mg/d, one 1200 mg/d) and were restricted to women. In the WHI trial of postmenopausal women on an isocaloric diet after 7 years, there was a statistically significant 0.1 kg smaller weight gain in those assigned to the supplement. The effect was statistically similar across age groups. In a Quebec study of 63 overweight premenopausal women, the apparent effect of supplementation in the setting of an energy restricted diet was greater than the WHI trial (net change −1.0 kg), but this was not a significant difference between the supplement and placebo groups.
Detailed presentation (Tables 87 & 88)
I socaloric diet
The WHI trial was analyzed for the effect of daily combined vitamin D2 400 IU and calcium carbonate 1000 mg on weight.201 The trial included about 36,000 postmenopausal women aged 50 to 79 years. The methodological quality of the study was B. At 7 year followup, the net change in body weight (supplemented minus control) was −0.13 kg (95% CI −0.21, −0.05; less weight gained in supplement group). This was of questionable clinical significance, but was statistically significant. The investigators performed numerous subgroup analyses including those based on age. There were no substantive or statistically significant differences among the evaluated age subgroups.
Energy restricted diet
A trial performed in Quebec City analyzed 63 premenopausal overweight or obese women (mean age 43) comparing daily vitamin D2 400 IU and calcium carbonate 1200 mg versus placebo.202 Women in both study groups were placed on a weight-loss intervention which consisted of a 700 Kcal/day decrease in energy intake for 15 weeks; the women met biweekly with a nutritionist. The trial was rated methodological quality C due to a high dropout rate (25 percent) and poor description of the methodology. Women in both study groups on average lost weight, with those in the supplement group losing 1.0 kg more (4 vs. 3 kg). However, this effect was not statistically significant (P=0.19).
Findings per vitamin D and calcium dose
No conclusion could be reached about a possible effect of vitamin D and calcium dose.
Findings per age and sex
The trials included only women. The effect of supplementation on postmenopausal women not on an energy restricted diet was of questionable clinical significance after 7 years. The effect of supplementation for 15 weeks on overweight and obese premenopausal women (in an approximate age range of 32 to 54 years) on an energy restricted diet was relatively large (−4 vs. −3 kg), but this difference between the supplemented and control groups was not statistically significant.
Findings by life stage
-
0 – 6 mo Not reviewed
-
7 mo – 2 y Not reviewed
-
3 – 8 y Not reviewed
-
9 – 18 y Not reviewed
-
19 – 50 y A single trial of women on an energy restricted diet found a nonsignificant difference in weight loss between that those assigned to vitamin D 300 IU and calcium 1200 mg supplementation for 15 weeks.
-
51 – 70 y The WHI trial found no clinically significant effect on weight of vitamin D 300 IU and calcium 1000 mg after 7 years.
-
≥71 y The subgroup of women in the WHI trial in this life stage had a similar net weight change as all the study participants as a whole, but the effect was not statistically significant.
-
Postmenopause All the women in the WHI trial were postmenopausal.
-
Pregnant & lactating women Not reviewed
Table 87. Combined vitamin D and calcium and weight: Characteristics of RCTs
|
Author Year Study Name Location (Latitude) [PMID] |
Population |
Background Calcium Intake & Vitamin D Data |
Comparisons |
Compliance |
Comments |
|
|
Caan 2007201 WHI US (various) [17502530] |
• Health status |
All, post-menopause |
Ca: 1148 (654) mg/d in treatment group; 1154 (658) in placebo group |
Vit D & Ca carbonate vs. Placebo |
See page X |
Factorial design with HT vs. Placebo |
|
• Mean age (range), y |
62 (50-79) |
|
||||
|
• Male (%) |
0 |
|
|
|
|
|
|
Major 2007202 Quebec City, Canada (47°N) [17209177] |
• Health status |
Overweight, healthy, pre-menopause |
Ca 704 mg/d |
Vit D + Ca carbonate vs. Placebo |
nd |
Energy restriction |
|
• Mean age (range/SD), y |
43 (5.5) |
|
|
|
|
|
|
• Male (%) |
0 |
|
|
|
|
|
Table 88. Combined vitamin D and calcium and weight: Results s of RCTs
|
Author Year Study Name [PMID] |
Age Range, Sex (Subgp) |
Outcome |
1°/2° |
Mean Followup |
Interventions, Daily Dose |
No. Analyzed |
Unit |
Baseline |
Change |
Change 95% CI |
Net Diff |
Net Diff 95% CI |
P Btw |
Study Quality |
|
Isocaloric Diet |
||||||||||||||
|
Caan 2007201 WHI [17502530] |
50-79 y, Women |
Weight |
2° |
7 y |
Vit D2 400 IU + Ca carbonate 1000 mg |
18,129 |
kg |
76.0 |
nd |
nd |
−0.13 |
−0.21, −0.05 |
.001A |
B |
|
Placebo |
18,055 |
|
75.9 |
nd |
nd |
|
|
|
|
|||||
|
(50-54 y) |
|
|
|
Vit D3 + Ca |
2592 |
kg |
nd |
nd |
|
−0.24 |
−0.45, −0.03 |
<0.05B |
|
|
|
|
|
|
Placebo |
2561 |
|
nd |
nd |
|
|
|
|
|
||
|
(55-59 y) |
|
|
|
Vit D3 + Ca |
4134 |
kg |
nd |
nd |
|
−0.08 |
−0.24, +0.09 |
NS |
|
|
|
|
|
|
Placebo |
4135 |
|
nd |
nd |
|
|
|
|
|
||
|
(60-69 y) |
|
|
|
Vit D3 + Ca |
8276 |
kg |
nd |
nd |
|
−0.15 |
−0.27, −0.03 |
<0.05 |
|
|
|
|
|
|
Placebo |
8243 |
|
nd |
nd |
|
|
|
|
|
||
|
(70-79 y) |
|
|
|
Vit D3 + Ca |
3174 |
kg |
nd |
nd |
|
−0.10 |
−0.27, +0.09 |
NS |
|
|
|
|
|
|
Placebo |
2561 |
|
nd |
nd |
|
|
|
|
|
||
|
(White) |
|
|
|
Vit D3 + Ca |
15,047 |
kg |
nd |
nd |
|
−0.13 |
−0.22, −0.04 |
<0.05C |
|
|
|
|
|
|
Placebo |
15,106 |
|
nd |
nd |
|
|
|
|
|
||
|
(Black) |
|
|
|
Vit D3 + Ca |
1682 |
kg |
nd |
nd |
|
−0.32 |
−0.59, −0.06 |
<0.05 |
|
|
|
|
|
|
Placebo |
1635 |
|
nd |
nd |
|
|
|
|
|
||
|
(Hispanic) |
|
|
|
Vit D3 + Ca |
789 |
kg |
nd |
nd |
|
−0.08 |
−0.48, +0.32 |
NS |
|
|
|
|
|
|
Placebo |
718 |
|
nd |
nd |
|
|
|
|
|
||
|
(Asian / Pacific Islander) |
|
|
|
Vit D3 + Ca |
369 |
kg |
nd |
nd |
|
+0.19 |
−0.37, +0.75 |
NS |
|
|
|
|
|
|
Placebo |
353 |
|
nd |
nd |
|
|
|
|
|
||
|
Energy Restricted Diet |
|
|
|
|
|
|
|
|
|
|
|
|
|
|
|
Major 2007202 Quebec City, Canada [17209177] |
43 (SD) |
Weight |
2° |
15 wk |
Vit D2 400 IU + Ca carbonate 1200 mg |
30 |
kg |
81.5 |
−4.0 |
+−9.0 |
−1.0 |
−2.31. +0.31 |
0.19 |
C |
|
Placebo |
33 |
|
83.6 |
−3.0 |
+−11.7 |
|
|
|
|
|||||
|
A In addition, subgroup analyses by baseline BMI and baseline dietary calcium intake are reported. B No statistically significant interaction with age. C No statistically significant interaction with ethnicity. |
||||||||||||||
Combined vitamin D and calcium and cancer
Cancer from all causes and total cancer mortality
Synopsis
No qualified systematic reviews evaluated the association between combined vitamin D and calcium, body stores, or serum concentrations, and total cancer incidence or mortality. Two RCTs reported different effects of combined vitamin D3 and calcium supplementation on the risk of total cancer. The WHI showed no effects,71 while the trial conducted in Nebraska (latitude 41°N) reported significant reduction of risk of total cancer.52 However, both vitamin D doses and baseline vitamin D status were substantially different between these two RCTs. Therefore, the effects from these two RCTs were not comparable.
Detailed presentation (Tables 89 & 90)
The 7-year WHI trial that enrolled 36,282 postmenopausal women across the US compared a daily supplement of vitamin D3 (400 IU) and elemental calcium (1000 mg) with placebo and evaluated incidence of total cancer and total cancer mortality as part of multiple secondary analyses.71 The median serum 25(OH)D level of the study population was 42 nmol/L. The trial did not find significant effect of combined vitamin D3 and calcium supplementation on either the risk of total cancer (adjusted HR: 0.98, 95% CI 0.91, 1.05) or total cancer mortality (adjusted HR: 0.89, 95% CI 0.77, 1.03). The methodological quality of this study was rated B.
A 4-year population based RCT,52 sampled from a 9-county, largely rural area in eastern Nebraska (latitude 41°N), aimed to determine the efficacy of vitamin D3 (1000 IU/d) plus calcium (either calcium citrate 1400 mg/d or calcium carbonate 1500 mg/d), or calcium alone (either calcium citrate 1400 mg/d or calcium carbonate 1500 mg/d), compared to placebo in reducing the incidence of fracture. Incidence of cancer was a secondary outcome in this trial. A total of 734 postmenopausal women, aged more than 55 years old, were analyzed for the effect of vitamin D3 (1000 IU/d) plus calcium (either calcium citrate 1400 mg/d or calcium carbonate 1500 mg/d). The mean 25(OH)D concentration at baseline was 72 nmol/L. Compared to the placebo group, the relative risk of developing cancer at the end of study was 0.40 (95% CI 0.20, 0.82; P=0.013) for the vitamin D3 plus calcium group. On the hypothesis that cancers diagnosed early in the study would have been present, although unrecognized at entry, the analyses were restricted to women who were free of cancer at 1 year intervention. The relative risk of developing cancer at the end of study for the vitamin D3 plus calcium group changed to 0.23 (95% CI 0.09, 0.60; P= 0.005). The methodological quality of this study was rated B.
Findings by life stage
-
0 – 6 mo No data
-
7 mo – 2 y No data
-
3 – 8 y No data
-
9 – 18 y No data
-
19 – 50 y No data
-
51 – 70 y No data
-
≥71 y No data
-
Postmenopause The WHI trial using vitamin D3 400 IU/d plus calcium carbonate 1000 mg/d showed no effects, while the trial in Nebraska using vitamin D3 1000 IU/d plus calcium citrate or carbonate 1500 mg/d showed significant reduction of risk of total cancer.
-
Pregnant & lactating women No Data
Table 89. Combined vitamin D and calcium and total cancer incidence: Characteristics of RCTs
|
Author Year Study Name Location (Latitude) [PMID] |
Population |
Background Calcium Intake & Vitamin D Data |
Comparisons |
Compliance |
Comments |
|
|
Wactawski-Wende 200671 WHI US (various) [16481636] |
• Health status |
Post-menopausal women |
Ca intake (mg/d): <800, 34%; 800-200, 26%; ≥1200, 40% |
Vit D3 400 IU/d + Ca 1000 mg/d vs. Placebo |
See page 242 |
|
|
• Mean age (range/SD), y |
nd (50-79) |
|
|
|||
|
Median 25(OH)D: 42 nmol/L |
||||||
|
Lappe 200752 Nebraska, US (41º N) [17556697] |
• Health status |
Mentally and physically fit; post-menopause |
25(OH)D: 71.8 nmol/L |
Vit D3 1000 IU/d + Ca (citrate 1400 mg/d or carbonate 1500 mg/d) vs. Ca (citrate 1400 mg/d or carbonate 1500 mg/d) vs. placebo |
nd |
|
|
• Mean age (range/SD), y |
67 (7.3) |
|
|
|
||
Table 90. Combined vitamin D and calcium and total cancer incidence: Results of RCTs
|
Author Year Study Name [PMID] |
Life Stage |
Outcome |
1°/2° |
Followup, year |
Interventions, Daily Dose |
n Event |
N Total |
Outcome Metric (Comparison) |
Result |
95% CI |
P Btw |
Study Quality |
|
Wactawski-Wende 200671 WHI [16481636] |
Post-menopausal women |
Incident cancer (all causes) |
2° |
7 |
Vit D3 400 IU + Ca carbonate 1000 mg |
1634 |
18176 |
Adjusted HR (Vit D+Ca)/placebo |
0.98 |
0.91, 1.05 |
0.53 |
B |
|
Placebo |
1655 |
18106 |
|
|
|
|
||||||
|
Post-menopausal women |
Total cancer mortality |
2° |
7 |
Vit D3 400 IU + Ca carbonate 1000 mg |
344 |
18176 |
Adjusted HR (Vit D+Ca)/placebo |
0.89 |
0.77, 1.03 |
0.12 |
|
|
|
Placebo |
382 |
18106 |
|
|
|
|
|
|||||
|
Lappe 200752 [17556697] |
Post-menopausal women |
Incident cancer (all causes) |
2° |
4 |
Vit D3 1000 IU + Ca (citrate 1400 mg or carbonate 1500 mg) |
13 |
446 |
RR (Vit D+Ca)/placebo |
0.40 |
0.20, −0.82 |
0.01 |
B |
|
Placebo |
20 |
288 |
|
|
|
|
||||||
|
Post-menopausal women |
Incident cancer (restrict to subjects who were free of cancer at 1 y intervention) |
2° |
4 |
Vit D3 1000 IU + Ca (citrate 1400 mg or carbonate 1500 mg) |
8 |
403 |
RR (Vit D+Ca)/placebo |
0.23 |
0.09, −0.60 |
<0.005 |
|
|
|
Placebo |
20 |
288 |
|
|
|
|
|
Colorectal cancer
Synopsis
No qualified systematic reviews evaluated the association between combined vitamin D and calcium, body stores, or serum concentrations, and colorectal cancer mortality or incidence. One B quality RCT of postmenopausal women reported no significant association between supplemental vitamin D3 and calcium and, colorectal cancer mortality or incidence.
Detailed presentation (Table 91 & 92)
The WHI compared daily supplemental vitamin D3 (400 IU) and elemental calcium (1000 mg) with placebo in 36,282 postmenopausal women. Colorectal cancer was evaluated as a secondary endpoint.71 The primary endpoint was the prevention of hip fracture. At 7 years vitamin D3 and calcium supplementation had no significant effect on colorectal cancer mortality (P=0.39) or incidence (P=0.51). In a subgroup analysis, risks of colon cancer and rectal cancer were also not significantly different between the supplemented and unsupplemented groups (P=0.99 and P=0.11, respectively). This trial was rated B because it did not restrict the participants from taking calcium or vitamin D supplements; they had mean daily total calcium intake of 1151 mg and vitamin D intake of 367 IU at enrollment.
Findings per special populations
The WHI performed 18 subgroup analyses based on baseline participant characteristics including ethnic groups, body mass index, smoking status, and geographic regions according to solar irradiance.71 No significant interactions were found with these baseline characteristics. The same RCT with multifactorial design reported an interaction between estrogen alone or combined estrogen and progestin therapy, and combined vitamin D and calcium supplementation for colorectal cancer risk in a post hoc analysis.203 Among women concurrently assigned to hormone replacement therapies, colorectal cancer incidence was increased in the combined supplemental vitamin D and calcium arm compared to placebo (HR 1.50, 95% CI 0.96, 2.33), whereas among those concurrently assigned to placebo in the estrogen trials, colorectal cancer risk was reduced in the vitamin D plus calcium arm compared to placebo (HR 0.71, 95% CI 0.46, 1.09) (P for interaction = 0.02).
Findings by life stage
-
0 – 6 mo Not reviewed
-
7 mo – 2 y Not reviewed
-
3 – 8 y Not reviewed
-
9 – 18 y Not reviewed
-
19 – 50 y No data
-
51 – 70 y One trial that included women mostly within this life stage (WHI) found no significant association between combined vitamin D3 (400 IU) and calcium carbonate (1000 mg) and colorectal cancer mortality or incidence.
-
71+ The WHI included some people within this life stage, but no study adequately evaluated this life stage.
Table 91. Combined vitamin D with calcium and colorectal cancer: Characteristics of RCTs
|
Author Year Study Name Location (Latitude) [PMID] |
Population |
Background Calcium Intake & Vitamin D Data |
Comparisons |
Compliance |
Comments |
|
|
Wactawski-Wende 200671 WHI US (various) [16481636] |
• Health status |
Post-menopausal women |
Total Ca intake (mg/d) (Mean for both groups: 1151) |
Ca 1000 mg/d + Vit D3 400 IU/d vs. Placebo |
See page 242 |
The outcomes were based on self-reported questionnaires. Only colorectal cancers were verified centrally. Colorectal cancer screening was not mandated in the protocol. |
|
• Mean age (range), y |
nd (50-79) |
|
||||
|
|
Ca + Vit D arm: 1148
|
|
|
|||
|
• Male (%) |
0 |
|
|
|||
|
|
|
Placebo arm: 1154
|
|
|
Lost to followup:
|
|
|
|
|
|
|
|
Withdrawn:
|
|
|
|
|
Total Vit D intake (IU/d) (Mean for both groups: 367) |
|
|
||
|
|
|
Ca + Vit D arm: nd
|
|
|
|
|
|
|
|
Placebo arm: nd
|
|
|
|
|
Table 92. Combined vitamin D with calcium and colorectal al cancer: Results of RCTs
|
Author Year Study Name [PMID] |
Life Stage |
Outcome |
1°/2° |
Mean Followup, y |
Interventions, Daily Dose |
n Event |
N Total |
Outcome Metric (Comparison) |
Result |
95% CI |
P Btw |
Study Quality |
|
Wactawski-Wende 200671 WHI [16481636] |
Post-menopausal women |
Colorectal cancer mortality |
2° |
7 |
Vit D3 400 IU + Ca carbonate 1000 mg |
34 |
18,176 |
HR (Supple/Placebo) |
0.82 |
0.52, 1.29 |
0.39 |
B |
|
|
Placebo |
41 |
18,106 |
|
|
|
|
|||||
|
|
Colorectal cancer |
2° |
|
Vit D + Ca |
168 |
18,176 |
HR |
1.08 |
0.86, 1.34 |
0.51 |
|
|
|
|
|
Placebo |
154 |
18,106 |
|
|
|
|
|
|||
|
|
Colon cancer |
2° |
|
Vit D + Ca |
128 |
18,176 |
HR |
1.00 |
0.78, 1.28 |
0.99 |
|
|
|
|
|
Placebo |
126 |
18,106 |
|
|
|
|
|
|||
|
|
Rectal cancer |
2° |
|
Vit D + Ca |
44 |
18,176 |
HR |
1.46 |
0.92, 2.32 |
0.11 |
|
|
|
|
|
Placebo |
30 |
18,106 |
|
|
|
|
|
Colorectal adenoma
Synopsis
No qualified systematic reviews evaluated the association between combined vitamin D and calcium, body stores, or serum concentrations, and incidence of intestinal adenoma. One B quality RCT of postmenopausal women found no significant effect of combined vitamin D3 and calcium supplements on the incidence of colorectal adenoma. Another B quality post hoc subgroup analysis of a secondary prevention trial of adenomatous adenoma reported that calcium supplemented patients with higher baseline 25(OH)D concentrations had significantly lower risk of relapse compared to placebo (interaction P = 0.01 between subgroups). In contrast, no significant difference in relapse rates was found in calcium supplemented patients with lower baseline 25(OH)D concentrations compared to placebo.
Detailed presentation (Table 91 & 92)
The WHI compared a daily supplement of vitamin D3 (400 IU) and elemental calcium (1000 mg) with placebo and evaluated incidence of self-reported colorectal adenoma as part of multiple secondary analyses.71 At 7 years, the incidence of adenoma was not significantly different between the supplement and placebo groups (p=0.71). All the adenoma cases were based on self-reported data, not verified by medical record review or histopathology report.
A post hoc subgroup analysis of the CPP trial of secondary adenoma prevention on the basis of calcium supplementation (1200 mg of elemental calcium) evaluated the risk of colorectal adenoma stratified by baseline 25(OH)D concentrations.204 The primary endpoint of the original trial was the risk of recurrent adenoma. After 4 years, in the subgroup with 25(OH)D concentrations greater than 72.6 nmol/L at baseline, subjects who received supplemental calcium had a significantly lower incidence of recurrent adenoma compared to placebo (HR=0.71 [95% CI 0.57,0.89] versus HR=1.05 [95% CI 0.85, 1.29]; interaction P=0.01). In the subgroup with 25(OH)D concentrations lower than 72.6 nmol/L, the risk of recurrence was not significantly different between supplemental calcium and placebo. No subgroup data were available regarding sex, separate life stages, or other special populations (e.g., obese, smokers, ethnic groups, or users of contraceptives).
Findings by life stage
-
0 – 6 mo Not reviewed
-
7 mo – 2 y Not reviewed
-
3 – 8 y Not reviewed
-
9 – 18 y Not reviewed
-
19 – 50 y The CPP included some people within this life stage, but no study adequately evaluated this life stage.
-
51 – 70 y The analysis of the CPP with a mean age of 61 years included participants mostly within this life stage. The study found a significant association between supplemental calcium and reduced risk of colorectal adenoma in a subgroup with 25(OH)D concentrations higher than 72.6 nmol/L.
-
71+ The CPP included some people within this life stage, but no study adequately evaluated this life stage.
-
Postmenopause The WHI found no association between combined vitamin D3 and calcium supplements and the incidence of colorectal adenoma.
Breast cancer
Synopsis
No qualified systematic reviews evaluated the association between vitamin D and calcium intake, body stores, or serum concentrations, and breast cancer. Breast cancer incidence and breast cancer related mortality after 7 years were evaluated in the Women’s Health Initiative (WHI) trial of combined daily vitamin D3 400 IU and calcium carbonate 1000 mg versus placebo in 50 to 79 year old women without a prior history of breast cancer.205 No statistically significant effect was found with combined vitamin D and calcium supplementation on incident breast cancer outcome. No significant associations were found for breast cancer related mortality.
Detailed presentation (Tables 93 & 94)
In the WHI trial, the evaluated breast cancer incidence and breast cancer related mortality outcomes were secondary outcomes.205 There were no significant effects of combined vitamin D and calcium supplementation on both outcomes. The authors concluded that invasive breast cancer incidence was similar in the two groups of healthy postmenopausal women: calcium and vitamin D supplementation and placebo groups. The relationship of 25(OH)D serum concentrations and the risk of breast cancer was examined in a nested case-control design. The study found no relationship between total vitamin D intake and 25(OH)D serum concentrations with the risk of breast cancer.
Findings per intake level
No conclusions are possible regarding a dose effect from this single study, especially since the women in the intervention and placebo groups were allowed to take additional concurrent calcium and vitamin D supplements.
Findings by age and sex
The study investigated postmenopausal women 50 to 79 years old.
Findings by life stage
-
0 – 6 mo Not reviewed
-
7 mo – 2 y Not reviewed
-
3 – 8 y Not reviewed
-
9 – 18 y Not reviewed
-
19 – 50 y No data available
-
51 – 70 y The WHI trial that included women mostly within this life stage found no significant effect of combined vitamin D3 (400 IU) and calcium carbonate (1000 mg) on incident breast cancer and mortality from breast cancer after 7 years.
-
≥71 y Inadequate available data.
-
Postmenopause All women in the WHI trial were postmenopausal.
-
Pregnant & lactating women Not reviewed
Table 93. Combined vitamin D and calcium and breast cancer outcomes: Characteristics of RCTs
|
Author Year Study Name Location (Latitude) [PMID] |
Population |
Background Calcium Intake & Vitamin D Data |
Comparisons |
Compliance |
Comments |
|
|
Chebowski 2008205 WHI US (various) [19001601] |
• Health status |
No breast cancer |
Baseline Ca supplementation: Vit D & Ca arm <800: 34.3% 800-<1200: 26.5% ≥1200: 39.3% Placebo arm <800: 33.8% 800-<1200: 26.2% ≥1200: 40.0% |
Combined Vit D & Ca supplement vs. Placebo |
See page 242 |
Intervention and placebo groups were allowed to take additional concurrent calcium and vitamin D supplements. |
|
• Mean age (range), Y |
50-79 |
|
|
|||
|
|
• Male (%) |
0 |
|
|
|
|
|
|
|
|
Baseline Vit D supplementation: Vit D & Ca arm Yes: 47.1% No: 52.9% Placebo arm Yes 47. 6% No 52.4% |
|
|
|
Table 94. Combined vitamin D and calcium and breast cancer outcomes: Results of RCTs
|
Author Year Study Name [PMID] |
Life Stage |
Outcome |
1°/2° |
Mean Followup, y |
Interventions, Daily Dose |
n Event |
N Total |
Outcome Metric (Comparison) |
Result |
95% CI |
P Btw |
Study Quality |
|
Chebowski 2008205 WHI [19001601] |
50-79 y, Women |
Breast cancer incidence |
2° |
7 |
Vit D3 400 IU + Ca carbonate 1000 mg |
668 |
18176 |
HR (Suppl/Placebo) |
0.96 |
0.86, 1.07 |
NS |
B |
|
|
|
|
|
Placebo |
693 |
18106 |
|
|
|
|
|
|
|
|
Death from breast cancer |
2° |
7 |
Vit D3 400 IU + Ca carbonate 1000 mg |
23 |
18176 |
HR |
0.99 |
0.55, 1.76 |
NS |
|
|
|
|
|
|
|
|
Placebo |
23 |
18106 |
|
|
|
|
|
|
|
|
Invasive breast cancer – subgroup >67.6 baseline 25(OH)D |
2° |
7 |
Vit D3 400 IU + Ca carbonate 1000 mg |
86 |
195 |
Adj OR |
0.89 |
0.58, 1.36 |
NS |
|
|
|
|
|
|
Placebo |
76 |
185 |
|
|
|
|
|
|
|
|
|
Invasive breast cancer – subgroup 55.4-<67.6 baseline 25(OH)D |
2° |
7 |
Vit D3 + Ca |
95 |
171 |
Adj OR |
1.25 |
0.83, 1.90 |
NS |
|
|
|
|
|
|
Placebo |
86 |
171 |
|
|
|
|
|
|
|
|
|
Invasive breast cancer – subgroup 43.9- <55.4 baseline 25(OH)D |
2° |
7 |
Vit D3 + Ca |
102 |
176 |
Adj OR |
1.07 |
0.70, 1.62 |
NS |
|
|
|
|
|
|
Placebo |
92 |
195 |
|
|
|
|
|
|
|
|
|
Invasive breast cancer – subgroup 32.4-<43.9 baseline 25(OH)D |
2° |
7 |
Vit D3 + Ca |
71 |
185 |
Adj OR |
0.69 |
0.45, 1.06 |
NS |
|
|
|
|
|
|
Placebo |
102 |
171 |
|
|
|
|
|
|
|
|
|
Invasive breast cancer – subgroup <32.4 baseline 25(OH)D |
2° |
7 |
Vit D3 + Ca |
94 |
171 |
Adj OR |
0.91 |
0.60, 1.39 |
NS |
|
|
|
|
|
|
Placebo |
91 |
176 |
|
|
|
|
|
Combined vitamin D and calcium and pregnancy-related outcomes
Preeclampsia
Synopsis
Based on data from a single RCT, there is no significant effect of combined vitamin D and calcium supplementation on the prevention of preeclampsia.
Detailed presentation (Tables 95 & 96)
One RCT from India used a combination of vitamin D (1200 IU/d) and calcium (375 mg/d) for the prevention of preeclampsia.206Table 85 describes the characteristics of the trial. The trial found no significant difference between the compared arms (Table 86). Note that this RCT was excluded from the meta-analysis of trials for preeclampsia in the calcium section.
Findings by life stage
-
0 – 6 mo No data
-
7 mo – 2 y Not applicable
-
3 – 8 y Not applicable
-
9 – 18 y Not applicable
-
19 – 50 y [see pregnant and lactating women]
-
51 – 70 y Not applicable
-
71+ Not applicable
-
Postmenopause Not applicable
-
Pregnant & lactating women Based on data from a single RCT, there is no significant effect of combined vitamin D (1200 IU/d) and calcium (375 mg/d) supplementation on the prevention of preeclampsia.
Other pregnancy-related outcomes
Synopsis
We did not identify any eligible studies on the relationship of vitamin D with or without calcium and high blood pressure, preterm birth, or small for gestational age infant.
Table 95. Combined vitamin D and calcium and preeclampsia: Characteristics of RCTs
|
Author Year Study Name Location (Latitude) [PMID] |
Population |
Background Calcium Intake & Vitamin D Data |
Comparisons |
Compliance |
Comments |
|
|
Marya 1987206 India (29°N) [3623260] |
• Health status |
Any |
Ca: 500 mg/d in in diet; Vit D: ~40 IU/d (unclear how it was quantified) |
Combined Vit D (1200 IU/d) & Ca (375 mg/d) supplement vs. no supplement |
nd |
|
|
• Age range, y |
20-35 |
|
|
|||
Table 96. Combined vitamin D and calcium and preeclampsia: Results of RCTs
|
Author Year Study Name Location (Latitude) [PMID] |
Life Stage |
Outcome |
1°/2° |
Mean Followup, y |
Interventions, Daily Dose |
n Event |
N Total |
Outcome Metric (Comparison) |
Result |
95% CI |
P Btw |
Study Quality |
|
Marya 1987206 India (29°N) [3623260] |
Pregnancy |
Toxemia (preeclampsia) |
1° |
ND |
Vit D (1200 IU) & calcium (375 mg) |
12 |
200 |
RR (combined Vit D & Ca vs. nothing) |
0.67 |
0.33, 1.35 |
0.26 |
C |
|
No supplement |
18 |
200 |
|
|
Combined vitamin D and calcium and clinical outcomes of bone health
Rickets, fractures, falls, or performance measures
For bone health outcomes (e.g., bone mineral density, fracture, fall or muscle strength), we relied on a recent comprehensive systematic review performed by the Ottawa EPC (Table 34).6 Because the Ottawa’s EPC report did not have separate analyses for the effect of vitamin D supplementation alone, the results for the effect of vitamin D alone or in combination with calcium supplementation are presented in this section.
The Ottawa EPC report was updated with literature published between January 2006 and April 2009, selected according to our eligibility criteria. Only RCTs qualified for inclusion.
Synopsis
The Ottawa EPC report concluded that supplementation with vitamin D (most studies used D3) plus calcium is effective in reducing fractures in institutionalized populations, but there is inconsistent evidence that supplemental vitamin D reduces falls in postmenopausal women and older men. Our update search did not identify new RCT examining the combined effect of vitamin D plus calcium supplementation on rickets, fractures, or falls in postmenopausal women and older men.
One study published after the Ottawa EPC report analyzed the performance measure outcomes in a small sample of postmenopausal women from WHI trial showed generally no differences in performance measures between vitamin D (400 IU/d) plus calcium (1000 mg/d) supplementation or placebo groups after 5 years of followup.207 One RCT of premenopausal women, aged 17 to 35 years old, showed that 800 IU/d of vitamin D in combination with 2000 mg/d of calcium supplementation can reduce the risk of stress fracture from military training compared to placebo.208
Detailed presentation (Table 34, 97, 98 & 99)
One RCT of female Navy recruits, aged 17 to 35 years, aimed to determine whether supplementation with vitamin D (800 IU/d) plus calcium (2000 mg/d) can reduce the risk of stress fractures from militarytraining near the Great Lakes (41°N).208 The median dairy intake was <1 serving/day, which provided less than 300 mg of calcium. The combined supplementation significantly reduced the risk of stress fractures by 20 percent compared to placebo. The methodological quality of this studywas rated B.
One study analyzed the performance measure outcomes in a sample of 2928 postmenopausal women from the WHI trial who had objective physical function measures.207 The results showed that physical function, measured by grip strength, chair stands, and walking time, had generally declined in postmenopausal women who were assigned to either vitamin D (400 IU/d) plus calcium (1000 mg/d) supplementation or placebo group. However, women who had received vitamin D plus calcium supplementation showed less declines in walking time than those who had received placebo. The methodological quality of this studywas rated C because only a small proportion of women from the WHI trial were in the analyses and their baseline characteristics were unclear.
From the Ottawa EPC Report: Fractures - Postmenopausal women and older men
Fifteen RCTs examined the effect of either vitamin D2 or D3 alone or in combination with calcium on total, nonvertebral and hip fractures in postmenopausal women or older men. Few trials evaluated vertebral fractures. Most trials used vitamin D3. There were no trials identified in premenopausal women.
Meta-analysis results from 13 RCTs of vitamin D2 or D3 with or without calcium showed a nonsignificant reduction in the risk of total fractures that persisted when only trials of higher quality were combined. Most trials used vitamin D3. When combining seven RCTs of vitamin D3 (400-800 IU) plus calcium, there was a reduction in the risk of total and hip fractures. However, in a subgroup analysis (800 IU vitamin D3), this benefit was only evident in trials of institutionalized elderly subjects. One possible explanation for the discrepancy is that the mean serum 25(OH)D concentration achieved in trials of institutionalized participants was higher than in the trials on community dwellers. The combined estimate from trials with higher end-of-study serum 25(OH)D concentrations (>74 nmol/L) was consistent with a significant reduction in the risk of fractures.
In Ottawa EPC report: Falls - Postmenopausal women and older men
Meta-analysis results from 12 RCTs demonstrated a small reduction in the risk of falls with supplemental vitamin D2 or D3 (oral or injectable) with or without calcium (OR 0.89, 95% CI 0.80, 0.99). The individual treatment effects ranged from OR 0.28 (95% CI 0.12, 0.67) to 1.16 (95% CI 0.70, 1.92). In the two cluster RCTs, one demonstrated a significant reduction in the risk of falls in postmenopausal women taking vitamin D3 plus calcium (RR 0.88, 95% CI 0.79, 0.98), whereas the other trial did not show a significant reduction in the risk of falls in elderly individuals taking vitamin D2 (RR 1.09, 95% CI 0.95, 1.25). Meta-analysis of eight RCTs of oral vitamin D2/D3 supplementation with calcium showed a reduction in the risk of falls, whereas four RCTs of oral vitamin D3 alone did not. Subgroup analyses showed a significant reduction in the risk of falls when only trials of postmenopausal women were combined. Sensitivity analyses showed a significant reduction in the risk of falls when combining (1) RCTs that explicitly defined falls and the method of fall ascertainment and (2) those in which the allocation concealment was unclear. However, combining trials by degree of compliance and loss to followup did not.
Findings by life stage
-
0 – 6 mo Not reviewed
-
7 mo – 2 y Not reviewed
-
3 – 8 y Not reviewed
-
9 – 18 y Not reviewed
-
19 – 50 y The Ottawa EPC report concluded that supplementation with vitamin D (most studies used D3) plus calcium is effective in reducing the risk of fractures in institutionalized populations, but there is inconsistent evidence that supplemental vitamin D reduces the risk of falls in postmenopausal women and older men. One RCT of female Navy recruit, aged 17 to 35 years old, showed that vitamin D (800 IU/d) in combination of calcium (2000 mg/d) supplementation can reduce the risk of stress fractures from military training compared to placebo.
-
51 – 70 y No new data since the Ottawa report
-
71+ No new data since the Ottawa report
-
Postmenopause One study analyzed the performance measure outcomes in a small sample of postmenopausal women from the WHI trial showed generally no differences in performance measures between vitamin D (400 IU/d) plus calcium (1000 mg/d) supplementation and placebo groups after 5 years of followup.
-
Pregnant & lactating women No data
Table 97. Combined vitamin D and calcium and bone health: Characteristics of RCTs published after the Ottawa EPC report
|
Author Year Study Name Location (Latitude) [PMID] |
Population |
Background Calcium Intake & Vitamin D Data |
Comparisons |
Compliance |
Comments |
|
|
Lappe 2008208 [] Great Lakes, IL, US (41°N) [18433305] |
• Health status |
Assumed healthy (Navy recruits) |
Mean dairy servings/wk = 6 (ranged 1-26) |
Vit D 800 IU/d + Ca 2000 mg/d vs. Placebo |
Monitor pill taking: project staff observed the galley food lines, visited recruits in their quarters, and conducted an exit interview. |
|
|
• Mean age (range), y |
19 (17-35) |
|
|
|
||
|
|
• Male (%) |
0 |
|
|
|
|
|
Brunner 2008207 [WHI] US (various) [18755319] |
• Health status |
nd (for the sub sample from WHI trial) |
nd |
Vit D 400 IU/d + Ca 1000 mg/d vs. Placebo |
nd (however, adherence was assessed at least annually from the weight of remaining pills along with a structured interview in WHI trial) |
A sub sample from WHI trial. Post hoc analyses of a RCT. |
|
• Mean age (range), y |
50-79 |
|
|
|||
|
|
• Male (%) |
0 |
|
|
|
|
Table 98. Combined vitamin D and calcium and bone health: Results of RCTs published after the Ottawa EPC report (stress fracture)
|
Author Year Study Name [PMID] |
Life Stage |
Outcome |
1°/2° |
Mean Followup, mo |
Interventions, Daily Dose |
n Event |
N Total |
Outcome Metric (Comparison) |
Result |
95% CI |
P Btw |
Study Quality |
|
Lappe 2008208 [18433305] |
17-35 y women |
Stress fracture from Navy training (ITT) |
1° |
2 |
Vit D 800 IU + Ca 200 mg |
139 |
2626 |
RR (Vit D+Ca)/placebo |
0.8 |
0.64, 0.99 |
0.026 |
B |
|
Placebo |
170 |
2575 |
|
|
|
|
||||||
|
|
Stress fracture from Navy training (per protocol) |
1° |
2 |
Vit D 800 IU + Ca 200 mg |
126 |
1852 |
Adjusted OR (Vit D+Ca)/placebo |
0.79 |
0.62, 1.01 |
0.059 |
|
|
|
Placebo |
160 |
1848 |
|
|
|
|
|
Table 99. Combined vitamin D and calcium and bone health: Results of RCTs published after the Ottawa EPC report (performance measures)
|
Author Year Study Name PMID |
Life Stage |
Outcome |
1°/2° |
Mean Followup, mo |
Interventions, Daily Dose |
No. Analyzed |
Unit |
Baseline |
Change |
Change SD |
Net Diff |
Net Diff 95% CI |
P Btw |
Study Quality |
|
Brunner 2008207 [18755319] |
Post-menopause |
Grip strength |
2° |
60 |
Vit D 400 IU + Ca carbonate 1000 mg |
1185 |
kg |
22.81 |
−2.49 |
5.81 |
0.15 |
0.24 |
0.52 |
C |
|
Placebo |
1162 |
|
22.96 |
−2.64 |
5.69 |
|
|
|
||||||
|
|
Chair stands |
2° |
60 |
Vit D 400 IU + Ca carbonate 1000 mg |
1065 |
counts |
6.52 |
−0.38 |
1.81 |
0.04 |
0.08 |
0.603 |
|
|
|
|
Placebo |
1053 |
|
6.63 |
−0.43 |
1.81 |
|
|
|
|
||||
|
|
Walking time |
2° |
60 |
Vit D 400 IU + Ca carbonate 1000 mg |
1160 |
seconds |
|
+0.26 |
6.28 |
− 0.54 |
0.26 |
0.030 |
|
|
|
|
Placebo |
1141 |
|
|
+0.81 |
6.43 |
|
|
|
|
Combined vitamin D and calcium and all-cause mortality
Synopsis
This synopsis is based on a meta-analysis of RCTs of combined vitamin D and calcium supplementation evaluating mortality. Numerical data were extracted from previous systematic reviews. Most trials used daily regimens; in these trials, vitamin D doses ranged between 300 and 880 IU per day. Most trials combined vitamin D and calcium supplementation; when used, calcium doses ranged between 500 and 1200 mg per day.
Our meta-analysis of 11 RCTs (44,688 participants) suggests no significant relationship between combined supplementation of vitamin D and calcium all-cause mortality (RR=0.93, 95% CI 0.86, 1.01; random effects model). There is little evidence for between-study heterogeneity in these analyses. Among 8 RCTs on 44,281 postmenopausal women, the summary random effects RR was 0.93 (95% CI 0.86, 1.00), again with little evidence for between-study heterogeneity.
Although the meta-analyses suggest decreased risk for all-cause mortality with combined vitamin D and calcium supplementation, the relationship is not statistically significant in the performed analyses.
Detailed presentation (Table 37; Figure 22)
As mentioned in the Methods section, we updated and reanalyzed published meta-analyses of mortality outcomes. We drew our own conclusions based on our analyses. We also comment on the concordance of our conclusions with those of the published meta-analyses.
Relevant published systematic reviews of RCTs (with meta-analyses)
As described in the vitamin D and all-cause mortality section, we identified two potentially eligible systematic reviews,83,84 and selected one as the basis for our reanalysis (Autier 2007).83Table 37 in the “Vitamin D” section summarizes the findings of the Autier 2007 systematic review.
As detailed below, we identified one additional trial of combined vitamin D and calcium supplementation reporting all-cause mortality.209
Eligible studies published after the systematic reviews
The literature searches in Autier 2007 extended up to November 2006. We identified two additional RCT reports published after November 2006.71,209 One publication71 reported on the same trial as another publication210 in the Autier 2007 meta-analysis, and was therefore excluded from our reanalysis. The other RCT (Bjorkman 2008209) was included in our meta-analysis.
One three-arm RCT (Bjorkman 2008209, n=218) compared no supplementation versus daily supplementation with 400 IU and 1200 IU of vitamin D3 and 500 mg of calcium. Mortality was assessed at 6 months. It included people older than 65 years, with chronically impaired mobility and stable general condition. The Bjorkman 2008 RCT was assigned grade “A” for overall reporting quality.
Reanalysis
We excluded 5 of 18 trials in the Autier 2007 meta- analysis: One trial was on patients with congestive heart failure,85 one was published only in abstract form,86 and in the last trial the controls also received supplementation with vitamin D, albeit with a smaller dose,87 and two used injections of vitamin D.88,89 Altogether, 11 RCTs were included in the reanalysis of combined vitamin D and calcium supplementation and all-cause mortality (i.e., 10 out of 18 in the Autier 2007 meta-analysis, and a subsequently published one209).
Among the 12 trials, sample sizes ranged from 55 to 36,282 participants, with 7 studies including more than 500 participants. Followup periods ranged from 6 to 84 months (median 24 months). Vitamin D doses in most trials ranged between 300 and 880 IU per day. One trial used 100,000 IU orally every 4 months. Calcium supplementation doses ranged between 500 to 1200 mg per day.
Overall, a meta-analysis of the 11 RCTs (44,688 participants; Figure 22) found no statistically significant relationship between vitamin D and all-cause mortality (RR=0.93, 95% CI 0.86, 1.01). There is little evidence for between-study heterogeneity in these analyses (P=0.58, I2=0%). Among 8 RCTs on 44,281 postmenopausal women, the summary random effects RR was 0.93 (95% CI 0.86, 1.00), again with little evidence for between-study heterogeneity (P=0.46, I2=0%). There are no RCTs with mean participant age below 50 years. It is unclear whether these findings are directly applicable to other life stages. In addition, in a subgroup analysis among 8 RCTs (n=8109) where the mean participant age was above 70 years, the summary random effects RR=0.98 (95% CI 0.84, 1.15), with little evidence for between study heterogeneity (P=0.33, I2=13%).
Findings by life stage
-
0 – 6 mo No data
-
7 mo – 2 y No data
-
3 – 8 y No data
-
9 – 18 y No data
-
19 – 50 y No data
-
51 – 70 y Our meta-analysis of 12 RCTs (44,838 participants) suggests no significant relationship between combined supplementation of vitamin D and calcium all-cause mortality (RR=0.94, 95% CI 0.87, 1.01; random effects model). There is little evidence for between-study heterogeneity in these analyses.
-
71+ The above are likely applicable here. In addition, in a subgroup analysis among 8 RCTs (n=8109) where the mean participant age was above 70 years, the summary random effects RR=0.98 (95% CI 0.84, 1.15), with little evidence for between study heterogeneity.
-
Postmenopause Among 8 RCTs on 44,281 postmenopausal women, the summary random effects RR was 0.93 (95% CI 0.86, 1.00), again with little evidence for between-study heterogeneity.
-
Pregnant & lactating women No data
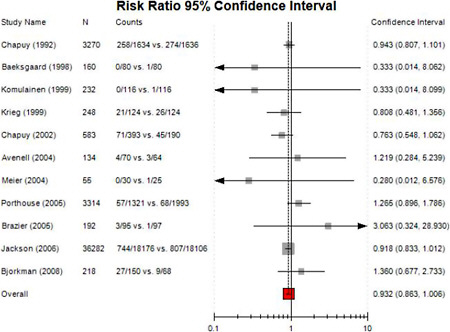
Combined vitamin D and calcium and hypertension and blood pressure
We reviewed systematic reviews and primary studies that evaluated associations between combined vitamin D and calcium intake and incidence of hypertension or change in blood pressure. For the outcome incidence of hypertension, we included RCTs and other longitudinal studies. For the outcome change in blood pressure, we included only RCTs. We included only studies of adults. Studies of pregnancy-related hypertension and blood pressure control are included in the “Pregnancy-related outcomes” section.
Combined vitamin D and calcium and hypertension
Synopsis
No qualified systematic reviews evaluated the association between combined vitamin D and calcium intake, bodystores, or serum concentrations and incidence of hypertension. The WHI trial reported an analysis of the risk of developing hypertension among the subset of women without hypertension at baseline. Over 7 years, combined vitamin D and calcium supplementation had no effect on the risk of hypertension.
Detailed presentation (Tables 100 & 101)
The WHI trial of a combined vitamin D3 400 IU and calcium carbonate 1000 mg supplement daily versus placebo had methodological quality B for the blood pressure outcome. The 36,282 women were postmenopausal (age 50-79 y) with a background calcium intake on average of about 1150 mg/day (from diet and supplements).211 The women were allowed to take additional concurrent calcium and vitamin D supplements. The analysis of incident hypertension was reported briefly in a larger analysis of the blood pressure outcome (see Combined vitamin D and calcium and blood pressure, below). Among 17,122 initially nonhypertensive women, 39 percent either were prescribed medication for hypertension or developed blood pressure above 140/90 mm Hg. The adjusted HR of developing hypertension over 7 years was 1.01 (95% CI 0.96, 1.06). Among 377 women with available data, there was a statistically significant trend across subgroups based on serum 25(OH)D concentration such that combined vitamin D and calcium supplementation increased the risk of developing hypertension more in those women with progressively lower baseline 25(OH)D (P<0.01 for trend). Other subgroup analyses based on age, race or ethnicity, weight, or baseline total calcium intake did not find any interactions with the effect of the supplement intervention.
Findings per intake level
This single trial did not analyze different actual intake levels.
Findings by age and sex
This trial found no difference in (lack of) effect by age among postmenopausal women.
Findings by life stage
-
0 – 6 mo Not reviewed
-
7 mo – 2 y Not reviewed
-
3 – 8 y Not reviewed
-
9 – 18 y Not reviewed
-
19 – 50 y No data.
-
51 – 70 y One large trial that included women mostly within this life stage found no significant effect of combined vitamin D and calcium supplementation.
-
≥71 y The WHI trial included some women within the life stage, but no study adequately evaluated this life stage.
-
Postmenopause All women in the WHI trial were postmenopausal. See 51-71 y life stage.
-
Pregnant & lactating women Not reviewed
Table 100. Combined vitamin D and calcium and incident hypertension: Characteristics of RCTs
|
Author Year Study Name Location (Latitude) [PMID] |
Population |
Background Calcium Intake & Vitamin D Data |
Comparisons |
Compliance |
Comments |
|
|
Margolis 2008211 WHI US (various) [18824662] |
• Health status |
No HTN 62 (50-79) |
Ca: 1148 (654) mg/d in treatment group; 1154 (658) in 79) placebo group 52% used Ca supplements 40% had intake ≥1200 mg/d (based on all subjects, including those with hypertension) |
Combined Vit D + Ca supplement vs. Placebo |
See page 242 |
Mean dose of open label supplemental Ca increased by <100 mg/d from 325 mg/d at enrollment; similar in both groups (based on all subjects, including those with hypertension) |
|
• Mean age (range), y |
|
|||||
|
• Male (%) |
0 |
|
|
|||
Table 101. Combined vitamin D and calcium and incident hypertension: Results of RCTs
|
Author Year Study Name [PMID] |
Life Stage [Subgp] |
Outcome |
1°/2° |
Mean Followup, y |
Interventions, Daily Dose |
n Event |
N Total |
Outcome Metric (Comparison) |
Result |
95% CI |
P Btw |
Study Quality |
|
Margolis 2008211 WHI [18824662] |
50-79 y, Women |
HTN |
2° |
7 |
Vit D3 400 IU + Ca carbonate 1000 mg |
3377 |
~8578 |
HR (Suppl/Placebo) |
1.01 |
0.96, 1.06 |
0.69 |
B |
|
Placebo |
3315 |
~8544 |
|
|
|
|
||||||
|
[25(OH)D <34.4 nmol/L] |
|
|
|
Vit D + Ca |
53 |
|
|
1.52 |
0.89, 2.59 |
NS |
|
|
|
|
|
|
Placebo |
38 |
|
|
|
|
|
|
||
|
[25(OH)D 34.4-47.6 nmol/L] |
|
|
|
Vit D + Ca |
39 |
|
|
1.48 |
0.89, 2.46 |
NS |
|
|
|
|
|
|
Placebo |
48 |
|
|
|
|
|
|
||
|
[25(OH)D 47.7-64.6 nmol/L] |
|
|
|
Vit D + Ca |
45 |
|
|
1.15 |
0.69, 1.92 |
NS |
|
|
|
|
|
|
Placebo |
45 |
|
|
|
|
|
|
||
|
[25(OH)D ≥64.7 nmol/L] |
|
|
|
Vit D + Ca |
48 |
|
|
0.79 |
0.51, 1.22 |
NS |
|
|
|
|
|
|
Placebo |
61 |
|
|
|
|
|
|
Combined vitamin D and calcium and blood pressure
Synopsis
No qualified systematic reviews evaluated the association between vitamin D and calcium intake, bodystores, or serum concentrations, and changes in blood pressure. Two RCTs compared combined vitamin D and calcium supplementation with placebo. Both the small trial of a combined vitamin D3 400 IU and calcium carbonate 1200 mg supplement daily and the WHI trial found no significant effect of supplementation on blood pressure after 15 weeks or 6.1 years, respectively. The WHI trial analyzed blood pressure changes in a variety of subgroups, including by age, ethnicity, baseline total calcium intake, and baseline diagnosis of hypertension, but found no significant differences in effect across any subgroup.
Detailed presentation (Tables 102 & 103)
The WHI trial of a combined vitamin D3 400 IU and calcium carbonate 1000 mg supplement daily versus placebo had methodological quality B for the blood pressure outcome. The 36,282 women were postmenopausal (age 50-79 y) with a background calcium intake on average of about 1150 mg/day (from diet and supplements).211 On average, the women had normal blood pressure and were allowed to take additional concurrent calcium and vitamin D supplements. At 74 months, the women’s mean systolic blood pressure had risen and diastolic blood pressure had fallen in both trial arms (by less than about 2 mm Hg each at 2 years199). The absolute changes were not significantly different in the women assigned to the supplement than placebo (net difference 0.2 mm Hg systolic and 0.1 mm Hg diastolic). In subgroup analyses there was no differences in results by age, ethnicity, baseline total calcium intake, baseline diagnosis of hypertension, or a variety of other factors.
The C quality trial of combined vitamin D and calcium, performed in Quebec City, recruited premenopausal women (mean age 43 y) with low calcium intake (800 mg calcium per day) who did not have severe hypertension (blood pressure over 160/95 mm Hg).202 The mean baseline calcium intake was 704 mg/day. On average, the 63 women had normal blood pressure. They were given either combined vitamin D3 400 IU and calcium carbonate 1200 mg daily or placebo. All women were on an energy restriction diet with a 700 kcal/day deficit. At 15 weeks, systolic and diastolic blood pressures were reduced in both study groups; systolic blood pressure was reduced by 2.5 mm Hg more in women on vitamin D and calcium than placebo, but this difference was not statistically significant. Diastolic blood pressure was reduced by the same amount in both groups. No subgroup analyses were reported. The study was limited by a 25 percent dropout rate due to lack of compliance with the diet and exercise portion of the trial, without performing an intention to treat analysis, an adequate description of the study methods, or a complete statistical analysis.
Findings per intake level
Both trials used similar doses, vitamin D3 400 IU and calcium carbonate 1000 or 1200 mg daily. The background calcium intake was lower in the study of premenopausal women (800 mg/day) than the WHI trial (1150 mg/day). The WHI trial found no significant difference in (lack of) effect in subgroups with different baseline total calcium intake.
Findings by age and sex
Both the one small, short term, C quality trial of premenopausal women and the 6 year WHI trial of postmenopausal women found no effect. The WHI trial also found no difference in effect in subgroups of women based on age. No trials of men were found.
Findings by life stage
-
0 – 6 mo Not reviewed
-
7 mo – 2 y Not reviewed
-
3 – 8 y Not reviewed
-
9 – 18 y Not reviewed
-
19 – 50 y One small trial that included women mostly within this life stage found no significant effect of combined vitamin D and calcium supplementation.
-
51 – 70 y One large trial that included women mostly within this life stage found no significant effect of combined vitamin D and calcium supplementation.
-
≥ 71 y The WHI trial included some women within the life stage, but no study adequately evaluated this life stage.
-
Postmenopause All women in the WHI trial were postmenopausal. See 51-71 y life stage.
-
Pregnant & lactating women Not reviewed
Table 102. Combined vitamin D and calcium and blood pressure: Characteristics of RCTs
|
Author Year Study Name Location (Latitude) [PMID] |
Population |
Background Calcium Intake & Vitamin D Data |
Comparisons |
Compliance |
Comments |
|
|
Margolis 2008211 WHI US (various) [18824662] |
• Health status |
Any |
Ca: 1148 (654) mg/d in treatment group; 1154 (658) in placebo group 52% used Ca supplements 40% had intake ≥1200 mg/d |
Combined Vit D + Ca supplement vs. Placebo |
See page 242 |
Mean dose of open label supplemental Ca increased by <100 mg/d from 325 mg/d at enrollment; similar in both groups |
|
• Mean age (range), y |
62 (50-79) |
|
||||
|
• Male (%) |
0 |
|
|
|||
|
Major 2007202 Quebec City, Canada (47°N) [17209177] |
• Health status |
Healthy, Overweight, low Ca intake |
Ca: ~704 mg/d; all <800 mg/d |
Combined Vit D + Ca supplement vs. Placebo |
nd |
|
|
• Mean age (SD), y |
43 (5.5) |
|
|
|
|
|
|
• Male (%) |
0 |
|
|
|
|
|
Table 103. Combined vitamin D and calcium and blood pressure: Results of RCTs
|
Author Year Study Name [PMID] |
Age Range, Sex |
Outcome |
1°/2° |
Mean Followup |
Interventions, Daily Dose |
No. Analyzed |
Unit |
Baseline |
Change |
Change 95% CI |
Net Diff |
Net Diff 95% CI |
P Btw |
Study Quality |
|
SYSTOLIC BLOOD PRESSURE |
||||||||||||||
|
Margolis 2008211 WHI [18824662] |
50-79, Women |
SBP |
2° |
6.1 y |
Vit D3 400 IU + Ca carbonate 1000 mg |
18,176 |
mm Hg |
127A |
+1.1%A |
0.9, 1.3 |
+0.22 |
−0.05, +0.49 |
0.11 |
B |
|
Placebo |
18,106 |
|
128A |
+0.7%A |
0.5, 0.9 |
|
|
|
||||||
|
Major 2007202 Quebec City [17209177] |
43 (5.5), Women |
SBP |
2° |
15 wk |
Vit D3 400 IU + Ca carbonate 1200 mg (energy restriction diet) |
30 |
mm Hg |
112.4 |
−4.1 |
−6.5, −1.7 |
−2.5 |
−6.2, 1.2* |
0.18 |
C |
|
Placebo (energy restriction diet) |
33 |
|
109.5 |
−1.6 |
−4.2, 1.0 |
|
|
|
||||||
|
DIASTOLIC BLOOD PRESSURE |
||||||||||||||
|
Margolis 2008211 WHI [18824662] |
50-79, Women |
DBP |
2° |
6.1 y |
Vit D3 400 IU + Ca carbonate 1000 mg |
18,176 |
mm Hg |
76A |
−0.2%A |
−0.4, −0.02 |
+0.11 |
−0.04, +0.27 |
0.14 |
B |
|
Placebo |
18,106 |
|
76A |
−0.6%A |
0.8, −0.4 |
|
|
|
||||||
|
Major 2007202 Quebec City [17209177] |
43 (5.5), Women |
DBP |
2° |
15 wk |
Vit D3 400 IU + Ca carbonate 1200 mg (energy restriction diet) |
30 |
mm Hg |
74.9 |
−3.0 |
4.8, −1.2 |
0 |
−2.7, 2.7* |
1.0 |
C |
|
Placebo (energy restriction diet) |
33 |
|
75.2 |
−3.0 |
−5.0, −1.0 |
|
|
|
||||||
|
A Hsia 2007199 [17309935] |
||||||||||||||
Combined vitamin D and calcium and bone mineral density or bone mineral content
For bone health outcomes (e.g., bone mineral density, fracture, fall or muscle strength), we relied on a recent comprehensive systematic review performed by the Ottawa EPC (Table 34).6 Because the Ottawa’s EPC report did not have separate analyses on the effect of vitamin D supplementation alone, the results for the effect of vitamin D alone or in combination with calcium supplementation were presented in this section.
The Ottawa EPC report was updated with literature published between January 2006 and April 2009, selected according to our eligibility criteria. For adults, we included only BMD indices. For children, we included only BMC indices. Only RCTs with duration more than 1 year qualified for inclusion.
Synopsis
One RCT found that, compared to placebo, there was no significant effect of supplementation with vitamin D3 (200 IU/d) plus calcium (1000 mg/d) on BMC changes in healthy girls, between 10 and 12 years.
Overall, findings from the Ottawa EPC report showed that vitamin D3 (≤ 800 IU/d) plus calcium (~500 mg/d) supplementation resulted in small increases in BMD of the spine, total body, femoral neck and total hip in predominantly populations of late menopausal women.6 Two of the three new RCTs showed consistent findings in postmenopausal women, comparing vitamin D3 or D2 (300or 1000 IU/d, respectively) plus calcium (1200 mg/d) to placebo.
Detailed presentation (Table 34, 104 & 105)
One RCT compared the effect of vitamin D3 (200 IU/d) plus calcium (1000 mg/d) supplementation to placebo on bone indices in healthy girls, aged 10 and 12 years.212 The mean background dietary calcium intake was 670 mg/d. The intention-to-treat analyses showed that after 2 years of supplementation, there was no significant difference in the BMC changes between girls who received vitamin D plus calcium supplement or placebo. The methodological quality of this study was rated C, due to underpower and low compliance rate.
Three RCTs (two were rated B and one was rated C) examined the effect of vitamin D plus calcium supplementation on BMD changes. All three trials were conducted in postmenopausal women. However, the doses of vitamin D and calcium combinations varied. One RCT used daily dose of 400 IU vitamin D3 plus 100 mg elemental calcium for 2 years213 The second RCT used daily dose of 1000 IU vitamin D2 plus 1200 mg calcium citrate for 5 years.214 The third RCT used a daily dose of vitamin D3 300 IU plus calcium citrate 1200 mg from calcium supplemented low-fat dairy products for 1 year.215 The latter two RCTs resulted in a significant increase in hip or total BMD comparing vitamin D plus calcium supplementation to placebo.214,215 The one RCT that did not show significant change in femoral neck BMD comparing vitamin D plus calcium supplementation to placebo used a substantially lower dose of calcium (100 mg/d) than the other two RCTs.
In Ottawa EPC report - Bone Mineral Density and women of reproductive age, postmenopausal women, and older men
Overall, there is good evidence that vitamin D3 plus calcium supplementation resulted in small increases in BMD of the spine, total body, femoral neck and total hip. Based on included
trials, it was less certain whether vitamin D3 supplementation alone has a significant effect on BMD.
Seventeen RCTs evaluated the effect of supplemental vitamin D2 or D3 on BMD, predominantly in populations of late menopausal women. Only one small RCT included premenopausal women, and two trials included older men (> 60 years). Most trials were two to three years in duration and used vitamin D doses of ≤ 800 IU daily. Most trials used vitamin D3 and also included calcium 500 mg as a cointervention.
Meta-analysis results of 17 RCTs of vitamin D3 plus calcium versus placebo were consistent with a small effect on lumbar spine, femoral neck, and total body BMD. The WHI trial found a significant benefit of 400 IU vitamin D3 plus 1000 mg calcium supplementation on total hip BMD. However, when the effect of vitamin D3 plus calcium versus calcium alone supplementation is assessed, no significant increase in BMD was observed with either intervention, suggesting vitamin D3 may be of less benefit in calcium replete postmenopausal women. Vitamin D3 alone versus placebo did not result in a significant increase in BMD in postmenopausal women, except in one trial that noted an increase in femoral neck BMD. Only a few trials reported the impact of baseline serum 25(OH)D concentrations on BMD and in all of these trials, baseline 25(OH)D concentration was not associated with increased BMD.
Findings by life stage
-
0 – 6 mo No data
-
7 mo – 2 y No data
-
3 – 8 y No data
-
9 – 18 y One RCT showed that, compared to placebo, there was no significant effect of vitamin D3 (200 IU/d) plus calcium (1000 mg/d) on BMC changes in healthy girls, aged between 10 and 12 years old.
-
19 – 50 y No data
-
51 – 70 y No new data since the Ottawa EPC report
-
≥ 71 y No new data since the Ottawa EPC report
-
Postmenopause Findings from the Ottawa EPC report showed that vitamin D3 (≤ 800 IU/d) plus calcium (~500 mg/d) supplementation resulted in small increases in BMD of the spine, total body, femoral neck, and total hip in predominantly populations of late menopausal women. Two of the three new RCTs showed a significant increase in hip or total BMD in postmenopausal women, comparing D3 or D2 (300 or 1000 IU/d, respectively) plus calcium (1200 mg/d) to placebo.
-
Pregnant & lactating women No new data since the Ottawa EPC report
Table 104. Combined vitamin D and calcium and bone mineral density/content: Characteristics of RCTs published after the Ottawa EPC report
|
Author Year Study Name Location (Latitude) [PMID] |
|
Population |
Background Calcium Intake & Vitamin D Data |
Comparisons |
Compliance |
Comments |
|
Cheng 2005212 Jyvaskyla, Finland (62°24'N) [16280447] |
• Health status |
Healthy |
Diet Vit D: 100 IU/d |
Vit D3 200 IU/d + Ca carbonate 1000 mg/d vs. placebo |
65% completed intervention with >50% compliance |
|
|
• Mean age (range), y |
11.2 (10-12) |
|
|
|||
|
|
Ca: 670 mg/d |
|
||||
|
• Male (%) |
0 |
|
|
|
|
|
|
Bolton-Smith 2007213 (UK 54ºN) [17243866] |
• Health status |
Healthy (assumed postmenopausal) |
25(OH)D: 59.4 nmol/L |
Vit D3 400 IU/d + Elemental Ca 100 mg/d vs. placebo |
Good supplement adherence based on pill count (median, 99; IQE 97.3-99.8%). |
Noncompliant women were excluded. |
|
• Mean age (range), y |
68 (≥60) |
|
|
|||
|
|
Ca: 1548 mg/d |
|
||||
|
• Male (%) |
0 |
|
|
|
||
|
Zhu 2008214 CIFOS Western Australia [18089701] |
• Health status |
nd (assumed postmenopausal) |
25(OH)D: 68.0 nmol/L |
Vit D2 1000 IU/d + Ca citrate 1200 mg/d vs. placebo |
No differences in adherence among groups (81-89% by tablet counting) |
|
|
• Mean age (SD), y |
74.8 (2.6) |
|
|
|||
|
|
Ca: 1010 mg/d |
|
||||
|
• Male (%) |
0 |
|
|
|
||
|
Moschonis 2006215 Greece (31ºN) [17181890] |
• Health status |
Postmenopausal |
Diet Vit D: 23.6 IU/d |
Vit D3 300 IU/d + Ca 1200 mg/d (from low fat dairy products) vs. control (usual diet) |
Dairy group 93% (assessed via information obtained at the biweekly sessions |
Control group had no intervention ( or usual diet ) so compliance issue not applicable |
|
• Mean age (range), y |
61 (55-65) |
|
||||
|
|
Ca 680 mg/d |
|||||
|
• Male (%) |
0 |
|
Table 105. Combined vitamin D and calcium and bone mineral density/content: Results of RCTs published after the Ottawa EPC report
|
Author Year Study Name PMID |
Life Stage |
Outcome |
1°/2° |
Mean Followup, mo |
Interventions, Daily Dose |
No. Analyzed |
Unit |
Baseline |
Change |
Change 95% CI |
Net Diff |
Net Diff 95% CI |
P Btw |
Study Quality |
|
Cheng 2005212 [16280447] |
10-12 y girls |
BMC |
1° |
24 |
Vit D 200 IU + Ca carbonate 1000 mg |
46 |
kg |
1.3 |
34.7% |
34.3%, 35.1% |
−0.3% |
−0.8, 0.2A |
NS |
C |
|
Placebo |
39 |
|
1.3 |
35.0% |
34.6%, 35.4% |
|
|
|
||||||
|
Bolton-Smith 2007213 [17243866] |
Postmenopausal women |
Femoral neck BMD |
nd |
24 |
Vit D3 400 IU + Elemental Ca 100 mg |
50 |
mg/cm2 |
nd |
+1.9 |
−6.5, 10.3 |
+1.2 |
−12.6, 15.0A |
NS |
B |
|
Placebo |
56 |
|
nd |
+0.7 |
−10.2, 11.6 |
|
|
|
||||||
|
Zhu 2008214 Australia CIFOS [18089701] |
Postmenopausal women |
Hip BMD |
1° |
60 |
Vit D2 1000 IU + Ca citrate 1200 mg |
39/33B |
mg/cm2 |
783 |
nd |
|
+2.2% |
1.9, 2.5 |
0.05 |
B |
|
Placebo |
41/36B |
|
828 |
nd |
|
|
|
|
||||||
|
Moschonis 2006215 [17181890] |
Postmenopausal women |
Total body BMD |
1° |
12 |
Vit D3 300 IU + Ca 1200 mg (from low fat dairy products) |
39 |
mg/cm2 |
1.13 |
1.5% |
0.9%, 2.2% |
+2.2% |
1.3, 3.1A |
<0.05 |
C |
|
Control (usual diet) |
36 |
|
1.12 |
−0.7% |
−1.4%, −0.1% |
|
|
|
||||||
|
A Estimated from reported data. B Baseline/follow-up number of subjects analyzed |
||||||||||||||
How does dietary intake of vitamin D from fortified foods and vitamin D supplementation affect serum 25(OH)D concentrations (arrow 4)?
The evidence for this question comes from studies identified in our literature search that crossed vitamin D terms with various outcomes terms. Studies that addressed this question but do not report any of the outcomes of interest would not have been identified in this manner. Because the availability of serum 25(OH)D concentration is unlikely to be adequately indexed in the Medline citation, it would be difficult to comprehensively search the literature for this question. To do so would require retrieving all vitamin D supplements full text articles (in excess of 10,000) to look for serum 25(OH)D concentration data. Given that there is no plausible reason for a systematic bias of studies of a specific outcome choosing to report serum 25(OH)D concentration, we believe that the evidence found, while not comprehensive, is a small but representative random sample. Only RCTs were included for this question. RCTs of different regimens but the same dose of vitamin D supplementation were excluded (e.g., comparison of daily, weekly versus monthly dose).
This question was also addressed in the Ottawa EPC report.6 When appropriate, we extracted relevant data from the Ottawa EPC report to be incorporated into our analyses.
RCTs on dietary intakes of vitamin D from fortified foods and serum 25(OH)D concentrations
Synopsis
Our updated search did not identify new RCT evaluating the effect of food fortification on serum 25(OH)D concentrations since the Ottawa EPC report.6 The Ottawa EPC report concluded that there is “good” evidence that dietary intake of vitamin D increases serum 25(OH)D concentrations among adults.
Detailed presentation
Ottawa EPC report -Adults
There were eleven RCTs (n=1281) of which seven (n=668) permitted a quantitative analysis. Ten of eleven trials found a significant effect of dietary intake from foods fortified with vitamin D on serum 25(OH)D concentrations. There was significant heterogeneity of the treatment effect. Potential sources of heterogeneity are the different 25(OH)D assays used (two studies each used HPLC, RIA or CPBA, and one study did not report the assay), the dietary vehicles used, and study populations. The increase in serum vitamin D concentration in the seven trials ranged from 15 (95% CI 11, 18) to 40 (95% CI 25, 55) nmol/L (fortification consisting of 100 - 1000 IU of vitamin D).
There can be a potential confounding of the data by the food source, the assay used to measure 25(OH)D and potential differences in the bioavailability and/or metabolism of vitamin D2 versus vitamin D3. Most studies in this review used dairy products as the
source of fortified food. It is important to note that there is potential for study contamination through altered intake of other nutrients such as calcium, phosphate and acid load that can affect the study outcomes.
RCTs on Vitamin D supplementation and serum 25(OH)D concentrations
Synopsis
Because the availability of serum 25(OH)D concentration is unlikely to be adequately indexed in the Medline citation, it would be difficult to comprehensively search the literature for this question. We believe that studies summarized here is a small but representative random sample of all available data.
We plot the net changes in serum 25(OH)D concentration against the doses of vitamin D supplementation using data from 26 RCTs with 28 comparisons in adults. Only RCTs of daily vitamin D3 supplementation (doses ranged from 200 to 5000 IU/d) alone or in combination with calcium supplementation (doses ranged from 500 to 1550 mg/d) that provided sufficient data for the calculations were included in the plot. It is important to note that the studies had varied compliance rates in the vitamin D intake; limited or no adjustment for skin pigmentations, calcium intake, or background sun exposure; different vitamin D assay methodologies and measurement (both intra- and interassay) variability. All these factors increase the heterogeneity and limit the usefulness of an overall summary estimate for an intake dose response in serum 25(OH)D concentration. Nonetheless, the relationship between increasing doses of vitamin D3 with increasing net change in 25(OH)D concentration was evident in both adults and children (Figure 23). It was also apparent that the dose-response relationships differ depending on study participants’ serum 25(OH)D status (≤40 vs. >40 nmol/L) at baseline (Figure 24), and depending on duration of supplementation (≤3 vs. >3 months) (Figure 25).
Vitamin D2 supplementation was more commonly used in RCTs of infants and pregnant or lactating women, than vitamin D3 supplementation. Results showed that supplementation of vitamin D2 significantly increased 25(OH)D concentrations in infants, lactating mothers and in cord blood.
Detailed presentation (Table 106; Figures 23, 24 & 25)
The results from 26 RCTs with 28 comparisons in adults and two RCTs with three comparisons in children evaluating the effect of vitamin D3 supplementation alone or in combination with calcium supplementation on serum 25(OH)D concentrations were shown in Table 106. Most of the data were extracted directly from the Ottawa EPC report. In adults, the doses of vitamin D3 ranged from 200 to 5000 IU/d, and the doses of calcium supplementation ranged from 500 to 1550 mg/d across the 25 comparisons. In children, the doses of vitamin D3 ranged from 200 to 2000 IU/d across the three comparisons. Duration of supplementation ranged from 0.5 to 60 months. Study populations and baseline vitamin D concentrations varied across these comparisons.
Ottawa EPC report - Infants
Seven RCTs included infants and few trials used vitamin D3 supplementation. One RCT concluded that 200 IU of vitamin D2 may not be enough to prevent vitamin D deficiency in those infants residing at northern latitudes. A dose-response relationship
was noted in this trial (100, 200, 400 IU/day) . Consistent responses to vitamin D supplementation were noted across the seven trials, and some trials suggested that infants who are vitamin D deficient may respond differently and require higher doses of vitamin D to achieve serum 25(OH)D concentrations within the normal range.
Ottawa EPC report - Pregnant or lactating women
There were six small RCTs of vitamin D supplementation in pregnant or lactating women. No randomized trials studied the effect of 400 IU vitamin D3/d. Three trials used 1000 IU vitamin D2/d and one trial used 1000 IU/d of vitamin D3. Supplementation of vitamin D2 1000-3600 IU/d and vitamin D3 1000 IU/d resulted in significant increases in serum 25(OH)D concentrations in lactating mothers and in cord blood. One trial found that supplementation of lactating mothers with 1000 IU vitamin D2/d during winter months did not significantly increase serum 25(OH)D concentrations in the infants.
Ottawa EPC report - Children and adolescents
There were four trials that examined the effect of vitamin D on serum 25(OH)D concentrations in children or adolescents with doses ranging from 200 to 2000 IU of vitamin D3 per day and 400 IU of vitamin D2. There were consistent increases in serum 25(OH)D concentrations ranging from 8 nmol/L (200 IU/d), 16.5 (with 600 IU D3/d) to 60 nmol/L (2000 IU of vitamin D3/d).
Ottawa EPC report - Premenopausal women and younger men
Ten small trials included premenopausal women and younger males. Three trials compared vitamin D2 to vitamin D3 in healthy young adults. Two of the three trials used RIA, and one used HPLC to measure serum 25(OH)D concentrations The doses of vitamin D3 ranged from 600 to 10,000 IU/day and vitamin D2 (4000 IU/d or 50,000 to 100,000 for single dose).
Three trials found that supplementation with vitamin D2 and D3 in healthy adults may have different effects on serum 25(OH)D concentrations. One trial compared 100,000 IU vitamin D2 given orally versus injection and found a greater variability in response with the intramuscular preparation. There appeared to be dose-response effect in those trials that used multiple doses of vitamin D3, although there were insufficient data to perform a meta-analysis.
Ottawa EPC report - Postmenopausal women and older Men
Forty-four trials were conducted exclusively in postmenopausal women and older men, with 14 of these in elderly populations living in long-term care or nursing homes. One trial enrolled only women in early menopause (n=129). Doses of vitamin D3 ranged from 100 to 4000 IU/day and vitamin D2 was 9000 IU/day. One trial was conducted in African American women.
One trial found that wintertime declines in serum 25(OH)D concentrations were prevented with 500 IU vitamin D3 per day. A dose response with increasing doses of vitamin D3 was noted for serum 25(OH)D concentrations. There was variability in response to similar doses across trials that may have been due to differences in serum 25(OH)D assays or baseline 25(OH)D concentrations. Similarly, although some trials reported a greater response to vitamin D in populations that were vitamin D deficient at baseline compared to those who were not, there were insufficient data on which to base a definitive conclusion on this point.
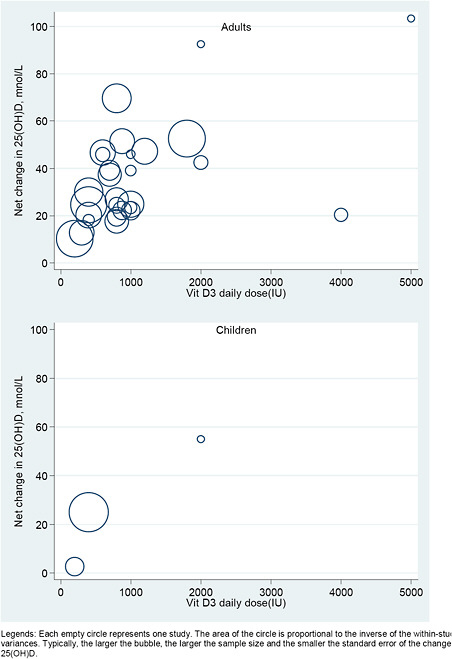
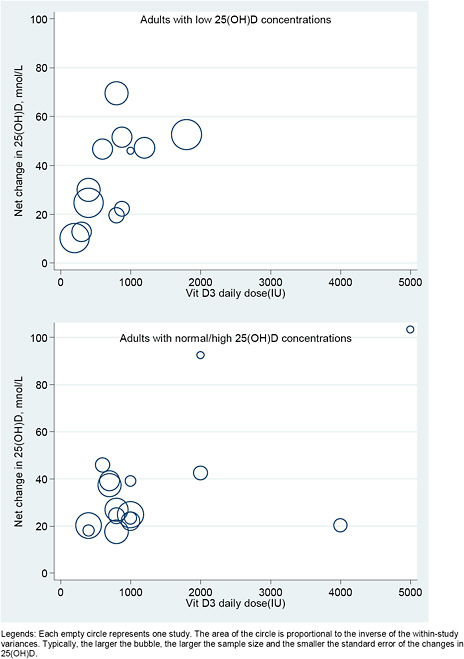
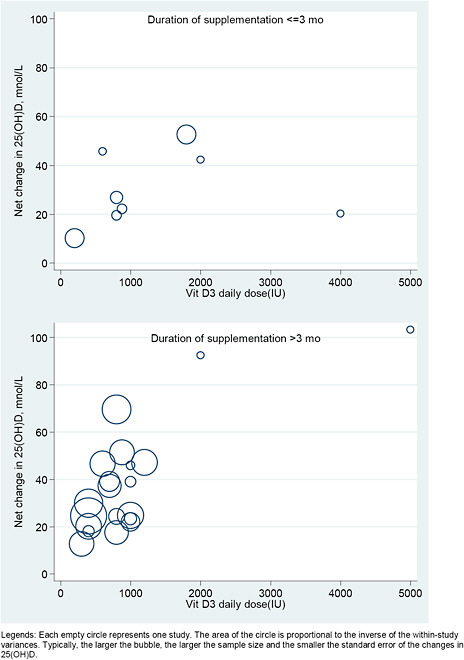
Table 106. The relationship between vitamin D3daily doses and changes in 25(OH)D concentrations in RCTs
|
Author |
Year |
Life stage |
Base 25(OH)D, nmol/L |
Vit D3dose (IU/d) |
Ca dose (mg/d) |
Duration (mo) |
Vit D3± Ca Group |
Placebo or Ca Group |
||||
|
n |
Mean change from baseline |
SD |
n |
Mean change from baseline |
SD |
|||||||
|
Bjorkman |
2008209 |
71+ |
23 |
400 |
0 |
6 |
60 |
26.5 |
11.8 |
59 |
1.9 |
10.2 |
|
Bjorkman |
2008209 |
71+ |
23 |
1200 |
0 |
6 |
63 |
49.1 |
19.5 |
59 |
1.9 |
10.2 |
|
Blum |
2008216 |
71+ |
73 |
700 |
500A |
12 |
132 |
48.5 |
35.3 |
125 |
9.3 |
21.5 |
|
Bunout |
2006 80 |
71+ |
40 |
400 |
800A |
9 |
46 |
33.4 |
14.3 |
46 |
3.5 |
10.0 |
|
Chapuy |
1992 217 |
71+ |
36 |
800 |
1200 |
18 |
73 |
65.0 |
16.5 |
69 |
−4.5 |
13.5 |
|
Chel |
2008218 |
71+ |
23 |
600 |
0 |
4 |
46 |
46.9 |
15.4 |
45 |
0.3 |
12.2 |
|
Deroisy |
2002 219 |
71+ |
28 |
200 |
500A |
3 |
50 |
14.7 |
10.0 |
50 |
4.5 |
10.0 |
|
Himmelstein |
1990 220 |
71+ |
45 |
2000 |
0 |
1.5 |
15 |
39.7 |
15.7 |
15 |
−2.7 |
13.4 |
|
Kenny |
2003 221 |
71+ |
62 |
1000 |
500A |
6 |
29 |
22.3 |
10.1 |
31 |
−2.5 |
11.4 |
|
Krieg |
1999 222 |
71+ |
29 |
880 |
500 |
24 |
34 |
36.5 |
14.0 |
38 |
−15.0 |
11.1 |
|
Pfeifer |
2000 223 |
71+ |
25 |
880 |
1200A |
2 |
74 |
40.5 |
27.0 |
74 |
18.3 |
20.9 |
|
Pfeifer |
2001 97 |
71+ |
25 |
800 |
1200 |
2 |
73 |
39.2 |
22.4 |
72 |
19.7 |
23.8 |
|
Sorva |
1991 224 |
71+ |
11 |
1000 |
1000 |
10 |
5 |
44.6 |
28.9 |
10 |
−1.4 |
2.3 |
|
Zhu |
2008 214 |
71+ |
68 |
1000 |
1200A |
60 |
29 |
36.2 |
27.5 |
34 |
−2.9 |
27.4 |
|
Barnes |
2006 225 |
adults |
52 |
600 |
1500A |
2 |
12 |
38.6 |
15.1 |
15 |
−7.2 |
11.3 |
|
Bolton-Smith |
2007 213 |
adults |
60 |
400 |
100 |
24 |
50 |
12.0 |
15.1 |
56 |
−8.2 |
14.3 |
|
Dawson-Hughes |
1997226 |
adults |
74 |
700 |
500 |
36 |
145 |
35.2 |
32.6 |
167 |
−2.1 |
22.7 |
|
Harris |
2002 227 |
adults |
55 |
800 |
0 |
2 |
27 |
22.3 |
14.0 |
23 |
−4.6 |
6.3 |
|
Heaney |
2003 228 |
adults |
71 |
1000 |
0 |
5 |
16 |
12.0 |
16.0 |
16 |
−11.4 |
17.6 |
|
Heaney |
2003 228 |
adults |
71 |
5000 |
0 |
5 |
17 |
91.9 |
37.6 |
16 |
−11.4 |
17.6 |
|
Heikkinen |
1998 229 |
adults |
26 |
300 |
500A |
12 |
18 |
9.4 |
10.9 |
18 |
−3.3 |
6.4 |
|
Honkanen |
1990 230 |
adults |
31 |
1800 |
1550 |
2.75 |
55 |
39.5 |
12.1 |
60 |
−13.1 |
9.2 |
|
Jensen |
2002 231 |
adults |
41 |
400 |
1450 |
36 |
33 |
34.6 |
23.2 |
33 |
16.5 |
28.2 |
|
Nelson |
2009232 |
adults |
62 |
800 |
0 |
12 |
55 |
35.3 |
23.2 |
31 |
10.9 |
16.9 |
|
Orwoll |
1988 233 |
adults |
58 |
1000 |
1000 |
12 |
46 |
25.0 |
19.1 |
46 |
3.0 |
19.1 |
|
Patel |
2001 234 |
adults |
72 |
800 |
0 |
12 |
35 |
8.4 |
13.1 |
35 |
−9.2 |
12.8 |
|
Riis |
1984 235 |
adults |
41 |
2000 |
500 |
12 |
8 |
87.5 |
14.1 |
7 |
−5.0 |
23.8 |
Adverse or safety outcomes
We included only clinical outcomes of tolerable upper intake levels, such as all-cause mortality, cancer (incidence and mortality), soft tissue calcification, renal outcomes, and adverse events reported in RCTs.
Results of all-cause mortality and cancer have been described in previous sections. In brief, we did not find vitamin D and/or calcium associated with an increased risk of mortality. For cancer risk, there were some observational studies reporting high calcium intake may be associated with an increased risk of prostate cancer (see “Prostate cancer” in “Calcium and cancer” section). We did not identify any studies on soft tissue calcification and tolerable upper intake levels.
Renal outcomes
The WHI trial on women aged 50 to 79 years, examined the effect of vitamin D3 400 IU (the Recommended Dietary Allowance for women aged 50 to 70 years and below the 600 IU recommended intake for women > 70 years) in combination with 1000 mg calcium carbonate versus placebo and found an increase in the risk of renal stones (Hazard Ratio 1.17 95% CI 1.02, 1.34), corresponding to 5.7 events per 10,000 person years of exposure.71 It should be noted that women in both groups were allowed to take additional vitamin D supplements up to 600 IU and later 1000 IU per day and calcium supplements up to 1000 mg per day. The baseline total calcium intakes (from foods and supplements) were high: 34% consumed less than 800 mg/d, 26% consumed 800 to 1200 mg/d, and 40% consumed more than 1200 mg/d. A prior publication from WHI trial provided the same data on the risk of renal stones was also included in the Ottawa EPC report.
No studies were identified that evaluated the effect of vitamin D, calcium, or combined vitamin D and calcium on other renal outcomes.
Adverse events reported in RCTs
The reporting of adverse events in RCTs was generally inadequate, and most trials were not adequately powered to detect adverse events. Among the 63 RCTs included in this report, 47 did not report information on adverse events.
Five RCTs (in 6 publications) that enrolled a total of 444 subjects reported no adverse events during the trial periods.35,51,227,238,239 Of these, one RCT administered combination of vitamin D2 (1600 or 3600 IU/d) and vitamin D3 (400 IU/d) supplements for 3 months, two RCTs administered vitamin D supplements (type of vitamin D not reported) with doses ranging from 200 to 2000 IU/d for 3 weeks or 1 year, one RCT used high-dose intermittent vitamin D3 supplement (120,000 IU sachets given 3 times, every 2 weeks, for 6 weeks), and one RCT administered 1200 IU/d vitamin D2 supplement for 5 years.
Eleven RCTs reported at least one adverse event (Table 107). Excessive gas, bloating, and gastrointestinal discomforts were reported to be associated with calcium supplementation (doses ranged from 600 to 1000 mg/d). Other RCTs of vitamin D (doses ranged from 400 to 5714 IU/d vitamin D3 or ranged from 5000 to 10,000 vitamin D2)
and/or calcium supplementations (doses ranged from 200 to 1500 mg/d) reported few cases of gastrointestinal disruption such as constipation, diarrhea, upset stomach, musculoskeletal soreness, primary hyperparathyroidism, hypercalcemia, renal calculi and craniotabes. One RCT reported some adverse events that required hospital admission, including retrosternal pain, a non-ST elevation myocardial infarction and a transient ischemic attack (all 3 cases in vitamin D 400 IU/d plus exercise training group) and one case of acute cholecystitis (in calcium, vitamin D plus exercise training group).80 Another RCT reported that “there were no significant differences between the vitamin D and the control groups in the rate of incident cancer and vascular disease (ischemic heart disease and stroke)” (actual data not provided), and one participant died during the study.98 However, these adverse events may or may not be associated with vitamin D and/or calcium supplementation in this study. Also described earlier in the “Renal outcomes” section, the WHI trial examined the effect of vitamin D3 400 IU in combination with 1000 mg calcium carbonate versus placebo and found an increase in the risk of renal stones (Hazard Ratio 1.17 95% CI 1.02, 1.34), corresponding to 5.7 events per 10,000 person years of exposure.71
Ottawa EPC report:
A total of 22 trials reported data on toxicity-related outcomes, 21 of which used doses above 400 IU/d. Toxicity results from trials with intakes of vitamin D above current reference intakes varied and this may have been related to different doses, baseline characteristics of populations or exposure times. Most trials excluded subjects with renal insufficiency or hypercalcemia, were of small sample sizes and had short durations of exposure to vitamin D. Event rates were low across trials in both the treatment and placebo arms.
Table 107. Adverse events reported in RCTs
|
Author Year |
N enrolled |
Vit D dose (IU/d) |
Ca dose (mg/d) |
Duration |
Adverse Event data (n=case#) |
|
Yamamoto 1995117 |
471 |
0 |
1000 |
6 mo |
Comparing calcium group to the placebo group, excessive gas and bloating were more frequently reported by white women at 3 months and by whites, in general, at 6 months, and white men reported more loose stools at 6 months. |
|
Moschonis 2006215 |
112 |
300 D3 |
600 or 1200 |
12 mo |
Bloating, constipation and intestinal discomfort apparently related to the calcium supplement |
|
Bunout 200680 |
96 |
400 |
800 |
9 mo |
Adverse events that required hospital admission: |
|
|
|
|
|
|
Vit D plus exercise training group (n=3): retrosternal pain, a non-ST elevation myocardial infarction and a transient ischemic attack. |
|
|
|
|
|
|
Calcium, Vit D plus exercise training group (n=1): acute cholecystitis |
|
Wactawski-Wende 200671 |
36282 |
400 |
1000 |
7 y |
The WHI trial found an increase in the risk of renal stones (Hazard Ratio 1.17 95% CI 1.02, 1.34), corresponding to 5.7 events per 10,000 person years of exposure. |
|
Burleigh 200781 |
205 |
800 D3 |
1200 |
Median 1 mo |
Hypercalcemia (n=2) |
|
Lappe 2008208 |
5201 |
800 |
200 |
8 wks |
GI disruption such as constipation, diarrhea, upset stomach (4%), and musculoskeletal soreness (0.9%) |
|
Brooke 198034 |
126 |
1000 |
0 |
3rd trimester only |
Vit D group (craniotabes, n=2), placebo group (hypocalcemia, n=5; craniotabes, n=6) |
|
Lappe 200752 |
1180 |
1000 D3 |
1400-1500 |
4 y |
Renal calculi in placebo (n=1), renal calculi in calcium only (n=3), renal calculi in calcium plus vit D (n=1) |
|
Mastaglia 2006240 |
65 |
5000 or 10,000 D2 |
500 |
3 mo |
Hypercalciuria (n=1) in control group |
|
Zhu 200898 |
256 |
1000 D2 |
1200 |
12 mo |
There were no significant differences between the vitamin D and the control groups in the rate of incident cancer and vascular disease (ischemic heart disease and stroke). |
|
|
|
|
|
|
There were 8 and 5 adverse events in vitamin D and the control groups, respectively. One participant in the vitamin D group had mild asymptomatic hypercalcemia one occasion. No case of renal calculus was reported. |
|
|
|
|
|
|
1 participant was deceased during the study. |
|
Sneve 200850 |
445 |
Group 1: 2 capsules of vitamin D3 each 20,000 IU taken twice a week (Monday and Thursday): ~5714 IU/d Group 2: 1 capsules of vitamin D3 each 20,000 IU taken twice a week (Monday and Thursday): ~2857 IU/d |
500 |
12 mo |
Primary hyperparathyroidism (n=2), increase in serum calcium to 2.62 mmol/L (n=1), transient increases in serum calcium > 2.59 mmol/L (n=4). |
|
|
|
|
|
317 other adverse events were recorded, most of them related to GI discomfort. There were no significant differences between the treatment groups regarding adverse events. |


