
Mission Development and Assessment Process
INTRODUCTION
This report follows the astronomy and astrophysics and the planetary science decadal survey reports as the third survey employing the cost and technical evaluation (CATE) process implemented by the Aerospace Corporation. CATE is an independent analytical approach for realistically assessing the expected cost and risk related to recommended initiatives that are at an early stage of formulation (typically pre-Phase-A). A unique attribute of the process is the ability to employ technical methods in combination with statistical methods to develop mission concepts based on their assessed complexity, risk, and lien factors. An essential driver to the CATE process is the requirement that all missions be treated using systematic and consistent methods in order to facilitate a uniform comparison of the relative cost, schedule, and risk of projects proposed for implementation. Secondary, but also essential, to the success of the process is the incorporation of iterative technical feedback from stakeholders, combined with a proven method for independent validation of the results. The successful implementation of these elements as an integrated process was fundamental to achieving confidence in the CATE process and consequent confidence in the assessment results, implementation assumptions, and decision rules applied to the recommended program.
The CATE process is the third leg of a science investigation triad following science mission implementation recommendations and an intermediate stage consisting of mission conceptual design activities. The flow of activities began with white paper submissions by the science community in November 2010, followed by concept evaluation and a mission design effort culminating with initial mission selection in April 2011. The subsequent iterative CATE process began in April and ended in September 2011.
As part of the CATE process, mission descoping options were introduced in recognition of the budget pressures NASA is likely to be facing over the next several years. A unique strength of the heliophysics discipline is the long experience of its investigators in doing exceptional science in a principal-investigator (PI)-led mode using small and medium Explorers. A key finding of the CATE process used in this study was that all of the proposed concepts were technically feasible at a reasonable cost. Furthermore, the descoped missions were of a scope, complexity, and cost that are consistent with successful mid-size PI-led missions executed for NASA’s Discovery program.
MISSION DESIGN ACTIVITY
The initial science assessment and prioritization effort yielded 12 mission concepts, with 4 concepts put forward by each of the three science discipline panels. Each of the concepts were then organized and systematized using a standard design questionnaire intended to provide a relatively uniform set of design parameters as an input to the mission design process. The 12 mission designs were then produced over a 5-week period in February and March of 2011 at the Concept Design Center (CDC) of the Aerospace Corporation in El Segundo, California. The CDC team consisted of experts who were “firewalled” from the CATE process. Each mission was supported by a group of both shared and dedicated CDC team members, one or more members of the survey committee, and a “champion” designated by the science panels to represent each investigation concept.
The cornerstone assumption for the mission design process was that cost-effective mission concepts demand a requirements-focused design combined with overall system simplicity. The general system design baseline resulting from these assumptions was a single-string (with selective redundancy in some cases) architecture using commercially available spacecraft bus designs similar in size to a medium Explorer. The bus structure and specific capabilities such as power and pointing were sized to accommodate the required science instrumentation. Mission-unique features were also incorporated to meet requirements for orbit and downlink, radiation hardness, magnetic cleanliness, deployable subsystems, dispensing functions, and de-orbit capability (if determined to be necessary). To constrain the system design and control cost, the system architecture was also scaled such that all missions were both sized and intended for orbits so as to be compatible with a launch on a medium-size launch vehicle or smaller. The largest launch vehicle required for any mission concept was the Falcon 9.
The design process was intense but also effective at developing a realistic set of concepts consistent with the above requirements and constraints. The effort was well supported by all stakeholders in the process, with detailed standardized reports prepared for each of the resulting system designs. The quality and consistent nature of the reports allowed for a straightforward comparison of missions leading into the subsequent down-select process. The reports were also designed to be compatible with the input parameters required by the CATE process.
Following distribution of the mission design reports, the science panels performed an initial review and made recommendations to the committee for the CATE down-select from 12 to 6 missions. The recommendations were based on science objectives, complexity factors, and relative cost assumptions. The following recommended concepts were presented by the science panels, endorsed by the committee, and moved forward into the first stage of the CATE process:
1. Dynamical Neutral Atmosphere-Ionosphere Coupling (DYNAMIC) mission,
2. Interstellar Mapping and Acceleration Probe (IMAP),
3. Solar Eruptive Events (SEE),
4. Magnetosphere-Ionosphere Source Term Energetics (MISTE),
5. Magnetosphere Energetics, Dynamics, and Ionospheric Coupling (MEDICI) mission, and
6. Geospace Dynamics Constellation (GDC).
CATE PROCESS
The CATE process has been discussed at length in previous reports and is based on the following principles, which have remained consistent between recent past surveys and this survey. The CATE flow
chart provided as Figure E.1 diagrams the end-to-end effort as described by these principles and executed for this report.
• Use multiple methods and databases regarding past space systems so that no one model or database biases the results.
• Use analogy-based estimating that anchors cost and schedule estimates to NASA systems that have already been built with a known cost and schedule.
• Use system-level estimates as well as a build-up to system-level estimates by appropriately summing subsystem data so as not to underestimate system cost and complexity.
• Use cross-checking tools, such as Complexity Based Risk Assessment (CoBRA), to cross-check cost and schedule estimates for internal consistency and risk assessment.
• In an integrated fashion, quantify the total threats to costs from schedule growth, the costs of maturing technology, and the threat to costs owing to mass growth resulting in the need for a larger, more costly launch vehicle.
The general CATE methodology for cost assessment is presented in Figure E.2. As with most cost assessment approaches, the CATE process uses mission analogies, growth metrics, and other relevant criteria applied to each work breakdown structure element that are derived from measured cost and schedule performance on past NASA (and selected Department of Defense) missions. Probabilistic methods are then employed using a triangle distribution to calculate the reserves needed to move the sum of the most
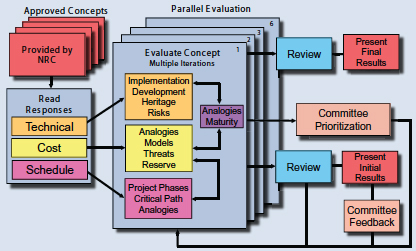
FIGURE E.1 Flow chart for the CATE process. SOURCE: Provided by the Aerospace Corporation under contract with the National Research Council.
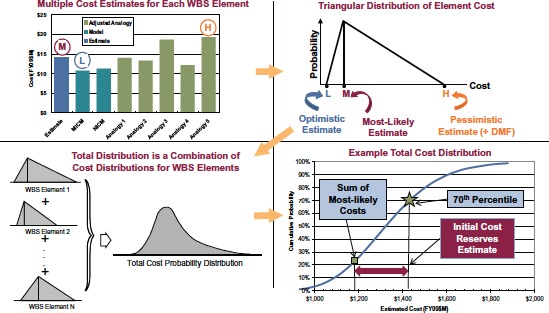
FIGURE E.2 CATE cost estimating methodology. SOURCE: Provided by the Aerospace Corporation under contract with the National Research Council.
likely cases up to a 70th percentile point1 on the resulting S-curve describing the statistical distribution for mission cost.
The CATE methodology for schedule assessment shown in Figure E.3 is also analogy based, with a probabilistically derived 70th percentile output. Analogous missions based on mission class, technical similarities, and participating organizations are used with historical phase durations for key mission milestones. These durations are used to develop triangular distributions of estimated phase duration. A cumulative probability distribution of the total schedule from Phase-B through launch is then generated by combining the individual schedule distributions.
As previously mentioned, a unique attribute of the CATE method is the ability to “grow forward” a program from a very early conceptual stage, where the threats and liens are often much larger than for missions that are at a later stage of development. The dominant factors are most often the natural growth that occurs in mass and power requirements on a mission as its system design matures. Accommodating growth in these areas often requires a larger launch vehicle or other mission changes that drive up the final cost.
A major area of cost uncertainty for the heliophysics CATE process was related to launch vehicle cost and availability. Launch vehicles are furnished by NASA and subject to NASA competitive procurement practices. Consequently, specific vehicle costs are unknown or could not be provided except in a broad cost range enveloping numerous vehicle types. As discussed above, smaller vehicles, beginning with the
________________________
1 The 70th percentile point represents the total cost (including reserves) within which there is a 70 percent likelihood that the mission can be accomplished.
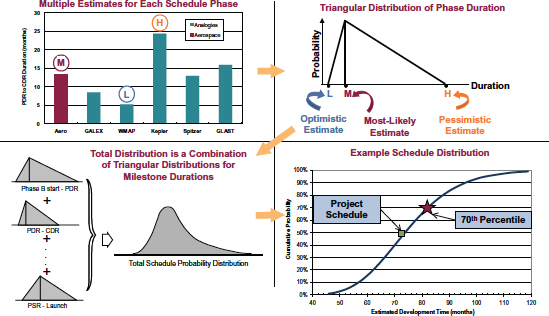
FIGURE E.3 CATE schedule estimating methodology. SOURCE: Provided by the Aerospace Corporation under contract with the National Research Council.
Taurus-XL 2XXX, Taurus-XL 3XXX, Taurus-II, and Falcon 9, were baselined and are capable of meeting all of the mission design cases that were studied. The Falcon 1 and Athena were treated as variants of the Taurus-class vehicle and are considered cost-neutral substitutes for the majority of the applications. The Delta-II was not considered to be available at the time of the mission design activity but is also a viable substitute with respect to launch capability, although at an unknown cost. It is also unclear whether the Delta-II will retain launch capabilities at the Eastern Test Range launch facility.
All vehicles (or comparable vehicles at comparable cost) were considered to be available later in the decade when the first missions would approach a state of launch readiness. The CATE process assumed the launch vehicle cost to be a pass-through based on an analysis using multiple publicly available sources. The cost range used in the process started at $60 million for the Taurus-XL 2XXX class and extended up to $125 million for the Falcon 9 in 2012 dollars. For the vehicles baselined in the design studies, the potential for cost growth and associated cost risk is considered low, although there is some risk related to availability of a particular vehicle type.
MISSION COST RESULTS
The cost comparison between the six mission concepts and associated descoped missions is shown in Figure E.4. For each mission there is a base cost resulting from the probabilistic cost analysis plus the analyzed cost for mission-specific threats and liens. The corresponding schedule results are shown in Figure E.5.
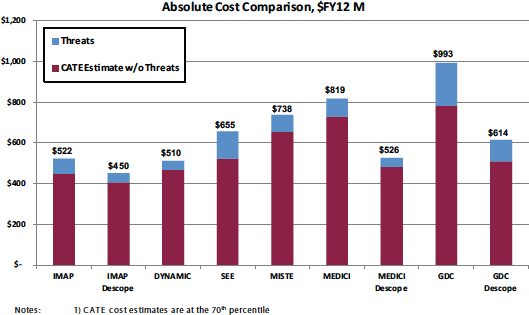
FIGURE E.4 CATE 70th percentile cost results for missions, including descoped alternatives. Base cost plus threats and liens shown (in fiscal year (FY) 2012 $ million). SOURCE: Provided by the Aerospace Corporation under contract with the National Research Council.
Specific to this survey is the recognition that several large missions are already through formulation or in the late stages of formulation such that they will become operational in stages that envelop most of the coming decade. Given the evident funding challenge early in this decade, a frequent mission cadence via the implementation of small- and medium-class missions over the entire decade is considered more valuable to the community than the implementation of, at most, one additional large mission.
This “simplified mission strategy” biased toward targeted executable investigations becomes clearer when examining Figure E.4 and Figure E.6, which represent the CATE assessment of cost and technical risk, respectively, for each of the six baseline missions plus the three descope options. It can be seen that the system approaches chosen for the missions have been successful at limiting the technical risk to the medium-low and medium categories, with a resulting payback in both affordability and cadence. The risk rankings are particularly illuminating when compared to previous surveys, in which most missions were ranked in the medium-high and high categories.
A combined assessment of cost and technical risk leads to the conclusion that simplified mission concepts similar to IMAP, DYNAMIC, and the descoped MEDICI recommended by the survey committee fall into the range of PI-led missions that can be successfully executed within the scope of the Solar-Terrestrial Probes (STP) mission line. These missions, along with GDC as the recommended Living With a Star (LWS) mission, have their key parameters summarized in Boxes E.1 through E.4 (provided by the Aerospace Corporation under contract with the National Research Council).
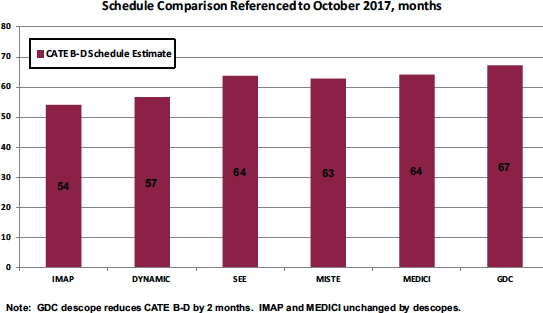
FIGURE E.5 CATE 70th percentile Phase-B through Phase-D schedule results. GDC descope reduces schedule by 2 months. IMAP and MEDICI descopes do not affect schedule. SOURCE: Provided by the Aerospace Corporation under contract with the National Research Council.
VALIDATION APPROACH
The final step of the CATE process consisted of a series of validation reviews intended to ensure that the assumptions and corresponding cost and schedule results are based on defensible assumptions, are fair in their representation of the assessed missions, and are consistent with past missions of similar content and complexity. The reviews consisted of a mix of both internal and external reviews conducted by the Aerospace Corporation and by the committee, respectively. The CATE validation tool used for this survey and all past surveys is the CoBRA tool developed by the Aerospace Corporation. Figures E.7 and E.8 map the mission candidates onto cost and schedule grids for comparison with successful missions of varying complexity plus “anchor missions” considered to be similar in size and complexity.
The results show excellent correlation between CATE results for mission concepts compared to successful missions and anchor missions. Therefore, the CATE results are considered compatible with experience, with respect to both cost and schedule. As one would expect, the CATE missions representing a 70th-percentile distribution are generally above the mean. One interesting result, discussed in the next section, is that the heliospheric anchor missions are generally below the mean trend line.
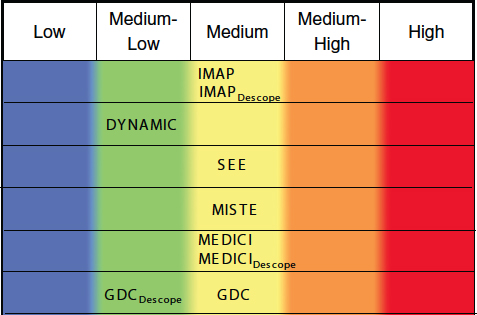
FIGURE E.6 CATE technical risk estimate. This estimate is provided to represent the level of technical risk resulting from the CATE assessment. Note that in the case of the IMAP and MEDICI investigations the descope resulted in a cost reduction but no change in the technical risk posture. An advantage of using a standardized CATE process is that the metrics for evaluating technical risk are based on technical criteria that are consistent across programs within a single survey as well as across surveys from other disciplines. Note: Red indicates that the concept is likely to be technically infeasible as proposed and/or that required technology development prevents achievement of science/mission objectives. Blue indicates that the concept has adequate margin and is consistent with a heritage heliophysics mission. SOURCE: Provided by the Aerospace Corporation under contract with the National Research Council.
PI-MODE IMPLEMENTATION
As described in the 2006 National Research Council report Principal-Investigator-Led Missions in the Space Sciences,2 NASA introduced the PI-led mode of implementation with the Discovery program and has since extended it to the Explorer, New Frontiers, and Mars Scout programs. Recent CoBRA analysis of 18 successful PI-led missions demonstrates that such missions with complexity indices of greater than or equal to 40 percent have costs that are typically approximately 30 percent less than non-PI-led missions having the same complexity. Figure E.9 shows the cost versus complexity for the set of successful missions from Figure E.7, with the PI-led missions indicated. The costs of only three of the PI-led missions with complexity greater than or equal to 40 percent exceeded the complexity-dependent median cost for all missions.
The distributions of individual mission costs relative to the overall median cost are shown in Figure E.10 for PI-led missions and separately for the other missions with 40 to 80 percent complexity. The two cost
________________________
2 National Research Council, Principal-Investigator-Led Missions in the Space Sciences, The National Academies Press, Washington, D.C., 2006.
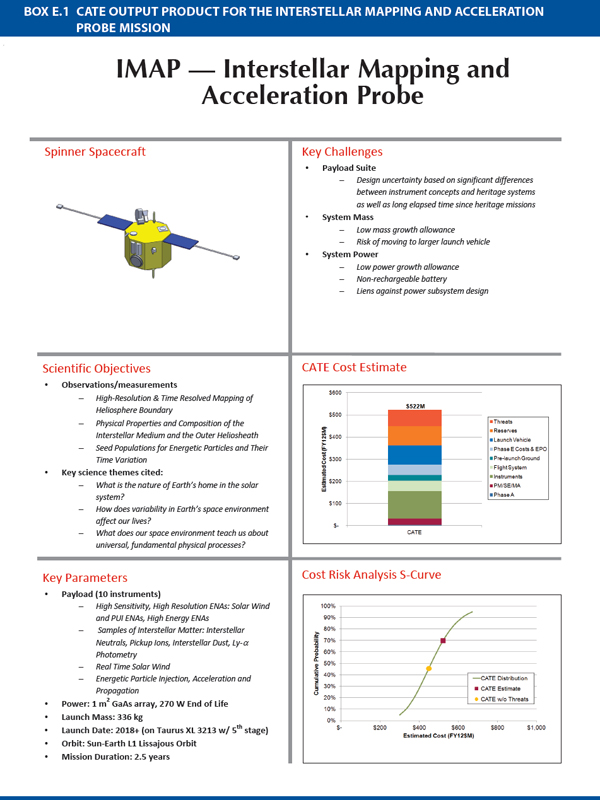
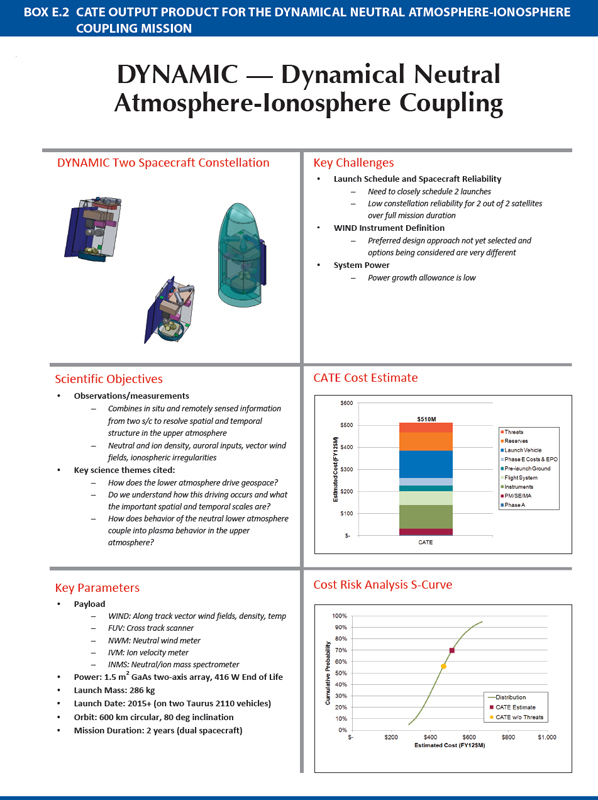
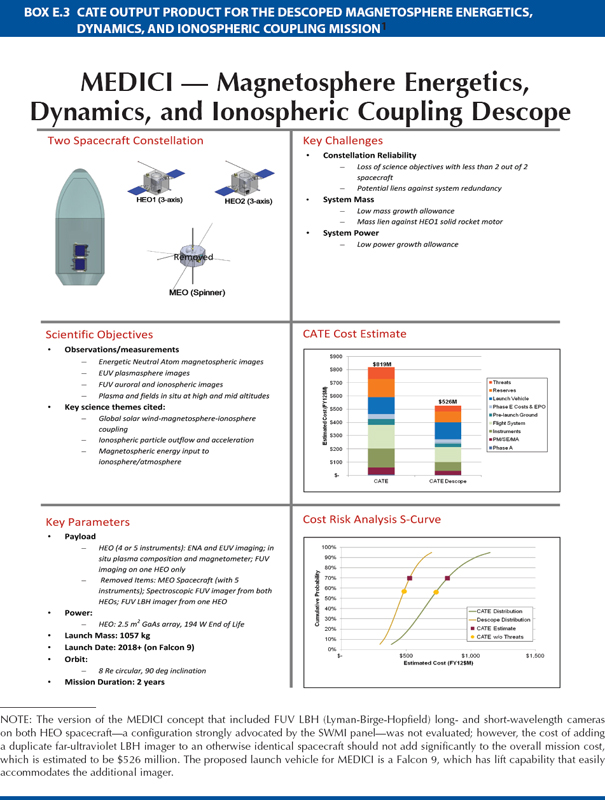
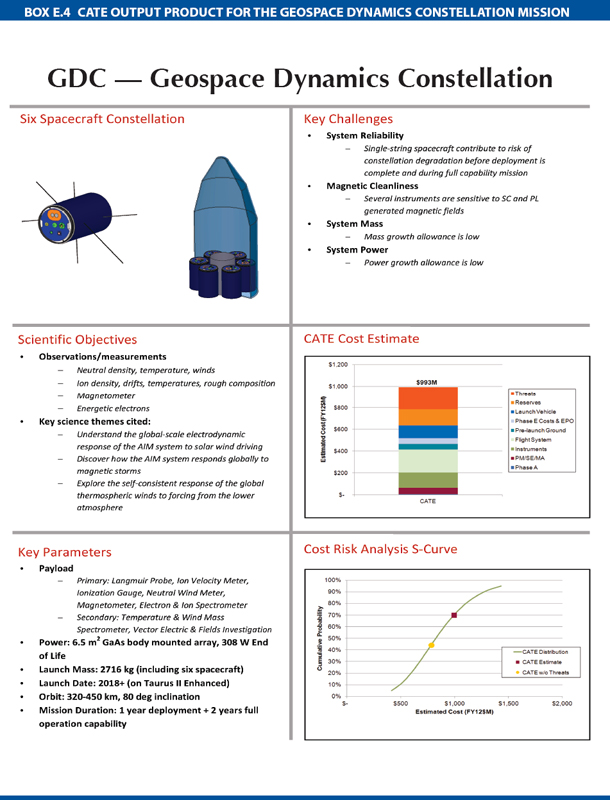
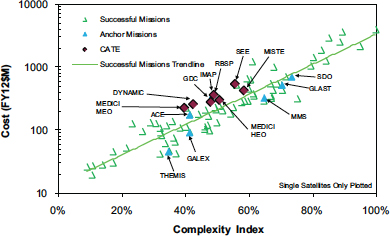
FIGURE E.7 CATE missions on Complexity Based Risk Assessment (CoBRA) cost versus complexity plot. Missions subjected to the CATE process mapped on to a standard CoBRA plot showing both successful missions and “anchor missions” used for correlation. The trendline represents the mean 50th percentile case. The CATE missions are statistically representative of a 70th percentile case. Results are for a single satellite in cases where multiple satellites are used. MEDICI is a special case since it has different satellites for medium Earth orbit and high Earth orbit. SOURCE: Provided by the Aerospace Corporation under contract with the National Research Council.
distributions are significantly different, with the median cost of PI-led missions 0.7 times that of the other missions. In addition, the cost risk of PI-led missions is also reduced, as indicated by the nearly symmetric distribution of PI-led mission costs about their median, with a small tail of three missions that exceeded the median cost of the other missions. In comparison, the cost distribution for other missions is distinctly asymmetric about its 50th percentile, with a larger fractional variance extending to higher costs.
The attributes of the PI-led mode that contributed to the success of these programs were summarized in the Principal-Investigator-Led Missions report and included:
• Direct involvement of the PI in shaping the decisions and the mission approach to realizing the science objectives;
• Two-step competitive selection: initial selection of two to four missions that receive funding for preparing mission concept studies prior to final selection of one or two missions for implementation;
• Standard evaluation process of technical, management, cost, and other factors prior to final selection; and
• Capped mission cost with a termination review and threat of cancellation if the mission is projected to exceed its cost cap.
The cost estimates from the CATE process do not take into account the potential cost reduction associated with PI-led mode implementation. However, the reduced cost and reduced cost risk associated with PI-led missions offer an important opportunity for optimizing science return in an era of stringent budget constraints.
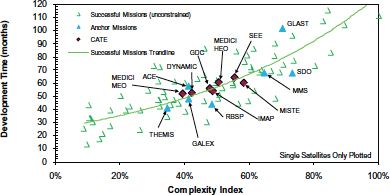
FIGURE E.8 CATE missions on Complexity Based Risk Assessment (CoBRA) schedule versus complexity plot. Missions subjected to the CATE process mapped on to a standard CoBRA plot showing both successful missions and “anchor missions” used for correlation. Results are for a single satellite in cases where multiple satellites are used. MEDICI is a special case since it has different satellites for medium Earth orbit and high Earth orbit. SOURCE: Provided by the Aerospace Corporation under contract with the National Research Council.
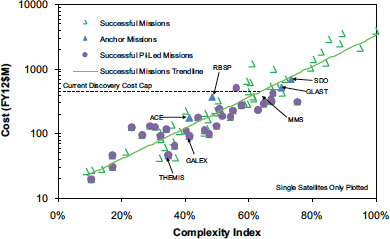
FIGURE E.9 CATE missions on Complexity Based Risk Assessment cost versus complexity plot. The green trendline is the median of the complexity-dependent costs of all successful missions. The costs of principal-investigator (PI)-led missions with >40 percent complexity are mostly below the median cost line. SOURCE: Provided by the Aerospace Corporation under contract with the National Research Council.
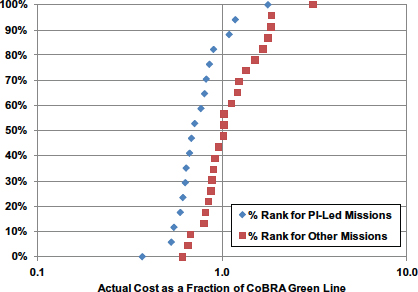
FIGURE E.10 Distribution of principal-investigator (PI)-led mission costs (blue) and non-PI-led mission costs (red) as a fraction of the median cost of all missions with 40 to 80 percent complexity (green trendline in Figure E.9). The median cost of PI-led missions is 0.7 times that of the other missions, with only 16 percent of the PI-led mission costs exceeding the median of the costs of other missions. The PI-led missions also have a smaller fractional cost variance. SOURCE: Provided by the Aerospace Corporation under contract with the National Research Council.


