
2
Demographic Perspectives on Family Change
The task of integrating family research needs to start with defining the family itself. Families consist of members with very different perspectives, needs, obligations, and resources. The characteristics of individual family members change over time—within life spans and across generations. Families exist in a broader economic, social, and cultural context that itself changes over time.
United States households and families are undergoing unprecedented changes that are shaping the health and well-being of the nation. Fundamental and rapid changes in family structure, immigration, and work and family, for example, have transformed the daily lives and developmental trajectories of Americans in recent years. This chapter summarizes four presentations, including three studies that examine family change largely from a demographic perspective and one that drew on qualitative methods to identify specific groups in a larger quantitative study. Demographic indicators provide a baseline of information for many other kinds of family research.
A particular focus in this chapter is the set of measures used to identify and track consistency and change in family structure. New and rapidly changing family forms require the development of new measures and their incorporation into existing and new instruments. New measures also need to recognize the tremendous diversity among groups that can be hidden in nationally representative averages of such family characteristics as cohabitation, marriage, family disruption, and fertility levels. As economic and cultural shifts, such as immigration, continue to diversify
family structure and dynamics, researchers need to explore new ways of conceptualizing and measuring household characteristics.
MEASURING FAMILY STRUCTURE AND STABILITY: EMERGING TRENDS AND MEASUREMENT CHALLENGES
Family living arrangements and trajectories are increasingly varied and complex in the United States. Age of marriage is at an all-time high. Cohabitation, not marriage, is the typical first type of union in U.S. society. Divorce and remarriage remain common, and births to unmarried women have accelerated rapidly, from 5 percent in 1960 to about 40 percent today.
These changing family dynamics have major implications for the living arrangements of children, said Susan Brown, professor of sociology at Bowling Green State University and codirector of the National Center for Family and Marriage Research. Furthermore, these living arrangements can have major consequences for children’s health and well-being, since children in unmarried families experience greater family instability, on average. Drawing on a recent review (Brown, 2010a) of the literature on family structure, instability, and child well-being, Brown discussed current measurement approaches and challenges.
The diversity of children’s family experiences begins at birth. Of the 40 percent of births occurring outside marriage, half are to unmarried cohabiting couples (Martin et al., 2009). The fertility rates of cohabiting and married women are actually today about equal. As a result, children are spending less time in married-parent families and more time in families that are formed outside marriage.
Table 2-1 shows the distribution of children’s living arrangements according to a recent census report. The majority of children—60 percent—still reside in traditional families with two biological married parents. The second most common family form for children is the single-mother family, in which about 20 percent of all children reside, followed by the married stepfamily category. Less common family forms for children include two biological cohabiting-parent families, cohabiting stepfamilies similar to the married stepfamily, single-father families, and children who live without either biological parent.
Demographers have developed innovative ways of conceptualizing and measuring family structure. These new approaches consider heterogeneity among two-parent families, the definition of family membership, some emerging family forms, how and when family structure is measured, and ambiguous family boundaries.
These new ways of thinking about two-parent families also make it possible to begin examining how children who live in traditional married biological two-parent families compare with those in other family
TABLE 2-1 Children’s Living Arrangements
| Family Structure, Children Ages 0-17 in 2004 | Percentage |
| Two-parent biological married family | 60.1 |
| Two-parent biological cohabiting family | 2.5 |
| Married stepfamily | 7.4 |
| Cohabiting stepfamily | 2.7 |
| Single-mother family | 20.5 |
| Single-father family | 2.6 |
| No-parent family | 4.2 |
| Total | 100.0 |
SOURCE: Brown (2010b). Based on data from Kreider (2007).
arrangements. What about children who live with both biological parents but the parents are unmarried? What about children who live in a stepparent family or with one biological parent and an unmarried parent? What about children who live with same-sex parents?
Traditional measures of family structure often ignore the presence of other family members, even though these individuals can be consequential for child well-being. For example, siblings can be whole siblings, half-siblings, or step-siblings. For 6 to 11 percent of children who reside with two biological married parents, half- or step-siblings are also in the family (Ginther and Pollak, 2004; Halpern-Meekin and Tach, 2008). Step- and half-siblings can also reside in other households, reflecting multiple partner fertility. “Some researchers argue that it is not enough to measure co-residential unions such as marriage and cohabitation, but that we also need to be addressing non-co-residential dating types of relationships that parents may be involved in,” said Brown. Not surprising, these “visiting relationships” are frequently less stable than cohabiting and married ones.
The language has not kept pace with new family forms, Brown observed. For example, with cohabiting relationships, researchers do not have shared understandings of how to describe these families or refer to family members. Some surveys use the term “unmarried partner,” but qualitative research has demonstrated that this term is not particularly meaningful for individuals who are involved in these relationships. They tend to think of their unmarried partner as a “boyfriend” or a “girlfriend.” And to the extent that response categories are not meaningful to survey
respondents, the prevalence and significance of cohabiting relationships may be underestimated.
This is even more the case for living apart together (LAT) relationships, which have attracted considerable attention in the European context but have been largely overlooked in the United States. LAT relationships consist of married or unmarried couples who live in separate households but otherwise are like cohabiting couples. The definition and the measurement of LAT relationships are muddy, particularly in distinguishing them from dating relationships.
The timing of when people are asked about family structure also can influence their responses. For example, in a survey conducted as part of the Fragile Families study—which is following a cohort of about 5,000 children in large cities born between 1998 and 2000, three-quarters of whom were born to unmarried parents—mothers were asked when a child was born whether they were married, cohabiting, or single. A year later they were asked again whether they were married, cohabiting, or single when the child was born. Among women married at the time of birth, 97 percent said a year later that they were married at the time of birth. But for women who said they were cohabiting, just 89 percent gave the same response a year later. And for women who said they were single, just 67 percent said they had been single a year later, with the others saying they were either cohabiting or married (Teitler et al., 2006). These retrospective discrepancies are consequential “for the subsequent relationship trajectories that the mothers and hence their children experience,” Brown said.
Research has demonstrated that family structure is more subjective than researchers might assume. In the National Longitudinal Study of Adolescent Health—known as Add Health, a nationally representative study of how social contexts affect the health and risk behaviors of teens and young adults—adolescents and their mothers were asked about family structure (Harris, 2009). In families with two biological parents, 99 percent of the responses were the same. But in families with single mothers, married stepparents, or cohabiting stepparents, 11.6 percent, 30.2 percent, and 65.9 percent of the responses, respectively, were different (Brown and Manning, 2009). “The more complex the family form, the greater the family boundary ambiguity,” Brown said. This ambiguity can affect even estimates of family structure, depending on which person in a family is asked about the structure.
Future data collection efforts need to accommodate these complexities by emphasizing longitudinal designs, by incorporating multiple family members across households whenever possible, and by using more nuanced measures of family configurations. These more nuanced configurations will need to be validated through qualitative research to deter-
mine whether the categories are meaningful for individuals. In addition, the increasingly diverse living arrangements of children demonstrate the importance of moving beyond these static comparisons to look at family dynamics and instability.
Family structure determinations provide a snapshot of children’s living arrangements. But as children experience more diverse living arrangements, they are also experiencing less stable ones. Some family forms are more stable than others, so that family structure is confounded with family instability.
Using Add Health data, Brown (2006) determined that, during a one-year period, 7 percent of adolescents reported a family structure change. For teens who were not residing in two biological parent families, this figure was nearly twice as high—15 percent. “The structure you start out with is setting you on a trajectory for subsequent stability or instability,” she observed.
Birth contexts also set the stage for family trajectories. One study (Raley and Wildsmith, 2004) found that a majority of children born to married parents experience no family living arrangement transitions by age 12, whereas most children who are born to either single or cohabiting mothers experience at least one transition by that age. If cohabitation transitions are included in the measure of family instability, the levels of family transitions increase 30 percent for white families and 100 percent for black families.
Marital transitions, whether divorce or remarriage, on average have cumulative negative effects on child well-being (Cavanagh and Huston, 2008; Fomby and Cherlin, 2007). However, cohabitation transitions operate differently. Transitions from a cohabiting family into a single-mother family have been linked to gains in well-being, or at least no change (Brown, 2006). Stable cohabiting families appear to be detrimental to child well-being on some dimensions relative to stable single-mother families and stable married stepfamilies. Thus, different types of transitions can have different effects on child outcomes.
A range of measures can capture family instability, including the number of transitions, the types of transitions, the timing of transitions, and the exposure to different family forms. For example, research1 has examined whether transitions that occur early in children’s lives are the most detrimental (Cavanagh and Huston, 2008; Heard, 2007). Other studies have examined the duration or proportion of time spent in a given
___________________
1The Board on Children, Youth, and Families convened a workshop on student mobility in 2008. The workshop report, Student Mobility: Exploring the Impact of Frequent Moves on Mobility: Summary of a Workshop, is available from the National Academies Press, http://www.nap.edu.
family form (Dunifon and Kowaleski-Jones, 2002; Magnuson and Berger, 2009). “There is no consensus in the literature on how to operationalize family instability,” said Brown. Sometimes researchers will use more than one indicator. Sometimes they will control for current family structure or structure at birth. “This is a situation in which our data have outpaced our theory.”
Family scholars need to revisit and expand existing theories related to family instability, Brown said. They also need to develop new theoretical frameworks for understanding how, why, and when family instability shapes children’s outcomes. Some of this theory development could be informed by a systematic review of these empirical findings, which are extensive and complex.
Researchers need to strive for greater consistency across studies in the measurement of family instability. Also, they need to pay more attention to various groups for whom family instability might have differential effects. These groups include disadvantaged populations, such as children who are born to unmarried mothers, and different racial and ethnic groups. In particular, few studies have been conducted on Latino families. Gay and lesbian families have also been understudied.
The broad array of diverse living arrangements has generated considerable interest in family instability, but there is no consensus on how to conceptualize or measure it. “Innovative measurement will require new concepts and theories that reflect these very rapid changes that are occurring in U.S. families,” Brown observed.
THE COMPLEXITY OF LIVING ARRANGEMENTS: COHABITATION AND FLUIDITY
R. Kelly Raley, professor of sociology and training director at the Population Research Center at the University of Texas at Austin, explored the issues of cohabitation more deeply. In most research, cohabitation means sharing a household with a sexual or romantic partner. Roommates who are not sexually involved therefore are not usually considered cohabiting couples, nor are sexual partners who are not living together. Cohabitation is generally applied to both heterosexual and homosexual unions, although by far the majority of the research in this area has focused on heterosexual partnerships. Levels of commitment in cohabiting relationships range from extended hookups or casual sexual relationships to couples who are engaged to be married within a few days. Some have a residence elsewhere but sleep over most of the time, perhaps to hide from parents that they are cohabiting.
Demographers often use a three-category grouping for cohabitation. The first group consists of cohabiters who may be experimenting with a
married living arrangement. They may be engaged to marry or plan to marry eventually. A second group, known as the “alternative to being single” group, may not intend to stay together for the long term but enjoy the convenience and the economies of scale of living with a romantic partner. A third group, the “alternative to marriage” group includes people who view traditional marriage critically and choose not to marry, although in most other ways the relationship resembles marriage.
Within the group that is treating cohabitation as a trial marriage, there is substantial heterogeneity. Some have a marriage date, and others would like to marry someday but face many barriers, such as unstable employment or drug and alcohol abuse. For this latter group, these barriers will probably contribute to the end of their cohabiting union before they get married.
One way to view cohabitation is as a signal or a symptom of growing female autonomy. From this perspective, much family change has been generated by long-term shifts in ideology that undermine old patriarchal family arrangements. For example, increases in women’s labor force opportunities have made them less dependent on marriage. Since people still enjoy companionship, cohabitation serves as an alternative, less committed, and less patriarchal arrangement.
An alternative way to view cohabitation is as a response to uncertainty, particularly economic uncertainty. Difficult transitions into a career, with spells of unemployment or underemployment following the completion of education, strongly predict cohabitation.
Today about half of all marriages dissolve. However, divorce rates are declining among the college educated, although they remain high and are maybe even growing among the less well educated. People with less education rightly believe that marriage is uncertain, particularly when steady employment is in short supply. Cohabitation is a response to this uncertainty both about marriage and about their future economic prospects.
Demographers started to track cohabitation closely as family structures changed substantially over the 1970s and 1980s. Important trends include the rising age at marriage, increases in divorce, and rapid growth in single-parent families. As shown in Figure 2-1, the proportion of women married by age 25 has declined substantially by birth cohort. The proportion of women having a first union by age 25 also declined during that period, though not nearly as much as the rate of marriage. The increasing gap between percentages of first union and marriage before age 25 points to a rise of cohabitation. Raley also pointed out that cohabitation is increasingly common after a divorce, but much less is known about the repartnering process and postmarital cohabitation.
Cohabitation has become an increasingly common feature of childhood. Most of the increase in nonmarital fertility in recent decades has
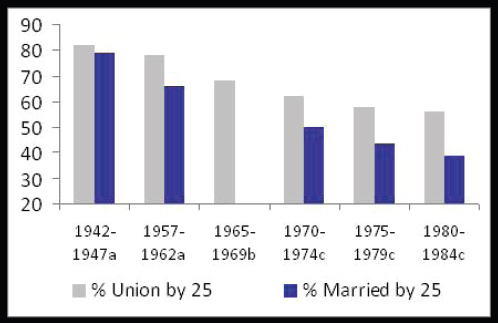
FIGURE 2-1 Trends in the percentage of women ever in union by age 25.
SOURCE: Raley (2010), based on data from, (a) Bumpass et al. (1991); (b) Raley (2001); and (c) CDC/NCHS, National Survey of Family Growth (NSFG) Cycle 6 (2006-2008).
come from births to cohabiting women (see Figure 2-2). Consequently, an increasing proportion of children—perhaps as many as half—live at some point in their life with a cohabiting mother. Tracking cohabitation can improve measurements of family stability. Fewer cohabiting unions now result in marriage than in the past. After about five years, only about half such couples are married, and 37 percent have split (Bumpass and Lu, 2000). By this measure, even though levels of divorce have been roughly stable since 1980, the probability that a child experiences a union dissolution is increasing.
Rates of cohabitation vary across population groups. For example, many previous studies have shown that cohabitation is more common among less educated groups. However, if cohabitation is measured in the first three years after leaving school, it is seen to be a common feature of the life course for all education groups (Daniels and Raley, 2010). It is the most common family formation event in the first three years after leaving school. What is different across groups with different levels of education is that the more highly educated women are more likely to marry. More educated women are also less likely to have a premarital birth (Daniels
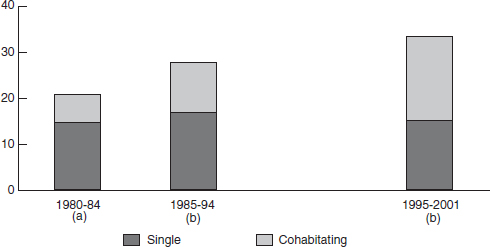
FIGURE 2-2 Trends in the percentage of births that are nonmarital.
SOURCE: Raley (2010), based on data from (a) Bumpass and Lu (2000); and (b) Kennedy and Bumpass (2008).
and Raley, 2010). Thus, there is substantial variation by socioeconomic status in family formation patterns.
These observations relate to the underlying meaning of cohabitation. Whether cohabitation signals changes due to growing autonomy or growing uncertainty depends in part on class. For more highly educated women, it may well indicate growing autonomy and increasing choices. For less educated women, it appears that cohabitation is likely more a response to uncertainty. Qualitative research suggests that many women who want eventually to have a child and who realistically are unlikely to marry soon may stop using contraceptives in a cohabiting relationship. Raley stated, “They often become pregnant, maybe sooner than expected, but it isn’t a concern. It is just something that happens sooner. It is not exactly planned, but it is not exactly something that they were trying to avoid.”
Cohabitation is not institutionalized. No broadly shared understandings of privileges or obligations are associated with this status. This limits the usefulness of cohabitation as an indicator of family structure in two ways, said Raley. By covering a diverse range of relationship types, this ambiguity creates a problem for the development of survey questions to measure cohabitation. For example, if people are asked about their relationship to the householder and “unmarried partner” is one of the response choices, they often do not check that response even if they
meet the definition of that term. Starting in 1990, the census measured cohabitation by including unmarried partner as a type of relationship to householder (Kreider, 2007). Then, in 2007, the census began asking, “Is there somebody in the household who is your boyfriend, girlfriend, or partner?” This new question resulted in an increase of 17 percentage points in the number of people in cohabiting relationships (Kreider, 2008).
Another way in which cohabitation is limited as an indication of family structure is related to its diversity. Some cohabiters are engaged to be married, and others have no intention to marry. For studies that aim to understand the limitations of cohabitation for children’s or adults’ well-being, this variability is potentially as great as the difference between being married and being single. For this reason, it is important to measure not only household structure but also the quality and the commitment of relationships.
Cohabitation or marriage is not the only important aspect of household structure. A small literature indicates that child well-being may be influenced by the presence of half- or step-siblings, even when they are living with both biological parents. One approach to measuring these relationships involves the use of a matrix in which each person in a household is asked about the relationship of each person in the household to each other person in the household. “It can be kind of burdensome, but it will be thorough in capturing all the children’s relationships to all other children in the household,” Raley said.
The Current Population Survey has taken a less burdensome alternative. It is asking about all the parent figures for a child in a household, whether a biological parent, a stepparent, or an adoptive parent. “Hopefully this new resource will help us better measure the additional important aspects of children’s household structure,” Raley said.
The final limitation of cohabitation measures is that they do not capture nonhousehold family relationships. For example, parents transitioning into and out of visiting relationships may introduce important aspects of change and instability into children’s lives. Similarly, research shows that half-siblings, former spouses, and extended kin living elsewhere can influence family functioning.
If the diversity in cohabiting households is great, the variability in noncohabiting single-parent households is even broader and more ambiguous. Some mothers are raising children on their own with little help or interference from the child’s father, extended kin, or current boyfriends. Others are maintaining a complex network of relationships with fathers of their children. These external household members can bear on family processes in the household.
Despite the limitations of cohabitation as a measure of family structure, it should not be abandoned, Raley said. Cohabitation is a common
experience and a useful indicator of instability. However, as family structure continues to change and diversify, innovative ways of capturing change and variability must be developed. In particular, it is important to measure levels of commitment and the quality of relationships and to distinguish variability among cohabiting unions.
INTERGENERATIONAL ASPECTS OF CHANGE IN FAMILY PATTERNS
Research on family structures usually begins with static measures, which have been used in recent years to capture an increasing diversity of family forms. But dynamic measures of family structure change also have shown tremendous improvement, as have measures of family and social networks. These developments have made it possible to study family structure across generations, said Kathleen Mullan Harris, professor of sociology at the University of North Carolina at Chapel Hill and director of the National Longitudinal Study of Adolescent Health (Harris, 2009; Harris et al., 2009).
Since 1994, Add Health has collected data on four waves of study participants to explore the causes of health and health-related behaviors of adolescents and their outcomes in young adulthood (Harris, 2009). The participants in wave I were in grades 7-12 when the study began. Among these adolescents, 74 percent lived in two-parent families and 26 percent lived in single-parent families. The majority of adolescents lived with two biological or adoptive parents (54 percent). Approximately 20 percent lived with a single mother, 14 percent lived with a biological mother and stepfather, 6 percent lived with surrogate parents (including grandparents, uncles, older siblings, foster parents, in group homes, and so on), 3 percent lived with a single father, and 3 percent lived with a biological father and stepmother. As these numbers demonstrate, there is tremendous heterogeneity of families and some fuzziness between categories, said Harris.
The Add Health study also gathered data on parents’ relationship histories and on a child’s coresidence history, which can be mapped with his or her age. Thus, measures of family structure are available each year, making it possible to construct indicators or trajectories of family structure over time. Family structure transitions also can be measured dynamically and added up over a child’s life.
These changes in family structure can be quite complex, Harris observed. Children can experience many parents in their lives. Gathering this information also can be costly in terms of survey time and taxing for respondents. Despite these difficulties, the available data show that family change at the level of parents affects family formation in a child’s generation. The data from Add Health have supported other studies in concluding that growing
up in a nonintact family form is associated with teenage parenthood, early marriage, nonmarital childbearing, and life-course trajectories of family instability. These intergenerational effects were consistent across numerous studies in the 1980s and 1990s.
The intergenerational effects of family change can operate in multiple contexts in a child’s life. Children spend time with their friends, their classmates, the families of their friends and classmates, and families in their neighborhoods. The family patterns encountered during a child’s life may be especially influential during adolescence, when young people begin to look to the future and form expectations about the kinds of families that they will form. They undergo a collective socialization toward family forms by observing them in the social contexts of their lives. Members of a parent’s generation serve as role models, especially when romantic relationships become salient during adolescence. The social control of youth through monitoring and supervision is also important, and this is related to the number of adults in the social context of an adolescent’s life.
This collective socialization can be difficult to study because of a lack of data. But the design of Add Health provides an opportunity to study intergenerational effects by looking at collective socialization at the peer, the school, and the neighborhood levels (Harris et al., 2009). For example, data from both wave I and wave II capture youth in the transition to adulthood to age 26 (Harris, 2009). Peer data are obtained by getting information from the adolescent’s five best male and five best female friends. Family data come from both parent and adolescent interviews, and neighborhood data come from geocoded residence addresses. The family structure of friends, families in schools, and families in the neighborhood can be measured through the percentage of two-parent families, single-parent families, and other family forms.
Add Health data reveal the cumulative probabilities of first nonmarital births by the structure of the family of origin (Figure 2-3). The lowest probabilities of first nonmarital birth are to youth who grew up in a biological two-parent family. The highest probability is for youth who grew up in a surrogate family or other family type.
The same analysis can be done by looking at the percentage of a person’s friends from two-parent families. The lowest probabilities of nonmarital births are among individuals all of whose friends are in two-parent families (Figure 2-4). When measured by the percentage of students at a school from single-parent families, the highest risks are for individuals with high percentages of schoolmates from single-parent families. And when measured by the percentage of female-headed households with children, the risk is also higher in neighborhoods with large numbers of single mothers.
Modeling of these results has shown that the influences on nonmarital births act independently and are additive, said Harris. Youths who grow
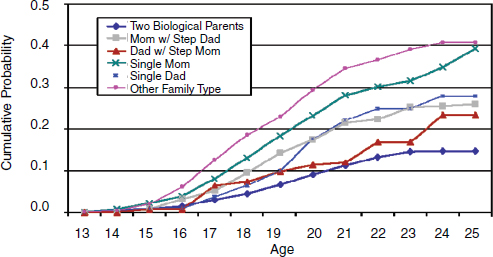
FIGURE 2-3 The cumulative probabilities of first nonmarital birth vary by the structure of the family of origin.
SOURCE: Harris (2010), based on data from Harris and Cheng (2005).
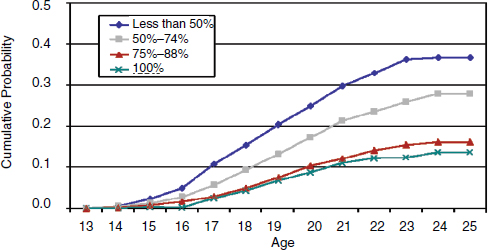
FIGURE 2-4 Cumulative probabilities of first nonmarital birth vary by the percentage of friends from two-parent families.
SOURCE: Harris (2010), based on data from Harris and Cheng (2005).
up with two biological parents but live in a neighborhood in which single-parent households are prevalent face higher probabilities of nontraditional family formation.
Some researchers have begun to think about creating family histories of instability or stability across generations, Harris observed. The Add Health study plans to reinterview parents in the next wave of data collection. It also plans to interview the children of the adult respondents, generating data that spans three generations. Additional questions are whether there are patterns that occur across more than one generation and whether effects on family structure extend beyond a child’s family. But family change patterns across multiple generations are difficult to study.
Some innovative designs and current research are under way. For example, genetic data could help sort out shared and unshared genetic and environmental sources of variation in family formation patterns across generations.
MEASURING THE IMPACT OF RACE, CLASS, AND IMMIGRATION STATUS ON FAMILY STABILITY
Study of family structure began with mostly white scholars concerned about issues that affected mostly white, middle class, native-born Americans. But American society is much different today, observed demographer Daniel Lichter, professor of policy analysis and management and sociology and director of the Bronfenbrenner Life Course Center at Cornell University. Immigration has driven racial, ethnic, and class variation in the United States by creating rapid growth in the non-European immigrant population. Among Asians and Pacific Islanders, for example, almost 90 percent of children have a foreign-born parent. Among Hispanics, it is about two-thirds. These two groups are changing the ethnic and racial composition of U.S. society. The fact that America’s new immigrant groups are mostly young adults means that their growing children will have a substantial effect on family change for the foreseeable future. As recent trends demonstrate, family science must include the immigrant experience and how immigrant children are being raised in society.
As shown in Figure 2-5, there has been a tremendous increase in the volume of immigration in the United States over the last 10 years. Until the recent recession, about a million new legal immigrants were arriving in the United States every year (Martin and Midgley, 2006). Much of this immigration is from Asia and Latin America. In addition, another 12 to 13 million immigrants are undocumented, and the future of this group will have major implications for the country’s future.
Roughly half of the growth in the U.S. population since 2000 has come from Hispanics, both through immigration and through the fertility of the
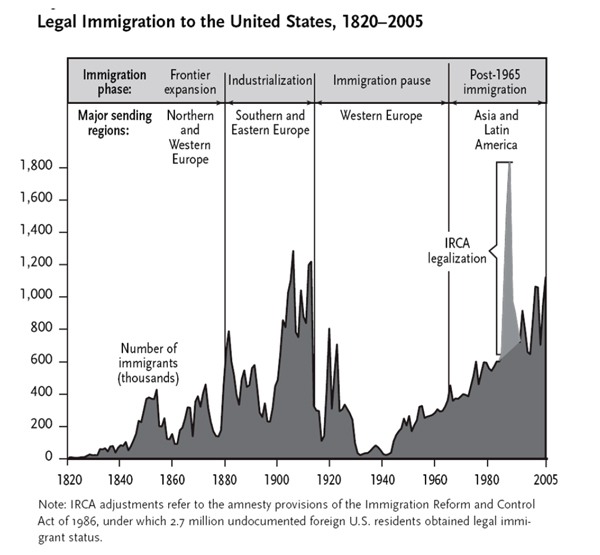
FIGURE 2-5 Legal immigration to the United States was high around the turn of the century, declined during the Great Depression, and has risen steadily since the end of World War II.
SOURCE: Martin and Midgley (2006). Reprinted with permission. Copyright 2006 by Population Reference Bureau. Based on data from Yearbook of Immigration Statistics: 2005.
new immigrant populations. This has created a large built-in demographic momentum for the future population growth of this group (Martin and Midgley, 2006).
The U.S. Census Bureau (2010a) is projecting that by 2042 the United States will be a “majority minority” society—where the minority population exceeds the non-Hispanic white population. But for America’s children, the future is now. About half of all births in the United States are now to groups other than non-Hispanic whites. Already, the absolute
numbers of white and black Americans are declining. “Over the next 20 years, the racial and ethnic composition of scholars studying family changes is going to be much different than we see in this room today,” Lichter said.
Immigrants are more widely dispersed in the United States than they have been in the past. Hispanic populations are growing rapidly in many parts of the United States, often drawn to specific occupations. This growth is occurring in many locations that are different from traditional Hispanic gateway locations. Lichter observed, “I grew up in South Dakota. For a while when I was in college, I lived in a working class neighborhood in Sioux Falls, South Dakota. It was a Catholic church that I attended. I went back there recently to this working class neighborhood. Now that neighborhood is mostly Hispanic. The church is Our Lady of Guadalupe. They have Spanish-speaking masses. It is four blocks away from the Morrill meat packing plant.” These new immigration patterns will have implications for schooling, neighborhood segregation, the use of English, and many other issues, said Lichter.
From the perspective of family structure, an important observation is that family structure and change are not the sole determinants of racial and ethnic variation in poverty. Family structure will certainly have some effect on the poverty rates of children when they become adults, but it is not the sole factor.
Population-based, nationally representative studies have focused on marriage patterns, cohabitation, family disruption, and fertility. But most of this research is focused on a single point in time and does not capture the dynamics of family instability, particularly for different immigrant groups or for different immigrant experiences. National averages hide tremendous diversity across different racial and ethnic groups.
For example, research by D. J. Hernandez (2004) has demonstrated differences between native-born and immigrant children in U.S. households. Immigrant children are more likely to live in households with nonparents and to be in crowded households, and they are at greater risk of a variety of negative experiences that may have certain developmental consequences (see Figure 2-6) (Hernandez, 2004).
Many immigrant children live with extended families, a situation known in some groups as “doubling up.” Some groups also have very different experiences with transnational families that are linked in fundamental ways to families in other countries. Partners, spouses, and children may not be living with their parents but going back and forth between different countries.
Another issue that deserves consideration is interracial and intraracial marriage. When children have parents of mixed racial and ethnic groups, or if they have one native parent and one foreign-born parent, these factors have implications for issues of racial identity and assimilation.
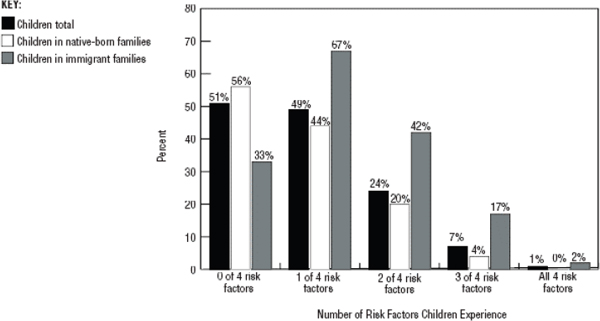
FIGURE 2-6 Immigrant children have more risk factors than do native-born children. NOTE: The four risk factors are (1) having a mother who has not graduated from high school; (2) living in economic deprivation (based on the 2x-poverty measure); (3) living in a linguistically isolated household; and (4) living in a one-parent family
SOURCE: Hernandez (2004). Reprinted with permission. Copyright 2004 by The Future of Children, a publication of the David and Lucile Packard Foundation.
Structural and cultural variations in family structure, parenting practices, and child outcomes are other key issues, as are school and neighborhood contexts, including neighborhood segregation of immigrants. In the past, geographic and social mobility have tended to go hand in hand. But with the new movement of Hispanic groups into new destinations, that is changing. Many are less educated and have higher rather than lower rates of fertility, which is driving population change in these communities. “We don’t know very much about the white response in these areas, whether there is going to be a new kind of spatial patterning of out-migration or white flight from these rural areas. These are all issues that have implications for the future well-being of children generally but immigrant children in particular,” said Lichter.
Several critical kinds of data are lacking. Large national longitudinal survey samples often lack enough immigrants to drawn meaningful conclusions. Cross-sectional studies and the census tend to emphasize the prevalence of demographic characteristics rather than behavioral changes. Retrospective data do not enable much modeling because not enough data are available on such factors as economic conditions, employment, or migration. For these and other reasons, research on immigration is not particularly nuanced or cumulative. Lichter observed, “it is very hard to link
one discrete piece of research on a particular population of Vietnamese or Asians or Koreans or other groups with a broader theoretical or conceptual perspective. It is very hard to get a handle about what is important or what is needed next.”
A critical need in surveys is to distinguish second-generation Americans from higher generation Americans. It would be useful for more surveys to include a question on the country of origin of each parent. Lichter said, “I wish we had that in our census data, but we don’t. We have it in the Current Population Survey, so you can do some things that make sense, but not in the decennial census or American Community Survey.”
Other data needs include the relationship of each person to everyone else in a household, income transfers and social support, mode of entry, migration histories, and connections to the ancestral country or country of origin.
Changes to the American Community Survey have made it possible to examine issues in ways that could not be done in the past (U. S. Census Bureau, 2010b). For example, a new question beginning in 2008 asks whether a respondent had a birth in the past year. This can be linked to marital status, yielding insights into fertility among cohabiting partners. Another series of question asks whether, during the past 12 months, a respondent was married, widowed, or divorced and how many times a person has been married. With this information, researchers can investigate marriage, remarriage, and other dynamic family processes.
Immigration is becoming an increasingly important issue in U.S. society. Lichter also observed, “A growing racial and ethnic diversity is here to stay, even with highly restrictive immigration policy, in part because of the high rates of fertility that we have seen in the recent past.” Assimilation does not amount to cultural genocide, Lichter observed. Groups equilibrate over time and continually affect each other.
THE USE OF MIXED METHODS IN THE STUDY OF THE HURRIED CHILD
Another striking characteristic of modern families is the extent to which children are involved in multiple activities in addition to their time in school and at home. Sandra Hofferth, professor of family science and director of the Maryland Population Research Center at the University of Maryland, gave an example of a mixed quantitative-qualitative study conducted when she was a member of the Center for the Ethnography of Everyday Life at the University of Michigan. The question she addressed is whether busy children are overly stressed and pressured. One challenge was to define and measure “busy-ness.”
She and her colleagues conducted qualitative interviews of parents
and children ages 9 to 12 in 43 Michigan families (Hofferth, 2009). There was some variation in family structure, but these interviews were limited to white families with a mother who had at least a high school education. Parents and children were asked about the children’s activities, whether there were too many, whether they wanted to change, and what allowed them to manage their lives. This approach allowed the researchers to determine what parents meant by saying that their child had too many activities and too little time.
The results indicated that both the number and time spent in activities mattered. The researchers also needed to define and measure stress. They found that parents mentioned the child crying or being sick, tired, and not wanting to participate in an activity as signs of stress. To obtain comparable measures of activities and the time spent in them in a large quantitative study, the researchers used data from time-diary interviews with a nationally representative sample of children ages 9 to 12 across the United States. Based on the distinct groups that arose from the qualitative study, they created four categories—hurried, balanced, focused, and inactive—using the amount of time and number of activities in which the child participated. They also used a standard scale of internalizing behavior problems to measure stress, which included such attributes as high-strung, nervous, fearful, anxious, unhappy, sad, and depressed. They then associated the activity categories with measures of stress using multivariate methods.
They found, counterintuitively, that the more inactive children had higher levels of stress than the more active children. Parents have a tendency to seek equilibria, said Hofferth. Parents had made changes in the schedules of children who were overly stressed; therefore, children were not currently stressed. The inactive children were a greater challenge to parents, who wanted their children to become more involved with activities. This was a source of tension and stress in the parent-child relationship. Parents reported that when less involved children became involved in activities, children’s stress symptoms declined. “The results strike at strongly held stereotypes and beliefs,” said Hofferth. “Many refuse to believe the results in spite of the fact that parental interviews confirm them.”
Quantitative research is a largely deductive process, she said. It allows researchers to weed through hypotheses, throwing out some and keeping others, at least temporarily. Qualitative research is inductive. It starts with data, develops and improves constructs, questions, and measures, and often results in unanticipated findings. This research can produce important insights—but it also raises challenges. It generates enormous amounts of data, and it can be difficult to distill the results into concise conclusions. Coordinating this research may always be difficult. And
it can also be difficult to find journals willing to publish this kind of research, since journals prefer short, focused articles on narrowly defined topics. Hofferth’s work on the hurried child, for example, eventually was published in an edited volume (Hofferth, 2009).
DISCUSSION
During the discussion period, Jane Guyer pointed out that families were unstable in the earlier part of the century because of a high rate of adult mortality, which was followed by a period of relative stability before the modern period of increased instability. She then asked whether certain forms of family instability today, such as incarceration, are the equivalent of death, because an adult can suddenly disappear from a child’s life and not return. Kathleen Mullan Harris pointed out that if a single-parent household is formed as a result of parental death, child outcomes do not differ that much from two-parent families in comparison to families that undergo divorce, separation, or abandonment. She speculated that a divorce or separation may be accompanied by conflict that has a negative effect on a child. Also, the children of a deceased parent can remain in contact with the deceased parent’s family, grandparents, and extended social network, so there is not as great a loss of social capital.
Susan Brown noted that one in four black children who were born in 1990 had a parent in prison by the age of 14 (Wildeman, 2009). “For particular subpopulations, imprisonment really is a significant factor that only now is getting some attention.”
Hirokazu Yoshikawa asked whether surveys are being modified to capture diversity in family structure. Brown responded that working groups are dealing with the issues and that progress is under way. For example, the National Center for Family and Marriage Research at Bowling Green State University is compiling data on cohabitation. This will be particularly helpful in refining the terminology used to discuss family forms.
Jere Behrman asked about family structure in other parts of the world, and Kelly Raley briefly discussed work in Western Europe. There is considerable geographic and population variation in family structure even in Western Europe, she noted. Similarly, in Latin America, both overall and detailed patterns differ from other parts of the world. “We need to move toward capturing some of this variability,” she said. “Just using the umbrella term of ‘cohabitation’ is obscuring some important variations across racial and ethnic groups.”


