
3
The Role of Obesity
It is well known that people in the United States have, on average, higher weight for a particular height than people in other developed countries. It is also well known that obesity is associated with a variety of negative health effects, such as diabetes, heart disease, high blood pressure, and certain types of cancer (Prospective Studies Collaboration, 2009). So it is natural to ask whether the higher rates of obesity in the United States may help explain the divergence in life expectancy trends that has been observed over the past quarter of a century.
In discussing the role of obesity in mortality, it should be recognized that one becomes obese by virtue of caloric expenditure falling short of caloric intake. Thus, lack of adequate physical activity is intrinsic to the process of becoming obese. Empirically, obese people maintain, on average, lower levels of physical activity (Adams et al., 2006). Some epidemiologic studies consider the effects of both low levels of physical activity and obesity on mortality. Typically, both are shown to have independent effects (see, for example, Hu et al., 2004). Other studies do not consider the roles of physical activity and obesity separately. In these cases, the effects of obesity on mortality will also reflect the effects of physical activity since obesity and lack of physical activity are correlated.
INTERNATIONAL TRENDS IN OBESITY
To explore the relationship between obesity levels and life expectancy trends, one must first define obesity, which is not as simple as it might appear, and then track trends in obesity in the various countries under study.
It then becomes possible to look for correlations between those trends and the varying trends in life expectancy.
Body Mass Index and Weight Categories
The standard way of assessing a person’s weight relative to height is with body mass index (BMI), defined as a person’s weight in kilograms divided by the square of the person’s height measured in meters. Thus, a person who weighs 75 kilograms (165 pounds) and is 1.75 meters high (5 feet, 9 inches) has a BMI of 24.5.
According to the World Health Organization (2006), a person is of normal weight if he or she has a BMI between 18.50 and 24.99. A person with a BMI of 25 or more is considered overweight, while anyone with a BMI of 30 or more is considered obese. Obesity is further subdivided into Class 1 (30–34.99), Class 2 (35–39.99), and Class 3 (40 and above). For instance, a person who is 1.6 meters (5 feet, 3 inches) tall and weighs 77 kilograms (169 pounds) has a BMI of slightly more than 30, or is borderline obese.
BMI is the most widely used measure for determining obesity mainly because it is convenient. It is easy and straightforward to obtain a person’s height and weight and then apply the BMI formula. Other measures of obesity, such as percentage of body fat, are generally much more difficult to determine accurately. However, errors are not uncommon in self-reports of height and weight (Ezzati et al., 2006). Balancing out its convenience, moreover, is the fact that BMI is no more than a rough measure of how fat a person is. People who are particularly muscular will have a high BMI, for instance, even if they have very low body fat. Furthermore, there is evidence that not all fat is created equal and that certain fat distributions—such as intra-abdominal fat around the waist area—are unhealthier than others (Bergman et al., 2006; Snijder et al., 2006). Thus, many studies use other measures, such as waist-to-hip ratio or body fat percentage, to gauge health risks. Still, BMI has the advantage that, because it is so convenient, far more data—particularly historical and international data—exist for it than for any of the other measures. For that reason, this chapter focuses on BMI data while noting the limitations of relying strictly on these data and describing other relevant data where they exist.
Obesity Trends in the United States and Other Countries
One of the most striking health-related trends in the United States over the past 50 years has been the rise of obesity. As can be seen in Figure 3-1, in 1960−1962 only 10.7 percent of adult males and 15.8 percent of adult females in the country were obese. By 2007−2008, those numbers had risen to 32.2 and 35.5 percent, respectively. For both sexes, the growth in obesity
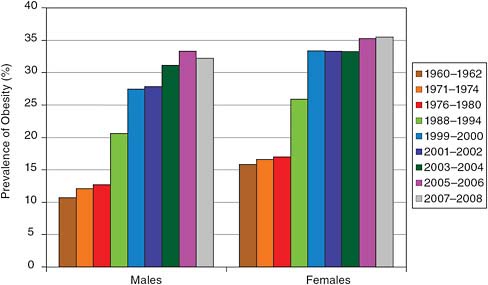
FIGURE 3-1 Age-adjusted percentage of obesity in Americans aged 20+, by gender.
SOURCE: Data from Flegal et al. (2002, 2010).
was relatively slow in the 1960s and 1970s, increased sharply in the 1980s and 1990s, and then slowed in recent years.
The same pattern has played out in most other high-income countries, including those studied here, but it has generally been less pronounced than in the United States. Figure 3-2 displays the adult obesity rates for the 10 high-income countries under study. As can be seen from the top panel in the figure, U.S. men have had the highest rate of obesity among those countries for the past 30 years. Around 1978 (the data were collected between 1976 and 1980), the rate of obesity among U.S. men was about 13 percent. Obesity rates in the other countries at that time ranged from 0.8 percent in Japan to about 12 percent in Canada, with most countries at 5 to 10 percent.
Twenty-five years later, in 2003, the rate of obesity among U.S. men had jumped to 32 percent—an increase of nearly 150 percent above the 1978 rate. During the same quarter century, adult male obesity rates were also increasing in the other high-income countries, so that by 2003 only Japan and Italy had rates below 10 percent. Canada and England, at 23 percent, had the highest rates after the United States.
The pattern among adult women was similar. Around 1978, some 17 percent of U.S. women were obese, a figure that grew to 35 percent by 2003. The obesity rate among Japanese women remained below 5 percent, the rate among Italian women stayed below 10 percent, and the rates for women in the remaining countries were between 10 and 25 percent in 2003.
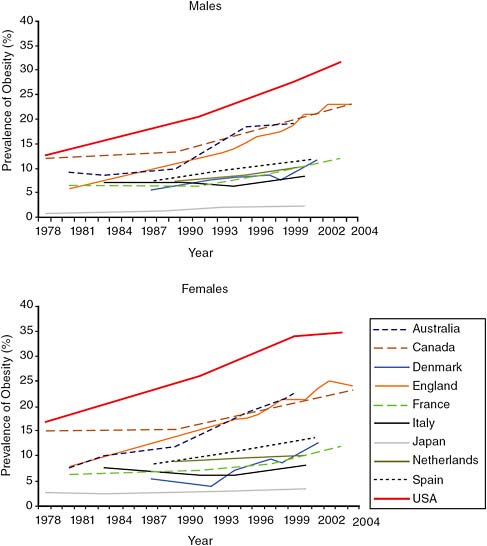
FIGURE 3-2 Trends in prevalence of adult obesity by country and gender, 1978–2004.
NOTE: Age ranges vary. The majority of data sources were designed to be nationally representative (with the exception of data before 1999 in Australia and all data from the Netherlands, which were collected in major cities only). Where surveys spanned multiple years, prevalence estimates shown are based on the midpoint of survey collection.
SOURCE: Alley et al. (2010, Figure 6-1). Reproduced with permission.
In short, most of the high-income countries studied here have experienced a similar trend of increasing obesity among adult men and women, but the United States is ahead of the curve. The rates of obesity in the United States during the late 1970s were already higher than the rates in most of the other high-income countries today. In general, obesity rates in the United States appear to be ahead of those in the other countries by 15 to 25 years. If the obesity rates in the United States are indeed leveling off, it is possible that these other countries may catch up sometime in the next few decades, but for now the United States is far ahead of the other high-income countries.
The data on obesity rates for older adults are not as complete as they are for all adults, but as can be seen in Figure 3-3, the existing data show similar trends for this group. In particular, the rates in the United States are again higher than those in the other high-income countries, although the divergence is not as great. In the United States, the rate of obesity among men aged 50–59 grew from 14 percent in 1978 to 35 percent in 2003, while the rate among women grew from 23 to 38 percent. Again, the Japanese have the lowest rates of obesity for older men and women—less than 5 percent—while England and Australia are the closest to the United States.
Of interest, Denmark and the Netherlands—the two other countries with less-than-expected growth in life expectancy over the past 25 years—have obesity rates much lower than those in the United States. In 2002, only 18 percent of older Dutch men were obese, compared with 35 percent of older U.S. men; 28 percent of older Dutch women were obese, compared with 38 percent of older U.S. women. Danish men aged 50+ have approximately the same level of obesity as men in the Netherlands and the same level as Danish women (18 percent) (Crimmins et al., 2010).
RELATIONSHIP AMONG OBESITY, HEALTH, AND MORTALITY
Obesity is known to be harmful in a number of interrelated ways: it is associated with various diseases, it leads to different types of disability, and it shortens lives. To identify what role, if any, obesity has played in causing the divergent trends in life expectancy, it is necessary to distinguish these various effects and to examine them individually to the extent possible.
Disease and Disability
Numerous studies have documented the ways in which being overweight or obese damages health. The most common effects include diabetes; high blood pressure; heart disease; gallstones; and certain cancers, such as colorectal cancer, breast cancer in women, endometrial cancer, and cancers of the kidney, pancreas, liver, and gallbladder (Hu, 2008). Type 2 diabetes
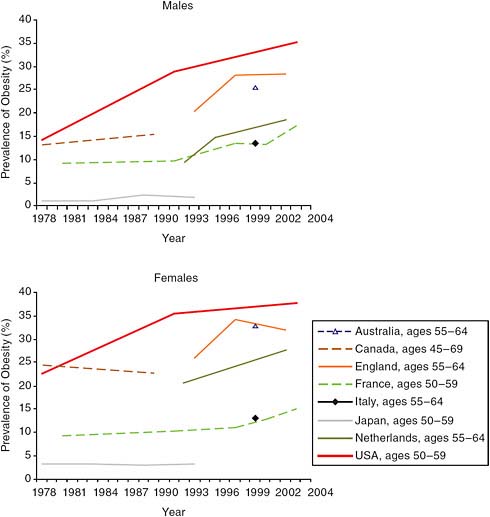
FIGURE 3-3 Trends in obesity prevalence by country and gender: Older adults, 1978–2004.
NOTE: Data are nationally representative unless otherwise noted. Australia: measured height and weight (Cameron et al., 2003); Canada: self-reported height and weight (Torrance et al., 2002); England: measured height and weight (Rennie and Jebb, 2005); France: self-reported height and weight (Charles et al., 2008; Maillard et al., 1999); Italy: self-reported height and weight (Calza et al., 2008); Japan: measured height and weight (Yoshiike et al., 2002); Netherlands: measured height and weight from three cities (Schokker et al., 2007); United States: measured height and weight (Flegal et al., 2002) and author analysis of National Health and Nutrition Examination Survey (NHANES) data.
SOURCE: Alley et al. (2010, Figure 6-2). Reproduced with permission.
is particularly sensitive to body weight. It is very rare in people of normal weight, and the risk for developing it increases rapidly with increasing BMI. The risks of developing high blood pressure, coronary heart disease, and gallstones also grow as BMI increases, as do the risks for the various obesity-related cancers, but none of these conditions is as sensitive to BMI as diabetes (Hu, 2008).
The relationship between obesity and various diseases is also apparent in international comparisons. In analyzing the 10 high-income countries considered in this study, Crimmins and colleagues (2010) found a clear relationship between national levels of obesity and national rates of diabetes and heart disease among people over 50. Those countries with the highest rates of obesity were those hardest hit by diabetes and heart disease in older adults.
Obesity in older adults is also associated with various types of disabilities. The excess weight itself can make it difficult to perform certain activities, such as climbing stairs or walking for long distances, and it frequently leads to joint problems. These limitations are often exacerbated by the various chronic diseases associated with obesity—diabetes, high blood pressure, heart disease, gallstones, and others—which lead to their own characteristic disabilities. When Crimmins and colleagues compared the rates of obesity in people over 50 in various high-income countries with the percentage reporting disabilities, they found a strong relationship, with the countries with higher rates of obesity also having greater numbers of older adults with disabilities (Crimmins et al., 2010, Table 3-9).
Mortality
The effect of being overweight (i.e., having a BMI between 25 and 29) or obese (i.e., having a BMI over 30) on the risk of dying has been an area of rather contentious debate. Some well-publicized studies have claimed, for instance, that hundreds of thousands of Americans die prematurely each year because they are overweight or obese. In 1999, Allison and colleagues calculated that in 1991, between 280,000 and 325,000 deaths of U.S. adults were due to overweight and obesity (Allison et al., 1999a, 1999b). Six years later, Mokdad and colleagues announced that overweight and obesity (together with physical inactivity) had been responsible for 365,000 excess deaths among U.S. adults in 2000, making it the second-leading preventable cause of death in the United States, behind only smoking (Mokdad et al., 2005).
Those numbers, which were publicized widely, now appear likely to have been major overestimates. For example, one study published shortly after the Mokdad et al. (2005) article that used more recent data and took into account how mortality risk varies by age yielded much smaller num
bers (Flegal et al., 2005). According to that study, obesity, defined as a BMI of 30 or above, caused approximately 112,000 excess deaths among U.S. adults in 2000, while being overweight had a protective effect and led to 86,000 fewer deaths than would have been expected if all of those people had had a BMI in the normal range. The net result was that overweight and obesity together resulted in an excess of 26,000 deaths in 2000, the authors concluded, which was less than a tenth of the earlier estimate.
Complicating the discussion of weight and mortality is the fact that as BMI decreases below normal range, mortality increases. Virtually all studies find that the curve of mortality risk and BMI is U-shaped or J-shaped, with mortality somewhat higher at the low- and high-BMI ends (e.g., Flegal et al., 2005; Prospective Studies Collaboration, 2009). However, the shape of the relationship between BMI and mortality may vary depending on the sample examined and how other variables are taken into account. Smoking is an example of another health behavior that is related to obesity. It is usually related to lower weight, and giving up smoking can produce weight gain. When only people who have never smoked are considered, there is modest elevation of mortality risk at low BMI, minimal risk for BMIs between 23.5 and 25, and then sharply increasing risk as BMI rises (Alley et al., 2010).
A recent analysis looked carefully at the mortality risk and years of life lost due to different levels of obesity, breaking the numbers down by age, gender, race, and smoking status (Finkelstein et al., 2010). In general, the authors found that being overweight does not increase mortality risk and sometimes decreases it, although the effect usually is not statistically significant either way. The excess mortality risk is noticeable for Class 1 obesity and rises sharply as BMI increases. Obesity has a greater effect on years of life lost for men than for women and for whites than for blacks, and its effects are similar for smokers and nonsmokers, with smoking adding greatly to the mortality risk for all groups. Thus, while an 18-year-old white male who is of normal weight and does not smoke can expect to live to 81, the life expectancy of an 18-year-old white male who smokes and is Class 3 obese is only 60 years—a decrease in life expectancy of 21 years, approximately 10 years of which can be attributed to obesity.
Alley and colleagues surveyed the body of research on weight and mortality and drew some general conclusions (Alley et al., 2010). First, in the general population, Class 1 obesity is correlated with a small increase in overall mortality, and the higher the BMI, the greater is the elevation. Generally speaking, falling in the overweight category (BMI between 25 and 30) does not increase one’s chances of dying from all causes, although being overweight is associated with a slightly increased risk of dying from coronary heart disease. Again, the higher the BMI, the greater is the mortality risk. According to one international study, each increase of 5 units in BMI results in a 30 percent increase in overall mortality (Prospective Studies
Collaboration, 2009). In short, the authors concluded, obesity does increase mortality risk; the increase is relatively modest for Class 1 obesity (BMI between 30 and 35) but is significantly greater for those with a BMI above 40. The authors also found that the relationship between BMI and mortality risk changes with age. BMI has its largest effect on the risk of mortality for adults under 50, and the correlation between BMI and mortality decreases beyond that age. The older adults at greatest risk of dying are those at the extreme ends of the BMI spectrum—either extremely underweight or extremely overweight. Thus at older ages, the curve relating mortality risk to BMI changes in shape from a J to a U.
Limitations of BMI in Older Adults
Any study that seeks to understand the relationship between BMI and mortality in older adults must deal with various complications that are particularly relevant in this age group (Hu, 2008). For one thing, BMI is a less accurate estimate of body fat in older adults than in others because of the differential loss of muscle and lean body mass that accompanies aging. A sedentary older adult may lose half a pound of muscle mass per year, or 5 pounds a decade, significantly altering the meaning of BMI.
More important, older adults also are more likely to have various existing diseases and to have experienced illness-related weight loss, either of which can confound the relationship between weight and mortality risk. In particular, a number of chronic diseases associated with weight change, such as diabetes and cardiovascular disease, are associated with both weight loss and mortality in older adults (Alley et al., 2010). For these diseases, lower BMI is generally associated with higher mortality, while higher BMI often carries no greater mortality risk than normal BMI.
To sidestep these problems, some studies have looked at BMI earlier in life as a predictor of mortality. In this way, one can avoid many of the complications caused by weight loss due to obesity-related chronic diseases. Applying this approach does indeed change the shape of the risk curve, with risks at low BMIs decreasing and risks at higher BMIs increasing. One study that looked at mortality versus BMI at age 50 found that every category of BMI above 26.5 was associated with an increased risk of mortality (Adams et al., 2006). Other approaches include focusing on the waist–hip ratio or abdominal adiposity instead of BMI, as both of these measures have been shown to be correlated with mortality risk in older adults (Hu, 2008).
OBESITY AND LIFE EXPECTANCY TRENDS
Given that obesity increases mortality in at least some groups, it makes sense to ask whether this obesity–mortality connection combined with the
higher rates of obesity in the United States might explain at least part of this country’s lower-than-expected life expectancy. The answer is complicated.
Country-to-Country Comparisons
One place to look is the association between obesity and life expectancy at the national level. Alley and colleagues collected data on both obesity rates and life expectancy for the 10 high-income countries in this study (Alley et al., 2010). The results are shown in Table 3-1. Among males, the life expectancy at 50 in the United States was eighth highest out of the 10, ahead of only the Netherlands and Denmark, and the rate of obesity among U.S. males was the highest of any of the countries. On the other hand,
TABLE 3-1 Life Expectancy at Age 50 and Rate of Obesity, by Country and Gender, 2004
|
Country |
Life Expectancy at Age 50 (e50), 2006a |
Change in e50, 1980–2006c |
Adult Obesity (%)b |
Obesity Change/Yr: 1978–2004 |
|
|
Males |
|||
|
Australia |
31.5 |
6.6 |
19.3 |
0.54 |
|
Canada |
30.7 |
5.0 |
22.9 |
0.42 |
|
Denmark |
28.2 |
3.5 |
11.8 |
0.44 |
|
Englandc |
29.7 |
5.7 |
23 |
0.71 |
|
France |
29.9 |
5.1 |
12 |
0.24 |
|
Italy |
30.6 |
5.9 |
8.3 |
0.07 |
|
Japan |
31.0 |
4.4 |
2.3 |
0.07 |
|
Netherlands |
29.4 |
4.0 |
10.4 |
0.32 |
|
Spain |
29.9 |
3.7 |
11.9 |
0.18 |
|
United States |
29.2 |
4.3 |
31.7 |
0.76 |
|
Females |
||||
|
Australia |
35.3 |
4.6 |
22.2 |
0.76 |
|
Canada |
34.5 |
3.2 |
23.2 |
0.58 |
|
Denmark |
31.9 |
2.1 |
12.5 |
0.51 |
|
Englanda |
33.1 |
4.0 |
24 |
0.67 |
|
France |
35.7 |
4.5 |
12 |
0.25 |
|
Italy |
35.2 |
5.2 |
8.1 |
0.03 |
|
Japan |
37.1 |
6.3 |
3.4 |
0.01 |
|
Netherlands |
33.3 |
2.0 |
10.1 |
0.10 |
|
Spain |
35.4 |
4.4 |
13.6 |
0.37 |
|
United States |
33.0 |
2.4 |
34.6 |
0.70 |
|
aData from Glei et al. (2010, Table 2-1). bBased on most recent observations. cMortality is for England and Wales, obesity for England. SOURCE: Alley et al. (2010, Figure 1); Glei et al. (2010, Table 2-1). |
||||
Denmark and the Netherlands had obesity rates that were not particularly high relative to the other countries, ranking seventh and eighth among the 10. Conversely, among the countries with the highest life expectancy at 50 among males—Australia, Japan, Italy, and Canada—two (Japan and Italy) had the lowest rates of obesity, and two (Australia and Canada) had rates among the highest.
The picture for females is similar. The lowest life expectancies were in Denmark, the United States, the Netherlands, and England and Wales. Among those countries, two (the United States and England) had the highest rates of obesity among the 10 countries, while the other two (Denmark and the Netherlands) had among the lowest rates. Comparing rates of change in obesity with the rise in life expectancy from 1980 to 2004 produces a similar lack of pattern. For example, both American and Australian men and women had rapid gains in obesity, but life expectancy improvements were quite slow in the United States and rapid in Australia. In short, these sorts of macro-level comparisons do not indicate an effect of obesity rates at the national level on the increase in life expectancy over the past several decades. It is helpful to look more closely at the problem by examining the mortality rates associated with obesity at an individual level and applying them to the BMI distributions of the populations under consideration.
Calculating the Effect of Obesity on Life Expectancy
Most calculations estimating the effect of obesity on life expectancy have been performed with respect to individuals rather than populations. Using data from the National Health and Nutrition Examination Survey (NHANES), Fontaine and colleagues calculated the number of years of life lost for various BMI levels relative to a BMI of 24 (Fontaine et al., 2003), assuming that a person remained in his or her BMI category for life. They found, for example, that for white males, having a BMI between 30 and 35 shortened life by an average of 0–1 years, having a BMI between 35 and 40 shortened life by 1–3 years, and having a BMI above 40 shortened life by 1–7 years. The numbers were similar for white women but not for black men and women; for those in the latter groups, obesity shortened life only among younger people and those with a very high BMI.
Estimating the contribution of differences in obesity to the life expectancy gap between the United States and other countries requires an attributable risk approach that combines BMI distributions in different countries with sets of mortality risk associated with BMI. Useful for this purpose are estimates by Preston and Stokes (2011), who perform primary analyses of survey data to identify the distribution of BMI by age and gender in 16 countries, including the United States and 7 of the 9 comparison countries studied. The United States has the highest proportion obese of any popula-
tion considered. The detailed BMI distributions are combined with three alternative sets of mortality risk by BMI to estimate the proportion of deaths attributable to above-optimal weight, by age and gender. These estimates are then converted into their implications for longevity. It should be noted that the use of alternative measures of obesity yields results on the number of deaths attributable to obesity that are not significantly different from those obtained using BMI (Flegal and Graubard, 2009).
The baseline analysis of Preston and Stokes uses the largest, longest, and most internationally diverse collection of obesity risks, the Prospective Studies Collaboration (PSC) (2009). The mean date of death in this study is 1986. Using this set of risks, which are adjusted for smoking behavior, the authors estimate that U.S. life expectancy at age 50 in 2006 was reduced by 1.28 years for women and by 1.61 years for men as a result of obesity. Because the proportions obese are higher in the United States than elsewhere, especially at the upper extremes of BMI, these hypothetical changes from eliminating obesity are substantially larger than those in any other country.
As noted above, there is suggestive evidence that the mortality risk associated with obesity has been declining in the United States (Flegal et al., 2005; Mehta and Chang, 2010). Such a decline may result from improvements in the treatment of cardiovascular disease, the main disease through which obesity affects mortality (Gregg et al., 2005). To account for this possibility, Preston and Stokes introduce two sets of relative risks recorded more recently in the United States. One set is adapted from Adams and colleagues (2006). These data were derived from a large study of 527,000 enrollees in a National Institutes of Health (NIH)–AARP Diet and Health Study that was conducted in six U.S. states and two cities. Enrollees were followed from enrollment in 1995–1996 through the end of 2005. Relative risks are adjusted for smoking, social status, and physical activity. The second alternative set of relative risks is derived from NHANES III, linked to death certificate data (Mehta and Chang, 2010). Initial enrollment at ages 50–69 occurred during 1988 to 1994; individuals were followed into the National Death Index through 2006. The sample size was 4,375 individuals, and the mean follow-up time was 13.3 years. Relative risks are adjusted for smoking and socioeconomic status. Relative to those of normal weight (BMI between 18.5 and 24.9), overweight and obese Class 1 people have a 1–6 percent increase in risk; for those with a BMI of 35 or greater, the excess risk in this study is 63 percent.
In every country for both genders, use of these alternative sets of relative risks reduces the estimated gain in life expectancy from eliminating obesity. Using the Adams and colleagues (2006) set, the gain in life expectancy at 50 for females in the United States is 0.71 years and for males is 0.52 years. The gains with the Mehta and Chang set are similar, at 0.61 and 0.64 years, respectively. These remain the largest gains for any country.
Discussion
Since life expectancy at age 50 in the United States would increase significantly more than in other countries through the hypothetical elimination of obesity, the U.S. longevity shortfall would be reduced and in some cases eliminated. U.S. life expectancy for women is 1.37 years lower than the mean in 12 other countries with higher life expectancies. Based on the PSC risk factors, U.S. female life expectancy would be an estimated 0.80 years lower than this mean without obesity, so that obesity would account for an average of 41 percent of the gap. For men, the equivalent percentage of the difference in life expectancy accounted for by obesity, relative to 10 countries with higher life expectancies, is 67 percent.
These effects are much larger than those based on the Adams et al. or Mehta and Chang risk sets. The mean life expectancy gap for the 12 countries with higher life expectancies is reduced by 29 percent for women using Adams’ risks to account for the effects of obesity and by 22 percent using Mehta and Chang’s. For men, the equivalent reductions are 32 percent and 29 percent respectively.
Thus, differences in the prevalence of obesity continue to explain about 20–35 percent of the shortfall in U.S. life expectancy relative to countries with superior levels, even when one uses much lower sets of obesity risks. The risks derived from the studies of Adams and colleagues (2006) and Mehta and Chang (2010) have the advantage of pertaining to a later period, on average, than those of the PSC. This period is closer to the time when the levels of both obesity and mortality are recorded in the various countries and when attributable risks are modeled. These studies also control for socioeconomic status, indexed by education and income, in their analyses of the impact of obesity on mortality, unlike the analysis based on risks in the PSC. Using data from the Health and Retirement Study, Mehta and Chang (2009) show that controlling for educational attainment reduces estimated obesity risks by 20–50 percent. The panel is inclined to believe that the two sets of relative risks recorded more recently in the United States yield more reliable estimates of the impact of obesity on life expectancy comparisons than those obtained using the PSC risks. Even using the sets of lower obesity risks, however, it appears that differences in obesity account for a fifth to a third of the shortfall in life expectancy in the United States relative to other countries. Obesity appears to be an important part of the explanation of the current U.S. shortfall in life expectancy, but uncertainty remains as to its role in explaining the divergence.


