
1
Difference Between Life Expectancy in the United States and Other High-Income Countries
Great advances have occurred in life expectancy in the United States over the last century. Improvements in the prevention and control of major childhood infectious diseases and in nutrition, housing, hygiene, and medical care resulted in an increase in life expectancy of about 4 years each decade throughout the first half of the 20th century. Advances in medical technology, particularly in relation to the treatment of heart disease and stroke, along with healthier lifestyles, improvements in access to health care, and better general overall health before age 65, enabled continued improvements in life expectancy throughout the second half of the 20th century (Fried, 2000). By June 2010, when the National Center for Health Statistics (NCHS) released its most recent life tables for the United States—for 2006—the average life expectancy at birth was 75.1 years for men and 80.2 years for women, compared with just 47.9 years for men and 50.7 years for women for the period 1900-1902 (Arias, 2010).
This pattern of rising life expectancy has been reproduced in many other high-income countries around the world (Kannisto, 1994; Kannisto et al., 1994; Rau et al., 2008). Between 1950 and 1995, the mortality rate at each age declined at a roughly constant pace in Canada, France, Germany, Italy, Japan, the United Kingdom, and the United States (Tuljapurkar et al., 2000). In Japan, life expectancy in 1950 was 57.6 years for men and 60.9 years for women; by 2007 it had jumped by more than 20 years, to 79.2 years for men and 86.0 years for women (see Table 1-1). Similarly, in France, life expectancy in 1950 was 63.4 years for men and 69.2 years for women and by 2007 had grown to 77.4 years for men and 84.4 years for women. And in Australia,
TABLE 1-1 Life Expectancy by Country
|
Country |
1950 |
1980 |
2007 |
||||||
|
e0 |
e50 |
e80 |
e0 |
e50 |
e80 |
e0 |
e50 |
e80 |
|
|
Women |
|
|
|
|
|
|
|
|
|
|
Australia |
71.75 |
26.64 |
6.45 |
78.18 |
30.68 |
8.06 |
83.78 |
35.24 |
10.00 |
|
Canada |
70.59 |
26.79 |
6.66 |
78.72 |
31.35 |
8.78 |
82.95 |
34.53 |
10.13 |
|
Denmark |
71.52 |
26.19 |
5.65 |
77.18 |
29.82 |
7.70 |
80.53 |
31.95 |
8.74 |
|
England and Wales |
71.31 |
26.38 |
6.05 |
76.76 |
29.29 |
7.46 |
81.73* |
33.31* |
9.25* |
|
France |
69.19 |
26.46 |
6.07 |
78.40 |
31.12 |
7.71 |
84.39 |
35.87 |
10.52 |
|
Japan |
60.90 |
23.91 |
5.45 |
78.75 |
30.82 |
7.28 |
85.98 |
37.26 |
11.40 |
|
Italy |
67.48 |
26.40 |
5.95 |
77.43 |
30.05 |
7.11 |
84.09* |
35.23* |
9.83* |
|
Netherlands |
72.59 |
26.92 |
6.00 |
79.14 |
31.31 |
8.04 |
81.89* |
33.31* |
8.92* |
|
Sweden |
72.44 |
26.48 |
5.72 |
78.85 |
30.91 |
7.67 |
82.95 |
34.10 |
9.23 |
|
United States |
71.02 |
26.55 |
6.88 |
77.48 |
30.56 |
8.58 |
80.78 |
33.06 |
9.82 |
|
Men |
|
|
|
|
|
|
|
|
|
|
Australia |
66.53 |
22.75 |
5.62 |
71.01 |
24.97 |
6.30 |
79.27 |
31.58 |
8.39 |
|
Canada |
66.16 |
23.93 |
5.93 |
71.60 |
25.69 |
6.83 |
78.35 |
30.75 |
8.40 |
|
Denmark |
69.10 |
25.06 |
5.45 |
71.17 |
24.78 |
6.25 |
76.13 |
28.45 |
7.24 |
|
England and Wales |
66.51 |
22.51 |
5.03 |
70.74 |
24.07 |
5.72 |
77.46* |
29.85* |
7.78* |
|
France |
63.43 |
22.49 |
5.08 |
70.16 |
24.79 |
6.09 |
77.43 |
30.03 |
8.24 |
|
Japan |
57.58 |
21.00 |
4.69 |
73.38 |
26.59 |
6.08 |
79.20 |
31.16 |
8.52 |
|
Italy |
63.99 |
24.23 |
5.44 |
70.68 |
24.66 |
5.83 |
78.62* |
30.58* |
7.90* |
|
Netherlands |
70.32 |
25.79 |
5.77 |
72.44 |
25.49 |
6.45 |
77.63* |
29.45* |
7.13* |
|
Sweden |
69.83 |
25.07 |
5.45 |
72.78 |
26.03 |
6.14 |
78.92 |
30.69 |
7.63 |
|
United States |
65.40 |
22.64 |
5.92 |
69.99 |
24.90 |
6.67 |
75.64 |
29.28 |
8.27 |
|
NOTE: e0 = life expectancy at birth; e50 = life expectancy at age 50; e80 = life expectancy at age 80. *Data are for 2006. SOURCE: Data from Human Mortality Database (http://www.mortality.org/ [accessed December 8, 2010]). |
|||||||||
life expectancy grew from 66.5 years for men and 71.8 years for women in 1950 to 79.3 years for men and 83.8 years for women in 2007.
Despite this broad similarity in patterns of increased life expectancy among high-income countries, gains in the United States over the more recent past—especially the last 25 years—have been below those achieved in many other high-income countries and significantly below those achieved in countries that have seen the greatest increases. Table 1-1 presents estimates of life expectancy at birth (e0), at age 50 (e50), and at age 80 (e80) taken from the Human Mortality Database for both men and women from ten different countries and provides a sense of the extent of the mortality differentials. In 1980, average life expectancy at age 50 for women in the United States was 30.6 years, the same as the average for the other nine countries shown in Table 1-1. By 2007, life expectancy at age 50 for women in the United States had increased 2.5 years to 33.1. But over the same time period, life expectancy at age 50 in Japan had increased 6.4 years; in Italy it had increased 5.2 years; and on average, for the other nine countries apart from the United States shown in Table 1-1, it had increased 3.9 years. (This pattern of U.S. improvement, but at a slower pace than that achieved in many other countries, is repeated throughout Table 1-1 for both men and women although the pattern is less pronounced for men than for women.) Consequently, the list of countries that has overtaken the United States with respect to life expectancy at birth has been growing, and the gap between the United States and the countries with the highest achieved life expectancies has been widening (see Figures 1-1 and 1-2). According to the United Nations’ Population Division, life expectancy at birth in the United States for both sexes combined for the period 2005–2010 ranked 28th in the world, just behind the United Kingdom, Korea, Luxembourg, and Malta but more than 2 years behind Australia, Canada, France, Iceland, Italy, Japan, and Switzerland (United Nations, 2009).
New life tables published by NCHS suggest that the extent of the U.S. disadvantage could be even greater than that suggested in Table 1-1.1 NCHS recently accepted that the prevalence of age misreporting at the oldest ages in U.S. census data is significant enough to lead to underestimated death rates at those ages. As a result, NCHS has revised the basic methodology used to calculate the U.S. life table, which now yields lower estimates of life expectancy at all ages (Arias et al., 2010). The most recent life table for the United States published by NCHS provides estimates of life expectancy at 50 in 2006 that are approximately 0.6 years lower for women and 0.5 years lower for men than the estimates provided in the Human Mortality Database (Arias et al., 2010).
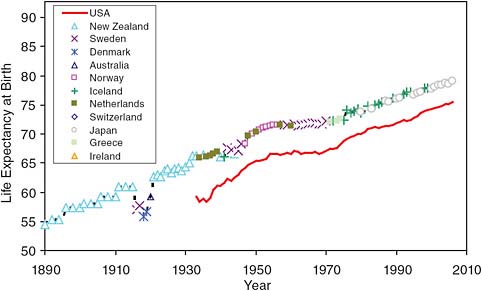
FIGURE 1-1 Trend in highest recorded level of male life expectancy achieved versus trend in life expectancy in the United States.
SOURCE: Data from Oeppen and Vaupel (2002) [Supplementary tables]; Human Mortality Database (http://www.mortality.org/ [accessed December 8, 2010]).
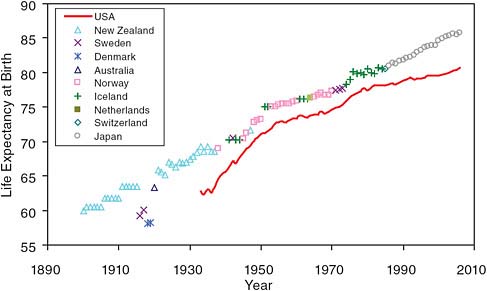
FIGURE 1-2 Trend in highest recorded level of female life expectancy achieved versus trend in life expectancy in the United States.
SOURCE: Data from Oeppen and Vaupel (2002) [Supplementary tables]; Human Mortality Database (http://www.mortality.org/ [accessed December 8, 2010]).
International comparisons of various measures of self-reported health and biological markers of disease reveal similar patterns of U.S. disadvantage. In 2006, Banks and colleagues reported that the U.S. population of late middle age was considerably less healthy than the equivalent English population. For every disease the authors studied, Americans across the socioeconomic distribution reported a higher disease burden: approximately 30 percent higher prevalence for lung disease and myocardial infarction, 60 percent higher for all heart disease and stroke, and 100 percent higher for diabetes (Banks et al., 2006). Furthermore, the design of the study strongly suggested that the American health disadvantage could not be explained simply by reference to problems associated with an inefficient health care system, the lack of universal health care coverage, or large racial and socioeconomic disparities in the United States. Moreover, subsequent analyses have found no significant reason to doubt the basic underlying finding that the burden of disease in America is much higher than that in many other countries (Avendano et al., 2009; Crimmins et al., 2008, 2010). The relatively poor performance of the United States with respect to achieved life expectancy in the recent past is perhaps all the more surprising in light of the fact that the United States spends far more on health care than any other nation in the world, both absolutely and as a percentage of gross national product.
Motivated by these concerns, the National Institute on Aging requested that the National Research Council convene a panel of leading experts to clarify patterns in the levels and trends in life expectancy across nations, to examine the evidence on competing explanations for the divergence among nations, and to identify strategic opportunities for health-related interventions to reduce this divergence. Specifically, the panel was charged with addressing three questions: What accounts for the different trends in mortality at older ages that have been observed in Organisation for Economic Co-operation and Development (OECD) countries? What are the likely implications of these trends for the future trajectory of mortality at older ages in the United States? What can be learned about modifiable risk factors from countries where mortality at older ages has improved most rapidly in the last quarter century?
In addressing its charge, the panel confronted a large and burgeoning theoretical and empirical literature encompassing contributions from virtually every field within the social and health sciences. To deal with this vast body of work, the panel commissioned a set of background papers, each dealing with a specific topic relevant to the panel’s charge.2 This report, which draws heavily on that set of background papers, provides a synthesis of the panel’s findings, analyses, conclusions, and recommendations.
DIVERGENT TRENDS IN LIFE EXPECTANCY
Origins of an Inquiry
Until the early 1990s, despite the accomplishments of certain high-income countries in achieving significant continued improvements in life expectancy at birth, there was considerable disagreement among gerontologists and demographers as to what the future might bring. On the one hand, pessimists believed that deaths above age 80 were due to problems associated with senescence and intractable aging processes. Consequently, increases in longevity beyond age 85 or so were unlikely to be achievable without fundamental biomedical breakthroughs that would affect those processes themselves (Fries, 1980; Lohman et al., 1992; Olshansky et al., 1990). On the other hand, optimists believed that continued improvements in life expectancy were to be expected and that the official population projections of the time were too conservative (see, for example, Ahlburg and Vaupel, 1990).
A lack of reliable and internationally comparable data initially limited demographers’ ability to study patterns of mortality and morbidity at advanced ages (Jeune and Vaupel, 1999). In the United States, for example, demographers have long been wary of using mortality data at older ages because of concerns about the quality of the data and the validity of age reporting (Coale and Kisker, 1986, 1990; Preston et al., 1999). The coverage of the U.S. civil registration system was incomplete until the mid-1930s, and misspecification of age, particularly at the oldest ages, has been a persistent problem in the U.S. data, particularly for the African American population (Manton et al., 1979; Preston and Elo, 2006; Preston et al., 1996, 1999, 2003).
Once reliable data on mortality at advanced ages began to be assembled and analyzed, demographers discovered that levels of mortality at advanced ages in many countries had declined significantly between the 1950s and the 1980s (see, for example, Kannisto, 1994; Kannisto et al., 1994; Vaupel, 1997). Rather than slowing down, which is what might be expected if life expectancy were approaching some biological or practical limit, the rate of mortality improvement showed little relationship to the level of old-age mortality (Kannisto et al., 1994; Oeppen and Vaupel, 2002; Rau et al., 2008).
Although the debate on the limit to human life expectancy continues (see Christensen et al., 2009, 2010b; Olshansky and Carnes, 2010; Olshansky et al., 2009), the empirical observations outlined above have, to some degree, deflected demographers’ attention away from the debate over the limit to life expectancy and toward a new focus on the heterogeneity of mortality experience among countries. In 1995, for example, Manton and Vaupel assembled evidence showing that, for people aged 80 and above, life expectancy was greater in the United States than it was in Sweden, France, England, or Japan, at least until 1987 (Manton and Vaupel, 1995). Similarly, Janssen and
colleagues reported a large degree of heterogeneity in the pace of mortality decline at old ages among various European countries (Janssen et al., 2004, 2007). While mortality declines were strong in France and England and Wales in the 1950s and 1960s, the authors found modest or no mortality declines in the Nordic countries. In 2006, Meslé and Vallin presented evidence showing that trends in female old-age mortality in the United States and the Netherlands had diverged from those in Japan and France in the period since 1984 (Meslé and Vallin, 2006). Finally, Rau and colleagues (2008) identified Denmark, the Netherlands, Norway, and the United States as the countries with the smallest mortality improvements. The United States, once a leader in longevity, particularly with respect to mortality at the oldest ages, has been falling further and further behind other countries (Rau et al., 2008).
To examine trends in life expectancy, the panel chose to rely on data available from the Human Mortality Database (http://www.mortality.org [accessed December 8, 2010]). This database, established in 2000 as a collaborative research project of teams of scientists at the University of California, Berkeley, and the Max Planck Institute for Demographic Research (MPIDR) in Rostock, Germany, contains raw data and original calculations of death rates and life tables for national populations by single year of age and single year of time. This chapter presents the panel’s analysis of data from 22 countries for which the data were considered to be of sufficiently high quality.3 This analysis provides a broader perspective than much of the report, which focuses on a group of 10 countries.
Gender Differences in Trends in Life Expectancy
Women on average live longer than men, so it is natural to explore the extent to which any improvements in life expectancy among countries vary by gender. Indeed, this is the focus of the above-cited paper by Meslé and Vallin (2006), which contrasts improvements in female old-age mortality in the United States and the Netherlands with those in Japan and France. More recently, however, other authors have emphasized the importance of looking at men as well (see, for example, Murray and Frenk, 2010, who point out the relatively poor performance in life expectancy for U.S. men aged 15-60 compared with Australian and Swedish men of similar ages).
The panel examined trends in life expectancy at birth by year for men and women in the United States and compared them with trends for 21 other high-income countries with good data (see Figures 1-3 and 1-4). The analysis was restricted to the recent past, defined by the panel as the period 1980 to 2006. For U.S. men (see Figure 1-3), life expectancy at birth increased by 5.5 years over this 27-year period, equivalent to 2.04 years per decade. While this is a significant achievement, it is less than the average rate of change for the other 21 countries shown in the figure. Consequently, the series of dots representing the progress of U.S. men in the figure can be seen as both rising absolutely and falling relatively. The story with regard to U.S. women is similar (see Figure 1-4): between 1980 and 2006, the increase in life expectancy at birth for U.S. women was only slightly more than 60 percent of what was achieved, on average, in the same period in the other 21 countries. Thus as with U.S. men, life expectancy at birth for U.S. women is rising in absolute terms but falling relative to other countries.
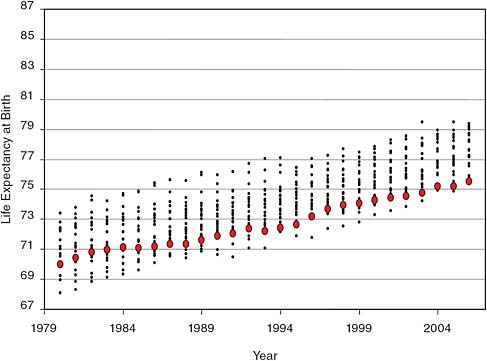
FIGURE 1-3 U.S. male life expectancy at birth relative to that for selected OECD countries.
NOTE: Each dot represents the level of life expectancy in a particular country. The large circle represents the position of the United States each year.
SOURCE: Data from Human Mortality Database (http://www.mortality.org/ [accessed December 8, 2010]).
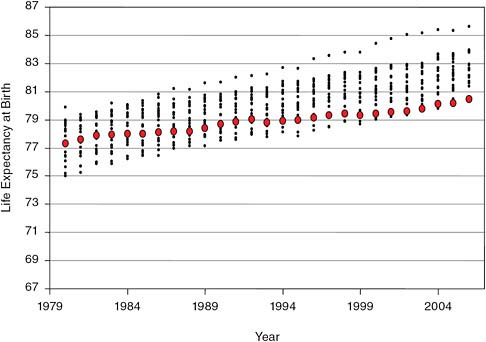
FIGURE 1-4 U.S. female life expectancy at birth relative to that for selected OECD countries.
NOTE: Each dot represents the level of life expectancy in a particular country. The large circle represents the position of the United States each year.
SOURCE: Data from Human Mortality Database (http://www.mortality.org/ [accessed December 8, 2010]).
Age Group Contributions to Life Expectancy Trends
In the first half of the 20th century, life expectancy at birth rose dramatically as a consequence of prevention and control of major childhood infectious diseases, while gains in life expectancy above age 65 were considerably more modest. In contrast, during the second half of the 20th century and continuing over the first decade of the 21st century, improvements in life expectancy are usually attributed to advances in medical technology—particularly in relation to the treatment of chronic diseases, especially heart disease and stroke—along with healthier lifestyles, improved access to health care, and better general overall health after age 65 (see, for example, Fried, 2000). Consequently, the latter half of the 20th century saw smaller gains in life expectancy from mortality decline at younger ages but larger gains in life expectancy above age 65.
The panel considered the extent to which the patterns of divergence in life expectancy among countries shown in Figures 1-3 and 1-4 are a function
of differential improvements across different stages of the life course. Figures 1-5 to 1-8 divide the comparison of the experience of men and women in the United States and of men and women in the other 21 countries into two stages of the life course, showing the probability of survival up to age 50 (see Figures 1-5 and 1-6) and life expectancy beyond age 50 (see Figures 1-7 and 1-8). The divergence of experience between the United States and the other countries is clear both before and after age 50.
For men, improvements in survival can be seen in both parts of the life course, although the improvements have been very small below age 50 in the United States. The comparable data for women show a starker contrast between the United States and the other 21 countries. Figure 1-6 shows that over the past 10 years, only the United States has failed to make significant improvements in the probability of survival up to age 50 for women. Once again, while there is a divergence of experience between the United States and the other countries, the figure shows only a small relative decline in the rank of the United States—all that is possible given that it already had one of the worst records. In contrast, Figure 1-8 illustrates the dramatic decline in international ranking for life expectancy among U.S. women at age 50 during the recent past, due to slower progress in reducing adult female
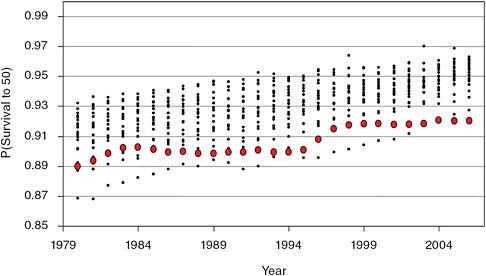
FIGURE 1-5 Probability of survival to age 50 among men in the United States and selected OECD countries.
NOTE: Each dot represents the level of life expectancy in a particular country. The large circle represents the position of the United States each year.
SOURCE: Data from Human Mortality Database (http://www.mortality.org/ [accessed December 8, 2010]).
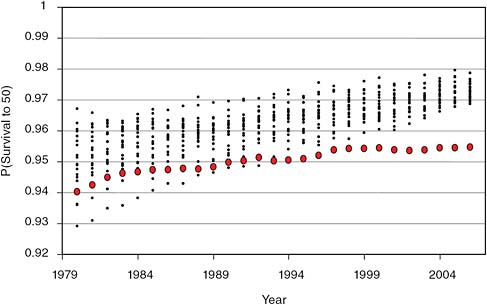
FIGURE 1-6 Probability of survival to age 50 among women in the United States and selected OECD countries.
NOTE: Each dot represents the level of life expectancy in a particular country. The large circle represents the position of the United States each year.
SOURCE: Data from Human Mortality Database (http://www.mortality.org/ [accessed December 8, 2010]).
mortality. In 1980, the United States was ranked 11th on this measure; by 1990 it had fallen to 13th and by 2006 had dropped to 21st. During that time, the difference in life expectancy among women at age 50 between the United States and the highest-ranking country rose from 1.5 years in 1980 to 2.0 years in 1990, 4.1 years in 2000, and 4.2 years in 2007.
Mortality trends below age 50 provide useful background. However, because 94 percent of newborns in the United States now survive to age 50, variation in life expectancy at birth is dominated by what happens above age 50. For this reason, the panel chose to focus on mortality above age 50 and to rely heavily on the summary indicator of life expectancy at age 50: the expected number of additional years to be lived by someone who survives to age 50.
Variation in Trajectories of Mortality at Older Ages
It has long been observed that mortality rates in humans tend to rise exponentially throughout most of the adult age range, although the increase in the risk of death has been shown to decelerate among the oldest old
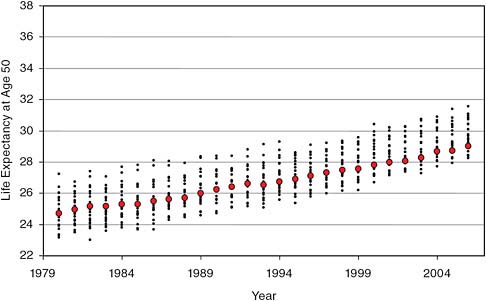
FIGURE 1-7 Life expectancy at age 50 for men in the United States and selected OECD countries.
NOTE: Each dot represents the level of life expectancy in a particular country. The large circle represents the position of the United States each year.
SOURCE: Data from Human Mortality Database (http://www.mortality.org/ [accessed December 8, 2010]).
(Vaupel et al., 1998). How similar, then, should one expect the pattern of survival to be at older ages between one country and another? And to what extent has the pattern of improvement in survival in the United States been different from that in other countries at various ages above 50? To date this topic has received very little attention.
Figures 1-9 and 1-10 show the variation over time in the probability of dying in one year for adults aged 55 (1q55), 65 (1q65), 75 (1q75), and 85 (1q85) in the United States versus the 21 other countries over time. Relative to men in the other 21 countries, U.S. men have a higher mortality risk at the younger older ages (i.e., ages 55 and 65), typical mortality risk at age 75, and much lower mortality risk at age 85 (see Figure 1-9).4 Similarly, relative to women in the other 21 countries, U.S. women have relatively high mortality rates at the younger older ages but compare quite favorably
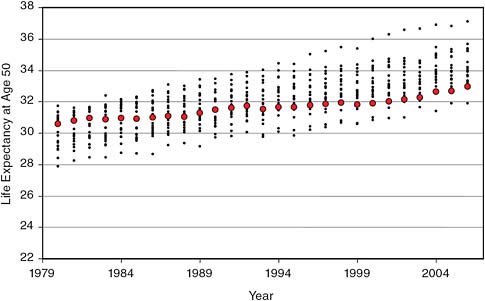
FIGURE 1-8 Life expectancy at age 50 for women in the United States and selected OECD countries.
NOTE: Each dot represents the level of life expectancy in a particular country. The large circle represents the position of the United States each year.
SOURCE: Data from Human Mortality Database (http://www.mortality.org/ [accessed December 8, 2010]).
at age 85 and above (see Figure 1-10). The sharp decline in the rank of U.S. women at age 75 but not at age 85 or 95 (not shown) over the past 25 years suggests important cohort patterns may underlie these mortality trends.5
Trailblazers Versus Stragglers
The panel considered whether there are countries other than the United States whose mortality experience over the recent past might provide important clues as to factors that can explain their own relatively poor performance and that of the United States. Since the collapse of communism in 1989, for example, most countries of the former Soviet Union have shared a common pattern of worsening mortality (Shkolnikov et al., 2004). The crisis has been particularly severe in Russia, where excessive alcohol intake has been shown to be an important determinant of premature male mortality (Zaridze et al., 2009a, 2009b).
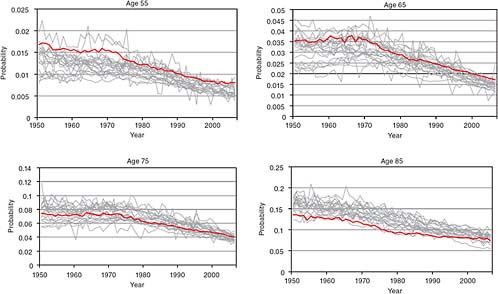
FIGURE 1-9 Mortality rates at ages 55, 65, 75, and 85 for men in the United States and selected OECD countries.
SOURCE: Data from Human Mortality Database (http://www.mortality.org/ [accessed December 8, 2010]).
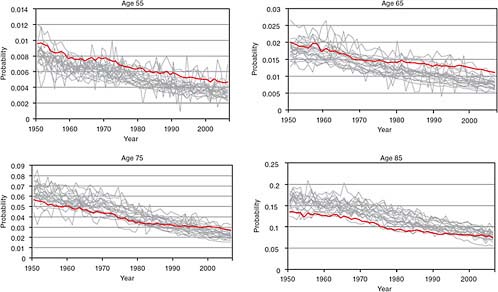
FIGURE 1-10 Mortality rates at ages 55, 65, 75, and 85 for women in the United States and selected OECD countries.
SOURCE: Data from Human Mortality Database (http://www.mortality.org/ [accessed December 8, 2010]).
Among countries that have recorded reductions in adult mortality at advanced ages, the United States, the Netherlands, and Denmark are frequently cited as three that have recently underachieved. Meslé and Vallin (2006) focus on the differences in female old-age mortality among the United States, the Netherlands, France, and Japan. In the early 1950s, American women enjoyed the highest life expectancy at age 65 among these four countries. Life expectancy at age 65 in the four countries converged until the early 1980s, when it was virtually identical in all four. In about 1984, however, trends in female life expectancy began to diverge sharply so that by 2000, the levels of life expectancy in the United States and the Netherlands had fallen significantly behind those in France and Japan.
Janssen and colleagues (2004) examined trends in mortality at age 80 and found that in the 1980s and 1990s, while France and to a lesser extent England and Wales enjoyed continued declines in old-age mortality, the Netherlands, Denmark, and Norway saw progress stagnate. For the Netherlands, the stagnation in old-age mortality occurred around 1980. Subsequent analyses of cause-of-death patterns revealed that smoking-related cancers, chronic obstructive pulmonary disease, and diseases related specifically to old age contributed to this stagnation (Janssen et al., 2003; Nusselder and Mackenbach, 2000). Recently, however, there has been a sharp improvement in life expectancy in the Netherlands. From 2002 to 2008, life expectancy at birth increased by almost 2 years in that country, with the sharpest upturn being achieved at age 85. This improvement is thought to be a period as opposed to a cohort effect, since it coincides with a time of sharply rising health care expenditures and increased health care for the elderly, facilitated by the sudden relaxation of budgetary constraints on health care expenditures by the Dutch government (Mackenbach and Garssen, 2010).
Similar to the Netherlands, Denmark was among the world leaders in low levels of mortality up to the 1980s, for both men and women. Like the United States, however, Denmark experienced a period of stagnation in mortality improvement for 10–15 years. The stagnation ended in the mid-1990s, and more recently, Denmark has once again achieved rates of improvement in life expectancy at older ages that are comparable to those of the highest-performing countries. Nevertheless, Denmark has not been able to catch up with neighboring Sweden, where life expectancy has been among the very longest for many decades. An analysis of cause-specific mortality data suggests that the stagnation in Danish mortality improvement was related to lifestyle factors, especially smoking and excessive alcohol consumption. Differences in smoking- and alcohol-related deaths account for virtually all of the disparity in life expectancy between Denmark and Sweden during the period 1997–2001, with smoking playing the larger role (Christensen et al., 2010a). There are also some indications that lower budgets for Denmark’s
free national health care system relative to other Nordic countries may have played a role in Denmark’s adverse position (Christensen et al., 2010a).
At the other end of the spectrum, Japan and France have achieved remarkable improvements in survival at older ages. The pace of mortality improvement at older ages continues to be particularly rapid in Japan, even though it already enjoys mortality levels lower than those anywhere else. In July 2010, when the Japanese Ministry of Health, Labour, and Welfare published an abridged life table for 2009, it showed that Japanese women are now expected to live, on average, 86.44 years—the highest level in the world for the 25th straight year—while Japanese men are expected to live 79.59 years (Ministry of Health, Labour, and Welfare, 2010). Remarkably, these levels represent increases in average life spans of almost 5 months for women and 4 months for men compared with the previous year. If death rates at older ages were approaching a biological or practical limit, it might be expected that improvements in Japan would be slowing down. Similarly, length of life continues to increase in France, which has the second highest recorded level of life expectancy after Japan. French mortality declined very sharply in 2004 compared with 2003, a year that saw a major heat wave, but also compared with 2002, a more normal year (Pison, 2005). Life expectancy in France increased by 10 months between 2002 and 2004, a significantly more rapid increase than the trend for the previous 50 years, which was about 3 months a year (Pison, 2005).
Discussion
Research on advances in mortality at older ages has unequivocally confirmed the existence of large and growing differences in life expectancy between the United States and many other high-income countries. To date, no satisfactory explanation of these patterns has been proposed. A clearer understanding of what accounts for the observed differences in life expectancy and the observed trends at older ages among high-income countries may help identify important modifiable risk factors that could inform the development of new initiatives aimed at improving life expectancy in the United States still further. The gap between the level of life expectancy currently being achieved in the United States and in countries such as Japan and France indicates how much better the United States might be able to do given the current state of knowledge and practice. A firmer understanding of the proximal and distal causes of mortality differences and improvements also could potentially lead to better mortality forecasts in the future. It should be noted that explanations of mortality differences at a moment in time may not be the same as explanations of differences in mortality trends; certain factors may explain the contemporary gap between the United States and other countries, while different factors may be re-
sponsible for changes in the gap. Because the gap has widened substantially in recent decades, the panel believes that study of the factors underlying current patterns will likely contribute to explanations of the widening gap, but that is not necessarily the case.
ORGANIZATION OF THE REPORT
The remainder of this volume moves from basic description toward the search for explanation. As noted, the panel chose to focus much of the report on nine other countries for intensive comparison with the United States: Denmark and the Netherlands, the two other underachievers; Japan and France, two stellar achievers; Italy and Spain, large countries whose life expectancy gains have also outpaced those of the United States; and England and Wales, Canada, and Australia, English-speaking countries that have also seen relatively strong gains in longevity. The panel also chose to focus on one principal indicator of mortality at older ages—life expectancy at age 50, or how long a 50-year-old could be expected to live according to the set of age-specific death rates recorded in any particular country and period. While this measure summarizes mortality circumstances at ages above 50, it does not provide a perfect indicator of what happens at every age in that range or of the age pattern of mortality itself.6
Chapter 2 provides a closer look at cause-of-death statistics by gender over the past half century for the selected subsample of 10 countries; it also explores differences in current health status between the United States and the other countries. The heart of the report is contained in Chapters 3 through 9. Each of these chapters takes as its starting point a particular risk factor presumed to affect mortality and examines how differentials in exposure to that risk factor across countries might account for observed disparities in life expectancy improvement. Finally, Chapter 10 presents the panel’s conclusions and suggests new areas of research that would augment our knowledge and understanding of this important issue and inform efforts to address it.
It should be noted that the fluid nature of the relationship between some of the risk factors examined in Chapters 3–9 and mortality risk provides one source of uncertainty in the panel’s conclusions. Moreover, no report can be expected to examine every conceivable risk factor associated with mortality. The panel therefore chose to focus on the body of evidence for the commonly proffered explanations for why the United States fares poorly
on life expectancy relative to other countries: country-level differences in exposure to risk factors related to obesity (Chapter 3), physical activity (Chapter 4), and smoking (Chapter 5), as well as levels of social integration (Chapter 6); differences in health care systems, including differences in treatment regimes (Chapter 7); use of hormone therapy (Chapter 8); and socioeconomic inequality (Chapter 9). The panel did not pursue differences in alcohol consumption as a potential explanation for the U.S. disadvantage in life expectancy because the United States ranks low in per capita alcohol consumption among OECD countries (Organisation for Economic Co-operation and Development, 2010). Moreover, the panel was unable to address some risk factors because comparable data for the countries of interest (e.g., composition of diet, environmental factors, and stress levels) were not sufficiently detailed to allow intensive investigation. Ultimately, all of these factors will need to be examined in an integrated framework across the entire life course, taking into account the effects of differences in behavioral risk factors, socioeconomic status, and social policy, as well as the effects across particular cohorts and periods.


