
12
Research Methods and Measures
|
Key Messages Noted by Participants
|
Any discussion of research considerations, opportunities, and gaps would be incomplete without examination of the methods and measures used to conduct research. As moderator Amy Yaroch noted, these methods and measures encompass such topics as measurement development, qualitative approaches, and the use of technologies such as geographic information systems (GIS).
COLLECTING AND ANALYZING DATA ON FOOD INSECURITY
The causal connection between food security and weight status—to the extent that there is one—needs to operate through some mechanism, said Mark Nord, a sociologist at the Economic Research Service at the U.S. Department of Agriculture (USDA). This mechanism can be exceedingly complex. It can include, at a minimum, diet and health knowledge, nutrition motivation, cooking and food storage facilities, the physical ability to prepare food, physical activity, stress, genetics, and the inability to absorb and utilize nutrients because of some diseases (e.g., diarrheal disease) that interfere with nutrient incorporation into the body. Given these many factors, linking food security to weight status can be “almost a Herculean task,” said Nord.
Nord suggested keeping these questions in mind when using food security measurements:
-
Who is the measure describing—household, individual, which adult(s) or child?
-
What levels of food insecurity exist—marginal, low, or very low food security?
-
What time period does a measure cover—a year, a month, or persistent?
-
What is the expected theoretical relationship between a measure and a specific outcome?
Who Is Being Measured?
As described in Chapter 2, many researchers measure food security through an 18-item questionnaire that is used to derive both an adult food security scale and a child food security scale (Hamilton et al., 1997). For almost all research purposes, including research on children’s weight status, Nord recommended using the adult scale. The children’s food security scale depends, to a considerable extent, on the oldest child in the household, and researchers typically do not know which child is the oldest. “Usually, the adult food security scale is what you want.”
What Is Being Measured?
Food security can be divided into four categories: high food security, marginal food security, low food security, and very low food security. Most people include marginal food secure with low and very low food security. This may be appropriate because, on many outcomes, households with marginal food security are more like those with low food security than
those with high food security. It may be important to include the marginally food secure with the food insecure, because the marginal food security category is often as large as or larger than the low and very low food security categories combined. Very low food security is somewhat rare in the overall and low-income populations therefore sample sizes need to be large in order to observe an effect.
Nord also suggested not using food security as a continuous variable, because the measure is not linear. The difference between two adjacent raw scores or levels of food insecurity can be quite different than between two other adjacent levels.
What Time Period Is Being Measured?
The prevalence of food insecurity depends on the length of time over which it is measured (Figure 12-1). Researchers cannot change this variable when the data already have been collected, whether the data cover a year (which is most common) or a month. However, when designing research, data describing different time periods can be used. For example, body weight is the product of longer-term development, so longitudinal data are more valuable. For food intake in the very recent past, a 30-day or even shorter measure of food security is most useful. For biochemical markers
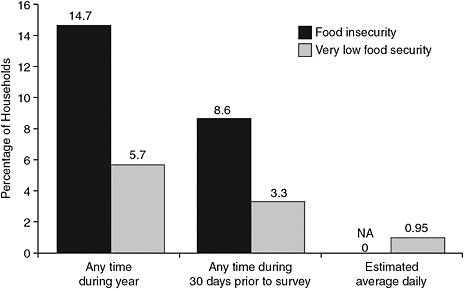
FIGURE 12-1 The prevalence of food insecurity can depend on the length of time over which it is measured.
SOURCE: Nord et al., 2010.
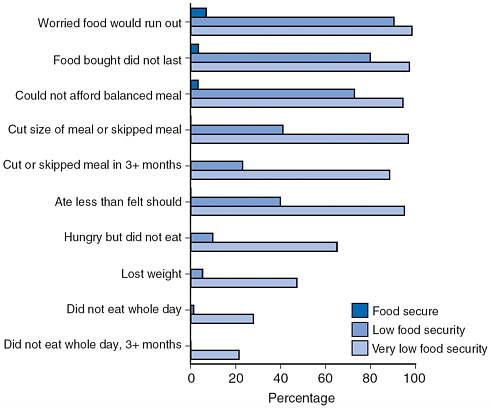
FIGURE 12-2 Households at different levels of food insecurity report conditions in different proportions.
SOURCE: Nord et al., 2010.
of nutritional status, how persistent the specific marker is will determine the time period for measuring food insecurity. “When you have the opportunity, if you are designing the research, think about what period you want to measure food security over,” suggested Nord.
What Is the Relationship Between a Measure and an Outcome?
Responses to individual questions on the food insecurity scale tend to vary with the level of food insecurity and shed light on the specific types of behaviors characteristic of each range (Figure 12-2). Not until entering the severe range do reductions in intake occur that might be reflected in calorie restrictions. At this point, a connection between food insecurity and obesity can be offset by reductions in calories, said Nord. Nonetheless, variability of food security over time also can be a factor, because a household with
very low food security at one point during the year may not be at that level for long.
Available Sources of Survey Data
Nord provided a list of surveys that contain data on both food security and weight status1:
-
Current Population Survey Food Security Supplement (CPS-FSS)
-
American Time-Use Survey (ATUS)
-
-
National Health and Nutrition Examination Survey (NHANES)
-
Early Childhood Longitudinal Study (ECLS)
-
Kindergarten Cohort (ECLS-K)
-
Birth Cohort (ECLS-B)
-
-
California Health Interview Survey (CHIS)
-
Behavioral Risk Factor Surveillance System (BRFSS, in selected states)
-
Canadian Community Health Survey (CCHS)
-
Children’s HealthWatch (formerly the Children’s Sentinel Nutrition Assessment Program)
Two other surveys are currently being developed:
-
The National Health Interview Survey (NHIS), which will include the 10 adult food security items in surveys conducted in 2011 and 2012.
-
The National Food Acquisition and Purchase Survey (FoodAPS), which will collect information on what households are actually buying and bringing home from the store along with information on food security and weight status.
COMMUNITY-BASED RESEARCH
Alexandra Adams, associate professor in the Department of Family Medicine and director of the Collaborative Center for Health Equity at the University of Wisconsin School of Medicine and Public Health, works with 11 tribes in Wisconsin, including the Menominee Nation, Bad River Nation, Lac du Flambeau tribe, and Oneida tribes, as well as the Great Lakes Inter-Tribal Council. Members of the tribes live in rural reservations, anywhere from 5 to 20 miles from the nearest town. Many experience
significant issues with food access and food security, and understanding their views of child health is essential to addressing these issues, explained Adams.
Perceptions of Health
Adams discussed findings from seven focus groups with 42 participants, primarily women with children, done as part of an epidemiology study looking at cardiac risk factors on the reservations (Adams et al., 2008). Among the questions the researchers were trying to answer are: How do you define health? What does it mean to have a healthy child? What are some of the things that help you have a healthy child? What are some of the things that make it hard to have a healthy child? Finally, would that information help inform interventions?
Only one of the mothers ever mentioned anything to do with physical health—in that case an ear infection. Otherwise, the conversations revolved around children being happy, being inquisitive, being well-cared for, having the family involved, not having alcohol and drugs in the home, and not experiencing violence. These responses point toward a very different definition of health than in many other families, Adams said.
Basic needs came first in the focus groups. People were very focused on the present. If they had someone else in the home who could be supportive, such as a father or a grandmother, it was easier to provide a good meal. Many things outside the home were not under their control, so they used the inside of the home as a way to control their lives.
Barriers to Healthful Lifestyles
The focus group members mentioned many barriers:
-
Lack of resources
-
Lack of places for children to play
-
Lack of ways to obtain fruits and vegetables
-
Safety issues, including loose dogs and trouble caused by teenagers
-
Shift work, which can be disruptive to schedules
-
An open household structure, so that the number of people who need to be fed varies
When parents were worried about safety, they might keep their children indoors but give them free rein inside the house. In that case, children might be able to eat as much food or watch as much television as they wanted. It was important for these mothers to give their children this kind of free
choice, Adams said. Indeed, interventions that removed this choice would be difficult to implement.
An Intervention Trial
Using the results of the focus groups, Adams and her colleagues designed a 2-year randomized control trial called Healthy Children, Strong Families that examined a lifestyle intervention for children ages 2 through 5 and their primary caregivers. It compared families receiving home visits with those that did not receive home visits, randomized by family in four tribal communities in Wisconsin.
Designing this study presented some difficult data collection issues. For example, the study included three dietary recalls for the women and for their children, using the women or another parental figure as the person who provided the information. Researchers also did observations at school or Head Start for two meals and snacks. Finally, the study included menu analysis of school and Head Start meals and snacks, which was complicated because the menu is constantly changing.
The researchers found that it was difficult to get accurate answers in food and dietary surveys. First, mothers often over-reported their children’s caloric intakes. Some 3-year-olds were consuming 1,800 to 2,000 calories a day according to the surveys. But the parents did not understand children’s portion sizes, making it difficult to get accurate responses.
Meanwhile, the mean of the parents’ reported intakes was about 1,500 calories. Given that 80 percent of these mothers are obese or overweight, with a body mass index (BMI) of 25 or more, this amount of calories also did not seem accurate. Similarly, when parents were asked about their child’s food intake, the answers suggested that the parents were trying to support and protect their children.
When people were asked whether they were worried that food would run out, their answers had some correlation with BMI: people who were more worried about their food supplies tended to be heavier. The researchers concluded that food quality was often being sacrificed over the long term. “People get used to buying lower-quality foods at grocery stores that really don’t provide higher-quality foods, so they don’t feel that they’re food insecure.”
Photovoice as a Data Collection Method
The final study Adams described is the Youth Defining Health Study, which was done in conjunction with an American Indian graduate student who is also a professional photographer. He taught 22 students in a summer
school program, most of them middle schoolers, how to take pictures using digital cameras. They were then asked to take pictures of what health means to them on the reservation. After a week of taking pictures, they edited the photographs and divided them into categories with the investigator.
Many were pictures of water, pets, and traditions. A photograph of a basketball court might have been seen as a healthful image, but because the court was the scene of drug activity, the students viewed it as unhealthful.
No photographs of healthful food were taken by the students, just unhealthful foods. Many of the students had secret stashes of food in their rooms. Television and alcohol were also the subject of many photographs.
In some cases dogs were viewed as pets and in other cases as threats, with about half the children having received serious bites. Fish from the river were considered healthful by some students but unhealthful by others because of pollution. Similarly, some of the photographers thought a park was safe and others did not.
The researchers reviewed the transcripts of discussions recorded while they were viewing photographs with the students, and some of this information was shared with tribal elders. The elders were concerned about the loss of culture shown in the photographs, particularly the loss of food culture, said Adams. “The food stashes were completely new to them. They had not seen that or understood that or realized that kids were doing that.” Understanding how communities respond to such findings is an important part of understanding food insecurity, said Adams, whether in urban or rural areas.
This was a very labor-intensive project, said Adams, but having the cameras home on weekends allowed the taking of photographs that could not be taken any other ways, such as the contents of freezers. Transcription and data analysis raised many issues. An effort to time-stamp the photographs did not work because the students exchanged cameras and altered their settings. The processes of transcribing conversations, conducting thematic analysis, and validating results were time-consuming and difficult, and better ways of conducting these processes need to be developed.
Clinical Observations
Adams has treated many children with obesity in an obesity treatment clinic, and she has seen various food behaviors. When parents are low income, family members struggle with food. Children hide and hoard food, primarily junk foods, in their rooms. They binge and overeat when they can. They also time their meals differently. They often eat very late at night if possible. They raid refrigerators in the middle of the night because they know that their mothers do not want them to eat. They also eat in response
to distress from family circumstances. Adams concluded by listing some of the questions that arise in doing community research:
-
What does a community want and need?
-
How does the community feel about research surveys?
-
How can the survey questions be improved?
-
How do the attitudes and coping responses of adults and children vary?
THE USE OF INTERVIEWS AND FOCUS GROUPS
It is important for researchers using qualitative methodologies to decide how best to utilize interviews and focus groups, said Chery Smith, associate professor in the Department of Food Science and Nutrition at the University of Minnesota. She also noted the importance of nonverbal qualitative methodologies such as photography, which had been discussed in the previous session. Smith devoted her presentation to interviews and focus groups.
Smith has conducted both interviews and focus groups on food insecurity and obesity with children and adults. For sensitive information, Smith prefers interviewing. It works well with children and adults and people from various ethnic backgrounds, she said. She trains students in both interviewing and focus group methods. She works closely with students before they are allowed to conduct interviews. She co-moderates focus groups with her research students. That “takes some of the bias out of what they are hearing,” she said. Smith uses dual coding of focus group transcripts. When both she and her students are done coding, they compare their work and reconcile differences. She stressed the importance of dual coding when analyzing focus group data.
Qualitative methodologies fill gaps in the literature that are not caught using quantitative measures, she said. To better understand the experience of hunger, she asked children to tell her what happened when they reported being hungry at night.
As one child in the study said, “I go to sleep and I dream about food that I’m eating…. I dream about ooh, ahhh, I dreamed about hamburgers and carrots and strawberries and everything else … and then it makes me full when I get up … it makes me, I get, like, and why do I have a tummy ache?” (Richards and Smith, 2007).
Qualitative methodologies also provide formative data for survey development, marketing strategies, and the design of intervention projects.
“Think Aloud”
Another qualitative methodology Smith mentioned is what she called a “think aloud.” Interviewees carry tape recorders while they shop and talk about the choices they make, providing insights into what people are thinking about when they buy food.
Cultural Perceptions of Obesity
Based on her research, Smith has concluded that it can be a mistake to assume that all overweight or obese people want to lose weight. Some do not. “Many of the African-American men [we have interviewed] are very happy to be big. You might perceive obesity as a huge problem, but one of the things that I’ve learned is that some of the populations don’t perceive it in the same way that we do.”
Researchers have a tendency to impose their own cultural perceptions on other populations. In interviews, she asks people what they think about weight and why they think some people are big and some people are small. Responses often have a genetic cast: “it runs in my family.” Even with diseases such as diabetes, a respondent may point to a family predisposition. “One of the things that we have tried to do is not focus on the obesity [but] on other problems like finding interest in changing your blood pressure.”
Interventions need to be tailored to specific cultures. When encountering different cultural perceptions regarding weight loss, the challenge, she said, is “walking that fine line in a culturally appropriate manner.”
SPATIAL DATA AND SPATIAL METHODS
GIS and global positioning system (GPS) technologies are tools, and like any tools they could be replaced in 5 years by new technologies, said Amy Hillier, assistant professor of city and regional planning at the University of Pennsylvania, School of Design. Yet regardless of the tool, rich geographic data make it possible to do research that cannot be done any other way.
Much of the research using GIS in the past has been neighborhood effects research, in which individuals’ home addresses are associated with data about their neighborhoods. This research has been an improvement over thinking that individuals make decisions regardless of their environments, but in some ways it has been unsatisfying. “It doesn’t help us understand causal mechanisms,” said Hillier. “It doesn’t understand that people interact with their environments differently.”
Combining GIS with Other Forms of Data
Vast amounts of administrative data about food stores and food resources can be put into GIS, but it is also important to send people into the community to “ground-truth” the administrative data against the reality. These field checks may reveal that some stores have closed, others have opened, and many have changed their names. It also makes it possible to take photographs of the outside of stores, which may reveal substantial qualitative data. Furthermore, when Hillier and her colleagues have spent time “on the ground” in the communities they study, they have been able to have conversations with food vendors and service providers and to see how they interact with customers, information that they could not have obtained in other ways.
In another study, a colleague of Hillier’s developed a Nutrition Environment Measures Survey for stores, which is a systematic checklist of foods and healthful food options in stores (Glanz et al., 2007). “We have to get into the stores, food banks, and food cupboards if we really want to know what access to healthy food means,” Hillier said.
These methods also make it possible to capture and map data about food environments. One study, for example, looked at outdoor advertising (Hillier et al., 2009). Students scoured neighborhoods with cameras and GPS systems to capture the location and content of outdoor advertising. “You wouldn’t believe just how many of these cigarette ads are out in the poor communities in Philadelphia.”
Human-Environment Interactions
Another sophisticated example of the use of spatial data involves capturing how people interact with their environments. Maps of how people move within their communities made with GPS technologies can reveal some of the decisions they make related to food insecurity and obesity. Mapping can reveal the following:
-
Modes of transportation
-
How long they took to reach a location
-
How long a subject stayed at a specific location
-
Levels of physical activity, if accelerometers are linked to mapping
Hillier’s team has had success uncovering where people shop by going door to door and interviewing them. “That was a much richer way of experiencing communities and people.” In addition, administrative data are available from, for example, websites that allow students to order food from area restaurants that is delivered to their dorm rooms.
Self-reports can be enriched considerably using spatial technologies. Students could use travel diaries that depict their routes to school. Heart monitors could reveal when people are under stress. Video cameras mounted on shoppers could show what food people buy.
Spatial data can help make services more efficient. This can be as simple as where to find day care or subsidized public transportation. Yet it also can be a rich source of information about accessing services and products in the community, whether WIC supplements, food banks, or healthcare services. For example, the MANNA Food Bank in Philadelphia distributes thousands of meals to people throughout the Delaware Valley. The organization hired a GIS software developer to increase the efficiency of food delivery. “There is no reason that nonprofits can’t do this,” said Hillier.
Spatial Distance as a Measure of Social Distance
Measures of spatial distance also can be converted into measures of social distance. For example:
-
To what extent do people cross boundaries of race or class in cities?
-
Do heart rates change when someone goes between ethnic neighborhoods?
-
Where do people actually get their groceries and eat their food?
Qualitative Research
GIS technologies also can be used for qualitative research, as in the many projects using participants to take photographs. Measures of location can be combined with photo elicitation to encourage people to talk about the experience of going to a store. One researcher calls the integration of GIS software and qualitative data analysis “geoethnography.”
Hillier ended with a plea. “Whether you find this compelling or not, collect spatial data even if you are not going to use it. Collect the address of where people live. Collect the address of where people shop if you can. A lot of times, it’s just a matter of asking.” By collecting these data, the door remains open for spatial analysis, regardless of whether that analysis is done in the original research. By the same token, national surveys should collect much richer spatial data in ways that protect confidentiality and privacy. “There are definitely ways that we can do that,” Hillier said.
THE PROMISE OF TECHNOLOGY
Food insecurity exists within a broad social, environmental, and political context that is usually characterized by poverty, as shown in a concep-
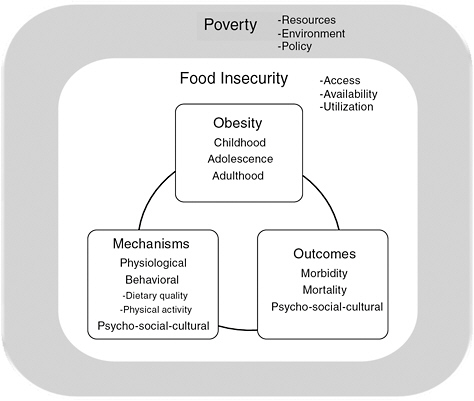
FIGURE 12-3 Food insecurity exists within the context of poverty in a multidimensional, multidetermined, dynamic, embedded, and multilevel system.
SOURCE: Finney Rutten et al., 2010. Reprinted by permission of Taylor and Francis Group.
tual model recently published in the Journal of Health and Environmental Nutrition developed by Lila Rutten, a behavioral scientist with SAIC, Inc., National Cancer Institute-Frederick, and her colleagues (Figure 12-3). In turn, food insecurity, nested within the larger context of poverty, provides a context that translates the influences of poverty into a mutually reinforcing cycle of excess weight gain and poor health outcomes through physiological, behavioral, and psycho-social-cultural mechanisms. The entire system is multidimensional, multidetermined, dynamic, embedded, and multilevel. “We’re all aware of … the difficulty of addressing each of these [factors] individually,” said Rutten.
Rutten expressed great optimism that recent changes in technology have “transformed the data landscape.” Several of the speakers in the session on research methods, she noted, made the point that opportunities for the richness and variety of data capture, standardization, harmonization, analysis, visualization, and dissemination have never been greater.
Examples of Promising Technologies
Rutten briefly shared with workshop participants an example of data standardization, harmonization, and visualization from GapMinder,2 a nonprofit organization that creates tools for visualizing and integrating datasets involving global health and economics. Through the “Wealth and Health of Nations” example from GapMinder World, she demonstrated the GapMinder software application called Trendalyzer that uses time-series analysis to compare life expectancy with per capita gross domestic product by nation. Rutten suggested that many of the data discussed throughout the workshop could be “popped into an application such as GapMinder to start to tease out and look at some of the intricacies and complexities of the relationships that we’ve seen here and to mirror methodologically some of the multilevel, multidimensional, and dynamic nature of these concepts.”
In reference to the “Wealth and Health of Nations” example, Rutten said, “If you think about the spreadsheets that underlie this application, there’s an enormous amount of data here. But we’re able to sort of take it all in at once because of the way it’s presented.”
Appreciating the whole—or the gestalt—from disparate measurements can be very difficult, Rutten concluded, but “changes in technology can be leveraged to do a better job of pulling together and displaying our data. With the collective intelligence and efforts of the people in this room, there are reasons to be hopeful for gestalt.”
GROUP DISCUSSION
Moderator: Amy Yaroch
During the group discussion period, points raised by participants included the following:
Funding
The kinds of research being discussed at the workshop will cost money, said the Food Research and Action Center’s Geri Henchy in the discussion session. Will USDA be able to support that research? The moderator of the session, Amy Yaroch, said that she believed USDA would. She also said that the National Institutes of Health (NIH) is considering funding research in this area, although NIH traditionally has funded obesity prevention research rather than food insecurity research. Adams added that many researchers could be doing research on food insecurity and obesity as part of their current projects by adding additional data or analysis to
|
2 |
See http://www.GapMinder.org (accessed November 18, 2010). |
their results. “We can maximize what people are doing without having to add a ton of money.”
Sharing Results for Decision Making
Chilton noted that an important component of the photovoice methodology is to be able to talk about the photographs with policy makers and the public to create change. Adams reported that sharing the photographs with the tribal elders in her study achieved that end by revealing how children viewed food and what they wanted to do in the community. “It was done for the community, within the community, to help understand those issues.”
In response to a question about whether taking photographs can be used in intervention programs, Adams noted that her study was designed to get a broad sense of the foods people have in their homes. The point of her study was then to take this information to the community so it could decide what to do in response. She has not tried to use photography in her clinical practice to change the eating patterns of households or individuals. Some researchers are working on the use of photographs to calculate how much people eat, and she noted that self-monitoring can be very helpful for people trying to lose weight. “As more kids have cell phones, and they all have cameras with them, that kind of self-monitoring could be very useful clinically.”
REFERENCES
Adams, A. K., H. Harvey, and D. Brown. 2008. Constructs of health and environment inform child obesity prevention in American Indian communities. Obesity 16(2):311-317.
Finney Rutten, L. J., A. L. Yaroch, U. Colon-Ramos, W. Johnson-Askew, and M. Story. 2010. Poverty, food insecurity, and obesity: A conceptual framework for research, practice, and policy. Journal of Hunger and Environmental Nutrition 5:403-415.
Glanz, K., J. F. Sallis, B. E. Saelens, and L. D. Frank. 2007. Nutrition Environment Measures Survey in Stores (NEMS-S). Development and evaluation. American Journal of Preventive Medicine 32(4):282-289.
Hamilton, W. L., J. T. Cook, W. W. Thompson, L. F. Buron, E. A. Frongillo, C. M. Olson, and C. A. Wehler. 1997. Household food security in the United States in 1995: Technical report. Washington, DC: Prepared for USDA Food and Consumer Service.
Hillier, A., B. L. Cole, T. E. Smith, A. K. Yancey, J. D. Williams, S. A. Grier, and W. J. McCarthy. 2009. Clustering of unhealthy outdoor advertisements around child-serving institutions: A comparison of three cities. Health and Place 15(4):935-945.
Nord, M., A. Coleman-Jensen, M. Andrews, and S. Carlson. 2010. Household food security in the United States, 2009. Economic Research Report No. 108. Washington, DC: Economic Research Service.
Richards, R., and C. Smith. 2007. Environmental, parental, and personal influences on food choice, access, and overweight status among homeless children. Social Science and Medicine 65(8):1572-1583.


