
3
Socioeconomic Disparities: Food Insecurity and Obesity
|
Key Messages Noted by Participants
|
Studies of food insecurity often draw connections to measures of socioeconomic status (SES), noted Adam Drewnowski, professor of epidemiology and director of the Center for Public Health and Nutrition at the University
of Washington, who moderated the session on socioeconomic disparities, food security, and obesity. Measures of socioeconomic status have many shortcomings, for example, they typically are based on “snapshot” measures of current income or education. Such measures of income do not measure accumulated assets and wealth, and such measures of education can have little bearing on the current economic status of a person who is 50 and unemployed. A person’s employment status may be measured at one point in time, but that job could be lost the next day, noted Drewnowski. Furthermore, SES measures typically do not reflect economic insecurity, which is a measure of desperate need.
New and different measures to better understand economic security are important in understanding the relationship between food insecurity and obesity, said Drewnowski. Should such factors as assets, wealth, property values, neighborhood in which a person lives, or whom a person knows be included? What currently unobserved factors are important?
One question is whether socioeconomic status should be measured along a continuous gradient. Some studies have made income-based dichotomous distinctions between the poor and non-poor. At $19,000 a year, a person is poor. At $21,000 a year, that person is almost middle class, said Drewnowski. Yet SES is a complex construct that may affect health outcomes through diverse mechanisms and at different points in the life course. New ways to measure social disparities may provide new insights on the distribution of food insecurity and obesity among children and adults.
SOCIOECONOMIC INEQUALITIES IN OBESITY
Gopal K. Singh, senior epidemiologist with the Maternal and Child Health Bureau, Health Resources and Services Administration, U.S. Department of Health and Human Services, described trends in obesity and overweight among children, adolescents, and adults and the extent to which socioeconomic disparities in obesity vary across the life course. He used data from three different nationally representative surveys: the National Health and Nutrition Examination Survey (NHANES), the National Health Interview Survey (NHIS), and the National Survey of Children’s Health (NSCH). The NHANES has been conducted periodically in the United States since the mid-1970s and since 1999 has been a continuous annual health examination survey with a sample size of about 10,000 children and adults for every 2-year cycle. The NHIS has been conducted continuously since 1957 and has a sample size of about 100,000 children and adults. The NSCH is the largest child health survey in the United States and is conducted every 4 years, with the next survey scheduled for 2011. It has a sample size of about 100,000 children less than 18 years of age. Body mass index (BMI) in NHANES is based on measured height and weight data,
whereas BMI in the NHIS is based on self-reports and BMI in the NSCH is based on parental reports. Thus, each survey uses a different source of information to measure overweight and obesity. The terms used to classify weight status are defined in Box 2-2.
As calculated from these surveys, the obesity prevalence for male children quadrupled between 1976 and 2008 (Figure 3-1). The overall obesity prevalence among children ages 6 to 17 increased threefold during the same time.
For adults, the prevalence of obesity has increased threefold in the past 50 years (Figure 3-2). One in three adults and about 68 percent of the adult population is obese or overweight, respectively, according to most recent statistics. This represents a “dramatic increase in obesity prevalence among both children and adults in the past three decades,” said Singh.
For children and adolescents, higher income is associated with lower prevalence of obesity in general (Figure 3-3). This relationship is not so clear for adults ages 18 to 44, 45 to 64, or older than 65. For children in poverty, the prevalence of obesity was 23 percent, as opposed to 8 percent among children whose family incomes exceeded 500 percent of the federal poverty level. If adjusted for gender or age differences, the gradient is more consistent for children and adolescents and not so consistent for adults and the elderly.
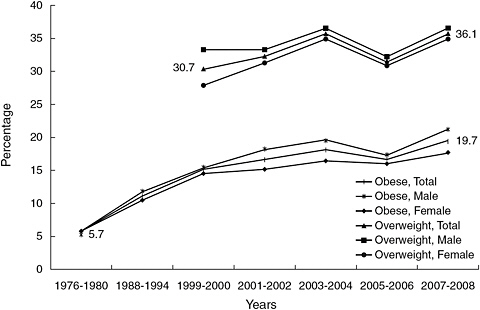
FIGURE 3-1 Trends in obesity prevalence among U.S. children ages 6-17 from 1976 to 2008.
NOTE: Combined male/female data were not adjusted for sex.
SOURCE: Singh and Kogan, 2010.
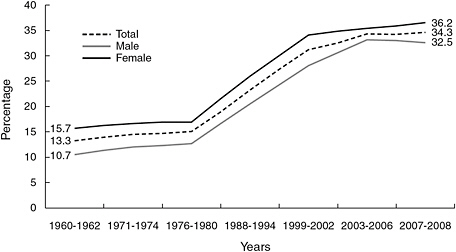
FIGURE 3-2 Percentage trends in age-adjusted obesity prevalence among U.S. adults ages 20-74 from 1960 to 2008.
NOTE: Combined male/female data were not adjusted for sex.
SOURCE: NCHS, 2010; 2007-2008 data from the National Health and Nutrition Examination Survey.
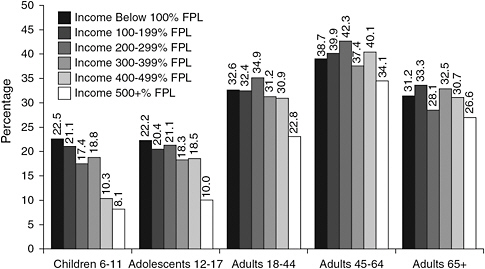
FIGURE 3-3 Socioeconomic disparities in obesity prevalence, in percentage, compared with federal poverty level, across the life course, data from the 2003-2008 National Health and Nutrition Examination Survey (NHANES).
NOTES: FPL = federal poverty level. NHANES provides heights and weights measured by a trained interviewer. Data were not adjusted for race/ethnicity.
SOURCE: Singh, 2010.
The prevalence of obesity and overweight among children ages 10 to 17 varies by household parental education (Figure 3-4). These statistics show that in almost every case, the prevalence of obesity and overweight increased from 2003 to 2007, and the increase was greatest for those with the least education. The same pattern is seen when looking at obesity and overweight prevalence by income or poverty status.
Neighborhood socioeconomic characteristics, measured by indicators such as safety, housing quality, and vandalism, are correlated with childhood obesity risk (Figure 3-5). For example, the prevalence of obesity was 20 percent for children who lived in neighborhoods with unfavorable social conditions as opposed to 15 percent for children who lived in the most desirable neighborhoods. The impact of neighborhood conditions was substantially greater for females and for children under 12 years of age. Singh explained, “As the neighborhood socioeconomic index score goes up, the obesity and overweight prevalence goes down.”
For adults, somewhat different patterns have been observed. The increase in prevalence of obesity has been faster among those in the high-education groups, even though the overall prevalence is still lower among this group
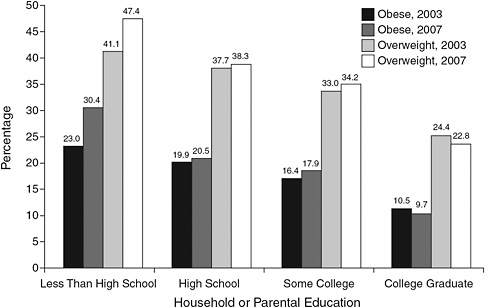
FIGURE 3-4 Percentage trends in obesity and overweight prevalence, among children ages 10-17 by household or parental education; data from the 2003-2007 National Survey of Children’s Health.
NOTE: Data not adjusted for race/ethnicity.
SOURCE: Singh et al., 2010a.
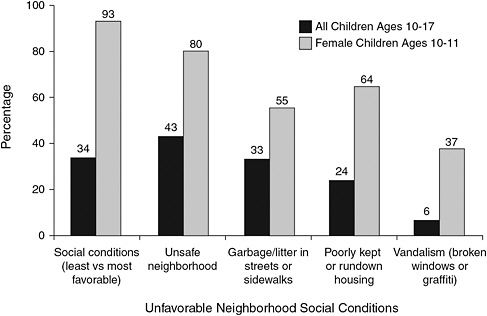
FIGURE 3-5 Excess obesity risk, in percentage of higher prevalence, among children ages 10-17 in unfavorable neighborhood social conditions, 2007.
SOURCE: Singh et al., 2010b.
than in the lower-education groups, and the same pattern applies to income. As a result, the socioeconomic disparity in obesity rates among groups has declined over time (Figure 3-6). The socioeconomic gradients in adult obesity have decreased over time, while the gradients in childhood obesity have increased because there have been faster increases in prevalence of obesity.
In looking for possible reasons for recent increases in childhood obesity, Singh cited an increase in the proportion of socially disadvantaged populations and possible dietary factors. The mean calorie and fat intake among youth has increased consistently over time. Among adults, declining physical activity levels and increasing total energy intake appear to be contributing factors. Also, differences in dietary quality among SES groups have narrowed over time, with higher-SES individuals losing their relative advantage.
THE NEED TO IMPROVE MEASURES OF SOCIOECONOMIC STATUS
Paula Braveman, professor of family and community medicine at the University of California at San Francisco, did not talk about either food insecurity or obesity. She spoke about measuring socioeconomic status be-
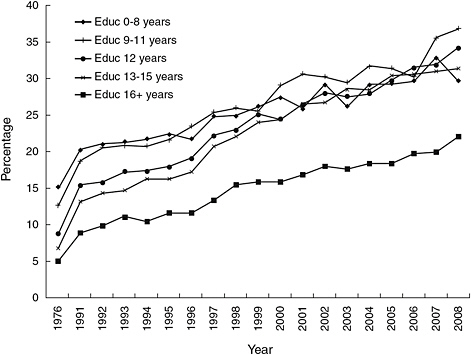
FIGURE 3-6 Percentage trends of educational inequalities in prevalence of obesity among adults older than 2, 1976-2008 National Health Interview Surveys.
NOTE: Educ = Education (years of school completed). NHANES provides heights and weights measured by a trained interviewer. In contrast, NHIS height and weight data are self-reported, which may be less accurate.
SOURCE: Singh et al., 2011.
cause it is so critical to the issues discussed at the workshop. Much of the information Braveman shared was previously presented in a 2005 journal article (Braveman et al., 2005).
Description of SES
SES is a widely used but rarely defined term, she said. Most commonly, it is measured by income, education, occupation, or wealth. Wealth refers to accumulated financial assets as opposed to income, which reflects the relatively recent (typically the prior month or year) financial situation, noted Braveman. More broadly, SES can be defined as ownership of, control over, or access to economic resources and the social standing or influence associated with those resources. “It defines where people are relative to each other in a pecking order determined by economic resources and the associated
social influence and social standing. It is fundamentally a multidimensional construct,” explained Braveman.
SES and Health Outcomes
In the United States, health data traditionally have been reported by racial/ethnic group and much less frequently by any markers of SES. When SES is considered in such studies, said Braveman, one measure or occasionally two are generally used to describe SES, and the rationale for the measure selected—or acknowledgment of relevant measures that were not selected—is rarely given. Education is often used as a proxy for income, which is more sensitive to measure. Researchers typically say that they have controlled for SES through the use of income or education, but most studies fail to consider explicitly and fully the potential causal role that these or other closely linked socioeconomic factors may have played, either as a mediator or as a moderator1 of effects on the outcomes of interest.
This failure to account for SES raises many concerns. For example, health studies often conclude that a racial/ethnic difference in outcome must be biological or cultural because it persists after the researchers have controlled for one or perhaps two SES measures. However without adequate measurement of SES, it is impossible to assess accurately its role in health, Braveman stated. Nor is it possible to assess accurately the relationship between any predictor variable of interest—particularly race/ethnicity—and any health-related outcome variable for which SES is relevant, which includes most health outcomes and health behaviors.
Dimensions and Specifications of SES
Using population-based data from four national sources and one state source—the California Maternal and Infant Health Assessment—Braveman presented examples to illustrate these points. She referred to different “dimensions” and “specifications” of SES. The dimensions are general constructs such as income, wealth, education, and occupation, while specifications are the specific ways of measuring an SES construct—for example, whether it is continuous or categorical, is measured at different points in the life course, or applies to the household or the neighborhood.
Education and Income Are Not Collinear
The first question to ask is whether education, which is often assumed to be collinear with income, really correlates so closely with income as to be considered collinear, both overall and across different racial/ethnic groups, said Braveman. Examination of multiple specifications of these two dimensions (income and education) showed that conclusions did not vary by specification. Therefore, Braveman presented only one specification of each. In data from the National Health Interview Survey, at the same educational level, income varies substantially by racial/ethnic group (Table 3-1). “At every level of education you see very large differences in income across racial/ethnic groups.” Education is an important SES measure in its own right, and it may better capture some causal pathways than income does, “but it is not an acceptable proxy for income,” Braveman concluded.
Similarly, poverty levels (income expressed in increments of the federal poverty level) and educational levels are only modestly or weakly correlated. Across all five of the datasets Braveman considered, the Spearman correlation coefficients ranged, with a few minor exceptions, between 0.42 and 0.50. To further assess the importance of selecting appropriate SES measures, Braveman showed data from analyses in which a model was constructed that looked at racial/ethnic disparities in health outcomes and asked whether the conclusions about disparities (the size, direction, and statistical significance of odds ratios) would vary according to the SES measure used. Table 3-2 shows the results of one such comparison. As measures of SES are added to statistical models, the odds of adverse health outcomes compared to whites range from 2.47 to 1.53 for African Americans and from 2.16 to 0.86 for Mexican Americans. A similar variation in odds ratios exists when considering racial/ethnic disparities in delayed or no prenatal care. In fact, “we found this for the vast majority of the indicators that we looked at—that it really could make a difference which SES marker you chose.” The differences were not necessarily statistically significant, but
TABLE 3-1 Mean Family Income by Educational Level and Racial/Ethnic Group, National Health Interview Survey 1989-1994, Ages 18-64
|
Educational Level (years) |
Black |
Mexican American |
White |
|
< 9 |
$15,503 |
$19,104 |
$22,707 |
|
9-11 |
$17,743 |
$22,377 |
$28,573 |
|
12 |
$25,337 |
$30,945 |
$37,853 |
|
13-15 |
$33,026 |
$37,642 |
$43,197 |
|
16+ |
$46,815 |
$48,055 |
$55,277 |
|
SOURCE: Adapted from Braveman et al., 2005. |
|||
TABLE 3-2 Odds Ratio for Racial/Ethnic Disparities in Fair or Poor Health Among Adults Ages 18-64—National Health Interview Survey 1989-1994
|
SES Measure in Modelb |
Odds Ratio (95% CI)a |
|
|
African American |
Mexican American |
|
|
No SES measure (baseline) |
2.47 (2.30-2.64) |
2.16 (2.01-2.32) |
|
Poverty levelc |
1.65 (1.56-1.76) |
1.30 (1.22-1.39) |
|
Income, per $1,000d |
1.67 (1.57-1.78) |
1.44 (1.32-1.56) |
|
Educational levele |
1.96 (1.85-2.08) |
1.06 (0.99-1.14) |
|
Education, per 1 year |
2.02 (1.91-2.14) |
0.89 (0.82-0.97) |
|
Poverty level and educational level |
1.53 (1.45-1.61) |
0.86 (0.81-0.93) |
|
NOTE: CI = confidence interval; SES = socioeconomic status. aWhite, non-Hispanic is the reference group. bAll models included race/ethnicity, age, and sex. cAnnual income estimated in categories defined by 100% increments of the federal poverty level according to family or household size (0-10%, 101-200%, 201-300%, 301-400%, >400%, unknown). dAnnual income in continuous dollars estimated as the midpoints of a given income range. eCompleted education in levels according to earned credentials (<9 years, some high school, high school graduate or general equivalency diploma, some college, college graduate or more). SOURCE: Braveman et al., 2005. Journal of the American Medical Association 294(22): 2879-2888, December 14, 2005. Copyright © 2005 American Medical Association. All rights reserved. |
||
a researcher could reach very different conclusions about a racial/ethnic disparity based on the SES measure used.
The results of these analyses conducted by Braveman and colleagues also underscore the conclusion that SES is a fundamentally multidimensional construct. For most outcomes, model fit was improved when both education and income were included. “We do not think you can capture SES with a single measurement, yet that is the prevailing standard.”
Wealth
Wealth is very rarely measured in U.S. health studies, but it can be very important for health, noted Braveman. Wealth could buffer the effects of temporarily low income, and it is more likely to reflect socioeconomic circumstances in childhood. Lack of information on wealth could present problems in assessing the effects of SES among racial/ethnic groups, across which wealth varies greatly, as shown in Table 3-3. In the poorest quintile of the U.S. population, for example, non-Hispanic whites have more than
TABLE 3-3 Median Net Worth by Income for Three Racial/Ethnic Groups, 2000
400 times the wealth of African Americans. Without controlling for wealth, studies could potentially conclude erroneously that a health disparity is based on underlying biological or cultural differences, because they have not controlled adequately for SES.
Other Factors
Other factors that are rarely measured but may have important associations with health include quality of education, occupational ranking, socioeconomic features of a neighborhood such as the concentration of poverty in it and related physical and social features, subjective social status, or past socioeconomic experiences, said Braveman. The evidence regarding the magnitude of the health consequences of each of these SES factors is not definitive and is sometimes controversial. “But there is a large body of evidence—and certainly in each case you would find a number of respected experts who believe—that these factors are very, very important as determinants of health, either as mediators or moderators.”
As an example, Braveman discussed the potential effects of past SES on health. Experiences in utero or early childhood could have crucial effects that are not entirely erased by more favorable later circumstances. The effects of chronic deprivation also could differ from those of short-term deprivation. In addition, these past experiences may not be reflected in current or short-term SES measures. For example, among women who recently delivered live infants in California and who are college graduates, the percentage of the college graduates who were raised by a college-educated parent (an indicator of their socioeconomic circumstances in childhood) ranges from 19 percent for U.S.-born Latinas to 35 percent for African-American women to 59 percent for white women.
Selecting and Interpreting SES Measures
The choice of SES measure—particularly the dimension selected and potentially the way it is specified—can matter in disparities research. Furthermore, the same SES measure may have different meanings in different social groups, as demonstrated by the different correlations between education and income and between income and wealth across racial/ethnic groups.
Measures of SES need to be selected by thinking carefully about plausible pathways and mechanisms, not through “one-size-fits-all” approaches, recommended Braveman. Specific questions to ask when selecting an SES measure include the following:
-
Which dimensions of SES might be important for this health outcome?
-
What role could neighborhood socioeconomic conditions play?
-
What role could socioeconomic experiences in childhood have played?
-
Do the relevant socioeconomic measures have different meanings across different social groups (e.g., by age, gender, race/ethnicity, geography, country of birth)?
These questions have implications not just for researchers, but also for public health practitioners and policy makers. “I would hope that [decision makers] would be critical when they read studies … and would ask what potentially relevant socioeconomic measures were not examined and how that could affect the conclusions,” Braveman cautioned. In particular, it is important to critically examine a claim that researchers have “controlled for SES” in studies of racial/ethnic disparities.
Measuring all of the relevant dimensions of SES is probably impossible, Braveman concluded. Yet paralysis is not the inevitable consequence, as long as researchers consider and acknowledge the limitations of SES measures and what effect those limitations could have on conclusions. Better SES data are needed, but researchers also could make much better use of the data they have, she said, by thinking critically about the potential role of a range of socioeconomic factors in causal pathways leading to health or disease.
EVERYDAY REALITIES
Beyond the discussion of inequalities, food security, and obesity are many people struggling with everyday realities, said Elizabeth Dowler, professor of food and social policy in the Department of Sociology at the University of Warwick, United Kingdom. The economic crises of recent years have made the situation even worse, and food prices are beginning to rise again, after a period of relative containment following their spike
a few years ago. People are overwhelmed by how and what to eat so that they and their children are not hungry, how to get to work if they have a job, and how to fill their days productively if they do not. Researchers and policy makers need good indicators and frameworks for understanding causal mechanisms, but they also need “compassionate imagination” to interpret the findings of research.
As demonstrated by the previous two talks, SES is complex and multidimensional. Dowler suggested that one way to interpret this complexity is by examining poverty in terms of three sets of factors (Spicker, 2007):
-
Material deprivation—encompassing such factors as physical needs, ill health, and bad housing
-
Economic circumstances—relating inequality, occupational status, employment, and the structure of opportunities
-
Social relationships—referring to social exclusion, marginality, dependency, powerlessness, and inability to participate
These factors overlap, said Dowler, but also can be distinct.
This interpretation raises several conceptual and policy challenges, particularly in relation to food and health. Should attention focus on the absolute lowest-income families or on the lowest deciles? Should the policy aim be to reduce differentials or to improve the lives of those who are worst off? Should income or environmental factors be the focus of interventions? Should specific groups be targeted or the whole population? Is the problem material or economic poverty or a lack of cultural and social capital?
Reducing Inequalities
Researchers in the United Kingdom have established consensual minimum income standards for different household types that include sufficient food to meet requirements for health (Davis et al., 2010). This minimum income standard forms the basis of the campaigns for a “living wage”—which is above the national statutory minimum wage—a campaign that has met with some success.2 The income standard meshes with the idea of household food security—that people should have access to sufficient, safe, affordable, and healthful food appropriate for their needs and culture. They also should be free from anxiety about whether they can eat properly. However, these objectives present other questions in trying to understand people’s circumstances and needs. Do people have enough money to buy healthful food when other essential expenditures are met? Can they get to shops selling the range of food needed at reasonable prices? Is food more
|
2 |
See http://www.citizensuk.org/campaigns/living-wage-campaign/ (accessed January 27, 2011). |
expensive in the shops poorer people use? What is the quality of the food where poorer people live? What kind of food is available at institutions such as schools and workplaces? Do people have the skills, confidence, time, and equipment to cook? Are people able to eat socially or share food?
Reducing inequalities is not the same as improving nutritional health for those who are worst off. Recent policy documents in Europe, such as Closing the Gap in a Generation: Health Equity Through Action on the Social Determinants of Health (Commission on Social Determinants of Health, 2008) and Fair Society, Healthy Lives: A Strategic Review of Health Inequalities in England (Marmot et al., 2010), have urged the reduction of the gradient of inequalities. Yet actual policies have tended to focus on the most disadvantaged and to urge “lifestyle” change, rather than focus upstream on structural dimensions that shape immediate practice and long-term thinking. Thus, recent policies that only aim to encourage people to “eat the right food” or “give up smoking” are ignoring the immediate and wider reasons why unhealthful behaviors (as regarded by health professionals) are adopted. Interventions against obesity may need to be both upstream and targeted more broadly to have an effect. Of course, there may be particular problems for people living in particular circumstances and conditions, which Dowler said will require targeted interventions. For instance, it may be that in areas of multiple deprivation the majority of places where food can be obtained are the cheapest fast-food outlets, which are not conducive to healthful eating. However, Dowler asked whether it is more likely that the problems are much more generalized and that the drivers of rising obesity affect many within the population, except the very richest. These questions challenge both research and policy.
Social Capital
Social capital—the resources available to individuals through their social behaviors and membership in community networks—has been shown to have a positive link with food security and with a lower risk of hunger at a household level in the United States (Martin et al., 2004). European theorists have looked at social exclusion, “which is not quite the same thing, but it does recognize that multidimensional disadvantage for people and areas and its role in perpetuating deprivation,” noted Dowler. European attention to social exclusion has informed approaches to reducing health and social inequalities—and to some extent those in food—in the United Kingdom, though arguably not in obesity.
Structure Agency Debate
Obesity is an excellent example of what sociologists call the “structure-agency debate,” said Dowler. Structure refers to the environmental factors and social forces that shape people’s thinking such as preferences, practices, the media, and advertising. Yet people are also self-conscious beings able to participate in and change the societies in which they live. Dowler said that we have the capacity and “the potential to exercise our own choice and influence on our daily lives.”
There is current debate over the role of physical, economic, retail, and media environments in shaping what is normative versus people’s understandings and capacity to effect their own decisions about eating behaviors. Research on lay knowledge and understanding about body size and obesity illuminates this tension. Several researchers have drawn upon Bourdieu’s notion of “habitus”—how people view the world from within their own social position and experiences to make sense of possibilities, disposing them toward particular attitudes and expectations in their research studies. Coveney (2005) in Australia, and Backett-Milburn et al. (2006) in the United Kingdom, have revealed the social class distinctions in parental attitudes toward their children’s body sizes and how these fit with their goals and expectations. The researchers found that middle-class families value taste and variety, restraint and control over eating and the body, and healthiness now and in the future. Working-class families, however, tend to eat in more traditional ways, with tastes molded by supermarkets and advertising; individual autonomy over food is important, even for young people, and their focus is more on “here and now”—that children are growing well or keeping active.
Obesity is not just about inappropriate consumer choice to be addressed by changes in labeling and exhortations to walk more. It is a marker, Dowler said, of a food system that is failing to deliver healthful food to all. “It is failing to provide true food security and a food system that is sustainable environmentally and socially, and this is despite huge technological innovations.” New ways of thinking about food and food systems are being developed by public health advocates, policy makers, social scientists, food producers, and many others. “These different ways of growing, processing, retailing, sharing, preparing, and eating foods not only reconnect producers and consumers to one another and to the natural world, but [represent] a different relationship to food.” Dowler said that she had not seen a reduction in BMI as a consistent measured outcome of studies of such innovations as growing your own food on a community plot or shopping at a local market. “But I do know a lot of anecdotal evidence that suggests that healthier living, including feeling better about yourself and your eating, is a consistent result [of those sorts of activities].”
GROUP DISCUSSION
Moderator: Adam Drewnowski
During the group discussion, points raised by participants included the following:
Gauging Economic Security
Adam Drewnowski asked what measures besides income could be used to gauge economic security. Braveman responded that she has worked on the possibility of more simplified wealth measures because “that is one of the big obstacles to the use of wealth in health research.” Calculating net worth involves going through a person’s assets and debts, “and that is not going to happen in any health survey,” although some economic surveys take such an approach. At least six or seven questions would have to be asked to capture wealth, which would be difficult to do in a health survey. Some countries use home ownership as a measure of wealth, but this would be more difficult to do in the United States. Some surveys ask how hard it is to get by on the amount of income a person or household earns, and others ask about unpaid bills. Yet either of these measures can apply to people at all income levels. Another possibility for retrospective studies is asking individuals how often, as a child, a family was worried about having enough money to cover the basics, such as food or housing. Braveman said that she and her colleagues will continue to work on measures of economic security, and she would like to see others do the same.
Singh responded to the same question by saying that the health surveys he uses do not contain a range of measures that could capture wealth and assets. One possible way to make up for this lack is to use data from the decennial census or the American Community Survey to look at area-based income and wealth indicators. Data about housing values, housing tenure, and mortgage payments can be linked to national health surveys at the record level or at the area level.
Occupation as an Economic Measure
Drewnowski also asked Dowler about the use of occupation in the United Kingdom as an economic measure. She replied that the same problem occurs in the United Kingdom as in the United States, with complex issues of wealth being reduced to a few simple measures. She also stated that economic insecurity is as complex a condition as income and wealth. “What may be economically insecure for one person of course doesn’t look so economically insecure for somebody else.” Qualitative research can uncover indicators of economic insecurity, but they include such measures as
the presence of parents, having good neighbors, kinship networks, and loan availability. These indicators are not always obvious. For example, poorer neighborhoods can have a stronger sense of social capital, as suggested by the observation that poorer people give away a greater proportion of their incomes than do richer people.
Frongillo observed that simply having more data may not be sufficient, because multiple measures interact in complex ways. “One of the challenges will be to get better information and also figure out how to use it.”
Education to Approximate Income
John Cook asked how to reconcile the idea that education cannot readily be associated with income given the premise of human capital development that the two are closely linked. Drewnowski pointed to the situation in Seattle, Washington, where 50 percent of the population has a college education but incomes do not necessarily correlate with that measure. “We have a very highly educated population and yet there is dissociation between education and incomes.” However he also pointed to a stepwise effect of education where simply completing college was protective of obesity. Singh explained that education does not explain all the differences in income or occupation. The error made in some research is to control for one indicator of SES and then attribute the remaining effect to a social or demographic characteristic. Braveman agreed that education is very important in determining life chances, but “it is not sufficient on its own. There are other dimensions as well.”
REFERENCES
Backett-Milburn, K. C., W. J. Wills, S. Gregory, and J. Lawton. 2006. Making sense of eating, weight and risk in the early teenage years: Views and concerns of parents in poorer socio-economic circumstances. Social Science and Medicine 63(3):624-635.
Braveman, P. A., C. Cubbin, S. Egerter, S. Chideya, K. S. Marchi, M. Metzler, and S. Posner. 2005. Socioeconomic status in health research: One size does not fit all. Journal of the American Medical Association 294(22):2879-2888.
Commission on Social Determinants of Health. 2008. Closing the gap in a generation: Health equity through action on the social determinants of health. Final report. Geneva: World Health Organization.
Coveney, J. 2005. A qualitative study exploring socio-economic differences in parental lay knowledge of food and health: Implications for public health nutrition. Public Health Nutrition 8(3):290-297.
Davis, A., D. Hirsch, and N. Smith. 2010. A minimum income standard for the UK in 2010. York, UK: Joseph Rowntree Foundation.
Marmot, M., J. Allen, P. Goldblatt, T. Boyce, D. McNeish, and M. Grady. 2010. Fair society, healthy lives: A strategic review of health inequalities in England, post-2010. London: The Marmot Review.
Martin, K. S., B. L. Rogers, J. T. Cook, and H. M. Joseph. 2004. Social capital is associated with decreased risk of hunger. Social Science and Medicine 58(12):2645-2654.
NCHS (National Center for Health Statistics). 2010. Health, United States, 2009: With special feature on medical technology. Hyattsville, MD: National Center for Health Statistics.
Orzechowski, S., and P. Sepielli. 2003. Net worth and asset ownership of households: 1998 and 2000. Current Population Reports, P70-88. Washington, DC: U.S. Census Bureau.
Singh, G. K. 2010. Trends in socioeconomic disparities in obesity across the life course, United States, 1976-2008. Unpublished analysis of 2003-2008 NHANES data. Presented at the Institute of Medicine Workshop on Understanding the Relationship Between Food Insecurity and Obesity, November 16, Washington, DC.
Singh, G. K., and M. D. Kogan. 2010. Childhood obesity in the United States, 1976-2008: Trends and current racial/ethnic, socioeconomic, and geographic disparities. A 75th Anniversary Publication. Health Resources and Services Administration. Maternal and Child Health Bureau. Rockville, MD: U.S. Department of Health and Human Services.
Singh, G. K., M. Siahpush, and M. D. Kogan. 2010a. Rising social inequalities in US childhood obesity, 2003-2007. Annals of Epidemiology 20(1):40-52.
Singh, G. K., M. Siahpush, and M. D. Kogan. 2010b. Neighborhood socioeconomic conditions, built environments, and childhood obesity. Health Affairs 29(3):503-512.
Singh, G. K., M. Siahpush, R. A. Hiatt, and L. R. Timsina. 2011. Dramatic increases in obesity and overweight prevalence and body mass index among ethnic-immigrant and social class groups in the United States, 1976-2008. Journal of Community Health 36(1):94-110.
Spicker, P. 2007. The idea of poverty. Bristol, UK: The Policy Press.


