
2
Changing the Conditions of Communities Where People Live
Three of the four coauthors of the paper commissioned by the Roundtable, A Time for Opportunity: Local Solutions to Reduce Inequities in Health and Safety, Tony Iton, Rachel Davis, and Larry Cohen, each presented descriptions of different aspects of the paper (the full text of the paper can be found in Appendix A). The three presentations were followed by questions and discussion with members of the Roundtable and workshop participants.
USING DATA TO DOCUMENT HEALTH DISPARITIES
Tony Iton spoke of the importance of having data to document the role of social determinants in health status. The availability of data allows the correlations between policies, institutional practices, and health disparities to be examined.
Death certificates are among the most comprehensive data sets available to public health researchers. For example, in California a death is not officially recorded until the local registrar of vital records, the county health officer signs the death certificate. Death certificates contain a great deal of useful information for researchers, including cause of death, age at death, race/ethnicity, and place of residence. These data reveal a narrative about the distribution of life and death across a community (Alameda County Public Health Department, 2008).
Iton used the data from over 400,000 death certificates from over a 45-year period in Alameda County, California, and compared life expectancies for whites and blacks. In 1960, whites had a life expectancy that
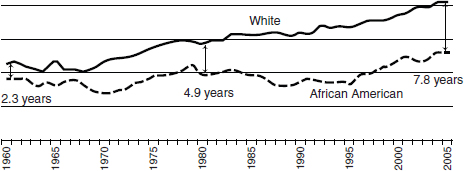
FIGURE 2-1 Health inequities by race and ethnicity in Alameda County, California.
was longer by about 2½ years. By 1980, that difference had doubled to a life expectancy that was almost 5 years longer for whites than for blacks. By 2005, that life expectancy difference had increased to nearly 8 years (Figure 2-1).
These data can also be mapped geographically according to where the premature deaths cluster at the county level. Looking again at the data from Alameda County, the neighborhoods with the longest average life expectancies (census tracts depicted in green) also had high rates of high school graduation, low rates of unemployment, relatively low rates of poverty, and high rates of home ownership. In Alameda County, neighborhoods with long life expectancies are about 50 percent white and 50 percent nonwhite (Figure 2-2).
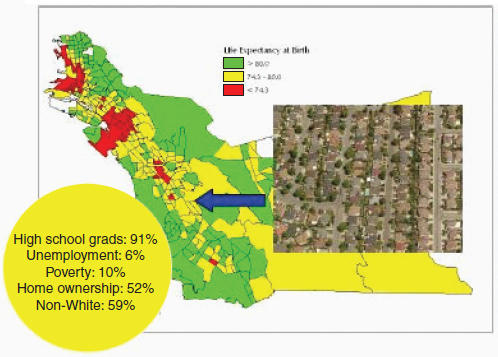
Figure 2-3 shows that the neighborhoods with a middle to long average life expectancy (census tracts depicted in yellow) have relatively high rates of high school graduation (81 percent) and low rates of unemployment, and about half the residents of this census tract are homeowners. This area is slightly less diverse, at nearly 60 percent nonwhite.
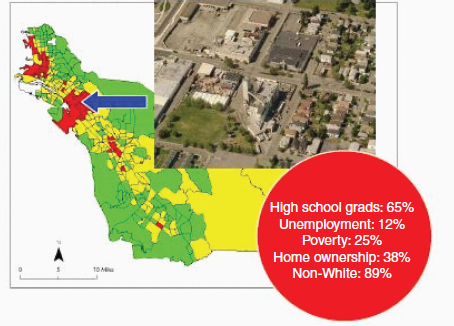
Figure 2-4 shows the neighborhoods in the county with the shortest average life expectancy (census tracts depicted in red). These neighborhoods also have relatively low rates of high school graduation and higher rates of unemployment, 25 percent of the residents live in poverty, and 90 percent of the residents are nonwhite. The West Oakland neighborhood pictured in Figure 2-4 reveals a heavily industrial area adjacent to a residential area.
By mapping census tract data showing poverty levels on top of these data, it is possible to conduct a simple bivariate analysis (looking at life expectancy on one axis and poverty on the other axis). This is what Iton calls “the true poverty tax.” This shows the true cost of being poor measured as the likelihood of premature death in Alameda County. Every level of income has a corresponding average life expectancy. In other words,
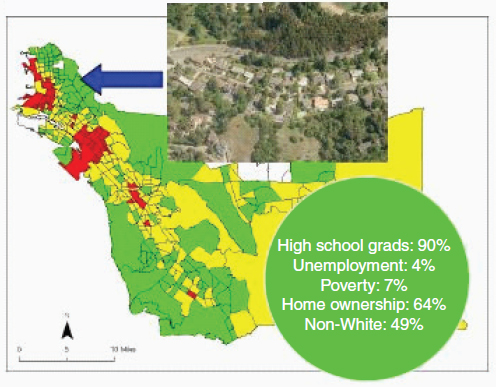
FIGURE 2-2 Neighborhoods in Alameda County with the longest average life expectancy.
income is a fairly good predictor of how long a person will live, because every level of income has a corresponding average life expectancy. This phenomenon holds not just for the poor, but also for the middle class.
In the San Francisco Bay Area of Northern California, Iton calculated that $12,500 buys an additional year of life. This so-called social gradient allows one to calculate the cost of a year of life in many U.S. communities, including New York City, Philadelphia, Cleveland, Los Angeles, Minneapolis–St. Paul, and Baltimore. In Baltimore, $10,000 buys an additional 3 years of life.
Using the Alameda County data, Iton and his colleagues in the county (Alameda County Public Health Department, 2008) produced a report concluding that the most important drivers of the differences in life expectancies were not related to access to health care. Rather, the social determinants of health lead to differences in life expectancy and other important health outcomes. How poor a person is should not determine how long that person lives.
Iton concluded by noting the importance of differentiating “health inequities” and “health disparities.” Health inequities are unnecessary, avoidable, and therefore, unjust, whereas health disparities are merely differences in health outcomes divorced from the context in which they are produced. One cannot properly understand health disparities without examining health and social inequity.
Rachel Davis next spoke about the importance of understanding the cumulative impact of living in a stressful environment and its long-term effects on health, particularly for population groups already experiencing inequities. She suggested a model to address the causes of the stressors; strengthen the social, economic, and physical environments of those neighborhoods; and empower those groups most affected by inequities. Investments in communities and efforts to learn to work across government levels and across sectors within a government are needed. In turn, this will lead to a sustainable system for promoting health equity.
Davis’s interest in creating and sustaining systems arose from her previous experience as a social worker. She told a story about working in a residential treatment facility for emotionally disturbed children. One day, an underdeveloped 4-year-old boy came to the facility, accompanied by paperwork saying that the boy had “failed” 14 foster placements in the past year. How can a 4-year-old fail in foster placement? In reality, the system is failing him, rather than the other way around.
Davis outlined a set of policy principles to guide efforts to reduce health disparities (see Appendix A). These principles were adapted from the Alameda County Public Health Department report (2008) described earlier by Iton. Related to these policy principles is the Two Steps Back framework (Figure 2-5). The model begins with a consideration of medical care.
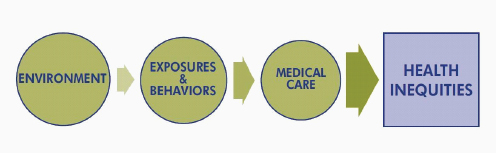
FIGURE 2-5 Two Steps Back framework.
Clearly, access to high-quality and culturally and linguistically appropriate care is critical to improved health outcomes. A wealth of data, including data from the Institute of Medicine (IOM) report Unequal Treatment: Confronting Racial and Ethnic Disparities in Health Care (IOM, 2003), document the disparities between people of color and whites in health outcomes that occur because of a lack of access to health care for people of color.
However, taking a step back, access to medical care alone is not enough to eliminate health disparities. Exposures and behaviors also need to be addressed. A wide variety of research indicates a set of nine behaviors and exposures that are linked to major causes of premature death: tobacco, diet and activity patterns, alcohol, microbial agents, toxic agents, firearms, sexual behavior, motor vehicles, and inappropriate drug use. Reducing one’s exposure to these behaviors reduces one’s risk of injury and illness.
Taking a second step back, the model suggests that exposures and behaviors are shaped by the environment in which a person lives. This offers an opportunity to prevent injuries and illness before their onset by considering the root factors (for example, poverty, racism, and other community factors). A focus on changing exposures and individual behaviors cannot begin until the root causes are addressed and the ways in which they play out in communities are altered. Quoting an earlier IOM report, Davis noted that “it is unreasonable to expect that people will change their behavior easily when so many forces in the social, cultural, and physical environment conspire against such change” (IOM, 2000, p. 4).
Looking more specifically at policy issues linked to negative outcomes in the environment, Davis suggested a number of examples: criminal justice laws, hiring practices, redlining in residential areas, and more recently, the subprime lending fiasco that disproportionately affected low-income communities and people of color.
Violence is another environmental stressor and more often occurs in low-income communities of color. For some young people, violence is a pervasive part of life. The National Center for Post Traumatic Stress estimates that as many as one-third of young people living in the United States are direct victims of violence (U.S. Department of Veterans Affairs, National Center for PTSD, 2011), and that as many as 43 percent of youth experience at least one form of trauma (for example, a school shooting, violence in the community, or physical or sexual abuse). Of those youth who have experienced a traumatic event, between 3 and 15 percent of girls and between 1 and 6 percent of boys will develop posttraumatic stress disorder (U.S. Department of Veterans Affairs, National Center for PTSD, 2011).
Targeted marketing of unhealthy products such as cigarettes and other forms of tobacco, high-alcohol-content malt liquor, and fast food is also a problem in low-income communities. A related problem is a lack of healthy
food options, for example, a lack of supermarkets in predominantly African American census tracts.
All of these policy issues shape the environment and have an impact on health. This means that a key means to affect health inequities is providing increased economic and educational opportunity to all, as well as access to health care in low-income communities.
Davis concluded her presentation by speaking about the relationship between health care, health care institutions, and community. The Allina Backyard Project is one such example. A second example is Kaiser Permanente’s efforts to start farmers’ markets to bring healthy food into low income communities. It is possible, then, to create a system that brings health care, health care institutions, and the community together in support of better health outcomes.
Larry Cohen, the final presenter and author, described the 32 recommendations from the paper (see Appendix A, page 61, for the complete list), but they can be clustered into four groups. The first is community recommendations. As previously discussed, this means looking at the community environment as a whole, understanding how the root factors that lead to health inequities play out, and emphasizing participation and feeling a sense of ownership and leadership at the community level. An example of this is a housing director who realized that by paying attention to issues like mold and lead paint in the housing stock, she could have an enormous positive impact on health. Similarly, having access to high-quality supermarkets, farmers’ markets, walking paths, and safe places to play makes a difference.
The second group consists of health care recommendations (Appendix A, p. 61). These include affordable and accessible health care that is available where people actually live. Technology can also be used to a stronger advantage; for example, cell phones have a 97 percent market penetration in most communities. Cell phones, then, could be used to provide a reminder about a health care appointment or to access health information. Promoting the medical home model is another recommendation.
The third group is systems recommendations (Appendix A, p. 61). These include recommendations such as using community mapping techniques and making health equity a component of every type of new policy, from transportation (providing reliable public transportation and safe places to walk) to housing and agriculture policies.
Cohen offered an example of the efforts of the head librarian in Salinas, California, a major source of the world’s lettuce crops. Unfortunately, Salinas also has a very high violent crime rate. In a unique effort to prevent violence among children and youth, the librarian went to every school in
Salinas and gave every child a library card. Library fines were also waived for a year. Three days later, the number of books checked out from the library had tripled. This is a very different way of thinking about health.
The fourth and final group consists of overarching recommendations (Appendix A, p. 61). The nation needs a national strategy, said Cohen, as well as high-level national leadership on health equity issues. Federal resources must support what is happening at the state and local levels, he emphasized.
Cohen concluded his remarks by describing the economics of prevention: According to the Prevention Institute and the Trust for America’s Health, with only a $10 annual per capita investment, for every dollar invested in community prevention efforts, by the second year, the community gets that dollar back and a return on investment of an additional dollar. By the fifth year, the return on investment is $5.60 per dollar invested. This provides support to the reasoning that prevention and community wellness efforts should be included in the 2009 federal stimulus package. This implies a very different approach to health and also implies that this is an ideal opportunity to promote health equity as a component of health care reform.
Roundtable member Bill Vega asked whether the real goal is to create better living conditions for people living in concentrated poverty neighborhoods. Tony Iton responded that in the United States, many other resources are linked to wealth. In other words, he said, “you can only purchase your way out of harm’s way with income in this country.” What is needed, then, are policies that decouple wealth from other critical resources, such as health care, dental care, and education.
Iton, who grew up in Canada, noted that Canada provides universal access to health care, universal access to dental care until age 12 years, and subsidized access to education all the way through college. These are policies that decouple wealth from access to critical protective resources. Cohen added that what the paper is really trying to do is promote a different way of thinking about how to pay attention to the community environment to keep people healthy.
Workshop participant Anne Kubisch wondered whether there is scientific support for the unique role of health as the driver of the links between structural issues such as institutional racism and the individual. In particular, the idea of reframing poverty as a public health outcome is a powerful one. In response, Cohen noted that health is a concept that really “hits home” with people. At the same time, the U.S. population does not have a sense that health is an individual right, although this is not the case in Brit-
ain, for example, where health is seen to be an individual right. Iton noted the effectiveness of using life expectancy data to look at the injustice of poverty. He believes that using the life expectancy data supports the argument that poverty, educational attainment, and other social determinants affect access to health care and overall health status.
The final question referred to the federal health care reform efforts that got under way in 2009. The participant wondered who will see the savings when the reform is enacted. Cohen noted that a system to track the spending is needed, but that some of the savings will go back to the individual, whereas some of it will go back to the government. This is the thinking behind the Wellness Trust, which is described in several of the pieces of legislation. The funding would come into the trust from a variety of places and would be allocated to a variety of places.
Alameda County Public Health Department. 2008. Life and death from unnatural causes: Health and social inequity in Alameda County. Oakland, CA: Alameda County Public Health Department. http://www.acphd.org/AXBYCZ/Admin/Datareports/00_2008_full_report.pdf (accessed April 28, 2011).
Institute of Medicine. 2000. Promoting health: Intervention strategies from social and behavioral research. Washington, DC: National Academy Press.
Institute of Medicine. 2003. Unequal treatment: Confronting racial and ethnic disparities in healthcare. Washington, DC: The National Academies Press.
U.S. Department of Veterans Affairs, National Center for PTSD. PTSD in children and teens.http://www.ptsd.va.gov/public/pages/ptsd-children-adolescents.asp (accessed May 25, 2011). Washington, DC: U.S. Department of Veterans Affairs, National Center for PTSD.


