
Transportation is a critical component of sustained economic growth in industrialized societies. Globally, about 94 percent of transportation fuels used are derived from crude oil. As the largest consumer of crude oil in 2009, the United States was responsible for about 27 percent of oil used worldwide (EIA, 2010f). The large quantities of oil consumed in the United States (about 19 million to 21 million barrels per day in 2005-2009) contribute to two major problems: energy security and greenhouse-gas1 (GHG) emissions. With respect to energy security, 52 to 60 percent of oil consumed in the United States was imported in 2005-2009 (EIA, 2009a). The use of petroleum-based fuel in transportation contributes about 30 percent of all carbon dioxide (CO2) emissions in the United States (EPA, 2010a).
The U.S. Congress enacted the Energy Independence and Security Act (EISA) in 2007 (110 P.L. 140) “to move the United States toward greater energy independence and security, to increase the production of clean renewable fuels, to protect consumers, to increase the efficiency of products, buildings, and vehicles, to promote research on and deploy GHG capture and storage options, and to improve the energy performance of the Federal Government, and for other purposes.” A subtitle within EISA entitled the Renewable Fuel Standard (RFS) mandates the amounts of biofuels to be consumed each year. At the request of the U.S. Congress, the National Research Council convened a committee to assess the economic and environmental impacts of increasing biofuel production. (See Appendix A for statement of task and Appendix B for committee membership.) In addition to drawing on its own expertise, the committee solicited input from many experts in federal agencies, academia, trade associations, and nongovernmental organizations in a series of open meetings and in writing to fulfill the statement of task. (See Appendix C for a list of presentations to the committee.) Box 1-1 shows how different
______________
1 Greenhouse gases are gases in the atmosphere that absorb and emit radiation within the thermal infrared range, and hence produce a warming effect. The Earth’s natural “greenhouse effect” makes the surface temperature of the planet suitable for living organisms. However, a multitude of evidence shows that emissions of large quantities of greenhouse gases from human activities (for example, burning fossil fuels) have significantly intensified the greenhouse effect (NRC, 2010a). The main greenhouse gases in the Earth’s atmosphere are water vapor, CO2, methane, nitrous oxide, and ozone.
BOX 1-1
Structure of the Report
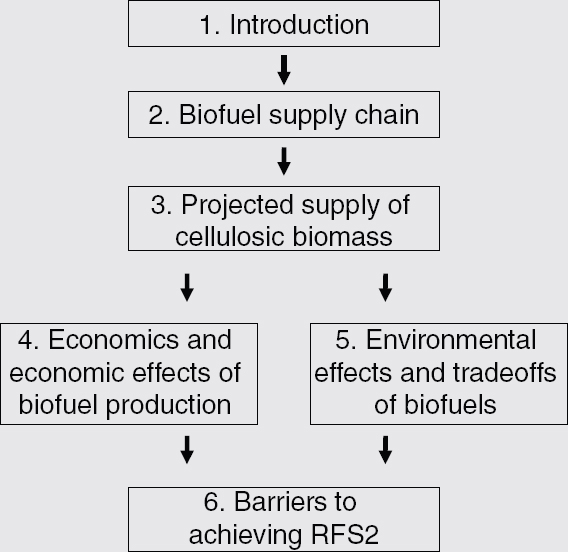
FIGURE 1-1 Structure of the report.
- Introduction.
- A quantitative and qualitative description of biofuels currently produced.
- A qualitative and quantitative description of biofuels that could be produced in different regions of the United States, including a review of estimates of potential biofuel production levels using RFS-compliant feedstocks from U.S. forests and farmland.
- Estimates of the per-unit costs of biofuel feedstock production.
- A quantitative description of biofuels projected to be produced and consumed by 2022 in the United States under different policy scenarios, including scenarios with and without current Renewable Fuel Standard (RFS) and biofuel tax and tariff policies, and considering a range of future fossil energy and biofuel prices, the impact of a carbon price, and advances in technology.
- An assessment of the effects of current and projected levels of biofuel production, and the incremental impact of additional production, on the number of U.S. acres used for crops, forestry, and other uses, and the associated changes in the price of rural and suburban land.
- A review of economic model results and other estimates of the relative effects of the RFS, biofuel tax and tariff policy, production costs, and other factors, alone and in combination, on biofuel and petroleum refining capacity, and on the types, amounts, and prices of biofuel feedstocks, biofuels, and petroleum-based fuels (including finished motor fuels) produced and consumed in the United States.
- An analysis of the effects of current and projected levels of biofuel production, and the incremental impact of additional production, on U.S. exports and imports of grain crops, forest products, and fossil fuels and on the price of domestic animal feedstocks, forest products, and food grains.
- An analysis of the effect of projected biofuel production on federal revenue and spending, through costs or savings to commodity crop payments, biofuel subsidies, and tariff revenue.
- An analysis of the pros and cons of achieving legislated RFS levels, including the impacts of potential shortfalls in feedstock production on the prices of animal feed, food grains, and forest products, and including an examination of the impact of the cellulosic biofuel tax credit established by Sec. 15321 of the Food, Conservation, and Energy Act of 2008 on the regional agricultural and silvicultural capabilities of commercially available forest inventories. This analysis explores policy options to maintain regional agricultural and silvicultural capacity in the long term, given RFS requirements for annual increases in the volume of renewable fuels, and includes recommendations for the means by which the federal government could prevent or minimize adverse impacts of the RFS on the price and availability of animal feedstocks, food, and forest products, including options available under current law.
- An analysis of the effect of current and projected future levels of biofuel production and use, and the incremental impact of additional production, on the environment. The analysis considers impacts due to changes in land use, fertilizer use, runoff, water use and quality, GHG and local pollutant emissions from vehicles utilizing biofuels, use of forestland biomass, and other factors relevant to the full life-cycle of biofuel production and use. The analysis summarizes and evaluates various estimates of the indirect effects of biofuel production on changes in land use and the environmental implications of those effects. A comparison of corn ethanol versus other biofuels and renewable energy sources for the transportation sector based on life-cycle analyses, considering cost, energy output, and environmental impacts, including GHG emissions.
- An analysis of barriers to achieving the RFS requirements.
components of the statement of task are addressed in the six chapters of the report and the interconnectedness of the different chapters. This chapter provides a brief history of U.S. biofuel policies, goals, and production. It highlights some of the economic and environmental opportunities and concerns raised regarding U.S. biofuel policy.
Throughout this report, the committee uses the term “biofuels” to specify liquid fuels for transportation derived from biological sources. “Bioenergy,” which encompasses all forms of energy for electricity or heat generation and for transportation produced from biological sources, is a broader term than biofuels. Recognizing that biomass can be used to produce various forms of energy, the term “bioenergy feedstock” is used throughout the report. Quantities of bioenergy feedstock are reported in dry weight. A glossary of terms and list of select acronyms and abbreviations are provided in Appendixes D and E. With the exception of GHG emissions, standard units that are commonly used in the United States are used throughout the report. Conversion factors to International Systems of Units are in Appendix F. GHG emissions are expressed in tonnes of CO2 equivalent (CO2 eq), the unit commonly used by the Intergovernmental Panel on Climate Change.
Changing Demand for Transportation Energy
Since World War II, petroleum consumption from transportation in the United States has increased by at least four-fold. The transportation sector required just over 3 million barrels per day of petroleum in 1949; by 2009, it consumed about 13 million barrels per day (EIA, 2010b). The Energy Information Administration (EIA) projected that U.S. demand for transportation fuel will reach about 15 million barrels per day by 2022 and 16 million barrels per day by 2035 (EIA, 2010a). The projections suggest that increase in demand is expected to slow down. Petroleum consumption is not likely to increase in lockstep with population growth because of projected improvements in energy efficiency and projected increases in the use of biofuels as transportation fuel (EIA, 2010a). Therefore, although motor gasoline consumption increased from 7.4 million barrels per day in 1978 to 9.0 million barrels per day in 2008, EIA projected that consumption will peak at 9.5 million barrels per day in 2012 and eventually decline to 9.1 million barrels per day by 2035 (EIA, 2009b, 2010a).
Increase in U.S. demand for transportation fuel is projected to slow down in the next 25-30 years, but global demand is likely to continue to grow. World demand for petroleum increased from 63 million barrels per day in 1980 to 85.8 million barrels per day in 2008 (EIA, 2010e). Much of that growth took place in developing countries. Demand in OECD (Organisation for Economic Co-operation and Development) countries2 increased by less than 6 million barrels per day, while demand in non-OECD countries nearly doubled, from 21 million barrels per day to 38 million barrels per day. In 1980, non-OECD countries’ petroleum consumption was equivalent to just over 50 percent of that in OECD countries; by 2008, it had reached 80 percent. EIA projected transportation energy use to increase by 2.6 percent per year from 2007 to 2035 in non-OECD countries, surpassing OECD transportation energy consumption in 2025. World demand for petroleum in 2035 is projected to be 111 million barrels per day (EIA, 2010e).
______________
2 OECD member countries as of March 2011 were Australia, Austria, Belgium, Canada, Chile, Czech Republic, Denmark, Estonia, Finland, France, Germany, Greece, Hungary, Iceland, Ireland, Israel, Italy, Japan, Korea, Luxembourg, Mexico, the Netherlands, New Zealand, Norway, Poland, Portugal, Slovak Republic, Slovenia, Spain, Sweden, Switzerland, Turkey, the United Kingdom, and the United States.
Historic Interest in Biofuels
Petroleum is the dominant source of motor fuel today, but this was not the case when internal combustion engines and automobiles were first invented. Indeed, biofuels have been an energy source for vehicle engines since the development of the automobile. Henry Ford’s first vehicle in 1896 ran on pure ethanol, and his Model T, produced in 1908, could use ethanol, gasoline, or a blend of the two (EIA, 2008). Early models of the diesel engine also could operate on vegetable oil (Knothe, 2001). The United States used 50-60 million gallons of ethanol per year as motor fuel while engaged in World War I (EIA, 2008). During World War II, the U.S. Army built an ethanol plant in Omaha, Nebraska, to supplement its fuel needs (EIA, 1995), and experiments with blends of petroleum diesel and diesel from vegetable and cottonseed oils were conducted (Knothe, 2001).
In the nascent years of the automobile industry, before the mass production of vehicles for personal use, ethanol contended to be the motor fuel of choice. Unlike gasoline, ethanol did not cause engine knock, and ethanol engines had higher compression ratios (Carolan, 2009). However, gasoline had several advantages over ethanol that caused it to be more successful before World War I and to be wholly dominant in the marketplace by the 1930s. Gasoline was a byproduct of kerosene production, an industry that was already well developed but that was beginning to lose its market share to electrical lighting powered by coal. There were over 100 kerosene refineries in the United States at the beginning of the 20th century with an established, decentralized distribution network (Melaina, 2007). As a less valuable byproduct of kerosene, gasoline could use this network. There was an abundance of gasoline—7 million barrels of gasoline were produced in 1905—but only 600,000 barrels were used to fuel automobiles. Gasoline was often used as a solvent but was frequently disposed of in rivers if it was not economical to distribute (Melaina, 2007). Therefore, there was a plentiful supply of gasoline fuel to meet growing demand when Ford began to produce Model T cars quickly and cheaply; though rudimentary, the infrastructure to deliver the fuel was already in place. Later, the alleviation of engine knock through the inclusion of tetraethyl lead in gasoline and an increase in compression ratios removed the few remaining technological barriers to using gasoline in vehicle engines (Dimitri and Effland, 2007; Carolan, 2009).
In contrast, fuel from corn was not as abundant as gasoline, and the distribution system for grain commodities was not congruent with fuel distribution (Dimitri and Effland, 2007). High corn prices in much of the early 20th century also made ethanol less cost competitive with gasoline (Giebelhaus, 1980; Dimitri and Effland, 2007). Later agricultural mechanization and favorable subsidies expanded corn acres at the expense of other possible ethanol feedstocks (Carolan, 2009). Ethanol’s competitiveness also was reduced by alcohol tax during and following the Civil War until the tax was repealed in 1906 (Giebelhaus, 1980; Dimitri and Effland, 2007; Carolan, 2009). A movement emerged in the 1930s to produce fuel and other industrial products not only from corn but also from other crops high in sugar and starch such as sugarcane, Jerusalem artichokes, and sweet potatoes (Giebelhaus, 1980; Finlay, 2003). However, gasoline was firmly established as the primary abundant and cost-effective vehicle fuel by that time.
From the 1940s through the 1960s, the United States continued to increase petroleum production, which met most of domestic demand. Biofuel production was largely abandoned. However, domestic petroleum production peaked in 1970 at 9.6 million barrels per day while demand continued to increase (EIA, 2009b). Though just over 20 percent of U.S. consumption was met with imports in 1970, the United States was importing over 40 percent of its petroleum needs by the second half of the decade (EIA, 2009b). That reliance on foreign oil was acutely felt in the form of gasoline shortages and increased retail prices
when the Organization of the Petroleum Exporting Countries (OPEC) embargoed oil in 1973 and when political unrest curtailed oil production in Iran in 1978. Those disruptions led to increased exploration for domestic fossil fuel reserves and also renewed interest and investment in biofuels (Duffield et al., 2008).
Policies to Encourage Biofuel Production
Spurred by concerns about energy security, the federal government included a tax incentive in the Energy Tax Act of 1978 (95 P.L. 619) in the form of an exemption for ethanol blends of at least 10-percent ethanol by volume from the $0.04 per gallon federal motor fuels tax (Table 1-1). Because ethanol was only 10 percent of the total volume, the $0.04 tax exemption on the blend amounted to a subsidy of $0.40 per gallon of ethanol. The Energy Security Act of 1980 offered insured loans to small ethanol plants (96 P.L. 294). This act also instructed the Secretary of Agriculture and the Secretary of Energy to develop a plan to increase ethanol production to the equivalent of 10 percent of the total U.S. gasoline consumption by 1990 (Duffield et al., 2008). Although interest in biofuels waned when the
| Year | Legislation | Provision |
| 1978 | Energy Tax Act of 1978 | $0.40 per gallon of ethanol tax exemption on the $0.04 gasoline excise tax |
| 1980 | Crude Oil Windfall Profit Tax Act and the Energy Security Act | Promoted energy conservation and domestic fuel development |
| 1982 | Surface Transportation Assistance Act | Increased tax exemption to $0.50 per gallon of ethanol and increased the gasoline excise tax to $0.09 per gallon |
| 1984 | Tax Reform Act | Increased tax exemption to $0.60 per gallon of ethanol |
| 1988 | Alternative Motor Fuels Act | Created research and development programs and provided fuel economy credits to automakers |
| 1990 | Omnibus Budget Reconciliation Act | Ethanol tax incentive extended to 2000 but decreased to $0.54 per gallon of ethanol |
| 1990 | Clean Air Act amendments | Acknowledged contribution of motor fuels to air pollution – oxygen requirements for motor fuels |
| 1992 | Energy Policy Act | Tax deductions allowed on vehicles that could run on E85 |
| 1998 | Transportation Efficiency Act of the 21st Century | Ethanol subsidies extended through 2007 but reduced to $0.51 per gallon of ethanol by 2005 |
| 2004 | American Jobs Creation Act | Changed the mechanism of the ethanol subsidy to a blender tax credit instead of the previous excise tax exemption Extended the ethanol tax exemption to 2010 |
| 2005 | Energy Policy Act | Established the Renewable Fuel Standard starting at 4 billion gallons in 2006 and rising to 7.5 billion in 2012 Eliminated the oxygen requirement for gasoline, but failed to provide MTBE legal immunity |
| 2007 | Energy Independence and Security Act | Established a Renewable Fuel Standard totaling 35 billion gallons of ethanol-equivalent biofuels and 1 billion gallons of biodiesel by 2022 |
SOURCE: Tyner (2008). Reprinted with permission from the American Institute of Biological Sciences.
price volatility of oil lessened in the 1980s, blenders’ tax exemptions were modified and continued throughout the decade, and a tariff was established to prevent foreign ethanol producers from taking advantage of the credits. Despite these policies, the use of ethanol in motor fuels did not achieve the 10-percent target.
In the 1990s, the federal government began to look to ethanol as a means of combating air pollution from vehicle emissions. The Clean Air Act amendments of 1990 created mandates for oxygenates in gasoline to address carbon monoxide and ozone problems in urban areas (101 P.L. 549). This mandate increased demand for ethanol, but a petroleum derivative, methyl tertiary butyl ether (MTBE), was a more cost-effective oxygenate (Duffield et al., 2008). The Energy Policy Act of 1992 (102 P.L. 486) amended the motor fuels tax exemption and the blenders’ credit to improve ethanol’s ability to compete with MTBE. From 1992 to 1999, annual U.S. consumption of ethanol in gasoline-equivalent gallons increased from 719 million to 979 million. Almost all of the consumption and the growth in consumption was from using ethanol as an oxygenate (EIA, 2009b), which continued after the phase-out of MTBE use that began in the late 1990s because of concerns about water-quality contamination and state regulations prohibiting its use in motor fuels.
In the 2000s, federal legislation began to explicitly support biofuels to provide opportunities for agricultural and rural development. The Farm Security and Rural Investment Act of 2002 (107 P.L. 171) was the first farm bill to contain a title devoted to energy. It authorized a number of programs in support of biofuels, including grants for converting biomass into energy, programs to encourage farmers to increase use of renewable energy, and grants to promote public outreach about biodiesel. The 2002 farm bill also authorized continued funding for the Biomass Research and Development Initiative, which had been approved in an earlier bill, and codified the Bioenergy Program within the U.S. Department of Agriculture’s Commodity Credit Corporation. The Bioenergy Program made payments available to biofuel producers who increased their level of production over the previous year (Duffield et al., 2008).
The 2008 farm bill, called The Food, Conservation and Energy Act (110 P.L. 246), included several provisions that encourage biomass production for fuels. Under the farm bill, the Biomass Crop Assistance Program (BCAP) and the Bioenergy Program for Advanced Biofuels were established. BCAP provides financial assistance for crop establishment, annual payments for crop production, and subsidies for collecting and delivering biomass material to production facilities. Biomass production has to be within an economically practical distance from conversion facilities to receive payments. The Bioenergy Program for Advanced Biofuels aims “to support and ensure an expanding production of advanced biofuels by providing payments to eligible advanced biofuel producers in rural areas” (USDA-RD, 2010). The program provides payments to eligible producers of fuel derived from renewable biomass, other than corn grain. The farm bill also includes a provision for the U.S. Department of Agriculture and the U.S. Department of Energy to award grants competitively to eligible entities to research, develop, and demonstrate biomass projects through the Biomass Research and Development Initiative.
In addition to support for biomass feedstock and biofuel production, the farm bill establishes a producer credit of $1.01 for each gallon of cellulosic biofuel until December 31, 2012. It modifies the Volumetric Ethanol Excise Tax Credit (VEETC) of $0.51 per gallon of ethanol blended into gasoline to companies that blend gasoline with ethanol; the VEETC, which was established by the American Jobs Creation Act of 2004, replaced the original excise tax exemption program from 1978 that was limited to specific blends with a tax credit based on the volume of ethanol consumed (a volume-based credit for biodiesel was also introduced) (Koplow, 2007; Solomon et al., 2007). This farm bill reduced
the VEETC to $0.45 per gallon of ethanol blended into gasoline in the first calendar year that EPA certifies that 7.5 billion gallons of renewable fuel have been blended into gasoline. The farm bill also extended the $0.54 per gallon duty on imported ethanol through December 31, 2010. The expiration date of the import duty was pushed back to December 31, 2011, by the Tax Relief, Unemployment Insurance Reauthorization, and Job Creation Act of 2010 (111 P.L. 312).
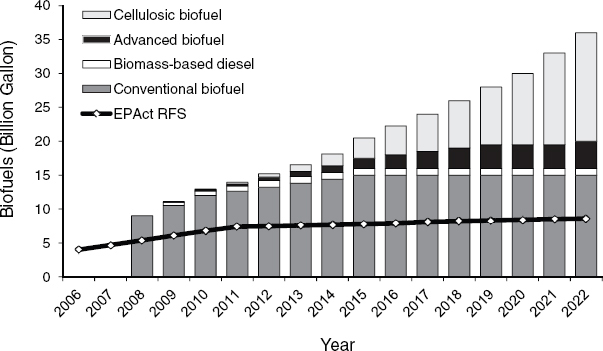
The steep rise in oil prices, growing concerns over energy security and GHG emissions, and the desire to support domestic farm and rural economies combined to reinvigorate support for biofuels in the mid-2000s. The Energy Policy Act (EPAct) of 2005 (109 P.L. 58) established a national Renewable Fuel Standard (RFS) that mandated an increased use of renewable fuels from 4.0 billion gallons per year in 2006 to 7.5 billion gallons per year in 2012. EISA of 2007 included a subtitle that amended RFS in EPAct and increased the volumes of renewable fuels to be phased in substantially. (RFS under EISA is referred to as RFS2 hereafter.) Mandated volumes of renewable fuel consumption began at 9 billion gallons in 2008 and will reach 36 billion gallons of biofuels (35 billion gallons of ethanol equivalent and 1 billion gallons of biodiesel) in 2022 (Figure 1-2). The term “renewable fuel” was defined as “fuel that is produced from renewable biomass and that is used to replace or reduce the quantity of fossil fuel present in a transportation fuel” (110 P.L. 140). RFS2 is an energy-equivalent standard because EPA interpreted the mandated volumes as ethanol-equivalent in its final rule (EPA, 2010a) to account for different energy contents of various possible biofuels (Table 1-2).
| Fuel Type | Equivalence Value |
| Ethanol | 1.0 |
| Biodiesel (mono-alkyl ester) | 1.5 |
| Butanol | 1.3 |
| Nonester renewable diesel | 1.7 |
| Biogas | 1.0 |
| Electricity | 1.0 |
NOTE: The energy content of pure ethanol is about 76,000 Btu per gallon (lower heating value).
SOURCE: EPA (2010b).
In addition to increasing the required volumes, RFS2 divides the total renewable fuel requirement into four categories:
- Conventional biofuel that is ethanol derived from corn starch. Conventional biofuel produced from facilities that commenced construction after December 19, 2007, would have to achieve a threshold of at least 20-percent reduction in GHG emissions compared to petroleum-based gasoline and diesel to qualify as a renewable fuel under RFS2.
- Advanced biofuels that are renewable fuels other than ethanol derived from corn starch and that achieve life-cycle GHG reduction threshold of at least 50 percent. Advanced biofuels can include ethanol and other types of biofuels derived from such renewable biomass as cellulose, hemicellulose, lignin, sugar, or any other starch other than corn starch, biomass-based diesel, and coprocessed renewable diesel.3
- Cellulosic biofuels that are renewable fuels derived from any cellulose, hemicellulose, or lignin from renewable biomass and that achieve life-cycle GHG reduction threshold of at least 60 percent. In general, cellulosic biofuels also qualify as renewable fuels and advanced biofuels.
- Biomass-based diesel, including biodiesel made from vegetable oils or animal fats and cellulosic diesel, that achieves life-cycle GHG reduction threshold of at least 50 percent—for example, soybean biodiesel and algal biodiesel. Coprocessed renewable diesel is excluded from this category.
The four renewable-fuel categories are nested within an overall mandate. There actually is no mandate for corn-grain ethanol, but a maximum quantity of conventional biofuels that can be filled with corn-grain ethanol. If any advanced or cellulosic biofuel become less expensive than corn-grain ethanol, the mandate for conventional biofuel could be filled entirely with advanced or cellulosic biofuel. RFS2 also requires that all renewable fuels be made from feedstocks that meet a new definition of renewable biomass. EISA’s definition of renewable biomass incorporates land restrictions for planted crops, crop residue, planted trees and tree residue, slash and precommercial thinnings, and biomass from wildfire areas. Detailed definitions and EPA’s interpretations of the terms are found in Regulation of Fuels and Fuel Additives: Changes to Renewable Fuel Standard Program; Final Rule (EPA, 2010b, pp. 14691-14697). A brief version of EISA’s renewable biomass definition and land restrictions is included below.
______________
3 Coprocessed renewable diesel refers to diesel made from renewable material mixed with petroleum during the hydrotreating process.
- Planted crops or crop residues that were cultivated at any time prior to December 19, 2007, on land that is either actively managed or fallow, and nonforested.
- Planted trees and tree residue from actively managed tree plantations on nonfederal land cleared at any time prior to December 19, 2007, including land belonging to an Indian tribe or an Indian individual, that is held in trust by the United States or subject to a restriction against alienation imposed by the United States.
- Slash and precommercial thinnings from nonfederal forestlands, including forestlands belonging to an Indian tribe or an Indian individual, that are held in trust by the United States or subject to a restriction against alienation imposed by the United States.
- Biomass obtained from the immediate vicinity of buildings and other areas regularly occupied by people, or of public infrastructure, at risk from wildfire.
- Algae.
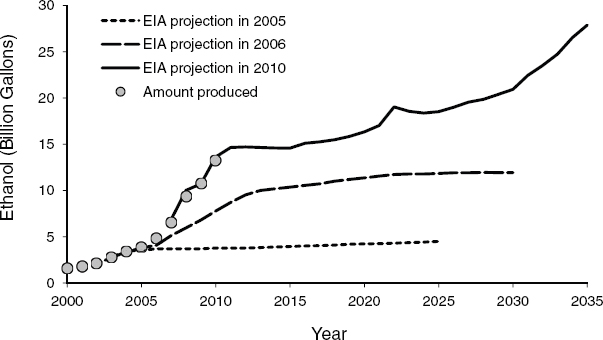
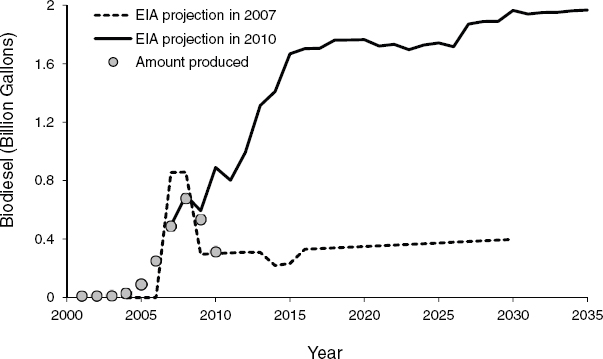
Figures 1-3 and 1-4 show the influence of energy policies on the projected production of biofuels over time. Before the enactment of EPAct in 2005, production of fuel ethanol was projected to reach a plateau by 2005. In 2006, EIA projected production of fuel ethanol to increase from 4 billion gallons in 2005 to about 11 billion gallons in 2012. As of 2009, the amounts of fuel ethanol produced each year from biomass closely approximated EIA’s 2009 projections (EIA, 2009a,b). In 2010, 13.2 billion gallons of ethanol, mostly from corn grain, were produced and consumed in the United States (EIA, 2010d). Biodiesel production from vegetable oil or animal fats peaked in 2008 at 678 million gallons (EIA, 2010b) but fell to 330 million gallons in 2010 (EIA, 2010c).4 As in the case of EPAct, EISA included provisions for biofuels research and development and for research, development, and demonstration related to biofuel distribution and advanced biofuel infrastructure. In addition to federal energy policies, some states mandate a percentage of ethanol be blended in all gasoline sold (Duffield et al., 2008).
Although the federal government has enacted many policies that support biofuel production since 1978, the rapid increase in production of the 2000s has brought biofuels under increased scrutiny. Economic and environmental concerns, such as effects on food prices, land use, and air pollution, have been raised. However, directly connecting repercussions from biofuel policy to measurable effects has many uncertainties because of complex interrelationships between effects and the paucity of information at appropriate scales. In part because of these concerns, the U.S. Congress requested the National Research Council to convene an expert committee to examine the economic and environmental effects of increasing biofuel production. The next two sections summarize the potential economic and environmental consequences of achieving RFS that have been raised since the enactment of RFS.
______________
4 Much of the biodiesel produced in the United States was exported before the market downturn. Biodiesel consumption in the United States was 316 million gallons in 2008 and 222 million gallons in 2010 (EIA, 2010b,c).
DATA SOURCES: EIA (2005, 2010a,b).
DATA SOURCES: EIA (2005, 2006, 2010a,b); NBB (2011).
Potential Economic Consequences of Achieving RFS2
The United States imports large quantities of oil from overseas each year. In 2008 when crude oil prices fluctuated widely, the United States spent $10-$38 billion each month on overseas oil imports. In 2010, oil product imports amounted to 17.4 percent of all U.S. imports. (Additional information on economics of petroleum-based fuel is available in Appendix G.) Domestic production of biofuels presents an opportunity to reduce oil importation. However, cellulosic biofuels are not a cost-competitive source of energy compared to petroleum-based fuels, even in most leading biofuel-producing countries (Kojima et al., 2007; Steenblik, 2007). Corn-grain ethanol could not compete with fossil fuels in the U.S. marketplace without mandates, subsidies, tax exemptions, and tariffs until the oil-price increase in the recent years. This lack of competitiveness raises questions about the use of government resources to support biofuels. Not only does the federal government expend resources in its subsidized loans and grants for development of the industry, but it also forgoes revenue in the form of tax credits for fuel blenders.
Because feedstocks for corn-grain ethanol and soybean biodiesel are feed and food crops, competition between the biofuel industry and food and feedstuff markets in the United States also has been raised as a concern. The diversion of corn to biofuel production was widely criticized in 2008 as a cause of the spike in food prices (Lipsky, 2008; Mitchell, 2008; Rosegrant, 2008; Timmer, 2009), even though U.S. corn production increased and exports remained constant (USDA-ERS, 2010). Several organizations representing livestock producers who purchase agricultural commodities for animal feed also suggested that price spikes in animal feed were linked to increasing biofuel production. They expressed concern that high feed prices would remain as biofuel production using food-based feedstocks increases and that the profitability of their livestock operations would be negatively affected (Brandenberger, 2010; Lobb, 2010).
Some livestock producer organizations contend that competition for feedstock between fuel and animal feed can be at least partially alleviated by using grass, forage, and coproducts from biofuel production, such as dried distiller grains and soybean meal as feed. However, other producers are concerned that those feedstuffs would affect the quality of their products (Stillman et al., 2009; Jonker, 2010). Pork and poultry producers cannot substitute forage or grass for corn, and distillers grains can only be used in small percentages with nonruminants (Brandenberger, 2010; Lobb, 2010; Spronk, 2010). Scholars contended that biofuel is a contributing, but not the only, factor that drives food and animal feed prices. Rather, food and animal feed prices are driven by a combination of supply and use, exchange rates and macroeconomic factors, and linkages between energy and agricultural markets (Abbott et al., 2009, 2011; Baffes and Haniotis, 2010; Trostle et al., 2011).
Cellulosic bioenergy feedstock—for example, crop and forest residues, perennial grasses, urban-derived waste materials, and other sources—is less likely to directly compete with food and animal feed. However, some cellulosic feedstocks have other uses. For example, representatives of the forestry and paper industries are concerned that the RFS2 mandate and other incentive policies distort wood-product markets (Noe, 2010). They worried that a growing demand for wood products for biofuel production would increase costs for their industries and that incentives favorable to biofuels will put them at a further disadvantage for purchasing timber. Reduced competitiveness would, in turn, cause job losses in the forestry and paper mill sectors (Noe, 2010). However, forest owners suggested that a developing biofuel industry can introduce new viable markets for forest biomass and encourage conservation of working forests (Tenny, 2010).
Potential Environmental Consequences of Achieving RFS2
Early interests in displacing fossil fuels with biofuels stem from desire to improve energy security. Potential GHG benefits compared to fossil fuels have been an additional motivation for federal support (EPA, 2002; Ribeiro et al., 2007). However, critics assert that the GHG benefits of biofuels might have been overstated. If all direct and indirect emissions associated with biofuel production are included in GHG accounting, their GHG benefits might not be as high as previously believed; some suggest that production and use of biofuels could result in higher GHG emissions than that of petroleum-based fuels (Fargione et al., 2008; Searchinger et al., 2008; Plevin et al., 2010).
Growing biomass for fuels will likely increase the demand on U.S. agricultural and forestry output. The external costs or unintended consequences of agriculture, such as depletion of natural resources and environmental degradation, and the need to mitigate those external costs, have been recognized and documented (NRC, 2010b). For example, water scarcity is a key concern as many aquifers in the United States have been pumped extensively to provide water for agriculture and other competing uses (NRC, 2010b; USGS, 2010). Soil erosion from agricultural land and transport of dissolved nutrients from fertilizers that were not taken up by plants have contributed to reduced water quality (NRC, 2010b).
The question for estimating environmental consequences of achieving RFS2 is how much bioenergy feedstock production and processing will add to existing concerns, particularly the nation’s consumptive water use, water quality, and soil erosion (NRC, 2010b). Some critics assert that expanding corn-grain ethanol production would further degrade the environment (Donner and Kucharik, 2008). Others suggest growing a mix of bioenergy crops and using appropriate management practices could achieve the multiple goals of providing biomass for food, feed, and fuel and enhancing the natural resource base simultaneously (Robertson et al., 2008).
Purpose of the Study
The purpose of this study is to provide an independent assessment of the economic and environmental benefits and costs associated with achieving RFS2 that have been raised. The committee distinguishes between the opportunities that biofuels can provide—which studies have suggested could provide many benefits if done right (Tilman et al., 2009)—and the effects of meeting the consumption mandate of 36 billion gallons of different types of biofuels by 2022; this study focuses on latter effects. Although the committee was asked to discuss “means by which the federal government could prevent or minimize adverse impacts of the RFS on the price and availability of animal feedstocks, food, and forest products, including options available under current law” (Box 1-1), it was not asked to discuss whether or how RFS2 could be modified to better achieve energy security and GHG reduction. The committee also was not asked to compare carbon mitigation potential of using biomass for fuels against using biomass for other purposes. Thus, alternative uses of biomass such as biopower for electric vehicles or combined coal and biomass for fuel and their effects on energy security and GHG emissions are not discussed.
This study relies on data from literature published up to the time of its preparation. Therefore, some topics are discussed in more detail than others depending on the amount of published literature on each subject. Fuel ethanol is discussed more frequently than other types of biofuels for two additional reasons:
- Under RFS2, over 40 percent of biofuels to be consumed to meet the mandate in 2022 will be conventional biofuel, most likely corn-grain ethanol. In addition, consumption mandates for advanced biofuels and cellulosic biofuels could be met, at least in part, by ethanol.
- Some issues, such as compatibility with existing infrastructure, are only applicable to fuel ethanol.
When possible, the report describes empirical evidence for the economic and environmental effects of increasing U.S. biofuel production. However, biofuel production is a developing industry, which has complex interactions with other sectors including agriculture, forestry, transportation, and energy. In cases in which the published literature provides diverging information or quantitative effects or model predictions that span a wide range, the committee sought to explain the sources of differences or areas of uncertainties.
The committee recognized that the effects of biofuels depend on the type of feedstock used, how and where it is grown, conditions prior to establishment of the bioenergy crops, logistics involved in feedstock transport and storage, conversion processes used to produce fuels from biomass, distribution of biofuels to the end users, and engine technology and performance given the specified blend of biofuels. Any assessment of environmental and economic benefits and costs is contingent upon details of each of these steps in a given system. Therefore, Chapter 2 provides background information on the biofuel supply chain. In addition, the economic and environmental effects of biofuels depend on site-specific conditions and the quantities of feedstock used. Because cellulosic biomass for fuels was not produced in large quantities as of 2011, its supply could only be estimated on the basis of experimental yields and assumed economic conditions. Therefore, Chapter 3 describes the projected supply of cellulosic biomass up to 2022 in the United States. The economics of biofuel production (including factors that influence the cost of biofuels such as feedstock prices and costs of conversion) and the economic effects of increasing biofuel production (including the extent to which biofuel production affects food prices, the linkage between biofuel production, animal feed prices, and coproducts, and the effect on the federal budget) are discussed in Chapter 4. Chapter 5 describes the projected or estimates of local, regional, and global effects of biofuel production on the environment. Chapter 6 presents potential economic, technical, environmental, social, and policy factors that could prevent the United States from meeting RFS2 mandates without passing judgment as to whether the mandate should be met.
Abbott, P.C., C. Hurt, and W.E. Tyner. 2009. What’s Driving Food Prices? March 2009 Update. Washington, DC: Farm Foundation.
Abbott, P.C., C. Hurt, and W.E. Tyner. 2011. What’s Driving Food Prices in 2011? Oak Brook, IL: Farm Foundation.
Baffes, J., and T. Haniotis. 2010. Placing the 2006/08 Commodity Price Boom into Perspective. Washington, DC: World Bank.
Brandenberger, J. 2010. Input from the National Turkey Federation. Presentation to the Committee on Economic and Environmental Impacts of Increasing Biofuels Production, May 3.
Carolan, M.S. 2009. A sociological look at biofuels: Ethanol in the early decades of the twentieth century and lessons for today. Rural Sociology 74(1):86-112.
Dimitri, C., and A. Effland. 2007. Fueling the automobile: An economic exploration of early adoption of gasoline over ethanol. Journal of Agricultural and Food Industrial Organization 5(2):11.
Donner, S.D., and C.J. Kucharik. 2008. Corn-based ethanol production compromises goal of reducing nitrogen export by the Mississippi River. Proceedings of the National Academy of Sciences of the United States of America 105:4513-4518.
Duffield, J.A., I. Xiarchos, and S.A. Halbrook. 2008. Ethanol policy: Past, present, and future. South Dakota Law Review 53:101-128.
EIA (Energy Information Administration). 1995. Renewable Energy Annual 1995. Washington, DC: U.S. Department of Energy.
EIA (Energy Information Administration). 2005. Annual Energy Outlook 2005—With Projections to 2025. Washington, DC: U.S. Department of Energy.
EIA (Energy Information Administration). 2006. Annual Energy Outlook 2006—With Projections to 2030. Washington, DC: U.S. Department of Energy.
EIA (Energy Information Administration). 2008. Energy kids: Ethanol. Available online at http://www.eia.doe.gov/kids/energy.cfm?page=tl_ethanol. Accessed August 5, 2010.
EIA (Energy Information Administration). 2009a. Annual Energy Outlook 2009—With Projections to 2030. Washington, DC: U.S. Department of Energy.
EIA (Energy Information Administration). 2009b. Annual Energy Review 2008. Washington, DC: U.S. Department of Energy.
EIA (Energy Information Administration). 2010a. Annual Energy Outlook 2010—With Projections to 2035. Washington, DC: U.S. Department of Energy.
EIA (Energy Information Administration). 2010b. Annual Energy Review 2009. Washington, DC: U.S. Department of Energy.
EIA (Energy Information Administration). 2010c. Biodiesel overview. Available online at http://www.eia.gov/totalenergy/data/monthly/pdf/sec10_8.pdf. Accessed June 30, 2011.
EIA (Energy Information Administration). 2010d. Fuel ethanol overview. Available online at http://www.eia.gov/totalenergy/data/monthly/pdf/sec10_7.pdf. Accessed June 30, 2011.
EIA (Energy Information Administration). 2010e. International Energy Outlook 2010. Washington, DC: U.S. Department of Energy.
EIA (Energy Information Administration). 2010f. International Energy Outlook 2010. Washington, DC: U.S. Department of Energy.
EIA (Energy Information Administration). 2010g. International energy statistics. Available online at http://tonto.eia.doe.gov/cfapps/ipdbproject/IEDIndex3.cfm?tid=5&pid=54&aid=2. Accessed August 3, 2010.
EPA (U.S. Environmental Protection Agency). 2002. A Comprehensive Analysis of Biodiesel Impacts on Exhaust Emissions. Washington, DC: U.S. Environmental Protection Agency.
EPA (U.S. Environmental Protection Agency). 2010a. Inventory of U.S. Greenhouse Gas Emissions and Sinks:1990–2008. U.S. Environmental Protection Agency.
EPA (U.S. Environmental Protection Agency). 2010b. Regulation of Fuels and Fuel Additives: Changes to Renewable Fuel Standard Program; Final Rule. Washington, DC: U.S. Environmental Protection Agency.
Fargione, J., J. Hill, D. Tilman, S. Polasky, and P. Hawthorne. 2008. Land clearing and the biofuel carbon debt. Science 319(5867):1235-1238.
Finlay, M.R. 2003. Old efforts at new uses: A brief history of chemurgy and the American search for biobased materials. Journal of Industrial Ecology 7(3-4):33-46.
Giebelhaus, A.W. 1980. Farming for fuel: The alcohol motor fuel movement of the 1930s. Agricultural History 54(1):173-184.
Jonker, J. 2010. Input from the National Milk Producers Federation. Presentation to the Committee on Economic and Environmental Impacts of Increasing Biofuels Production, March 5.
Knothe, G. 2001. Historical perspectives on vegetable oil-based diesel fuels. Inform 12(November):1103-1107.
Kojima, M., D. Mitchell, and W. Ward. 2007. Considering Trade Policies for Liquid Biofuels. Washington, DC: The World Bank.
Koplow, D. 2007. Biofuels—At What Cost? Government Support for Ethanol and Biodiesel in the United States: 2007 Update. Geneva: The Global Subsidies Initiative of the International Institute for Sustainable Development.
Lipsky, J. 2008. Commodity prices and global inflation. Available online at http://www.imf.org/external/np/speeches/2008/050808.htm. Accessed September 22, 2010.
Lobb, R. 2010. Input from the National Chicken Council. Presentation to the Committee on Economic and Environmental Impacts of Increasing Biofuels Production on May 3.
Melaina, M.W. 2007. Turn of the century refueling: A review of innovations in early gasoline refueling methods and analogies for hydrogen. Energy Policy 35:4919-4934.
Mitchell, D. 2008. A Note on Rising Food Prices. Washington, DC: The World Bank.
NBB (National Biodiesel Board). 2011. Biodiesel production estimates CY2005—current. Available online at http://www.biodiesel.org/resources/fuelfactsheets/. Accessed April 27, 2011.
Noe, P. 2010. Input from the American Forest and Paper Association. Presentation to the Committee on Economic and Environmental Impacts of Biofuels Production, May 3.
NRC (National Research Council). 2010a. Advancing the Science of Climate Change Washington, DC: National Academies Press.
NRC (National Research Council). 2010b. Toward Sustainable Agricultural Systems in the 21st Century. Washington, DC: National Academies Press.
Plevin, R.J., M. O’Hare, A.D. Jones, M.S. Torn, and H.K. Gibbs. 2010. Greenhouse gas emissions from biofuels’ indirect land use change are uncertain but may be much greater than previously estimated. Environmental Science & Technology 44(21):8015-8021.
Ribeiro, N.M., A.C. Pinto, C.M. Quintella, G.O. da Rocha, L.S.G. Teixeira, L.L.N. Guarieiro, M.D. Rangel, M.C.C. Veloso, M.J.C. Rezende, R.S. da Cruz, A.M. de Oliveira, E.A. Torres, and J.B. de Andrade. 2007. The role of additives for diesel and diesel blended (ethanol or biodiesel) fuels: A review. Energy & Fuels 21(4):2433-2445.
Robertson, G.P., V.H. Dale, O.C. Doering, S.P. Hamburg, J.M. Melillo, M.M. Wander, W.J. Parton, P.R. Adler, J.N. Barney, R.M. Cruse, C.S. Duke, P.M. Fearnside, R.F. Follett, H.K. Gibbs, J. Goldemberg, D.J. Mladenoff, D. Ojima, M.W. Palmer, A. Sharpley, L. Wallace, K.C. Weathers, J.A. Wiens, and W.W. Wilhelm. 2008. Agriculture—Sustainable biofuels redux. Science 322(5898):49-50.
Rosegrant, M. 2008. Hearing on Biofuels and Grain Prices: Impacts and Policy Responses before the Senate Committee on Homeland Security and Governmental Affairs, May 7.
Searchinger, T., R. Heimlich, R.A. Houghton, F. Dong, A. Elobeid, J. Fabiosa, S. Tokgoz, D. Hayes, and T.-H. Yu. 2008. Use of U.S. croplands for biofuels increases greenhouse gases through emissions from land-use change. Science 319(5867):1238-1240.
Solomon, B.D., J.R. Barnes, and K.E. Halvorsen. 2007. Grain and cellulosic ethanol: History, economics, and energy policy. Biomass and Bioenergy 31:416-425.
Spronk, R. 2010. Input from the National Pork Producers Council. Presentation to the Committee on Economic and Environmental Impacts of Increasing Biofuels Production, May 3.
Steenblik, R. 2007. Government Support for Ethanol and Biodiesel in Selected OECD Countries. A Synthesis of Reports Addressing Subsidies for Biofuels in Australia, Canada, the European Union, Switzerland and the United States. Geneva: International Institute for Sustainable Development.
Stillman, R., M. Haley, and K. Mathews. 2009. Grain prices impact entire livestock production cycle. Amber Waves 7(1):24-27.
Tenny, D. 2010. Input from the National Alliance of Forest Owners. Presentation to the Committee on Economic and Environmental Impacts of Biofuels Production, May 3.
Tilman, D., R. Socolow, J.A. Foley, J. Hill, E. Larson, L. Lynd, S. Pacala, J. Reilly, T. Searchinger, C. Somerville, and R. Williams. 2009. Beneficial biofuels—The food, energy, and environment trilemma. Science 325(5938):270-271.
Timmer, C.P. 2009. Causes of High Food Prices. Manila, Philippines: Asian Development Bank.
Trostle, R., D. Marti, S. Rosen, and P. Westcott. 2011. Why Have Food Commodity Prices Risen Again? Washington, DC: U.S. Department of Agriculture - Economic Research Service.
Tyner, W.E. 2008. The US ethanol and biofuels boom: Its origins, current status, and future prospects. BioScience 58(7):646-653.
USDA-ERS (U.S. Department of Agriculture - Economic Research Service). 2010. Corn: Market outlook. USDA feed grain baseline, 2009-19. Available online at http://www.ers.usda.gov/briefing/corn/2010baseline.htm. Accessed March 14, 2011.
USDA-RD (U.S. Department of Agriculture - Rural Development). 2010. Bioenergy program for advanced biofuels payments to advanced biofuel producers. Available online at http://www.rurdev.usda.gov/rbs/busp/9005Biofuels.htm. Accessed August 4, 2010.
USGS (U.S. Geological Survey). 2010. Groundwater depletion. Available online at http://ga.water.usgs.gov/edu/gwdepletion.html. Accessed November 17, 2010.


