
Environmental Effects and Tradeoffs of Biofuels
Petroleum extraction, transport, refining, and combustion have many known negative environmental effects, including disruption of sensitive ecological habitats and high greenhouse-gas (GHG) emissions. Biofuels, too, have their environmental costs (NRC, 2003, 2010a), but displacing petroleum-based fuels with biofuels can reduce the nation’s dependence on imported oil and potentially reduce overall environmental harm (Robertson et al., 2008). Each stage in a biofuel’s life cycle uses nonrenewable resources and generates emissions that affect land, air, and water. Hence, the environmental benefits and negative effects over the life cycle of petroleum-based fuels and biofuels would have to be compared against each other so that policymakers can decide which tradeoffs are acceptable. There is neither a simple nor single means of comparing biofuels and petroleum-derived fuels over their full life cycles and over their entire suites of environmental effects, yet decades of research on this topic have revealed that some ways of producing biofuels from certain feedstocks offer distinct advantages over others and thus have greater potential for providing environmental benefits over petroleum-derived fuels. Furthermore, certain stages in the life cycle of biofuels have greater environmental effects than others, and thus deserve particular attention in targeting strategies for optimizing environmental outcomes.
This chapter covers the following topics on the potential environmental effects of increasing biofuel production:
- It provides an overview of the life-cycle assessment methodology typically used to assess environmental effects of biofuel production and use.
- It examines the current state of knowledge about key environmental effects. Each environmental effect is discussed, when applicable, in the context of feedstock production, conversion to fuels, and combustion and over the life cycle of biofuel production and use. Methods for assessing effects and the anticipated results or observed effects reported in the published literature are presented. Gaps in data availability and deficiencies in existing modeling platforms, each of which
contributes to uncertainty in assessing environmental effects, are also pointed out in the following areas:
- GHG emissions
- Air quality
- Water quality
- Water quantity and consumptive use
- Soil
- Biodiversity
- Ecosystem services
- It uses regional environmental assessments of biofuel production as an illustration because the effects of biofuel production are location-specific, and conclusions drawn from regional environmental assessments could differ from an assessment of cumulative effects across the nation.
- It discusses opportunities to minimize negative environmental effects at the end of the chapter.
Although the committee stresses the importance of comparing environmental effects of biofuels to petroleum-based fuels, environmental effects of petroleum-based fuels have been covered in other publications (NRC, 2003, 2010a) and are beyond the scope of this study.
LIFE-CYCLE APPROACH FOR ASSESSING ENVIRONMENTAL EFECTS: AN OVERVIEW
Biofuels affect the environment at all stages of their production and use. Some effects are easily noticed (for example, odors emanating from an ethanol plant). Others are less apparent, including those that result from activities along the biofuel supply chain (for example, nitrate leaching into surface waters as a result of nitrogen fertilizer application on corn fields) and those that could occur beyond the supply chain via market-mediated effects (for example, loss of biodiversity upon land-use change induced by higher corn prices). Different effects can occur at local, regional, national, or global scales. Some of these effects are easily quantified while others are difficult to measure.
To better understand the suite of environmental effects associated with biofuels, researchers commonly turn to the method of life-cycle assessment (LCA). At the outset, researchers need to define the goal and scope of LCA. For example, researchers need to consider whether the goal is to assess the effects of biofuel produced at an individual biofuel production facility, the average effect of biofuel produced for the entire nation, or the effect of biofuel produced as a result of a policy mandating additional production. Then, an inventory of the resources used and net quantities of substances emitted as a result of biofuel production and use is compiled. This inventory is used to prepare an impact assessment that quantifies the ultimate effects on human health, ecosystem function, and natural resource depletion. Numerous methods for compiling inventories and conducting impact assessments exist, all of which have particular strengths and limitations in their modeling of specific processes and the availability and quality of data used to populate these models.
LCA is a valuable tool for quantifying the environmental effects of biofuels, yet widespread misinterpretation of the results from studies using different assessment methods has led to great confusion. More often than not, this confusion arises when conclusions from these studies are reported without mention of the particular framework and assumptions under which the analyses were conducted. For example, statements such as “this biofuel releases
less of this pollutant than gasoline” are by themselves meaningless and often misleading unless the goal and scope of the study cited in support of this statement are presented. (See Box 5-1 for a description of the importance of care when reporting results from LCA studies.)
A common problem is confusion over two different approaches of LCA—attributional and consequential—and their appropriate use when evaluating biofuels. Attributional LCA, the more traditional form, traces the material and energy flows of a biofuel supply chain and seeks to attribute environmental impact to a biofuel based upon these flows. Consequential LCA, on the other hand, considers the environmental effects of the cascade of events that occur as a result of a decision to produce or not to produce a given biofuel. Many differences between these two approaches of LCA arise because of their distinct applications (Ekvall and Weidema, 2004; Ekvall and Andræ, 2006). Attributional LCA makes use of process-specific or average data, while consequential LCA uses marginal data. Attributional LCA does not consider the market-mediated effects of a given biofuel, such as environmental effects caused by changes in crop or petroleum prices as a result of biofuel production. Consequential LCA, similar to a cost-benefit analysis, includes market-mediated effects. In essence, attributional LCA takes as a given the total environmental effect of all human activities and seeks to assign responsibility for a portion of the effect to a particular biofuel. Consequential LCA also takes as a given the total environmental effect of all human activities, but it assigns to a particular biofuel the change in total effect caused by a decision and the resulting action of whether to implement, expand, or contract biofuel production. As such, attributional LCA is useful in improving efficiency along a biofuel supply chain, and consequential LCA is appropriate in the evaluation of policy and regulation.
Both attributional and consequential LCA make use of knowledge of biofuel supply chains, but conducting the latter is far more complicated as it requires marginal data and modeling of market-mediated effects (Kløverpris et al., 2008; Finnveden et al., 2009). In addition, consequential LCA requires preparation of two alternate scenarios (that is, scenarios that represent “yes” and “no” to a decision) whereas attributional LCA requires only one scenario be described (that is, an actual or a projected scenario). Similarly, when measuring the direct environmental effects of supply chains themselves, attributional LCA can rely on actual, measured data, whereas consequential LCA requires that at least one set of data be estimated: When evaluating policies already fully implemented, one set would have to be estimated (that is, the scenario that did not occur) and when evaluating policies with future effects, two sets would have to be estimated (that is, the scenarios for both the “yes” and “no” to a decision). In total, the uncertainty surrounding the results from consequential LCA is compounded compared to attributional LCA, complicating its use in policy decisions, even where LCA is mandated such as in the Renewable Fuel Standard as amended in the Energy Independence and Security Act of 2007 (RFS2).
This discussion of LCA methodology is important to understanding the environmental effects of biofuels. To date, a large number of studies have used attributional LCA to evaluate individual biofuel production streams and the biofuels industry as a whole. Such studies are helpful for assessing the environmental performance of biofuel supply chains, but they do not consider the broader range of effects from increased biofuel production, such as the effects mediated by markets. Only studies that specifically estimate the environmental effects resulting from the marginal increase in fuel production caused by RFS2 are appropriate for assessing the environmental effects of increasing biofuel production due to its implementation. Studies that have used consequential LCA as a means of quantifying the marginal impact of increased biofuel production are sparse and much needed. In this chapter, results using both methods are presented, with the caveat that what might have been found under one set of circumstances may not hold under other conditions.
Many studies have been published comparing the environmental effects of biofuels and petroleum-based fuels, often with seemingly conflicting results. Nowhere has this been more evident than in the debate over whether corn-grain ethanol is a greater emitter of GHGs than gasoline. As such, it serves here as a basis for discussing LCA methodology. Careful examination of this debate shows that more often than not, seemingly conflicting results are not contradictory, but rather are simply the consequence of fundamental differences in goal and scope, assumptions, methodology, and underlying data.
Consider, for example, three different stakeholders who wish to know the quantity of GHGs released in corn-grain ethanol production. A manager of a corn-grain ethanol plant might be interested in estimating GHG emissions of his or her product for sale into California, which is regulated by its own Low Carbon Fuel Standard. An ethanol industry analyst might wish to know the average GHG emissions for corn-grain ethanol produced domestically so as to track industry improvement in efficiency on an annual basis. A federal regulator might wish to know the change in quantities of GHG emissions as a result of legislation mandating the production of additional ethanol.
Now consider how each might go about quantifying GHG emissions. For the plant manager, a static attributional LCA method for quantifying GHG emissions from his or her own facility’s supply chain is most useful. This method would also suit the needs of the industry observer, albeit with a different focus on what might be considered a typical facility, on a subset of facilities representative of the industry, or on all facilities. For the federal regulator, however, a dynamic consequential LCA method that quantifies the net change in GHG emissions resulting from increased ethanol production is most appropriate. This includes market mediated effects extending well beyond the bounds of the ethanol and agribusiness industries themselves.
To populate their LCA models, the three stakeholders would choose data specifically well suited to their analysis. Consider, for example, the critical parameter of corn yield, or the weight of grain harvested from a given area of cropland. The ethanol plant manager may choose the average yield of grain delivered to the facility. The industry analyst may use the national yield average. The federal regulator may use a projected yield that accounts for both potential yield increases due to greater investment in crop production technology and potential yield decreases due to the disruption of existing crop rotations (for example, shifting from corn-soybean rotations to continuous corn) and the increased use of less productive lands (for example, use of idle cropland).
From these examples, it is clear that each of these three stakeholders could arrive at a different estimate of life-cycle GHG emissions from corn-grain ethanol, and each would be reasonable given the assumptions. An individual facility may produce ethanol with different life-cycle GHG emissions than the national average of all facilities. Producing additional ethanol as a result of a federal mandate would lead to a different amount of GHG emissions than what would have been generated in the mandate’s absence. An important caveat to this discussion is that while all three ways of viewing the system are correct and each is useful to its own audience, each is an interpretation of a single reality (that is, the actual net quantity of GHG emissions released to the atmosphere), and as such the ultimate question to be answered is whether the decision to build and operate an ethanol production infrastructure leads to a reduction in global GHG emissions.
The scenario explored above is not provided merely as an academic exercise, but rather because it reflects the actual variation found in recent studies on the life-cycle environmental effects of biofuels. With respect to corn-grain ethanol GHG emissions specifically, some studies (for example,(Liska et al., 2009) are site specific, focusing primarily on facilities situated in areas of exceptionally high corn-grain yields such as Iowa and Nebraska. Other studies, such as those of Farrell et al. (2006) and Wang et al. (2007), are concerned largely with average ethanol production at a national level. The U.S. Environmental Protection Agency’s rulemaking for RFS2 is essentially focused on the additional ethanol that will be produced as a result of the Energy Independence and Security Act of 2007.
Feedstock Production
One of the most debated topics surrounding the environmental effect of biofuels is the net GHG emissions from producing various feedstocks. Potential GHG emissions from bioenergy feedstock production include carbon dioxide (CO2), nitrous oxide (N2O), and methane (CH4).1 As elaborated below, the key factors that affect GHG emissions from bioenergy feedstock production are site-specific and depend on the type of feedstocks produced, the management practices used to produce them, and any land-use changes that their production might incur.
Type of Feedstock and Management Practices
Potential bioenergy feedstocks mentioned in Chapter 2 can be categorized as annual, herbaceous perennial, short-rotation woody crops (SRWCs), and residue from other systems such as corn stover or forest residue. Choice of feedstock is an important factor in determining the GHG effect of biofuels. For example, perennial herbaceous biomass could increase soil carbon sequestration compared to annual crops (Anderson-Teixeira et al., 2009; Blanco-Canqui, 2010; NRC, 2010b). The GHG implications of a particular feedstock depend on the relationship between that feedstock and site properties such as soil type and climate. As with any agricultural crop, management practices affect the net GHG balance of bioenergy feedstock production in several ways: cropping patterns, amount of agrichemical use, tillage practices, and farm equipment use.
Farmers and foresters select management practices on the basis of crops grown, soil conditions, precipitation patterns, slope, exposure, available equipment, and their knowledge and preferences. In general, choices are made to maximize yield per dollar of input and are not made on the basis of GHG emissions. Yet, choices of management practices have a major influence on GHG emissions (NRC, 2010b). CO2 released from fossil fuel combustion in the manufacturing, transport, and application of agricultural inputs (for example, fertilizers, pesticides, seed, and agricultural lime), N2O released during nitrogen fertilizer production (Snyder et al., 2009), and N2O released because of nitrification and denitrification stimulated by nitrogen fertilizer application (Bouwman et al., 2010) contribute to GHG emissions. Therefore, producers who choose to cultivate bioenergy feedstocks that require higher agrichemical input in place of crops that require less agrichemical input would incur increases in GHG fluxes. Some bioenergy energy feedstock such as forest residue would have no GHG contribution from agrichemical input.
Agricultural soil management accounted for about 68 percent of the total N2O emissions in the United States in 2008 (EPA, 2010c). Emission of N2O is predominantly a result of microbial processes of nitrification and denitrification; therefore, emission generally increases with nitrogen availability, or the extent to which nitrogen input exceeds crops’ needs (Bouwman et al., 1993, 2002; McSwiney and Robertson, 2005). The type and timing of nitrogen fertilizer used also affects N2O fluxes (Bavin et al., 2009). Technologies for precise application of fertilizers can potentially reduce fertilizer use without compromising yield (Snyder et al., 2009; Gebber and Adamchuk, 2010; Millar et al., 2010), but those technologies are not widely adopted because of socioeconomic, agronomic, and technological reasons
______________
1 Global warming potential of a GHG is the warming caused by emission of 1 ton of that GHG compared to 1 ton of CO2 over a specific time interval. The global warming potentials over a 100-year period are 1 for CO2, 25 for CH4, and 298 for N2O.
(Robert, 2002; Lamb et al., 2008; USDA-NIFA, 2009). Precision management of nitrogen fertilization can also improve biomass quality for cellulosic biofuels (Gallagher et al., 2011).
The environmental benefits of crop rotations include enhanced control of weeds, pests, and diseases; increased availability of nutrients; accumulation of soil carbon; and higher yields (NRC, 2010b). Those benefits, if combined with higher yields, contribute to reducing agrichemical input and GHG emissions. Increased diversity of crops planted in a field (either at once or over the course of a year) could also reduce the amount of pesticide application needed (GAO, 2009). For example, mixtures that include grasses and nitrogen-fixing legumes can also reduce nitrogen fertilizer needs (Tilman et al., 2006; Fornara and Tilman, 2008; NRC, 2010b). Gardiner et al. (2010) compared preexisting corn, switchgrass, and mixed prairie crops in Michigan and found that switchgrass and mixed prairie crops supported greater abundance of arthropod generalist natural enemies of crop pests. Even crop rotation between corn and soybean can help control pests and reduce the use of pesticides by breaking the pattern of pests and disease that can be present in monocultures. Integrated pest management can potentially contribute to reducing pesticide input (Trumble et al., 1997; Reitz et al., 1999; NRC, 2010b).
The effect of no-till and reduced tillage on soil organic carbon (SOC) storage is inconsistent and depends on depth of soil sampling and crop management (Dolan et al., 2006; Baker et al., 2007; Johnson et al., 2007; Luo et al., 2010; Kravchenko and Robertson, 2011). Studies that assess carbon content in the entire soil profile (0-60 cm) did not find higher soil carbon in no-till fields than in conventionally tilled fields (Blanco-Canqui and Lal, 2008; Christopher et al., 2009). Nonetheless, no-till and reduced tillage may contribute to reducing GHG emissions because those practices require less fossil-fuel inputs for machinery that perform the tilling (Adler et al., 2007) and emissions of N2O might be lower (Omonode et al., 2011). No-till and reduced tillage also have other environmental benefits because they enhance soil water retention and microbial activity and diversity, reduce soil erosion and sediment runoff, and improve air quality compared to conventional tillage (NRC, 2010b).
Methods of Assessment
Over the past several decades, ecosystem ecologists have estimated carbon storage and GHG consequences of land-use management practices on regional and continental scales, using spatial databases to represent key driving variables, including soils (for example, STATSGO), average climatic data, satellite imagery (for example, MODIS), and current or projected land-use management, combined with simulation models. This strategy has been used to assess consequences of cropping (Campbell et al., 2005; Del Grosso et al., 2005; Izaurralde et al., 2006), forest management (Adams et al., 1999; Sohngen and Sedjo, 2000; Murray et al., 2005; Johnson et al., 2010), and climate change (Paustian et al., 1997; Lu and Zhuang, 2010). Notably, simulation results (and indeed the biological processes responsible for GHG fluxes) are very sensitive to site-specific factors that are variable. Those site-specific factors, including fertilization practices, cultivation and residue management, and forest age classes, are rarely available as input data. Thus, potential error increases for scaled-up estimates, based on the presence, accuracy, and spatial resolution of input data, and the ability of simulation models to accurately estimate fluxes.
Zhang et al. (2010) used this strategy to assess environmental effects including GHG emissions that might occur based on spatially explicit scenarios of bioenergy feedstock expansion, including annual crops, herbaceous perennial crops, SRWC, and residue harvest. They predicted locations for different bioenergy crops and management options in a nine-county region in southwestern Michigan that would minimize GHG emissions while maintaining certain minimum yields and maximum nitrate runoff levels. They presented
sample results involving the minimization of GHG flux per unit area, although the flexibility of their framework allows for the calculation of other variables of interest, such as GHG flux per unit of energy produced, which may be more useful for integration with full LCAs. In addition, Zhang et al. (2010) noted that their framework could be extended into a spatially explicit LCA in which, for example, optimal locations for biorefineries could be modeled simultaneously with feedstock production locations.
Anticipated or Observed Results
As mentioned above, the effects of bioenergy feedstock production on GHG emissions depend on feedstock choice, management practices, and changes in land use and land cover so that any quantitative estimates of GHG emissions are site specific. This section discusses the anticipated or observed effects of feedstock production on GHG emission as organized by major feedstock categories.
For corn and soybean production, fertilizer use generates GHGs as a result of fossil-fuel input in manufacturing and transporting fertilizers and of nitrogen from fertilizers not taken up by plants and emitted as N2O. In 2005, about 95 percent of the corn acreage in the United States received nitrogen fertilizer, and the average application rate was about 138 lb/acre (Table 5-1). Soybean requires less inputs (particularly nitrogen fertilizers) to produce than corn on a per-acre basis (Schnepf, 2004). However, a comparison of GHG contribution from fertilizer manufacture and use in feedstock production between biofuels have to account for crop yield per acre,2 conversion yield from feedstock to biofuel,3 and the energy content of biofuel.4
The opportunity offered by the future use of cellulosic feedstocks is that GHG emissions could be reduced, but that benefits can only be achieved in some situations. Corn stover, cereal straw, and other crop residues draw on existing crops so that their use as bioenergy feedstock under best management practices might not contribute much additional GHG emissions. However, overharvesting of crop residues could result in additional need for agrichemical inputs and the loss of soil organic matter, which is critical for maintaining soil structure and water retention capacity and for improving nutrient cycling and other soil processes (Wilhelm et al., 2007; NAS-NAE-NRC, 2009; NRC, 2010b). Any additional fuel use for collecting the residues that contributes to GHG emissions would also have to be accounted for.
TABLE 5-1 Fertilizer Use for Corn and Soybean Production in the United States
| Corna | Soybeanb | |
| Acreage fertilized receiving nitrogen fertilizer (percent) | 96 | 18 |
| Average rate of nitrogen fertilizer application (lbs/acre) | 138 | 16 |
| Acreage fertilized receiving phosphate fertilizer (percent) | 81 | 23 |
| Average rate of phosphate fertilizer application (lbs/acre) | 58 | 46 |
| Acreage fertilized receiving potash fertilizer (percent) | 65 | 25 |
| Average rate of potash fertilizer application (lbs/acre) | 84 | 80 |
aLatest data from source are for the year 2005.
bLatest data from source are for the year 2006.
SOURCE: USDA-ERS (2010c).
______________
2Corn yield per acre is about 4 times higher than soybean yield (USDA-NASS, 2010).
3About 1 bushel of soybean produces 1.5 gallons of biodiesel, while 1 bushel of corn produces about 2.7 gallons of ethanol.
4The energy content of corn-grain ethanol is about two-thirds of that of soybean biodiesel.
Growing perennial dedicated bioenergy crops could have less direct GHG emissions than growing row crops because their root systems contribute to sequestration of carbon. Surveys of common agronomic practices for growing Miscanthus show a broad range in nitrogen fertilizer use, typically around 50-100 lbs per acre per year (Heaton et al., 2004; Khanna et al., 2008). In their review of published literature, Parrish and Fike (2005) reported that data on nitrogen requirements in switchgrass span a range of 0-200 lbs per acre, and that the variations can be partly attributed to different harvest practices, within-plant nitrogen recycling, and site-specific soil nitrogen mineralization rates and atmospheric deposition and microbial fixation of nitrogen. Liebig et al. (2008) measured changes in soil organic carbon (SOC) in the top 0-30 cm and 0-120 cm of soil in switchgrass fields on 10 farms that were previously used for annual crop production in the central and northern Great Plains. They reported accumulation of SOC over time, but the change in SOC varied considerably across sites from –2.2 to 16 Mg CO2 eq per hectare per year in the top 0-30 cm. Garten et al. (2010) found that a single harvest of switchgrass at the end of the growing season increased SOC sequestration and system nitrogen balance on well-drained Alfisols in west Tennessee. SOC sequestration rates in the top 15 cm of reconstructed tall grass prairies on previously cultivated land in southern Iowa varied significantly with topography and age of the prairie stand (Guzman and Al-Kaisi, 2010).
Using woody residues as a bioenergy feedstock can result in relatively low GHG emissions compared to crops that are planted and harvested exclusively for bioenergy purposes if they are a byproduct of existing harvesting operations and do not require fertilizer input. In some regions of the United States, harvesting dead material from the forest floor and forest thinning could reduce the potential for wildfires (Fight and Barbour, 2005; Busse et al., 2009; Kalies et al., 2010) that also contribute much CO2 to the atmosphere.
SRWC can sequester SOC depending on trees grown, soil types, and prior land use, according to a review of literature by Blanco-Canqui (2010). The author noted that nitrogen-fixing trees sequester more SOC than other trees. Fertilization and irrigation can increase SOC sequestration and yield increase, but CO2 emissions associated with these activities may offset some SOC benefits (Blanco-Canqui, 2010).
Biofuel-Induced Land-Use Changes
Carbon is stored in soil and in above-ground and below-ground vegetation. Soil carbon storage depends on soil characteristics and past disturbances. The amount of carbon stored in vegetation depends on the vegetation type. Therefore, land-use changes that involve removing or planting of vegetation could either release a large amount of carbon from soil or store carbon depending on the conditions of the land prior to use, crop characteristics (Fearnside, 1996; Guo and Gifford, 2002b; Woodbury et al., 2006), and management practices (as discussed above). Similarly, land-use change could disrupt or enhance the future potential of land to store carbon.
Land use is defined by anthropogenic activities, such as agriculture, forestry, and urban development, that alter land-surface processes, including biogeochemistry, hydrology, and biodiversity. Land cover is the extent and type of physical and biological cover over the surface of land. Some authors have divided land-use changes into two types when considering biofuel policy: direct land-use change and indirect land-use change. Biofuel-induced land-use changes occur directly when land is dedicated from one use to the purpose of growing biofuel feedstock. Biofuel-induced land-use changes can occur indirectly if land use for production of biofuel feedstocks causes new land-use changes elsewhere through market-mediated effects. The production of biofuel feedstocks can constrain the supply of
commodity crops and raise prices, thus triggering other agricultural growers to respond to market signals (higher commodity prices) and to expand production of the displaced commodity crop. This process might ultimately lead to conversion of nonagricultural land (such as forests or grassland) to cropland. Because agricultural markets are intertwined globally, production of bioenergy feedstock in the United States could result in land-use and land-cover changes elsewhere in the world. If those changes reduce the carbon stock in vegetation, carbon would be released in the atmosphere when land-use change occurs. In particular, transition from forest to cropland or pasture emits a large amount of CO2 because of CO2 releases from decomposition of woody debris and short-lived wood products (NRC, 2010c). Similarly, land-use change could disrupt or enhance the future potential of land to store carbon.
Many economic studies have shown the “unintended” consequences of policy (Stavins and Jaffe, 1990; Wu, 2000; Wear and Murray, 2004), and the principle from Wu’s study is relevant to increasing biofuel production in United States. Wu (2000) showed cropland enrolled in the U.S. Department of Agriculture’s (USDA) Conservation Reserve Program (CRP) had a 20-percent slippage. That is, for every 5 acres of cropland enrolled in CRP, 1 acre of noncropland is added to cropland elsewhere. That study did not account for carbon emissions, but it pointed out the rippling effects of shifting land uses. Other studies have linked land-use changes to carbon changes and showed that projects and policies intended to mitigate GHG emissions in the forestry or agricultural sector could lead to “leakage,”5 or responses to those projects and policies by other parties that also cause GHG emissions (Sohngen and Brown, 2004; Murray et al., 2007).
Methods of Assessment
Land-Use and Land-Cover Changes. Remote sensing using satellite and aircraft sensors can be used to map land cover and land use and provide information on above-ground vegetation and residue cover (NRC, 2010c). Data from remote sensing can be coupled with land monitoring to estimate GHG fluxes from land-use changes (Houghton, 2010; NRC, 2010c; West et al., 2010). Uncertainties of annual carbon fluxes from deforestation, reforestation, and forest degradation based on remote sensing vary from 25 to 100 percent (NRC, 2010c). Variations in plant residue, along with soil moisture and mineralogy and vegetation cover, are a problem in estimating soil surface carbon. Even so, progress has been made in assessing crop residue coverage using space-borne hyperspectral instruments (Daughtry et al., 2006; NRC, 2010c). Estimates of N2O emissions from managed lands have about 50-percent uncertainty even with the best inventory methods, and those estimates are even more uncertain in developing countries than in developed countries (NRC, 2010c).
Market-Mediated Effects. A number of different types of economic models have been used to calculate the global indirect effects of increasing biofuel production. An important aspect emphasized by these models is global interaction. For example, shocks to supply and demand in one region have well-defined price effects on global markets, as illustrated by the market price fluctuations as a result of drought in Russia in 2010. Economic models have been developed to capture this phenomenon. The short-term and long-term effects of biofuel policy on global commodity markets are discussed in Chapter 4.
A second aspect emphasized by these models is the competition among different land uses. Economic models are often best suited to account for the behavior of different
______________
5 GHG leakage is the term that was introduced to refer to the conditions when an activity displaces GHG emissions outside the boundaries of the activity area (Murray et al., 2007). For example, afforestation efforts in one country could lead to market forces that encourage deforestation in another country (Meyfroidt et al., 2010).
competing demands for land, as well as the supply of land. A number of different economic models, including general-equilibrium and partial-equilibrium models, have been used to study indirect land changes, and the advantages and disadvantages of several approaches have been discussed elsewhere (Kretschmer and Peterson, 2010). The estimates of indirect land changes are then added to direct GHG models, such as GREET,6 to estimate total direct and indirect GHG emissions. Although such analyses consider emissions as a result of market-mediated effects on land use, they are not, strictly speaking, consequential LCAs. Rather, they represent a hybrid approach in which marginal data for a specific parameter (land use) are incorporated into an attributional LCA model. Among many differences, comprehensive consequential LCA would, for example, also consider elasticity of petroleum markets.
GHG Emissions Estimated from Market-Mediated Land-Use Changes. GHG emissions from indirect land-use or land-cover changes can be estimated by coupling estimates of market-mediated land-use or land-cover changes with estimates of GHG emissions from those projected land-use or land-cover changes. The resulting projection of GHG emissions from indirect land-use changes has large uncertainty because of difficulty to establish a causal link between direct-use changes and indirect-use changes that are separated spatially and temporally. For example, many factors influence land-use changes, and showing precisely that a price change induced by biofuel policy as the precipitating cause is difficult. Even if an economic linkage can be shown, calculating the carbon change is difficult because there is substantial heterogeneity in carbon on the landscape. If the indirect land-use change involves removing tropical forests, the carbon emissions could be high, but if the indirect land-use change involves converting pasture or fallow land to cropland, then the carbon effects could be smaller.
Several concerns have been raised about the existing estimates of the indirect effects of land use. One concern relates to the many steps that need to be undertaken to show indirect land-use change and uncertainty associated with all those steps. For example, the first step in any analysis of the effects of U.S. policy is to determine what crops besides corn are displaced as a result of increased biofuel production. The second step is to determine how much these changes in U.S. markets influence prices in other countries (Babcock, 2009; Zilberman et al., 2010). The key concern with these calculations is that U.S. economists have an idea of U.S. farmers’ responses to price change on the basis of historic trends, but Babcock (2009) argued that the response of farmers in other parts of the world to price changes is much less certain. Similar concerns have been raised by Kim and Dale (2011), who were unable to find correlative evidence between increased demand for corn and land-use change from 2001-2007. O’Hare et al. (2011) argued that Kim and Dale’s analysis was flawed. The committee advocates that additional data and analyses are needed to assess net changes in land use as a result of market-mediated effects of feedstock production for biofuels. A second concern is that simulations from economic models use point estimates of various parameters, each of which varies temporally and spatially (Zilberman et al., 2010). A third concern is that other factors that contribute to land-use change decisions, including cultural, political, and ecological factors (Geist and Lambin, 2002; Turner et al., 2007), are not accounted for in economic models. Finally, one response to rising prices is intensification of existing croplands. The different models discussed later account for cropland intensification to different extents. For example, the study by Searchinger et al. (2008) assumes that increased yields from intensification will be offset by lower yields on lower-quality lands
______________
6 The Greenhouse Gases, Regulated Emissions, and Energy Use in Transportation Model by Argonne National Laboratory.
brought into production. The results from Hertel et al. (2010) directly incorporate intensification of crop management as a result of rising prices. Cropland intensification helps reduce the overall indirect effects.
Anticipated Effects
Direct conversion of native ecosystems to producing corn for ethanol releases large amounts of GHG into the atmosphere (Fargione et al., 2008; Gibbs et al., 2008; Ravindranath et al., 2009). Based on the definition in RFS2, only planted crops and crop residue from agricultural land cleared prior to December 19, 2007, and actively managed or fallow on that date are considered compliant feedstocks. This definition discourages land clearing of native ecosystems for bioenergy feedstock production so that GHG emissions from direct land-use change could be minimized. However, some farmers could use existing cropland to produce bioenergy feedstocks.
Conversely, converting from annual to perennial bioenergy crops can enhance carbon sequestration on that piece of land (Fargione et al., 2008). The perennial bioenergy crops are considered RFS-compliant feedstock. However, the carbon storage could be offset by market-mediated effects on land-use and land-cover changes elsewhere as a result of biofuel production in the United States.
A few authors estimated GHG emissions from indirect land-use change as a result of increasing corn-grain ethanol production in the United States. Their simulations represent changes in GHG emissions from land-use changes with or without U.S. biofuel production. Other drivers of land-use changes were not considered. Searchinger et al. (2008) estimated that GHG emissions from indirect land-use change in Brazil, China, India, and the United States from U.S. corn-grain ethanol production to be 104 g CO2 eq per MJ. Searchinger et al. (2008) projected land-use changes on the basis of historical data from 1990 to 1999. They estimated GHG emissions from the land-use change would be offset by GHG benefits accrued from substituting gasoline with corn-grain ethanol only after 167 years.
Dumortier et al. (2010) demonstrated that differences in the economic model and data source did not alter the estimate of GHG emission from indirect land-use change much when they used the same assumptions of increase in ethanol production over time and types of land cover converted as Searchinger et al. (2008). In contrast, changes in assumptions on the type of land converted, net land displacement factor,7 crop yield, and increase in ethanol production had large effects on estimated GHG emissions (Dumortier et al., 2010; Plevin et al., 2010).
The model of the Global Trade Analysis Project (GTAP) has been used to estimate biofuel-induced land-use change emission estimates for the California Air Resources Board (Tyner et al., 2010). To evaluate the land-use implications of U.S. ethanol production, they developed three groups of simulations. In the first group, they calculated the land-use implications of U.S. ethanol production off the 2001 database. This is version 6 of the GTAP global database, which is updated every 2-3 years. This approach isolates effects of U.S. ethanol production from other changes that shape the world economy. In the second group of simulations, Tyner et al. (2010) first constructed a baseline that represents changes in the world economy during the time period of 2001-2006. Then they calculated the land-use impact of U.S. ethanol production based on the updated 2006 database. Finally, in the third group of simulations, they used the updated 2006 database obtained from the second group
______________
7 Net land displacement factor is the ratio of land acreage brought into crop production anywhere in the world as a result of market-mediated effects of bioenergy feedstock production to land acreage dedicated to bioenergy feedstock production.
of simulations but assumed that during the time period of 2006-2015, population and crop yields would continue to grow. They estimated that the average land requirement for the incremental ethanol production was 0.32 acres of land to produce 1,000 gallons of ethanol. Twenty-four percent of the land-use change was estimated to occur in the United States and 76 percent in the rest of the world. Forest reduction was estimated to account for 33 percent of the global change and pasture 67 percent. In the GTAP database, grassland is included in pasture, and CRP lands were excluded from this analysis.
The range of estimates shown in Table 5-2 illustrates how the changes in assumptions that form a particular scenario affect GHG emissions from indirect land-use changes. Any of those scenarios in Table 5-2 are possible, and the GHG emissions from indirect land-use changes will depend on which ones of those or other alternative scenarios play out. Using a reduced-form model and a range of scenarios, Plevin et al. (2010) estimated that the range of GHG emissions from indirect land-use change as a result of increasing U.S. corn-grain ethanol production to be 10-340 g CO2 per MJ, with a 95-percent central interval between 21 and 142 g CO2 per MJ. If dedicated bioenergy crop production displaces commodity crops in the United States and if the displacement affects global markets, economic models project that indirect land-use change and associated changes in GHG emissions can be expected.
Expanding production of biofuels in the United States increases pressure on land supply and causes land-use changes elsewhere in the world through market-mediated effects (Melillo et al., 2009; Bowyer, 2010; Overmars et al., 2011). In the United States, the proportion of corn-grain used for ethanol has increased from less than 10 percent in 2000 to 40 percent in 2010 (see Figure 2-5 in Chapter 2), though net exports have held steady for corn, increased for soybean, and declined for wheat (Chapter 4). The extent of biofuel market-mediated land-use changes are uncertain because there are different ways farmers around the world could respond to changes in land-use pressure and market price signals. Other than expanding cultivated land, farmers also could respond to price signals by intensifying the use of existing agricultural lands—for example, increasing fertilization, double cropping, decreasing fallow periods, or using new technologies to increase agricultural outputs per unit cultivated land (Fischer et al., 2009; Melillo et al., 2009; Searchinger, 2010). Improving crop productivity per unit land cultivated can have a profound influence on land-use change emissions in that it changes the land base required for agricultural production for food, feed, and biofuels (Wise et al., 2009).
The Hertel et al. (2010) study attempted to do a systematic analysis of land-use change that was induced by emissions from U.S. biofuel production. They concluded that the corn-grain ethanol-induced emissions from land-use change range between 2 and 51 g CO2 per MJ.
The range of estimates for GHG emissions from indirect land-use changes is wide (that is, precise value is highly uncertain) largely because it is difficult to separate market-mediated effects of land-use change as a result of increasing biofuel production from other drivers of land-use changes. However, a key point is that land-use and land-cover changes can have profound effects on GHG emissions. The extent of biofuel-induced land-use change emissions are highly uncertain, but with 40 percent of the corn crop in the United States in 2010 (about 27 percent after accounting for dried distillers grains with solubles [DDGS]) going to biofuels, GHG emissions from land-use changes cannot be ignored.
Next Steps
In coming years, scientists will undoubtedly continue to refine their models to improve estimates of GHG emissions as a result of land-use changes. However, uncertainty of GHG emissions from land-use and land-cover changes can be expected to remain large because
| Economic models used to estimate market-mediated effects | Land-cover change data used | Emission factors used | GHG emissions from indirect land-use change (g CO2eq per MJ) |
Target year | Increase in ethanol production (million liters) | Key assumptions | Reference |
| FAPRI | Woods Hole (1990s) | Woods Hole | 104 | 2016 | 56 | • Net land displacement factor = 72 percent. • Different types of forests, savannah, or grassland are converted to cropland in Brazil, China, India, and the United States. • Percent forest land converted = 52; percent grassland converted = 48. |
Searchinger et al., 2008 |
| GTAP | GreenAgSiM | IPCC | 118 | 2018 or 2019 | 56 | • Same assumptions as Searchinger et al., 2008. | Dumortier et al., 2010 |
| GTAP | GreenAgSiM | IPCC | 91 | 2018 or 2019 | 56 | • Same assumptions as Searchinger et al., 2008, except no conversion of U.S. forest land to cropland. | Dumortier et al., 2010 |
| CARD Agricultural Outlook Model |
GreenAgSiM | IPCC | 75 | 2018 or 2019 | 30 | • No conversion of U.S. forest land to cropland. • Crop yield 1 percent higher than the slope of trend yield compared to Searchinger et al., 2008. |
Dumortier et al., 2010 |
| CARD Agricultural Outlook Model |
GreenAgSiM | IPCC | 21 | 2018 or 2019 | 30 | • No conversion of U.S. forest land to cropland. • Crop yield 1 percent higher than the slope of trend yield compared to Searchinger et al., 2008. |
Dumortier et al., 2010 |
| GTAP | Woods Hole (1990s) | Woods Hole | 27 | 2010 | 50 | • Net land displacement factor = 28 percent. • Percent forest land converted = 19; percent grassland converted = 81. |
Hertel et al., 2010 |
| FASOM, FAPRI |
MODIS-5 | Winrock International |
82 | 2012 | 7.5 | • Net land displacement factor = 89 percent. | EPA, 2010d |
| FASOM, FAPRI |
MODIS-5 | Winrock International |
58 | 2017 | 14 | • Net land displacement factor = 55 percent. | EPA, 2010d |
| Economic models used to estimate market-mediated effects | Land-cover change data used | Emission factors used | GHG emissions from indirect land-use change (g CO2eq per MJ) |
Target year | Increase in ethanol production (million liters) | Key assumptions | Reference |
| FASOM, FAPRI |
MODIS-5 | Winrock International |
34 | 2022 | 10 | • Net land displacement factor = 29 percent. | EPA, 2010d |
| GTAP | GTAP database | Woods Hole | 14.5 | 2022 | 13 | • Percent forest land converted = 33; percent grassland converted = 67. | Tyner et al., 2010 |
| Reduced-form modeling | 10-340 | 2025-2055 | • Net land displacement factor = 25-80 percent. • Percent forest land converted = 15-50; percent grassland converted = 45-85; percent wetland converted = 0-2. |
Plevin et al., 2010 | |||
NOTE: Land-use change amortized over 30 years.
SOURCE: Adapted from Plevin et al. (2010).
actual land changes and their relation to increasing biofuel production in the United States will only be observed as markets adjust to increased biofuel production. Even with long-term empirical data on land-use and land-cover changes, measurements of associated GHG emissions, and data on agricultural markets, estimating the global GHG benefits or emissions from U.S. biofuel production will require a comparison with a reference scenario, which inevitably is a simulation of what would have happened absent biofuels. Such a reference scenario may include GHG emissions resulting from any change in the use of oil sands and other nonconventional sources of petroleum (Jordaan et al., 2009; Yeh et al., 2010). To improve GHG estimates from indirect land-use changes as a result of U.S. biofuel policy, data would have to be collected continuously and models would have to be refined for as long as biofuels are produced. Additional data and information to be collected include:
- Global land-cover change to assess changes in carbon stocks;
- Global commodity market and land use to observe any market-mediated effects on land changes from RFS2;
- Drivers of land changes to parse out the market-mediated effects on land changes from other factors that affect land-use decisions.
Additional research is needed to better understand the socioeconomic processes of land-use change and to integrate that process understanding into models for estimating market-mediated effects and for GHG emissions to better inform the GHG effects of biofuel-induced land-use and land-cover changes.
Conversion to Fuels
The conversion of feedstocks into biofuels at biorefineries results in GHG emissions from on-site combustion of fossil fuel or biomass, from production of process chemicals and enzymes, from process emissions including those from fermentation, and more broadly from transport of inputs and products and from generation of purchased electricity. Continuous emission monitoring systems can provide measurements of CO2 in biorefineries in operation. CO2 emissions also can be estimated using a mass balance approach (Huo et al., 2009; NAS-NAE-NRC, 2009; DOE-NETL, 2010). Although total biorefinery emissions can be measured or estimated, it is important to distinguish between GHG emissions from fossil sources and those from biogenic sources for purposes of GHG accounting. Biomass, a biogenic source of carbon, is commonly assumed to be carbon neutral because the carbon emitted when burning had previously been removed from the atmosphere as CO2 during plant growth. Although biomass itself can be treated as carbon neutral, the processes used to grow and collect biomass, including any associated land-use change, can incur GHG emissions.
In general, for corn-grain ethanol production, using natural gas at biorefineries has lower GHG emissions than using coal, and using biomass to provide heat, power, or both may have lower emissions still (Kaliyan et al., 2011; Wang et al., 2011a). In corn-grain ethanol refineries, the amount of DDGS coproduct that is dried and the extent to which it is dried further affect energy use, and hence biorefinery CO2 emissions. In 2011, the Renewable Fuels Association estimated that about 60 percent of DDGS was dried. For biodiesel production, GHG emissions at locations where transesterification occurs are minimal compared to corn-grain ethanol. In cellulosic-ethanol refineries as they are typically proposed, burning lignin and other residues to generate steam and power results in the release of biogenic CO2 rather than the fossil CO2 that would be released from natural gas or coal, and any excess electricity generated can be sold to the grid (NAS-NAE-NRC, 2009). Variations
in CO2 emissions from a biorefinery that converts corn stover to ethanol biochemically compared to one that converts wood chips to ethanol thermochemically are estimated to be small (Foust et al., 2009; NAS-NAE-NRC, 2009), particularly when they are compared to variations in CO2 emissions in other parts of the fuel production life cycle. However, actual quantities of emissions from different types of facilities can only be verified once they are in operation. GHG emissions from manufacturing of fertilizers could potentially be reduced if biochar, a coproduct from pyrolysis, is used as soil amendment for biomass feedstock production. However, the effects of biochar on plants (for example, phytotoxicity and nutrient availability) and soil (carbon mineralization) are uncertain and require further examination (Lee et al., 2010; Gell et al., 2011; Nelson et al., 2011; Zimmerman et al., 2011).
Life-Cycle GHG Emissions
The amount of GHG emitted over the life cycle of biofuels is a subject of intense research interest and public debate. This section discusses the potential GHG emissions over the life cycle of biofuels and the potential changes in global GHG emissions as a result of increasing biofuel production in the United States.
Methods for Assessing Effects
As discussed earlier in this chapter, two approaches can be used for life-cycle assessments—attributional and consequential—each of which suits a different purpose. Attributional LCA sums up the GHG emissions along a static biofuel supply chain. Consequential LCA describes the net overall GHG emissions as a result of increasing or decreasing biofuel production.
Models that have been developed for attributional LCA of GHG for biofuels commonly used in the United States include GREET (Wang et al., 2011a), BESS (Liska et al., 2009), and EBAMM (Farrell et al., 2006), among others. Plevin (2009b) found that using different models for attributional LCA does not result in drastically different outcomes if system boundaries and input data are consistent.8 In contrast, differences in methodological choices, such as treatment of coproducts, treatment of time, and assumptions of displaced energy, further complicate the comparison among studies (Box 5-2). Differences in estimates of key parameters, such as CO2 emissions from land-use change and N2O emissions from fertilization (Ogle et al., 2007; Erisman et al., 2010), have further led to discrepancies (Börjesson, 2009; Hoefnagels et al., 2010; Hsu et al., 2010).
Comprehensive consequential LCA studies that consider all GHG effects as a result of increased biofuel production, let alone RFS2 specifically, have been elusive to date. Given the importance of indirect land-use change in GHG accounting of biofuels, however, many attributional models such as GREET now add on some estimate of this parameter (Table 5-2). Another market-mediated effect that has yet to be incorporated into most modeling exercises is the “rebound effect” where the addition of biofuels, into the market leads to a less than complete displacement of petroleum-derived fuels (Fargione et al., 2010; Hochman et al., 2010).
______________
8 See Plevin (2009a,b), Liska and Cassman (2009a,b), and Anex and Lifset (2009) for an informative exchange on system boundaries and data choice in site-specific attributional LCA of corn-grain ethanol.
BOX 5-2
Methodological Assumptions Affecting GHG LCA Analyses
The practice of LCA seeks to model processes or decisions using empirical data, but in addition to dealing with the uncertainty surrounding these data, the modelers have to make a series of methodological choices and assumptions. Three examples of such choices are the treatment of coproducts, the consideration of time, and the consideration of displaced products. The choices researchers make can have dramatic effects on their results.
When a production stream leads to multiple products, modelers have to decide how to allocate the resource use and generation of pollution. Options include allocating according to the value of these products, their mass, or even by what other products they displace in the market. In the modeling of biofuel production, the treatment of coproducts such as animal feed (for example, DDGS from corn-grain ethanol and soybean meal from soybean diesel) or energy (for example, electricity cogenerated from lignin combustion when producing cellulosic ethanol) requires careful consideration as different methods may lead to very different results (Pradhan et al., 2008; Morais et al., 2010; Singh et al., 2010; van der Voet et al., 2010; Wang et al., 2011b; Börjesson and Tufvesson, 2011).
The treatment of time in an LCA also is subject to the modeler’s judgment (Delucchi, 2011; McKone et al., 2011). A carbon debt from land-use change could be incurred largely immediately following land conversion, but the offset of fossil GHG emissions might continue to occur for many years after land clearing (Marshall, 2009; McKechnie et al., 2010; Anderson-Teixeira and Delucia, 2011). Carbon debt is commonly amortized over 30 years, as in Table 5-2, but 30 years is often chosen more-or-less arbitrarily to reflect an expected life of a biorefinery. For a 30-year amortized value to be valid, converted land would have to be used continuously for biofuel production for 30 years after conversion. What is more, carbon released upon conversion is in the atmosphere for 30 years longer than carbon displaced in the 30th year of production, but a correction factor for this phenomenon is not applied consistently in LCA studies (Kendall et al., 2009; O’Hare et al., 2009; Levasseur et al., 2010).
When calculating GHG savings from biofuel production, LCA modelers also have to decide which energy sources the biofuels are displacing. Furthermore, modelers have to take into account any opportunity cost of using biomass for liquid fuels rather than electricity production. Indeed, net reductions in GHG emissions from other uses of biomass such as electricity may be higher (Campbell et al., 2009; Ohlrogge et al., 2009; Campbell and Block, 2010; Khanna et al., 2010; Lemoine et al., 2010; Melamu and von Blottnitz, 2011), but this needs to be weighted against what society desires such as liquid fuels to improve national energy security, for example. From these examples, the need for transparency when performing GHG accounting on biofuels becomes exceedingly important. More generally, the International Organization for Standards (ISO) stresses the necessity for clarity over a single methodology in its ISO 14040:2006 standard for life-cycle assessment.1
______________
1”ISO 14040:2006 describes the principles and framework for life-cycle assessment (LCA) including: definition of the goal and scope of the LCA, the life-cycle inventory analysis (LCI) phase, the life-cycle impact assessment (LCIA) phase, the life-cycle interpretation phase, reporting and critical review of the LCA, limitations of the LCA, the relationship between the LCA phases, and conditions for use of value choices and optional elements” (ISO, 2006).
Anticipated Results
Biofuels from Food-Based Feedstocks
Ethanol production efficiency has shown great improvement over the decades (Figure 5-1) (Hettinga et al., 2009; Wang et al., 2011a). Most GHG accountings of corn-grain ethanol conducted before 2008 found a reduction in GHG emissions relative to gasoline of about 20 percent9 (Farrell et al., 2006; Hill et al., 2006; Wang et al., 2007). Such analyses
______________
9 Comparisons between biofuels and petroleum-derived fuels are commonly expressed using phraseology such as “X reduces emissions relative to Y by Z%,” but there is an important caveat to such usage. Comparisons of this sort are typically made on a per unit of energy (for example, MJ) or per vehicle distance traveled (for example, mile or km) basis and assume a 1:1 displacement. The “rebound effect,” a decision to produce more biofuels, increases
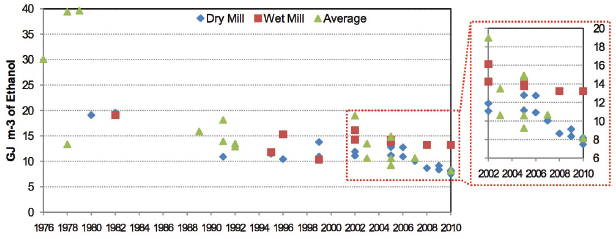
FIGURE 5-1 Historical trend in corn-grain ethanol biorefinery energy use.
SOURCE: Wang et al. (2011a). Reprinted with permission from Elsevier.
NOTE: Emissions from land-use change are not included. Results are from GREET as calibrated using BESS model inputs.
SOURCE: Adapted from Plevin (2009b) with permission from John Wiley and Sons.
| Life-cycle GHG (g CO2 eq per MJ) | Region for which the estimate was made | Indirect land-use change included | Reference |
| 77 | U.S. average | No | Farrell et al. (2006) |
| 85 | U.S. average | No | Hill et al. (2006) |
| 177 | U.S. average | Yes | Searchinger et al. (2008) |
| 52 | Individual facility in the Midwest | No | Bremer et al. (2010) |
| 104 | U.S. average | Yes | Hertel et al. (2010) |
| 101 | U.S. average | Yes | Mullins et al. (2010) |
| 69 | U.S. average | Yes | Wang et al. (2011a) |
NOTE: None of the studies listed in this table estimated specifically the extent to which volumes of corn-grain ethanol produced to meet the RFS2 consumption mandate would change GHG emissions.
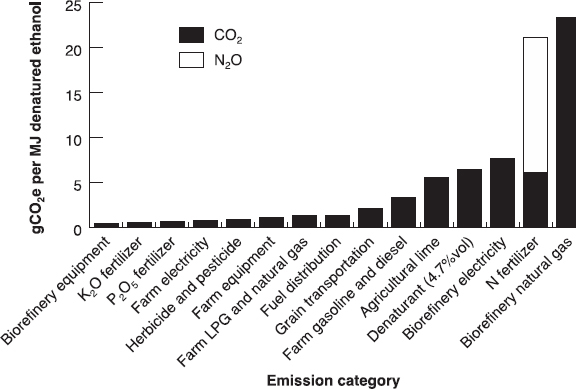
typically considered only emissions resulting from the supply chain (Figure 5-2). During 2008, the rapid increase in the amount of corn being used for ethanol resulted in a number of new studies being published that account for market-mediated effects of increased ethanol production on land-use change. A sample of modeled estimates of life-cycle greenhouse-gas emissions published from 2006 to 2011 spans 52-177 g CO2 eq per MJ (Table 5-3). The estimates vary, and some of the key drivers in differences include
- The geographic range considered;
- Whether direct or indirect land-use changes were included in the estimates;
- Assumptions used in estimating indirect land-use changes as shown in Table 5-2;
- Flux values used for N2O emissions;
- How GHG credits from coproduct production were estimated;
- Technologies and fossil fuel used in the biorefineries;
- The fraction of DDGS that is dried versus fed wet to livestock; and
- Baseline volume of ethanol production.
When the life-cycle GHG emissions in Table 5-3 are compared against the 2005 baseline GHG emissions (as in the case for RFS2), corn-grain ethanol might not have lower values than petroleum-based gasoline. Indeed, studies such as those of Mullins et al. (2010) and Plevin et al. (2010) that address uncertainty in modeled results directly have revealed plausible scenarios in which GHG emissions from corn-grain ethanol are much higher than those of petroleum-based fuels (Figure 5-3). Similar analyses that considered alternate scenarios in which corn-grain ethanol is not produced also found that corn-grain ethanol may have higher GHG emissions than petroleum-based fuels when global system boundaries are used (Feng et al., 2010).
In its Final Regulatory Impact Analysis for RFS2, the U.S. Environmental Protection Agency (EPA) (2010d) conducted what is best described as a hybrid attributional-consequential LCA approach toward assessing life-cycle GHG emissions of corn-grain ethanol
______________
availability, which depresses fuel prices and leads to greater overall consumption. As such, a 1:1 displacement is the maximum, and the actual amount of GHG emissions released as a result of increased biofuel production from a policy such as RFS2 is likely to be higher than would be calculated using a 1:1 energy-adjusted volumetric displacement (that is, GHG reductions from biofuels are likely to be exaggerated when market elasticity is ignored). This issue is closely tied to differences in attributional and consequential LCA.
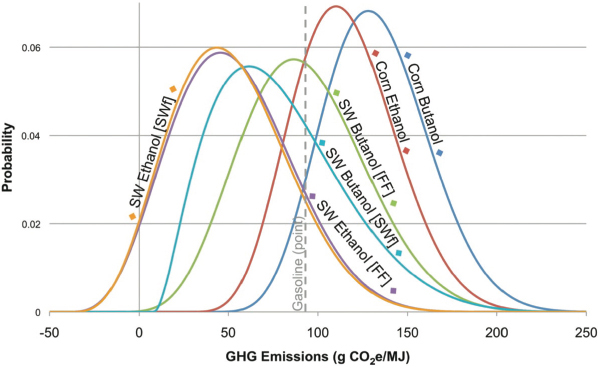
NOTE: Uncertainties in GHG emissions from land-use changes contribute most to the extending range of estimates for life-cycle GHG emissions from biofuels.
SOURCE: Mullins et al. (2010). Reprinted with permission from Environmental Science and Technology 2010, 45(1):132-138. Copyright 2010 American Chemical Society.
and other biofuels. That is, EPA included GHG emissions from land-use change (consequential approach) but only assessed the industry at given points in time (attributional approach) rather than over the entire duration of EISA, as would be called for in a consequential LCA. A thorough review of EPA’s assumptions and calculations behind its estimates of GHG emissions for various biofuels is beyond the scope of this report, but EPA’s assessment is presented as a comparison with the studies mentioned above. For a conventional biofuel such as corn-grain ethanol to qualify for RFS2, it has to meet the compliance thresholds of a 20-percent reduction in life-cycle GHG emissions compared to a 2005 gasoline baseline. The term “life-cycle greenhouse gas emissions” is defined as follows:
The term “life-cycle greenhouse gas emissions” means the aggregate quantity of greenhouse gas emissions (including direct emissions and significant indirect emissions such as significant emissions from land use changes), as determined by the Administrator, related to the full fuel life cycle, including all stages of fuel and feedstock production and distribution, from feedstock generation or extraction through the distribution and delivery and use of the finished fuel to the ultimate consumer, where the mass values for all greenhouse gases are adjusted to account for their relative global warming potential. (110 P.L. 140)
EPA estimated that corn-grain ethanol reduces GHG emissions by 21 percent relative to gasoline, allowing it to qualify for RFS2 over 2008-2022. EPA’s determination was based on its evaluation of corn-grain ethanol and other biofuels at three points in time: 2012, 2017, and 2022. Industry average emissions were calculated at each of these 3 years, as shown for corn-grain ethanol in Table 5-4. EPA found corn-grain ethanol, regardless of whether the
| Biorefinery Heat Source | Dried distillers grain with solubles (DDGS) | 2012 | 2017 | 2022 |
| Natural Gas | Dry | 33 | 10 | -17 |
| Wet | 21 | -2 | -27 | |
| Coal | Dry | 66 | 41 | 12 |
| Wet | 41 | 17 | -10 | |
| Biomass | Dry | 6 | -15 | -40 |
| Wet | -3 | -16 | -41 | |
NOTE: Positive values indicate higher emissions than gasoline, and negative values are lower. As of 2011, nearly all corn-grain ethanol biorefineries use natural gas or coal as heat sources. Most facilities would have to be retrofitted in short order to achieve the GHG emissions from corn-grain ethanol produced by facilities using biomass as the heat source listed in the table.
SOURCE: EPA (2010b).
coproduct is sold wet or dry, to have life-cycle GHG emissions higher than gasoline in 2012 or 2017 unless it is produced in a biorefinery that uses biomass as a heat source (Table 5-4). EPA calculated its 21-percent GHG reduction as a weighted average of projected biorefinery and corn production efficiencies that could be realized in 2022 (Plevin et al., 2010). Thus, according to EPA’s own estimates, corn-grain ethanol produced in 2011, which is almost exclusively made in biorefineries using natural gas as a heat source, is a higher emitter of GHG than gasoline. Nevertheless, corn-grain ethanol produced at the time this report was written still qualified for RFS2 based on EPA’s industry-weighted average of projected 2022 industry. The discrepancy between how RFS2 is implemented (under the assumption of 21-percent reduction of GHG emissions by corn-grain ethanol compared to gasoline) and EPA’s own analysis suggests that RFS2 might not achieve the intended GHG reductions. According to EPA’s results (Table 5-4), atmospheric GHG concentrations will be higher in the presence of RFS2 due to the cumulative GHG effect of corn-grain ethanol produced over 2008-2022 than in the absence of RFS2, in which case gasoline would be used. EPA’s evaluation of other biofuels follows a similar methodology. Therefore, the GHG reductions in other types of biofuels described in the RFS2 Final Rule also deserve similar scrutiny as the industry develops.
For food-based biofuels other than corn-grain ethanol, a consensus on whether biodiesel from oilseeds reduces GHG emissions has not been reached within the scientific community. Although GHG emissions in the direct supply chain tend to be small (Hill et al., 2006; Huo et al., 2009), those associated with land-use change far dominate the life-cycle emissions because feedstocks with low energy yields, such as soybean, tend to require large amounts of land (Miller, 2010).
Biofuels from Wastes and Residues
Biofuels produced from wastes such as agricultural and forestry residues, municipal solid waste (MSW), and waste grease have consistently been shown to have lower life-cycle GHG emissions than petroleum-based fuels. For agricultural and forest residues, low life-cycle GHG emissions will only be realized under conditions that do not interfere with land productivity or soil carbon storage (Cherubini and Ulgiati, 2010; Karlen et al., 2010). Based on the potential volume of wastes, biofuels from MSW were estimated to be able to replace about 2 percent of petroleum-based fuels in the United States (Kalogo et al., 2006) and about 5 percent globally (Shi et al., 2009).
Biofuels from Dedicated Energy Crops
The use of herbaceous and woody dedicated energy crops for biofuels could lower or raise GHG emissions depending on how and where these crops are grown. If land already in food crop production or in pasture is converted to dedicated energy crops, the resulting carbon debt from market-mediated effects might be sufficiently high to offset any carbon savings otherwise realized (Roberts et al., 2010). Similar uncertainty lies in the use of agricultural land not currently in agricultural production, such as abandoned land or reserve land, because the fossil carbon saved by displacing petroleum would need to exceed the carbon storage that would have occurred on that land in the absence of biofuel production (carbon opportunity cost). Lands that are currently uneconomic for crop production because of one or more limiting characteristics, whether in production or not (Wiegmann et al., 2008), could also be used if they meet EISA’s land requirements. In those cases, the same considerations of direct and indirect carbon debts and carbon opportunity costs apply.
The relative uncertainty surrounding GHG emissions from biofuels from dedicated energy crops was highlighted by Spatari and MacLean (2010). They used a Monte Carlo simulation to show potentially high and uncertain GHG emissions for switchgrass ethanol largely as a result of CO2 flux from land-use change and N2O flux from nitrogenous fertilizer use. In comparison, the authors demonstrated much greater confidence in ethanol from corn-stover biofuels for reducing GHG emissions. In any case, GHG emissions from a given piece of land producing cellulosic biofuels are expected to be lower than those from lands producing corn-grain ethanol or soybean biodiesel (Hammerschlag, 2006; Williams et al., 2009).
Estimating Effects of Achieving RFS2 on GHG Emissions
From the assessment of the literature above, the committee concluded that
- Food-based biofuels such as corn-grain ethanol have not been conclusively shown to reduce GHG emissions and might actually increase them.
- Biofuels from agricultural and forestry residues and municipal solid waste are most likely to reduce GHG emissions.
- Biofuels from dedicated bioenergy crops such as switchgrass may either reduce or increase GHG emissions depending on how and where biomass is grown.
These conclusions do not provide a complete evaluation of the effect of achieving the RFS2 consumption mandate on GHG emissions. Indeed, the published studies mentioned in this report do not and cannot address that issue. Understanding the effect of RFS2 on global GHG emissions would require preparation of a consequential LCA that assesses cumulative effects over time (that is, all years up to 2022 would be considered rather than considering the GHG effects in the year 2022 only). As in all LCAs, GHG released and stored throughout the many steps in the supply chain—from biomass production, harvesting and transport, conversion to fuels in biorefineries, to distribution and use—are considered. In addition, any market-mediated effects on land-use change and petroleum markets as a result of U.S. biofuel policy would have to be accounted for. Such consequential LCA would require the following information to be collected over time or estimates to be made:
- Information on and estimates of what biofuels are produced, how they are produced, and how they affect and are affected by agricultural and energy markets. As mentioned in an earlier section, these factors have large effects on net GHG emissions of biofuels;
- Data and estimates of market-mediated effects of land use, commodity markets, and energy markets over time; and
- Information on the extent to which the introduction of new biofuels into fuel markets displaces petroleum-based fuel production, so as to verify the assumption of complete displacement of petroleum-based fuel by biofuels used in attributional LCAs.
In preparing a complete LCA for assessing the future effects of achieving RFS2 on global GHG emissions, two sets of scenarios have to be evaluated and compared with each other. In the first set of scenarios, the functional unit would be defined as the volume of biofuel produced as a result of RFS2 given all the other factors that influence global biofuel and conventional fuel production. Scenarios in this set could include, for example, various market conditions and levels of technology. In the second set of scenarios, RFS2 would not be enacted and some greater amount of petroleum-based fuel is used and less land is repurposed for biofuel production. Scenarios in this set would be matched to the various market conditions and levels of technology evaluated in the first set. Compared to each other, the two sets of scenarios would provide an indication of whether enacting RFS2 leads to a net decrease in global GHG emissions. For policy evaluation and design, a third set of scenarios may be used in which alternative means of reducing GHG emissions are considered, including the use of biomass for bioelectricity, bioproducts, or building materials.
Production and use of biofuels release air pollutants other than GHG that affect people and their surroundings. Air pollutants from biofuels include criteria air pollutants (for example, carbon monoxide [CO], sulfur dioxide [SO2], nitrogen oxides [NOx], particulate matter [PM], and ozone [O3]); precursors to the atmospheric formation of PM or O3 (including ammonia [NH3] and volatile organic compounds [VOCs]); and other hazardous air pollutants, many of which are themselves VOCs (for example, acetaldehyde, benzene, 1,3-butadiene, and formaldehyde). These pollutants have varied effects, including damage to human health (for example, cancer, cardiovascular disease, respiratory irritation, and birth defects) and the environment (for example, reduced visibility, acidification of water and soils, and damage to crops) (Aneja et al., 2009; Uherek et al., 2010).
Emissions from Biofuel Use
On-road vehicles are a major source of many pollutants affecting air quality (Abu-Allaban et al., 2007; Frey et al., 2009). The use of biofuels in vehicles is responsible for emissions of pollutants through evaporation and combustion. The quantity of these emissions depends on various factors, including combustion technologies, emission controls, temperature, and the level at which biofuels are blended into petroleum-based fuels. Reviews of the literature have revealed that relative to petroleum-based fuels, the use of biofuels tends to decrease emissions of some pollutants while increasing those of others. In general, low-level blends of ethanol into gasoline, such as E10 typically lead to lower CO emissions but higher emissions of other species such as nonmethane hydrocarbons (NMHCs), nonmethane organic gas, acetaldehyde, benzene, and 1,3-butadiene (Table 5-5) (Durbin et al., 2007; Jacobson, 2007; Graham et al., 2008; Ginnebaugh et al., 2010). The use of ethanol as an oxygenate in reformulated gasoline does little to reduce ozone levels and may even increase them in areas (NRC, 1999). Higher ethanol blends such as E85 tend to have lower emissions
| E10 | E85 | |
| Nonmethane hydrocarbons (NMHCs) | +9 | –48 |
| Nonmethane organic gas | +14 | NDa |
| Acetaldehyde | +108 | +2540 |
| 1,3-Butadiene | +16 | –77 |
| Benzene | +15 | –76 |
| Nitrous oxides (NOx) | NDa | –45 |
| Formaldehyde | NDa | +73 |
| Carbon monoxide (CO) | –16 | NDa |
aNo statistical difference at p = 0.05
SOURCE: Graham et al. (2008).
of NOx, NMHCs, 1,3-butadiene, and benzene, but higher emissions of acetaldehyde and formaldehyde (Graham et al., 2008; Anderson, 2009; Yanowitz and McCormick, 2009). In general, use of biodiesel blended into diesel reduces PM, CO, and hydrocarbon emissions, but increases those of NOx (McCormick, 2007; Pang et al., 2009; Traviss et al., 2010). Other biofuels such as biobutanol could reduce certain tailpipe emissions (Mehta et al., 2010).
Emissions from Biofuel Production and the Full Life Cycle
Much effort has gone into estimating tailpipe emissions from biofuels, but such a narrow focus misses emissions elsewhere in the life cycle. For example, for corn-grain ethanol produced using natural gas at a dry-mill biorefinery, the vehicle use phase, which includes tailpipe emissions and evaporative emissions from vehicles and filling stations, is responsible for over 90 percent of CO emissions, but only 68 percent of VOC, 22 percent of primary PM2.5, 17 percent of NOx, 13 percent of NH3, and less than 1 percent of SOx emissions (Hill et al., 2009). The importance of considering supply chain air pollutant emissions when evaluating transportation options is not unique to biofuels. In a survey of automobiles, buses, trains, and airplanes, Chester and Horvath (2009) found criteria air pollution emissions from the nonoperational stages of a vehicle’s life cycle (for example, fuel production, vehicle manufacture, infrastructure construction, maintenance, and operation) to be between 1.1 and 800 times larger than vehicle operation.
For corn-grain ethanol, life-cycle emissions of major air pollutant species (for example, CO, NOx, PM2.5, VOC, SOx, and NH3) are higher than for gasoline (Figure 5-4) (Wu et al., 2006; Hess et al., 2009; Hill et al., 2009; Huo et al., 2009). Cellulosic ethanol from either corn stover or dedicated bioenergy crops (such as switchgrass or Miscanthus) shows a similar pattern, although SOx life-cycle emissions could be lower than that of gasoline depending on the extent to which cogenerated electricity produced at the biorefinery offsets fossil electricity, mainly from coal (Wu et al., 2006; Hill et al., 2009). Further improvements in efficiency and pollution control throughout the life cycle, including at biorefineries (Jones, 2010; Spatari et al., 2010), would reduce biofuel life-cycle emissions. Although GHG emissions from land-use change as a result of bioenergy feedstock production have been widely discussed, land-use change also affects air quality directly. Such effects from changes on the U.S. and global landscape could potentially be appreciable, as has been estimated in the conversion of tropical rainforest to palm oil plantations leading to greater emissions of VOC and NOx, and thus higher ground-level ozone (Hewitt et al., 2009).
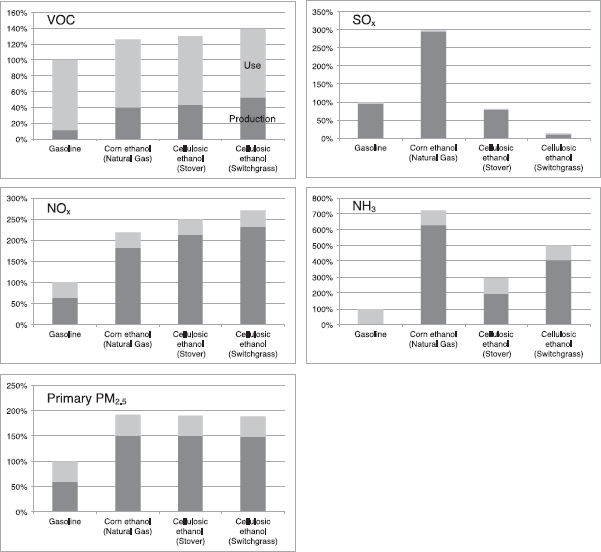
NOTE: For each pollutant, values are scaled to life-cycle emissions of gasoline at 100 percent.
DATA SOURCE: Hill et al. (2009).
Effects on Human Health and Environmental Effects
Unlike GHGs, which are mixed in the atmosphere and affect climate change at a global level, air-quality pollutants affect the environment on local and regional scales. As such, life-cycle inventories of quantities of air-quality pollutants, such as those discussed in the previous section, do not themselves describe the ultimate effect of these pollutants. Such methods as impact pathway analysis could be used to assess the ultimate effect. Studies that have considered the ultimate impacts of biofuels have consistently found corn-grain ethanol to have human health damage costs equal to or higher than gasoline (Figure 5-5) (Hill et al., 2009; Kusiima and Powers, 2010; NRC, 2010a). Conversely, the same studies found that human health damage costs from cellulosic ethanol are likely to be lower than those of corn-grain ethanol and could be marginally better than those of gasoline.
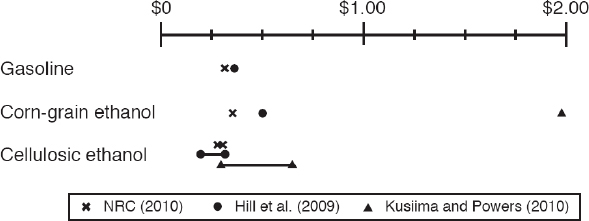
NOTE: The three studies did not consider exactly the same pollutants. For example, unlike Hill et al. (2009) and Kusiima and Powers (2010), NRC (2010a) did not consider NH3 emissions. Horizontal lines represent the ranges of estimates.
Air-Quality Effects of RFS2 Estimated by EPA
EPA’s assessment of RFS2 is summarized in its regulatory announcement:
The increased use of renewable fuels will also impact emissions with some emissions such as hydrocarbons, nitrogen oxides (NOx), acetaldehyde and ethanol expected to increase and others such as carbon monoxide (CO) and benzene expected to decrease. However, the impacts of these emissions on criteria air pollutants are highly variable from region to region. Overall the emission changes are projected to lead to increases in population-weighted annual average ambient PM and ozone concentrations, which in turn are anticipated to lead to up to 245 cases of adult premature mortality. (EPA, 2010a)
EPA began publishing its assessment of RFS2 in the peer-reviewed literature in 2010. Cook et al. (2011) considered changes in concentrations of various pollutants and found that increased ethanol use as a result of RFS2 would increase O3 concentrations over much of the United States by as much as 1 part per billion (ppb) by 2022. Certain highly populated areas are projected to show decreases in O3 concentrations due to increased NOx emissions in VOC-limited areas. Changes in concentrations of other species are mixed (Table 5-6).
Feedstock Production
Effects on water quality from increased biofuel production are caused by changed use of land to produce crops for feedstock, the use of water for irrigating crops, and conversion of crops to fuel in the production process itself. (Water use in conversion of biomass to fuel is discussed later.) Water quality is affected by original soil and land-cover conditions; amount, type, and timing of fertilizer applications; management practices such as tillage; and prevailing weather, particularly the amount and duration of heavy rainfall in relation
TABLE 5-6 Nationwide Emission Inventories for 2022 for the Renewable Fuel Standard (RFS) and RFS2
| Pollutant | U.S. Total RFS | U.S. Total RFS2 | RFS2 versus RFS |
| Annual Tons | Annual Tons | Percent Change | |
| Nitrous oxides (NOx) | 11,415,147 | 11,781,115 | 3.21 |
| Hydrocarbons (HC) | 10,292,785 | 10,412,658 | 1.16 |
| Particulate Matter10 (PM10) | 11,999,983 | 12,068,629 | 0.57 |
| Particulate Matter2.5 (PM2.5) | 3,371,024 | 3,389,223 | 0.54 |
| Carbon monixide (CO) | 51,631,075 | 47,011,171 | -8.95 |
| Benzene | 226,683 | 217,021 | -4.26 |
| 1,3-Butadiene | 14,458 | 14,264 | -1.34 |
| Acetaldehyde | 58,405 | 65,722 | 12.53 |
| Formaldehyde | 140,156 | 140,330 | 0.12 |
| Acrolein | 6,399 | 6,477 | 1.23 |
| Ethanol | 457,071 | 906,719 | 98.37 |
| Sulfur dioxide (SO2) | 8,878,706 | 8,936,086 | 0.65 |
| Ammonia (NH3) | 4,213,048 | 4,213,189 | 0.00 |
NOTE: RFS enacted by the Energy Policy Act of 2005. RFS2 refers to amendments made under EISA.
SOURCE: Cook et al. (2011).
to fertilizer applications (Engel et al., 2010). The portion of nitrogen fertilizer that becomes nitrified to its most mobile form (nitrate) leaches from fields during precipitation events, creating runoff to streams and infiltration to groundwater. As with all other environmental effects, water-quality implications of biofuel production need to be compared to alternate uses of the land and to effects of fossil fuel exploration, extraction, production, and delivery.
The effects of producing bioenergy feedstock on water quality depend largely on the choice of feedstock and its management. Corn requires higher levels of inputs than most annual crops (NRC, 2008), including large amounts of nitrogen fertilizer. (See also Table 5-1 earlier.) Crops that could serve as feedstocks for cellulosic biofuels are expected to exert less harmful effects on water quality than corn and to reduce nutrient runoff because of less intensive land management practices. For example, perennials (switchgrass, Miscanthus, prairie polyculture, poplar, willow, pine, and sweet gum) affect water quality less than annual crops because of lower fertilization requirements and reduced need for tillage, which exposes the soil to wind and water erosion and to microbial oxidation. But even perennial crops such as switchgrass and hybrid poplar trees (grown in a short rotation of 4-6 years) can benefit from fertilization, in most cases, to maximize yields for feedstock production. Fertilizing these perennials can cause some nutrient runoff, although less than fertilizing row crops such as corn and soybean because of perennials’ superior nutrient uptake efficiency. Planting perennial bioenergy crops in sites with high erosion, or using perennials as buffer strips between annuals and riparian zones, could offer net improvements in water quality as deep-rooted perennials absorb excess nutrients from annuals; reduce erosion, runoff, and other downstream effects; and reduce requirements for pesticides.
Water quality effects discussed in this section include
- Nutrient runoff to surface waters (nitrogen, phosphorus, silica)
- Pesticide runoff (herbicides and insecticides)
- Soil erosion and runoff (sedimentation of habitats and increased turbidity)
- Nutrient percolation, infiltration, and contamination (nitrate).
The qualitative effects of growing bioenergy feedstocks are not different than existing agriculture for the same crops. If growing bioenergy feedstocks increases the extent of agriculture of annual crops within a given basin, it could cause greater effects on water quality. To date, corn grain has been used to produce ethanol, and soybean has been used to produce biodiesel. Acres of corn and soybean planted in the United States have increased during the growth of the biofuel industry (2000-2009) from about 73 to 93 million acres for corn, and from 72 to 77 million acres of soybean (see Figure 4-8 in Chapter 4). Increased acreages of corn have been planted in Iowa and Nebraska, the leading states in ethanol production (Agnetwork, 2010). In addition to increased acres planted in corn, the average yield across the nation has increased from 137-156 bushels per acre from 2000-2010 (USDA-ERS, 2010b). (See also Figure 2-3 in Chapter 2.) The long-term trend for corn yields from 1990-2010 was an increase of about 2 bushels per acre per year. In 2010, 88 million acres of corn were planted, from which 13 billion bushels of corn were harvested.
Methods to Assess Effects
Methods to assess the effects mentioned above include monitoring and modeling of water quality. Monitoring is used by states to determine whether surface waters are meeting their designated uses under Section 303(d) of the Clean Water Act. These designated uses generally fall into three broad categories, which may be subdivided further:
- Aquatic life (aquatic ecosystems health)
- Primary and secondary contact recreation (swimming and boating)
- Drinking water (human health).
If designated uses of the water are not met, the water is considered “impaired.” The state then needs to list the lake, reservoir, river, or stream on its list of impaired water bodies and make a calculation and a plan of how to restore it. This process includes establishing Total Maximum Daily Loads (TMDLs) for the water body.
Interestingly, states have been reluctant to promulgate nutrient water quality criteria for their surface waters. In some cases, the reluctance might be a result of stringent criteria recommended by EPA (Heltman and Martinson, 2011). Many lakes and streams would be considered impaired as a result of strict application of such criteria. In states such as Iowa, where nearly 90 percent of the land is already in agricultural use, more than half of all water bodies would be designated as impaired because of nutrient runoff. Solving the problems caused by nutrient runoff would require a detailed TMDL to be developed for all impaired waters and a management plan formulated. However, because runoff from agriculture is not considered a “point source” in the Clean Water Act, permits are not required for farmers to release runoff while producing agricultural crops. Thus, there is no easy way to mitigate the nutrient runoff problem, although integrating perennial biomass feedstock crops into these landscapes to protect water resources could help.
Currently, long-term data are collected and maintained by the U.S. Geological Survey (USGS) in the National Stream-Quality Accounting Network (NASQAN) and National Water-Quality Assessment (NAWQA) programs. These data provide baseline and continuing comparable data to evaluate changes that could then be correlated with regional dynamics in land use, land cover, weather, and climate (for example, Sprague et al., 2011). As with any regional-scale study that integrates across watersheds, water-quality effects are attributed to multiple causes. Further experiments and monitoring designed at spatial and temporal resolutions to assess the effects of biofuel production on water-quality would be useful.
Models to assess the effects of changes in land use and stream or lake quality are many, and they differ in their goals, assumptions, approaches, complexity, and amount of input data required to analyze the problem. Some of the leading watershed and stream models include the Soil and Water Assessment Tool (SWAT, USDA),10 River and Stream Water Quality Model (QUAL2K, EPA),11 Water Quality Analysis Simulation Program (WASP, EPA),12 CE-QUAL (U.S. Army Corps of Engineers),13 Spatially Referenced Regressions On Watershed Attributes (SPARROW, U.S. Geological Survey),14 and Hydrological Simulation Program—FORTRAN (HSPF, EPA).15 Soil erosion is a key part of several of these models. The Revised Universal Soil Loss Equation (RUSLE, USDA)16 has been extensively used over large areas and long time frames (annual averages) to determine soil erosion. Delivery of soil to the stream is more complicated, and few models other than SWAT and HSPF perform such operations. Only SWAT and HSPF represent processes for an entire agricultural watershed including erosion and runoff from the field to the stream and also in-stream transport and reactions. These two models require considerably more input data than other models for their simulations. Groundwater models include the Groundwater Monitoring System (GMS) with submodels MODFLOW, MT3D, and others. USGS uses land physiographic, hydrologic, and applications factors in multiple linear regression models for both groundwater and surface water projections.
Anticipated and Observed Effects
Nitrogen loads are measured and modeled to be in excess of 5,650 lbs/mi2 per year (or 1,000 kg/km2 per year as shown in Figure 5-6) in the Corn Belt of the Midwest. This loading
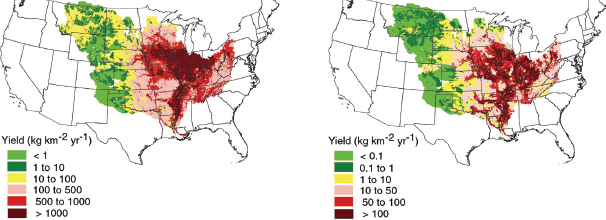
NOTE: The largest yields emanate from areas where significant areas of land are planted in corn row crop.
SOURCE: Alexander et al. (2008) based on historical data and the SPARROW model. Reprinted with permission from Environmental Science and Technology 2008, 42(3):822-830. Copyright 2008 American Chemical Society.
______________
11http://www.epa.gov/athens/wwqtsc/html/qual2k.html.
12http://www.epa.gov/athens/wwqtsc/html/wasp.html.
13http://www.pdc.pdx.edu/ce-qual/.
14http://water.usgs.gov/nawqa/sparrow/.
represents 5 to 10 percent of the nitrogen applied to corn and a significant economic loss for the farmer. But it also impairs downstream uses all the way from the farm to its ultimate discharge in the Gulf of Mexico. Discharges from the Mississippi River-Atchafalaya Basin exacerbate hypoxia17 during July to October in the Gulf that threatens shrimp, crab, and oyster fisheries over an area of 7,800 mi2 (the approximate area of hypoxia in 2007 and 2008). Hypoxia occurs naturally in many coastal waters, and the occurrence and extent of hypoxia are the collective result of a complex combination of basin morphology, climate, weather, circulation patterns, water retention times, freshwater inflows, stratification, mixing, and nutrient loadings (Dale et al., 2010b). Several hypoxic events occurred from 1870 to 1910 prior to widespread fertilizer use and were attributed to natural variation in river flow (Osterman et al., 2005). However, the increase in the area of hypoxia (Rabotyagov et al., 2010) and its sensitivity to nutrient loads (Liu et al., 2010) have been largely attributed to nitrogen loadings, phosphorus fluxes, and cultural eutrophication (Bricker et al., 1999; Rabalais and Turner, 2001; Scavia et al., 2003; Turner et al., 2006; Scavia and Liu, 2009). The observed export of nitrate into aquatic systems varies annually because of variations in nitrate fertilizer application rates and because of the effect of hydrology and weather on the storage of nitrate in soil versus leaching (Donner et al., 2002; Donner and Kucharik, 2003).
There is evidence that EISA and the push for biofuels has caused more land to come into corn production (USDA-ERS, 2010b). The area of corn planted in the United States peaked in 2007 (93.5 million acres; see also Figure 4-8 in Chapter 4) when corn prices were high and corn-grain ethanol production was rapidly increasing (NCGA, 2010), and acreage planted in 2011 is projected to be the second highest in the United States since 1944 (USDA-NASS, 2011). Increased cropping area of corn for ethanol production is assumed to exacerbate eutrophication and hypoxia due to the high inputs of nitrogen, phosphorus, and pesticides required for corn production (NRC, 2008).
A recent analysis of NAWQA data by Sprague et al. (2011) (Table 5-7) found that since 2000 most of the drainages associated with the Mississippi River increased in flow-normalized concentration and flux of nitrate. Nitrate fluxes are affected by several factors including input and discharge rate associated with weather dynamics. Moreover, additional land-cover change associated with corn-grain ethanol has occurred since 2008. Therefore, monitoring designed to assess the effects of biofuels on water quality is needed to ascertain the effects of increasing biofuel production on water quality.
Measured nutrient loadings coming from land with a higher percentage of land planted in corn tend to have greater nutrient loadings as modeled for the Mississippi River Basin by Alexander et al. (2008) (Figure 5-6). Models by Scavia and colleagues (Scavia et al., 2003; Scavia and Liu, 2009), Rabalais and Turner (2001), and Turner et al. (2006) relate the hypoxic area in July to August to the nitrogen loading emanating from the Mississippi River and Atchafalaya River from May to June. Thus, increases in nitrogen runoff serve to increase gulf hypoxia according to the models.
Donner and Kucharik (2008) projected annual mean dissolved inorganic nitrogen flux to the Gulf of Mexico to increase by 10 to 18 percent if an additional 15 billion gallons of corn-grain ethanol is to be produced. They used two land-use scenarios—one that combines land-use shifts and corn planting on CRP land in corn-growing counties and another that produces corn-grain for 15 billion gallons of ethanol without the diversion of any corn from other current uses. The two scenarios were compared to a control case based on mean land use and land cover from 2004 to 2006. Donner and Kucharik’s estimates do not directly
______________
17 “Hypoxia is the condition in which dissolved oxygen is below the level necessary to sustain most animal life–generally defined by dissolved oxygen levels below 2mg/l (or ppm)” (CENR, 2000).
TABLE 5-7 Net Change in Flow-Normalized Nitrate Concentration and Flux Between 1980 and 2008
| Site | Flow-Normalized Concentration of Nitrate as N | Flow-Normalized Flux of Nitrate as N | |||||
| Annual Mean Flow-Normalized Concentration in 1980, mg/L (10-4 oz/gal) | Change, 1980-2008, mg/L (10-6 oz/gal) | Change, 1980-2008, Percent |
Total Annual Flow-Normalized Flux in 1980, 108 kg/yr (108 lbs/yr) |
Total Annual Flow- Normalized Yield (Flux Per Unit Area) in 1980 (kg/ km2/yr) (lbs/mi2/yr) |
Change, 1980-2008, 108 kg/yr (108 lbs/yr) | Change, 1980-2008, Percent |
|
| Mississippi River at Clinton, IA | 1.13 (1.51) |
0.86 (115) |
76 | 0.66 (1.46) |
297 (1700) |
0.44 (0.97) |
67 |
| Iowa River at Wapello, IA | 5.02 (6.70) |
0.17 (22.7) |
3 | 0.59 (1.30) |
1813 (10400) |
-0.02 (-0.04) |
-3 |
| Illinois River at Valley City, IL | 3.81 (5.09) |
-0.04 (-5.34) |
-1 | 0.99 (2.18) |
1433 (8180) |
-0.01 (-0.02) |
-1 |
| Mississippi River below Grafton, IL | 2.56 (3.42) |
0.49 (65.4) |
19 | 3.33 (7.34) |
751 (4290) |
0.47 (1.04) |
14 |
| Missouri River at Hermann, MO | 0.96 (1.28) |
0.72 (96.1) |
75 | 0.90 (1.98) |
67 (382) |
0.51 (1.12) |
57 |
| Mississippi River at Thebes, IL | 1.93 (2.58) |
0.38 (50.7) |
20 | 4.74 (10.4) |
257 (1470) |
0.44 (0.97) |
9 |
| Ohio River at Dam 53 near Grand Chain, IL | 0.99 (1.32) |
0.03 (4.01) |
3 | 3.10 (6.83) |
590 (3370) |
-0.04 (-0.09) |
-1 |
| Mississippi River above Old River Outflow Channel, LA | 1.25 (1.67) |
0.13 (17.4) |
10 | 8.11 (17.88) |
278 (1590) |
0.69 (1.52) |
9 |
SOURCE: Sprague et al. (2011). Reprinted with permission from Environmental Science & Technology 2011, 45(17):7209-7216. Copyright 2011 American Chemical Society.
estimate the effect of increasing biofuel production as a result of RFS2, as their baseline scenario is no ethanol production. Before RFS went into effect in 2005, 3.9 billion gallons of ethanol were produced. Modeling two scenarios, one that uses corn grain and cellulosic biomass to meet the consumption mandate of RFS2 and another that uses only cellulosic biomass to meet the consumption mandate, Costello et al. (2009) found that using only cellulosic biomass for biofuel production could reduce nitrate output from the Mississippi and Atchafalaya River basins by an average of 20 percent.
Nutrient runoff increases nitrogen concentration in surface waters, which causes excessive algal and plant growth and loss of transparency in the water column. Those effects, in turn, change habitats for biota and cause taste and odor problems for drinking water supplies. To the extent that RFS2 increases corn and soybean production, it is expected to increase nutrient runoff (Donner and Kucharik, 2008). To the extent that cellulosic feedstock production under RFS2 accelerates change from traditional cultivation to well-managed perennials and reduces runoff, it can provide water-quality benefits by reducing nutrient and sediment runoff. The effects of second-generation biofuel policies on water quality could be positive or negative depending on the location of the feedstocks, choice of feedstock, management practices used, and overall land-use changes. Given U.S. biofuel production goals under RFS2, data need to be collected to document how these shifts in land use actually affect water quality.
As corn acreage and yields increase, greater nitrogen fertilizer is required to replace the nitrogen taken off the land in the crop. Thus, there is a tendency for greater runoff and loadings to streams and rivers from increased corn production (Donner et al., 2002; Donner and Kucharik, 2003). USDA (Malcolm and Aillery, 2009) used a national agricultural sector model to estimate the expected market and environmental outcomes of producing 15 billion gallons of corn-grain ethanol in 2016 (as reflected in EPA’s RFS2) compared to a baseline of 12 billion gallons of corn-grain ethanol. They projected an increase of 3.7 million acres of corn including 1.7 million acres of continuous corn as a result of achieving the mandate for conventional biofuels in 2016. The projected increase in corn acreage was estimated to cause a 2.1-percent increase in sheet erosion of soil, 2.5-percent increase in nitrogen runoff (29,200 tons of nitrogen), and a 2.8-percent increase in runoff of pesticides. Simpson et al. (2008) estimated that a long-term increase of 16 million acres of corn could be added to account for future biofuel production.
Mubako and Lant (2008) used nitrogen, phosphorus, and pesticide application rates from Hill et al. (2006) to estimate total water-quality effects of corn-grain ethanol. Application rates were assumed to average 130 lbs N per acre, 47 lbs P per acre, and 2.0 lbs pesticides per acre (or 146 kg N/ha, 53.1 kg P/ha, and 2.3 kg pesticides/ha, as shown by Mubako and Lant, 2008), yielding estimates of applications on a volumetric basis: 65.5 g N/L, 23.8 g P/L, and 1.03 g pesticides/L of ethanol produced (Table 5-8). Assuming 10.6 t/ha of soil erosion, then 4.8 kg of soil are eroded per liter of ethanol produced. Further, using 21.1 MJ as the energy value of a liter of ethanol and a net energy return on energy invested of 1.25 (Hill et al., 2006), Mubako and Lant (2008) concluded that 15.5 g N, 5.65 g P, 0.24 g pesticides, and 1.13 kg of eroded soil are required per (net) MJ of energy gained from ethanol.
Using crop residues, such as corn stover, could cause greater or less soil erosion than other options. But in cases of high crop yield, excessive residues could reduce performance of no-till drill techniques and reduce crop production. In those cases, some residue removal could enhance no-till management (Siemens and Wilkins, 2006; Edgerton, 2010). Corn stover is likely to be supplied from the heart of the Corn Belt, centered in Iowa and Illinois at locations near to ethanol production facilities (Chapters 2 and 3). Regarding utilization of corn stover, the Water Erosion Prediction Project (WEPP) computer model has been used
| Nitrogen (N) | Phosphorus (P) | Pesticides | Erosion | |
| Application rate, kg/ha (lbs/acre) | 146.1 (130.4) |
53.1 (47.4) |
2.3 (2.05) |
10,620 (9,475) |
| Application rate, kg per tonne of corn produced (lbs/bushel) | 15.46 (0.866) |
5.62 (0.315) |
0.243 (0.014) |
1124 (62.9) |
| Application, kg per tonne of ethanol produced (lbs per ton of ethanol produced) | 51.71 (114.0) |
18.80 (41.45) |
0.814 (1.79) |
3759 (8,287) |
| Mass ratio of N, P, pesticides, and erosion to ethanol | 0.052 | 0.019 | 0.0008 | 3.76 |
| Application rate, g/L ethanol (oz/gallon) | 65.54 (8.75) |
23.83 (3.18) |
1.03 (0.137) |
4764 (636.12) |
| Application rate g per MJ net energy gain (oz/BTU) | 15.53 (5.78×10-04) |
5.65 (2.10×10-04) |
0.24 (8.93×10⁻⁶) |
1129 (0.042) |
NOTE: Values in U.S. standard units are shown in parentheses.
SOURCE: Mubako and Lant (2008).
to simulate soil loss in Iowa at 17,848 sites based on the 1997 National Resources Inventory (Newman, 2010). Prepared soil erosion hazard maps indicate that harvesting of any corn stover is not recommended on the most steeply sloped soils. However, most sites can withstand some removal, and many sites can sustain 40- to 50-percent removal of corn stover or more, based on soil erosion considerations only.
The effects of RFS2 on those environmental qualities can be estimated by a consequential LCA. However, neither attributional nor consequential LCAs that project the effects of biofuel production on quality of surface water, streams, and groundwater have been completed (Secchi et al., 2011). Precise information on the location of feedstock production, type of feedstock grown, management practices used, and any changes in land cover is necessary for such analysis. However, the SWAT model and SPARROW model have been used to determine differences in water quality attributable to various crop covers, including corn, soybean, sugarcane, switchgrass, woody crops, and other grasses. For example, the SWAT model was used to examine nitrogen loadings in various subwatersheds and land covers of the Raccoon River in central Iowa (Schilling and Wolter, 2008). As expected, corn yielded the greatest nitrogen loadings to the Raccoon River watershed (about 7,800 mi2) of any land cover studied in Iowa. However, the model was also able to apportion the nitrogen loading to the exact practice or process from which it emanated. Mineralization from stored soil nitrogen was the greatest input causing long-term delivery of nitrogen into streams long after other nitrogen applications ceased. Fertilizer inputs were the second most important, followed by manure applications and atmospheric deposition. The relationship between fertilizer application rates and nitrogen loading into surface water is not linear: that is, decreasing fertilizer application rates do not decrease nitrate loading delivered to the receiving stream by the same magnitude. A decrease in fertilizer application rate from 152 to 45 lbs per acre only reduced the nitrate loading at the watershed outlet by 30 percent. Changing land cover, as in putting land enrolled in CRP to row crop in the Raccoon River watershed, increased nitrate loads at about a 1:1 ratio. For example, if 9.5 percent of the land in the watershed were changed to row crop from CRP, it would result in an 8.9-percent increase in nitrate load. There was a larger effect on nitrate loadings from converting
floodplain alluvial soils to corn than from upland sloped soils, so the location of the land conversion within the watershed is important (Schilling and Wolter, 2008).
In general, using cover crops of legumes, cereals, or grasses in fields during noncrop periods to reduce nitrate leaching during vulnerable fall and spring periods was the most effective practice to decrease nitrogen loadings, especially from baseflow or tile drainage (Schilling and Wolter, 2008). Changing from conventional anhydrous ammonia application on corn to innovative subsurface injection methods was the most effective management practice to reduce nitrate loadings from surface runoff. Thus, to the extent that biofuel policies successfully promote use of cover crops and more efficient agricultural practices, they will improve water quality.
The SWAT model indicates that perennial crops with lower nitrogen inputs, no tillage, and perennial root systems can be used to decrease nitrogen loadings to streams as compared to other crops and management regimes. Sahu and Gu’s modeling results (2009) showed that planting switchgrass as a contour or riparian buffer in the Walnut Creek watershed in Iowa can reduce nitrate outflow. The extent of nitrate reduction depends on the size and location of the buffer strips. Ng et al. (2010) simulated the effects of planting Miscanthus in place of conventional row crops on nitrate loading in Salt Water Creek, Illinois. They found that nitrate loading was projected to decrease as the amount of land converted to Miscanthus increases. The extent of nitrate loading also depended on the amount of nitrogen fertilizer applied to Miscanthus. Percolation of nutrients and fecal coliform to groundwater is a major problem from row crop agriculture in areas where soils are sandy and permeable (Nolan et al., 2002). Nitrate, atrazine, and coliform bacteria are known to be affecting surficial groundwater supplies from corn and soybean agriculture (Gilliom et al., 2007). To the extent that cellulosic crops are used for the remainder of RFS2, water-quality effects on groundwater could be reduced and would likely be less than those of equivalent row crops. Grasses and perennial crops have deep, dense root systems year-round that serve to hold nutrients in place. Some authors suggested planting short-rotation woody crops as buffer strips because of their high nutrient uptake ability (Adegbidi et al., 2001; Fortier et al., 2010). Half of the crops can be harvested as bioenergy feedstock at a given time while the other half continues to serve as a vegetative buffer (Berndes et al., 2008).
Next Steps Needed
It would be desirable to develop scenarios and apply them in watershed models to predict changes in water quality resulting from implementation of the RFS2 schedule. The models would have to include the physiological traits of perennial crops (such as above-and below-ground biomass existing for more than one year) (Baskaran et al., 2009). Furthermore, empirical data need to be collected at watershed scales to validate these models. At present, there are no watershed-scale data comparing effects of cellulosic bioenergy feedstock production to traditional row-crop production. Thus, model projections cannot be substantiated.
Literature studies indicate that substantial reductions in nutrient loadings would be realized if large areas of land are converted to perennial crops from row crops to produce cellulosic biofuels (Schilling and Spooner, 2006; Costello et al., 2009). Improvements can also be realized by integrating appropriate perennials into larger crops systems where they can be most effective in capturing excess nutrients and protecting water supplies (Anex et al., 2007; Johnson et al., 2008).
Conversion to Fuels
Waste streams from ethanol distilling plants include salts, which are formed by scaling and evaporation in the cooling towers and boilers. If these deposits are not removed (a process called “blow down”), the efficiency of the system decreases dramatically. Blow down results in high-concentration discharges of these salts. The biorefining process requires very pure water, and the use of osmotic purification systems that remove impurities from either surface or groundwater result in additional salt discharges. The Clean Water Act’s National Pollutant Discharge System (NPDES) permitting process is required for any facility to discharge this effluent.
Water-quality effects associated with fatty acid methyl esters (FAME) biodiesel production include discharges from oil extraction, chemical reaction processes, separation, purification, and conditioning. The pretreatment of lignocellulosic biomass, which requires water and chemicals, and production of other waste streams that could alter biological oxygen demand (BOD) and concentrated organic content loadings, could affect water quality.
Methods for Assessing Effects
Unlike discharges from feedstock cultivation, biorefineries for converting biomass to fuels are point sources of pollutants to waters. NPDES requires biorefineries to obtain federal permits from EPA or from state agencies authorized by EPA to implement the NPDES program. Under NPDES, a point source can discharge specific pollutants into federally regulated waters under specific limits and conditions. Effects of discharges from biorefineries on water quality can be measured or estimated with less uncertainty than effects of increasing feedstock production on water quality.
Few simulations focus on water effects of refinery operations. Mitigation practices for disposal and treatment of refinery effluents are commercially available and employed. The quality of water discharged by existing corn-grain ethanol and biodiesel biorefineries are monitored by state officials. The wastewater is treated to a high quality prior to discharge (GAO, 2009). Because there are no commercial-scale cellulosic-biofuel refineries, water discharges can only be modeled or extrapolated from demonstration-scale refineries.
Anticipated and Observed Effects
Water-quality effects have been identified for corn-grain ethanol production and include discharges from feedstock processing, pretreatment, sachariffication, fermentation, and effects from boilers and cooling towers. A sample compositional analysis of these discharges is presented in Table 5-9.
Dry-mill corn-grain ethanol effluent and solids are also part of the refining process, and 4-6 gallons of stillage are produced for every gallon of ethanol (Khanal et al., 2008). The process of concentrating solids to produce distillers dry grain (DDG) is done by centrifugation and produces a product with 90-percent total solids content (Rausch and Belyea, 2006). The remaining fluids are composed of concentrated organic content, in the range of 11-13 oz per gallon, a pH of 3.3 to 4.0, and a total solids loading of 7 percent (Wilkie et al., 2000). The remaining fluids (termed “thin stillage”) are recirculated as process water, and a portion is evaporated to produce a syrup containing 30-percent solids that is blended with DDG to produce DDGS, a coproduct that can be used as livestock feed. In a survey of dry-mill corn-grain ethanol biorefineries, 55 biorefineries reported water discharge of 0.46 gallons per gallon of anhydrous ethanol (Mueller, 2010). Some plants recycle their
TABLE 5-9 Compositional Analysis of Two Ethanol Plant Discharges Adapted from NRC 2008
| Siouxland Ethanol Facility (Sioux Center, Iowa) | Little Sioux Ethanol Facility Simulated Blowdown Big Sioux | |||
| Constituent, mg/L (oz/gallon x 10-3) | Raw Ground W | RO reject water | Surface water | Tower efficiency |
| Total dissolved solids (TDS) |
2,113 (257) |
7,288 (887) |
703 (85.6) |
3,240a (394) |
| Calcium ion (Ca2+) | 305 (37.1) |
1,033 (126) |
129 (15.7) |
638 (77.6) |
| Magnesium ion (Mg2+) | 138 (16.8) |
458 (55.7) |
58 (7.06) |
185 (22.5) |
| Potassium ion (K+) | 0 (0) |
0 (0) |
2 (0.24) |
33 (4.02) |
| Sodium ion (Na+) | 148 (18.0) |
485 (59.0) |
20 (2.43) |
297 (36.1) |
| Chlorine ion (Cl-) | 23 (2.80) |
131 (15.9) |
35 (4.26) |
27 (3.29) |
| Sulfate ion(SO42-) | 1,420 (173) |
4,716 (574) |
107 (13.0) |
2,265 (276) |
aConcentration in milligrams per liter as calcium carbonate (CaCO3).
NOTE: Values in U.S. standard units are shown in parentheses.
SOURCE: Parkin et al. (2007).
water completely through a combination of centrifugation and evaporation and have no wastewater discharge (Aden, 2007; Mueller, 2010).
In biodiesel refineries, the production of FAME releases glycerin (the backbone of the original fatty acid) in the water stream as part of the transesterification process. Glycerin and unreacted methanol are often found in the effluents of biodiesel refineries that are not designed to recover those byproducts. Those compounds make their way into local municipal wastewater treatment facilities, increasing BOD, or required oxygen level needed to break down the material. The BOD contribution from those biorefineries’ effluents may be about 10 ounces per gallon (GAO, 2009). Newer and larger biodiesel refineries are able to extract and purify glycerin to be further used in coproducts including cosmetics and animal feed, and as new technologies are deployed, the recovery of glycerin will be more efficient, ameliorating any negative effects.
Data on cellulose to ethanol effluent and solids from commercial operations are not yet available, and literature regarding their potential composition is limited to laboratory-scale reactions. In one such study, stillage was generated in the range of 11.1 ± 4.1 gallons per gallon of ethanol. Concentrated organic content of the stillage was estimated as 7.46 ± 4.87 oz per gallon, BOD as 3.36 ± 1.85 oz per gallon, total nitrogen as 0.34 ± 0.56 oz per gallon, total phosphorous as 3.41 ± 3.65 oz per gallon, sulfates as 0.079 ± 0.0148 oz per gallon, and pH as 5.35 ± 0.53 (Khanal et al., 2008). Stillage could contain phenolic compounds from the lignocellulosic feedstock and furfurals from acid hydrolysis (Wilkie et al., 2000). Estimates of wastewater discharges also were reported
in environmental assessments of planned cellulosic biorefineries (DOE, 2005; ENSR AECOM, 2008; DOE-EERE, 2010b).
Use of Coproducts
Use of a large proportion of DDGS in diets for livestock also raises safety (see Appendix N) and environmental concerns. Environmental problems arise from a mismatch in the nutrient balance in DDGS relative to that needed for animals that consume them. DDGS have roughly three times the amount of nitrogen and phosphorus as corn. They are commonly used in ruminant diets in place of corn, but this can result in levels of nitrogen, phosphorus, and sulfur that are in excess of an animal’s needs (Schmit et al., 2009). When DDGS are fed in place of corn and soymeal to broiler chickens, they result in greater excretion of nitrogen due to their poor amino acid balance and poor protein digestibility (Applegate et al., 2009). However, phosphorus excretion does not increase when the diets are appropriately formulated. When fed to laying hens or pigs, DDGS result in greater excretion of nitrogen and phosphorus. In each case, excess nutrients are excreted into manure. When this manure is used as fertilizer, the higher levels of nutrients may result in N and P loading on croplands, depending on agronomic conditions (Benke et al., 2010). Moreover, the solubility of excreted phosphorus in laying hens fed with DDGS is higher (Leytem et al., 2008), though the amount of ammonia released from their manure is lower (Wu-Haan et al., 2010). Proper formulation of diets to minimize nutrient excesses and the use of enzymes such as phytase and xylanase can mitigate nutrient excesses. However, these solutions are not always economically advantageous, depending on ingredient costs and environmental restrictions on manure application rates.
WATER QUANTITY AND CONSUMPTIVE WATER USE
Feedstock Production
Water withdrawals in the United States have not increased substantially in recent decades. In fact, some states (for example, California) have continued to gain population while using less water. Progress in water-use efficiency and conservation is encouraging. However, if production of feedstocks for increased biofuels requires more water from unsuitable sources either for feedstock production or for withdrawals required at production facilities, then increases in consumptive water use (NRC, 2008) could result in competition for freshwater with other uses. Future biofuels under RFS2 might adopt crops that are less water-demanding than corn and soybean, and therefore might not require irrigation. Widescale placement of perennial bioenergy crops across the central United States could also have large effects on evapotranspiration, affecting the availability of water stored in soils (VanLoocke et al., 2010; Georgescu et al., 2011).
Methods to Assess Effects
Streamflow is gauged by USGS for the nation’s streams and rivers, but the spatial distribution of the gauges vary across the country (USGS, 2011). Lake levels are monitored by USGS and the U.S. Army Corps of Engineers (reservoirs), and groundwater is monitored sporadically by the states and in special studies by USGS. Tipping-bucket rain gauges are measured in state networks and at airports; Next Generation Radar (NEXRAD) laser-doppler network and models are used for weather forecasting and rainfall-runoff modeling
by the National Weather Service. These data are used as input for various hydrometeorological models and rainfall-runoff models involving agriculture. Agriculture crop models use those basic data as input for models such as CENTURY, DeNitrification DeComposition (DNDC), and Photosynthetic/EvapoTranspiration (PnET); these models are in turn linked with water quality models mentioned earlier such as SWAT and HSPF. The results of water-use models are often coupled with basic agriculture yield data from USDA in life-cycle assessment models to assess the performance of various crops for feedstocks in biofuel production.
Empirical Evidence
Measures of water quantity effects due to increased production of biofuels have been concentrated in a few locations where corn is irrigated or production facilities are withdrawing water from depleting groundwater sources. As a case study, Nebraska is among the states with the largest water withdrawals for irrigation, and its usage has continued to increase in recent years, largely driven by the need to irrigate corn for ethanol. Corn acreage in Nebraska averaged 8.3 million acres during 2000-2006, but it increased to 9.4 million acres in 2007, 8.8 million acres in 2008, and 9.2 million acres in 2009. About 70 percent of the corn in Nebraska is irrigated (Nebraska Corn Board, 2011). Thus, irrigation requirements result in considerable withdrawals from the High Plains Aquifer. Figure 5-7 shows the drawdown in the High Plains (or Ogallala) Aquifer in Nebraska since predevelopment.
On average, about 70 percent of irrigated water is consumed in the process of irrigating corn (consumptive use) (Wu et al., 2009a). It is not returned to the stream or groundwater, but rather it returns to the atmosphere as evapotranspiration from crops. Figure 5-8 shows the areas of the country where corn is irrigated. Corn acreage that requires irrigation and the quantity of water use vary across the United States. In arid regions such as North
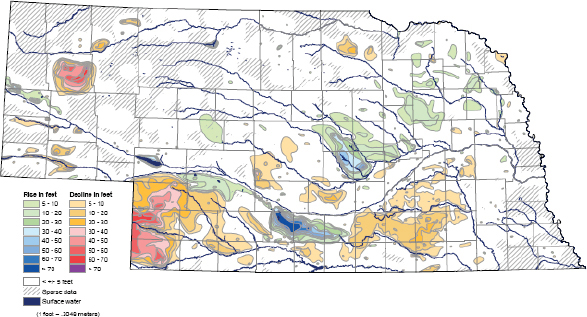
SOURCE: Conservation and Survey Division, School of Natural Resources, UNL (2009). Reprinted with permission from Conservation and Survey Division, School of Natural Resources, University of Nebraska, Lincoln.
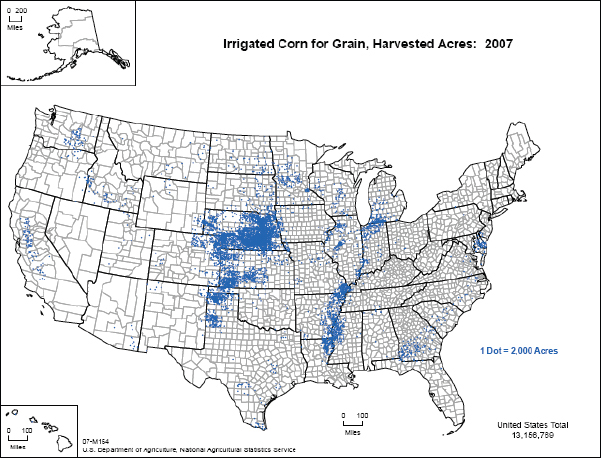
FIGURE 5-8 U.S. irrigation corn for grain.
SOURCE: USDA-NASS (2009).
Dakota, South Dakota, Nebraska, and Kansas, the estimated use of freshwater to irrigate corn is 865 gallons per bushel. There is hydraulic connection between the High Plains Aquifer and surface waters. The Republican River runs from Colorado through Nebraska and into Kansas, and the river loses water along its entire stretch. Consumptive water use for corn production could be high irrespective to which purpose the corn would be dedicated.
Total water withdrawals (agriculture + municipal + industrial) are summed and mapped in Figure 5-9. Areas colored in brown indicate water withdrawals of 9.84-98.4 inches of water averaged over the land area of each county. Precipitation of that amount would be needed to replenish aquifers and maintain groundwater levels. In the United States, 55 million acres of cropland are irrigated, mainly in the West, the Mississippi Delta region, and Florida. Agriculture uses about one-third of all water use and 80 percent of U.S. consumptive water use (USDA-ERS, 2004). Irrigation for agriculture has been increasing in states that are large producers of corn-grain ethanol.
Results
Stone et al. (2010) assessed the bioenergy production goals outlined in the report Biomass as Feedstock for a Bioenergy and Bioproducts Industry: The Technical Feasibility of a Billion-Ton Annual Supply (Perlack et al., 2005) relative to water resource effects and climate change (Table 5-10) and found that consumptive water use depends largely on the choice
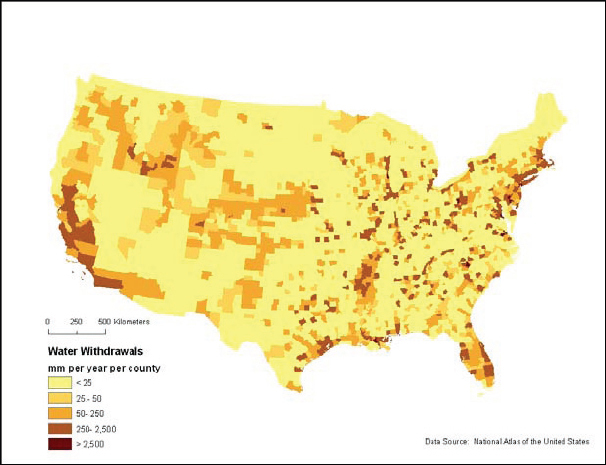
SOURCE: Hutchinson (2008). Reprinted with permission from K. Hutchinson, USGS Iowa Water Science Center.
of feedstock and where it is grown. Corn grain, corn stover, and grain sorghum used the most water among ethanol feedstocks, and water use by soybean and canola were also high. Sugarcane, switchgrass, and sweet sorghum were superior-performing crops as ethanol feedstocks with respect to water use.
Next Steps Needed
Biofuel is part of the nation’s strategy for energy independence. However, water availability is a critical aspect of increasing feedstock production. Empirical data need to be evaluated to ensure increasing bioenergy feedstock production does not result in continuous depletion of groundwater. Improved analysis of empirical data that are now becoming available needs to be incorporated to improve the modeling of the nation’s water resources and to inform regulators and the public of the environmental implications of increased biofuel production.
| Crop | Water requirements, m3 water/Mg crop (gallons water/ton) | Biofuel conversion, L fuel/Mg crop (gallons fuel/ton crop) | Crop water requirement for biofuel, m3 water/Mg fuel (gallons water/ton fuel) | Crop water requirement per unit energy, m3 water/GJ (gallons water/Btu) |
| Ethanol | ||||
| World corn (grain) | 833 (200,000) |
409 (98.0) |
2,580 (618) |
97 (0.027) |
| World sugarcane | 154 (36,906) |
334 (80.0) |
580 (139) |
22 (0.006) |
| Nebraska corn (grain) | 634 (152,000) |
409 (98.0) |
1,968 (472) |
74 (0.021) |
| Corn stover | 634 (152,000) |
326 (78.1) |
2,465 (591) |
92 (0.026) |
| Corn stover + grain | 634 (152,000) |
735 (176) |
1,093 (262) |
41 (0.011) |
| Switchgrass | 525 (126,000) |
336 (80.5) |
1,980 (475) |
74 (0.021) |
| Grain sorghum | 2,672 (640,000) |
358 (85.8) |
9,460 (2,270) |
354 (0.099) |
| Sweet sorghum | 175 (41,900) |
238 (57.1) |
931 (223) |
35 (0.010) |
| Biodiesel | ||||
| Soybean | 1,818 (436,000) |
211 (50.6) |
9,791 (2,350) |
259.0 (0.072) |
| Canola | 1,798 (431,000) |
415 (99.5) |
4,923 (1,180) |
130 (0.036) |
NOTE: Values in U.S. standard units are shown in parentheses.
SOURCE: Stone et al. (2010).
Conversion to Fuels
Water use in biorefineries depends on the feedstock and conversion process used. Process water for biofuel production raises site specific and region-specific concerns about water availability. In general, however, the overall volume of water consumed in the processing of feedstock to fuel is small compared to the volume of water needed to grow the biomass feedstocks (NRC, 2008).
Water use in biorefineries for corn-grain ethanol production includes the hydration of biomass flour (ground corn, wheat, or any other grain used) for the mixture of enzymes and its subsequent high temperature breakdown to release glucose monomers. The slurry mix of mash and yeast is fermented in tanks, producing ethanol and CO2. The fermented mash (termed “beer”) is fractionally distilled to separate water from the ethanol, and the solids (termed “stillage”) are processed and sold for added-value product lines. Ethanol has a high affinity to water, so that an additional dehydration step is needed to remove trace amounts of water from the produced ethanol. Water consumption outside of the processing
itself includes evaporative losses from cooling tower circulation and during the drying process for stillage.
Water use for biodiesel refineries includes water used in processing the feedstock, separation of products and coproducts, and conditioning. There are several liquid streams involved in processing suitable biomass feedstocks into biodiesel using transesterification. For oil processing and extraction, the liquid removed from the solids, called miscella, consists of hexane, soybean oil, and water. The miscella is separated into its components using distillation. The hexane is reused, the water is disposed, and the oil is processed into biodiesel.
At a cellulosic ethanol biorefinery that uses biochemical pathways, water is used for hydrolysis of cellulosic material, boiler makeup and blowdown, cooling, and cleaning of filters and other equipment (Jones, 2010).
Anticipated and Observed Results
Water uses are varied as a result of the different conversion pathways that can take place. Water use for processing corn grain to ethanol and soybean to biodiesel are estimated to be lower than water use for processing cellulosic biomass to ethanol, in part because production of cellulosic ethanol has not been commercialized or undergone the process improvement that the production of corn-grain ethanol and biodiesel has.
The NRC report Water Implications of Biofuels Production in the United States (2008) summarized existing peer-reviewed publications. The authoring committee of that report concluded at that time that a corn-grain ethanol refinery consumed an average of 4 gallons of water for every gallon of ethanol produced. In other words, a 100-million-gallon per year refinery would consume a little over 400 million gallons of water every year it operates, a volume that would need to be removed from surface waters or aquifers. Optimization of water use in corn-grain ethanol biorefinery continued to be improved. Corn-grain ethanol refineries that participated in a survey conducted in 2008 reported water use of 2.7 gallons of water per gallon of ethanol (Mueller, 2010). From 1998 to 2007, water use in corn-grain ethanol biorefineries was estimated to have decreased by 48 percent in volume (Wu et al., 2009a). The decrease in water consumption is related to more process water being recycled in cooling and other refinery-related activities.
Figure 5-10 shows the locations of existing and planned ethanol biorefineries in the United States as of 2007. (An updated map is shown in Figure 2-5 in Chapter 2.) Most biorefineries were built or planned in corn-growing regions to be near the feedstock crop. In the eastern half of the country, rainfed agriculture is used to grow the corn. In the West, irrigation water, mostly from groundwater, is used. The ethanol biorefineries are shown as black dots in Figure 5-10, and the size of the dots reflect total water use each day. Major aquifers are also shown in Figure 5-10, which shows the unconfined High Plains Aquifer (Ogallala Aquifer) stretching from South Dakota to the panhandle of Texas. Throughout the Corn Belt, glacial (confined) aquifers are used frequently for the source water in ethanol biorefineries, and many of these aquifers have been overdrawn (UNL, 2007).
Reported averages of water consumption in biodiesel refineries vary between 1 to 3 gallons of water for every gallon of biodiesel produced (NRC, 2008; GAO, 2009). Much of the water use is a result of water loss in evaporation and feedstock drying processes.
Data on water consumption at cellulosic-ethanol refineries are only available for demonstration facilities. The water use rates in the permits of three demonstration facilities that convert cellulosic feedstock to ethanol using biochemical conversion range from 6-13
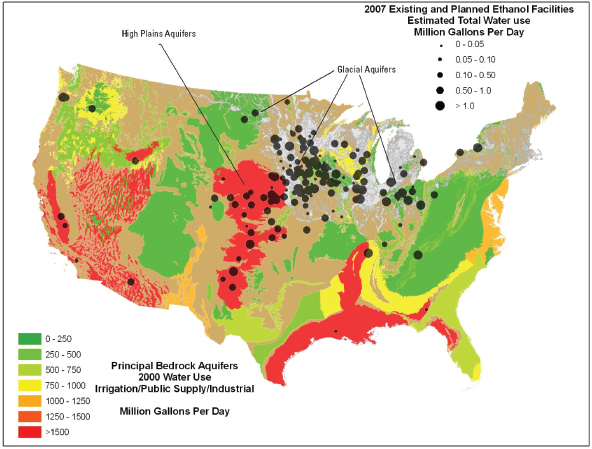
SOURCE: NRC (2008), courtesy of Janice Ward, USGS.
gallons of water per gallon of ethanol produced. However, actual water use could be lower (Jones, 2010).
Thermochemical processes for cellulosic feedstocks could be optimized so that the water requirement would be 1.9 gallons of water for every gallon of ethanol produced (Phillips et al., 2007). Pate et al. (2007) estimated between 2-6 gallons of water per gallon of ethanol produced as a range representative of several potential conversion pathways. In its demonstration facility, Range Fuels reported water requirement of 1 gallon of water per gallon of ethanol produced (DOE, 2009).
Next Steps Needed
The volume of process water needed to operate a 100-million-gallon per year ethanol biorefinery using current technology is estimated at 300-400 million gallons of water per year. Therefore, careful assessment of local and regional water availability is critical in the siting of biorefineries to avoid depletion of water resources. The quality of water used in biochemical-conversion biorefining affects the performance of key plant components, including boiler efficiency and biochemical process inhibition. Water pretreatment, through the use of osmotic membranes, is often not accounted for in the published reports of water consumption (GAO, 2009), leading to values that may under-represent actual water
volumes. Because much water is lost by evaporation in biorefineries, development and implementation of new technologies to reduce evaporative loss from processing biomass to fuel provide opportunities to reduce consumptive water use in biorefineries (Huffaker, 2010).
Life-Cycle Consumptive Water Use
Although consumptive water use has been estimated in various stages of biofuel production, few studies on water use over the life cycle of biofuel production exist.
Methods of Assessment
Most studies use attributional LCA to assess life-cycle consumptive water use (King and Webber, 2008; Wu et al., 2009a; Fingerman et al., 2010). Harto et al. (2010) used a life-cycle assessment that combines a materials-based process method and an economic input-output method. The materials-based process method describes elements in a supply chain and includes data collected or estimated at site and facility. The economic input-output method uses national sectoral data to describe material use.
The system boundaries of the different analyses varied. All studies included water inputs for crop production and ethanol production in their analyses. However, the level of detail included and the method for estimating water use for crop production differed (Table 5-11). Irrigation water consumed is included in all studies, but only Fingerman et al. (2010) included water from rainfall estimated to be consumed by crops. They and others (Powers et al., 2010) argue that including irrigation water only in LCA infers that rainfed agriculture does not consume any water. Precipitation that is not taken up by crops can contribute to groundwater recharge or can be used for other purposes. Some studies also included water embedded in the manufacture of farm inputs or in the production of gasoline,
TABLE 5-11 Inputs Used for Life-Cycle Analysis of Biofuel Consumptive Water Use in Different Studies
| Inputs for Life-Cycle Analysis of Biofuel Consumptive Water Use | Reference |
| Crop production | Chiu et al., 2009 |
| Crop production | Fingerman et al., 2010 |
| Crop evapotranspiration (including irrigation and precipitation) | |
| Conversion to fuel | |
| Crop production | Harto et al., 2010 |
| Consumption of irrigation water, if applicable | |
| Water use in manufacturing farm inputs (for example, fertilizers) | |
| Biorefinery construction | |
| Conversion to fuel | |
| Distribution and marketing | |
| Water credits from coproducts | |
| Crop production | King and Webber, 2008 |
| Consumption of irrigation water, if applicable | |
| Water consumed to make the gasoline, diesel, or electricity used during farming | |
| Water credits from coproducts | |
| Crop production | Wu et al., 2009 |
| Consumption of irrigation water, if applicable | |
| Conversion to fuel | |
diesel, or electricity used for farming, but those water inputs are small proportions of the life-cycle water use (King and Webber, 2008; Harto et al., 2010). In addition to water use for crop production and at biorefineries, one or more studies included water use in distribution and marketing and water credits from coproducts (Table 5-11).
The effect of consumptive water use of biofuel on water resources would have to be considered in the context of water availability and demand. In one sense, using water for biofuel production and carbon sequestration in feedstocks is a purposeful trade of water for carbon (Jackson et al., 2005). Production of all crops and bioenergy feedstock results in evapotranspiration. Whether the water for plant growth originates from rainfall or from groundwater aquifers does not affect the amount of evapotranspiration from the land use. If consumptive water use results in precipitation within the same region, it returns to the regional water balance. When local evapotranspiration falls as precipitation within the same basin, it is often referred to as the local “recycle ratio.” A recycle ratio of 1 indicates that all the local water that was evapotranspired returned to the same basin. Whether a recycle ratio of 1 is desirable depends on local conditions, such as whether the land is too moist already or in a drought condition, or whether flooding is a concern, or if the returned precipitation affords other precious water uses. Consumptive water use by irrigation of feedstock crops from an overdraft18 aquifer is a serious condition. Under prolonged overdraft, the depth of an aquifer could become depleted to a level that is not economically feasible to pump. The time required to recharge a natural aquifer to a level feasible for use is much longer than the turnover of water by the hydrologic cycle of evapotranspiration, precipitation, and recycle.
Results
Estimates for life-cycle water use for corn-grain ethanol vary widely mostly because of regional variability in irrigation of the crop. Chiu et al. (2009) used regional time-series agricultural and ethanol production data in the United States to estimate the current state of water requirements for ethanol (embodied water on a liter of water per liter of ethanol produced basis as shown in Table 5-12). The total water embodied (EWe) was greatest in Western states (California, New Mexico, Wyoming, Colorado, Kansas, and Nebraska), and most of the inputs were from groundwater, except for the states of Kentucky, Colorado, California, New Mexico, South Dakota, and Wyoming.
Other estimates of consumptive water use over the life cycle of corn-grain ethanol production range from 10-1,600 gallons of water per gallon of ethanol or 15-2,400 gallons of water per gallon of gasoline equivalent (as shown in Table 5-13 for comparison with life-cycle water use for gasoline production). Most studies identify the water resource need of feedstocks as an important factor in determining consumptive water use over the life cycle of biofuels (Dominguez-Faus et al., 2009; Wu et al., 2009b). If the crop is not irrigated and water use from precipitation is not taken into account, life-cycle water use was estimated to be as low as 15 gallons of water per gallon of gasoline equivalent, which is over twice as high as any estimates of life-cycle water use for petroleum-based fuel.
Water use for biofuel production from switchgrass could be comparable to that of petroleum-based fuel if switchgrass is not irrigated and if it is converted to fuels by thermochemical conversion (Wu et al., 2009b; Harto et al., 2010). However, studies have shown switchgrass yields respond positively to precipitation and irrigation (Heaton et al., 2004;
______________
18 An aquifer is said to be in a state of overdraft when its rate of extraction exceeds its rate of recharge by natural processes.
| State | Ethanol Production, million liters (million gallons) |
EWe, LL-1 (gallons of water per gallon of ethanol) |
EWe Ground Water, LL-1 (gallons of water per gallon of ethanol) | EWe Surface Water, LL-1 (gallons of water per gallon of ethanol) | Irrigated Water, million liters (million gallons) |
Process Water, million liters (million gallons) |
TCW, million liters (million gallons) |
Corn Processed into Ethanol (percent) |
| Ohio | 11 (2.91) |
5 |
4 |
1 |
11 (2.91) |
41 (10.8) |
52 (13.7) |
0.20 |
| Iowa | 6,857 (1,810) |
6 |
6 |
0 |
17,288 (4,570) |
24,745 (6,540) |
42,032 (11,100) |
28 |
| Kentucky | 134 (35.4) |
7 |
4 |
4 |
472 (125) |
484 (128) |
956 (253) |
7 |
| Tennessee | 254 (67.1) |
10 |
6 |
5 |
1,681 (444) |
915 (242) |
2,597 (686) |
29 |
| Illinois | 3,486 (921) |
11 | 11 | 0 | 27,389 (7,240) |
12,581 (3,320) |
39,970 (10,600) |
15 |
| Indiana | 954 (252) |
17 | 11 | 6 | 12,539 (3,310) |
3,442 (909) |
15,981 (4,220) |
9 |
| Minnesota | 2,296 (607) |
19 | 16 | 3 | 34,589 (9,140) |
8,286 (2,190) |
42,875 (11,300) |
19 |
| Wisconsin | 1,067 (282) |
26 | 26 | 0 | 24,208 (6,400) |
3,852 (1,020) |
28,060 (7,410) |
23 |
| Michigan | 587 (155) |
47 | 31 | 16 | 25,177 (6,650) |
2,117 (559) |
27,295 (7,210) |
19 |
| Missouri | 587 (155) |
57 | 55 | 2 | 31,156 (8,230) |
2,117 (559) |
33,273 (8,790) |
12 |
| North Dakota | 505 (133) |
59 | 31 | 28 | 28,146 (7,440) |
1,824 (482) |
29,970 (7,920) |
18 |
| South Dakota | 2,203 (582) |
96 | 38 | 58 | 203,762 (53,800) |
7,950 (2,100) |
21,712 (5,740) |
39 |
| Georgia | 2 (0.5) |
128 | 85 | 42 | 188 (49.7) |
5 (1.32) |
194 (51.2) |
0.25 |
| Nebraska | 2,481 (655) |
501 | 422 | 80 | 1,235,128 (326,000) |
8,954 (2.370) |
1,244,082 (329,000) |
16 |
| Kansas | 804 (212) |
528 | 486 | 42 | 421,840 (111,000) |
2,903 (767) |
424,743 (112,000) |
15 |
| Colorado | 322 (85.1) |
1,176 | 226 | 950 | 377,082 (99,600) |
1,161 (307) |
378,243 (99,900) |
20 |
| Wyoming | 19 (5.02) |
1,354 | 125 | 1,229 | 25,547 (6,750) |
68 (18.0) |
25,615 (6,770) |
23 |
| New Mexico | 114 (30.1) |
1,427 | 615 | 812 | 161,587 (42,700) |
410 (108) |
161,997 (42,800) |
113 |
| California | 257 (67.9) |
2,138 | 814 | 1,323 | 549,240 (145,000) |
929 (245) |
550,169 (145,000) |
68 |
| Averagea | 142 | 91 | 51 | 23 | ||||
aAverage is weighted by ethanol production in 2007 and calculated for the purpose of comparison only. Because of the large variation between regions, significance of the average for representing the nation’s EWe is limited.
NOTE: Values in U.S. standard units are shown in parentheses.
SOURCE: Chiu et al. (2009).
| Life-cycle consumptive water use, gallons of water per gallon of gasoline equivalent | Reference | ||
| Corn-grain ethanol | Switchgrass ethanol | Petroleum-based fuel | |
| 1500 | 923-1307 | Not estimated | Fingerman et al., 2010 |
| 42-640 | 2.9-640 | 1.9-5.9a | Harto et al., 2010 |
| 62-2400 | Not estimated | 1.4-2.9a | King and Webber, 2008 |
| 15-490 | 2.9-15 | 3.4-6.6b | Wu et al. 2009 |
aPetroleum-based fuel considered is conventional gasoline.
bPetroleum-based fuels considered include gasoline and oil sands.
Robins, 2010). Harto et al. (2010) showed that irrigation of switchgrass under drought conditions could increase the quantity of water consumed substantially (Table 5-13).
Next Steps
Precise estimates of the effect of producing biofuels to meet RFS2 on consumptive water use nationwide compared to that of producing petroleum-based fuel are not possible because the result depends on multiple factors. The key determining factors are
- Evapotranspiration during feedstock production and water availability in production locations;
- Whether the bioenergy feedstock is irrigated;
- Method used for crude oil exploration and recovery;
- Whether biochemical or thermochemical conversion is used to produce biofuels.
The quality of information for the life-cycle estimates could be improved as cellulosic biofuel facilities become operational on a commercial scale. Information on water use by onshore or offshore oil recovery in the United States was collected in the 1980s and 1990s and could be outdated (Wu et al., 2009b). However, a nationwide estimate of water use in biofuel production might not be as important as regional estimates of consumptive water use by biofuels and an assessment of other water needs and water availability in each region. Because biorefineries are typically located in close proximity to bioenergy feedstock production, water use will be concentrated in one locale and could be of particular concern in water-scarce areas. Likewise, using freshwater in petroleum refining in arid regions that experience seasonal scarcity could pose a strain on that resource base even though the water use per unit product is only 1.5 gallons per gallon of petroleum-based fuel (Fingerman et al., 2010). Regional assessments of consumptive water use over the life cycle of biofuel production would be helpful in ensuring that biofuel production does not incur undue stress on water availability or result in groundwater overdraft.
Metrics of soil quality include bulk density, erodability, soil carbon storage, and the rate of nitrogen and phosphorus turnover as they influence denitrification and nitrogen and phosphorus leaching. Processes in biofuel production that could affect soil quality
include management practices in feedstock production, feedstock and residue removal, and discharges from conversion to fuels.
Feedstock Production
Among the key debates associated with biofuel production are the net effects of feedstock production on ecosystem carbon storage, particularly with respect to soil carbon storage. The extent to which biofuels represent a biologically renewable resource with respect to ecosystem carbon or soil carbon, one of the key storage pools, depends on two factors: the rate of net carbon uptake by the ecosystem (net ecosystem production) and the rate of physical removal of carbon for bioenergy feedstock production. The rates of carbon uptake and removal are contingent upon a number of natural and human-influenced factors, such that the net effects depend largely on local conditions. The contingencies and ranges of carbon loss or gain to be expected from bioenergy feedstock production are discussed in this section.
The net rate of soil carbon gain or loss for a particular system reflects the rate of net primary production and litterfall from plants (above and belowground) minus heterotrophic respiration. Net primary production is closely coupled to water availability (precipitation and irrigation), temperature (length of growing season as well as influence on evaporation), and, in some areas, nutrient availability (primarily nitrogen on land). Heterotrophic respiration depends on the same factors, in addition to those that increase biological decomposition rates of detritus, such as tillage, or other soil disturbances (for example, irrigated and tilled corn), or changing environmental conditions that shift a system from anaerobic, or slow-decomposition systems, to aerobic, rapidly decomposing systems (for example, drained wetlands).
Undisturbed, or natural systems, are generally in equilibrium with respect to ecosystem carbon, with net primary production equaling heterotrophic respiration, while those undergoing succession accumulate carbon (Odum, 1969; Wilkie et al., 2000) in live biomass and detritus. Disturbances of many types, and in particular land-use shifts to agricultural practices representing transition from perennial ecosystems to annual crops, result in losses of major stores of soil carbon (Burke et al., 1989; Davidson and Ackerman, 1993; Lal, 2004) due to cultivation-induced increases in heterotrophic respiration and erosion. While rates of loss are highly variable, Lal et al. (2007) estimate that prime agricultural soils worldwide have lost 20-80 tonnes of carbon per hectare.
The extent to which bioenergy feedstock production represents changes in ecosystem carbon or in soil carbon stores depends on the circumstances. In general, biofuel production systems that include shifts to perennial plants that are located in high precipitation areas have the greatest possibility of net carbon storage (Guo and Gifford, 2002; Lal, 2004; Lal et al., 2007). In addition, practices that incorporate reduced tillage and conserve soil water may be important for decreasing losses over the long term (Morgan et al., 2010). Degraded soils may provide the highest possibility for carbon storage, as they represent succession systems recovering to maximum potential carbon. Lal et al. (2007) suggested that levels exceeding natural soil carbon storage could be achieved only where total plant production is enhanced over natural conditions, for instance, in systems that are fertilized, irrigated, or both.
The influence of feedstock production on soil nitrogen and phosphorus cycling depends on fertilization and irrigation strategies. Where nitrogen and phosphorus are added in excess of plant uptake, the probability of nitrogen losses via denitrification and of nitrate and phosphate leaching increases if the amount of surplus nutrient exceeds a certain
threshold (Van Groenigan et al., 2010) (see also “Water Quality” section above). Cellulosic feedstocks can be derived from perennial plants that may require less fertilizer than annual row crops and conserve soil nitrogen and phosphorus in soil organic matter and roots (Robertson et al., 2011b).
Residue Removal
Removal of residues from either forested or agricultural lands affects soils in two ways. First, it represents removal of detrital biomass, containing carbon and associated nutrients that otherwise represent a storage pool that would be slowly decayed. Second, the process of residue removal could have physical effects on soils through mechanical disturbance that increase erosive potential and through removal of residues that stabilize soil surfaces from wind and water-driven erosion. Long-term experiments and simulation analyses (Gollany et al., 2011; Huggins et al., 2011; Machado, 2011) indicate that the effects of residue removal on agricultural lands on soil carbon depend highly on site factors (for example, productive potential and current soil carbon) and on the management strategy used (for example, tillage intensity and crop rotations). A review of the field experiments testing the effects of residue removal on forest soils (Eisenbies et al., 2009) suggests that increases in fertilization may be necessary to replace soil nutrients from intensive combined harvest and residue removal, but long-term effects on site productivity or soil quality of forest residue removal are unclear.
Conversion to Fuels
Most biorefineries in operation or proposed have a near zero discharge design so that the effect of conversion of biomass to fuel on soil quality is small.
Soil quality effects from biochemical refineries include the solid waste streams from enzymatic production, brine disposal from accumulated solids in cooling towers and boilers, as well as those originating from water conditioning. Soil quality effects from FAME biodiesel refinery include the solid waste streams from water conditioning and oil extraction. Oils, grease, and saponified materials are screened and skimmed from the reactor vessels and sent to landfills. The amounts vary based on the feedstock source, process used, type of catalyst used, and efficiency of the reaction system. The largest effect on soil at the biorefinery is the construction of the facility.
Biodiversity refers to “the variety and variability among living organisms and the ecological complexes in which they occur” (U.S. Congress Office of Technology Assessment, 1987). Biodiversity encompasses the variety and variability of animals, plants, and microorganisms that are necessary to sustain key functions of an ecosystem and has been referred to as the “foundation of ecosystem services” (Cassman et al., 2005). The complex role of biodiversity for agriculture has been discussed in other reports (Cassman et al., 2005; Foley et al., 2005; NRC, 2010b; and references cited therein).
Bioenergy feedstock production could threaten or enhance biodiversity depending on feedstock type, agricultural management practices, and land-cover change (Bies, 2006; Fargione et al., 2009). Monocultures, as in the case of growing corn continuously, threaten biodiversity, as a homogeneity of crop species often leads to intensive farming practices through increased fertilizer and pesticide application and tillage and has been shown to
lead to a decline in biodiversity (GAO, 2009). Changing from a practice of growing diverse crops in one area to a single crop not only reduces the biodiversity of farm acreage, but also reduces biodiversity benefits (such as pest control) for the surrounding landscape (Dale et al., 2010a). This section focuses on the potential effects of bioenergy feedstock production and harvest on biodiversity.
Methods of Assessment
Direct observations of species richness and abundance can be made to compare biodiversity under different vegetation cover (for example, row crops versus perennial grasses), as discussed in the next section. Models can be used to project the effects of land-cover change on biodiversity. Invasive species could threaten biodiversity of nearby ecosystems. Whether a species of herbaceous perennial is likely to be an invasive species can be assessed using an invasive species assessment protocol (Randall et al., 2008) or a weed risk assessment protocol (Buddenhagen et al., 2009).
Anticipated and Observed Results
Vegetation types on agricultural land have been shown to affect species richness of beneficial insects and birds. Gardiner et al. (2010) measured the number of species of beneficial insects (including bees, lady beetles, and flies) in 10 replicates of three vegetation types—corn, switchgrass, and mixed prairie. The corn fields studied were actively managed for grain production. The switchgrass and mixed prairie fields were not actively managed and the switchgrass stands included 13-38 plant species, whereas the mixed prairie stands included 25-49 plant species. The abundance and diversity of bees were reported to be 3-4 times higher in the switchgrass and mixed prairie fields than in the corn fields. However, the diversity of bees could be reduced if switchgrass is managed as a monoculture.
Land-cover change from grassland to corn was shown to be correlated with reduced grassland bird diversity and population (Brooke et al., 2009). Using geographic information systems mapping, Brooke et al. constructed a series of maps that show areas where increased corn plantings coincide with loss of grassland habitats. They found a statistically significant decrease in the number of grassland bird species and number of grassland birds sighted from 2005 to 2008 in areas where corn plantings increased by over 3 percent from 2004 to 2007. In the southern peninsula of Michigan, Robertson et al. (2011a) also observed higher bird species richness in mixed prairie grass or unmanaged switchgrass fields than in corn fields (n = 20 each).
Another study used data from the Northern American Breeding Bird Survey in a model to project changes in species richness of birds and the number of bird species of conservation concern under two scenarios of land-cover change (Meehan et al., 2010). In one scenario, 23 million acres of land in the Upper Midwest that contain low-input high-diversity (LIHD) crops (for example, mixed perennial grasses) were converted to high-input low-diversity (HILD) crops (for example, corn and soybean), and bird species richness was projected to decrease by 7 to 65 percent in 20 percent of the region as a result of the land-cover change. In contrast, 21 million acres of land that contains HILD crops were converted to LIHD crops in another scenario, under which bird species richness was projected to increase by 12 to 207 percent in 20 percent of the region. The magnitude of change in species richness was even more pronounced if only bird species of conservation concern are considered (Meehan et al., 2010). The study represents two extreme scenarios because the 23 million acres of land in the first and second scenarios included 5 million
and 1.5 million acres of land that are not suitable for crop production. In addition, some acreage of herbaceous perennial grasses for biofuels is likely to be managed monoculture, which is likely to support lower diversity than a mixed grass stand. Nonetheless, it illustrates how land-cover change can affect species richness of grassland birds and that bird species of conservation concern in that region tend to be more sensitive to land-cover changes than other bird species.
Because of the influence of vegetation type on animal biodiversity, the potential for taking CRP land out of retirement to grow corn for corn-grain ethanol raises biodiversity concerns. CRP increases wildlife habitat by removing land from crop production and by requiring a land cover of perennial vegetation for a portion of the land. Several grassland bird species and ducks that have declined elsewhere in recent decades have increased in abundance on lands enrolled in CRP (Dale et al., 2010a). On the basis of the studies mentioned above, the abundance and diversity of beneficial insects and grassland birds are likely to decline if CRP land, on which native grasses have developed over time, are taken out of enrollment to plant row crops for biofuels. Although data on CRP enrollment are available, information on the use of the lands that came out of retirement is not collected. Thus, whether or how often expired CRP lands are put back into row crop production for biofuels is unknown.
Dedicated bioenergy crops such as switchgrass and mixed prairie grasses have the potential to increase animal biodiversity relative to corn-grain ethanol, and the type of management and harvesting and the placement of these crops on the landscape are important to promoting biodiversity (Robertson et al., 2011a). Grass stands that are less diverse are likely to have fewer animal species as discussed earlier. Harvesting prairie fields for biomass could disrupt habitats for some animal species (Flaspohler et al., 2009; USDA-NRCS, 2009). Harvesting after frost can mitigate the negative biodiversity impacts of harvesting these fields. Partial harvesting can provide winter cover for wildlife (USDA-NRCS, 2009). Harvesting practices can consider timing of bird nesting and other temporal values (for example, seasonal water regulation, scenic values, migrations, and other wildlife requirements) (Tolbert, 1998; Tolbert and Wright, 1998). A study of switchgrass fields in Iowa found bird diversity to be generally low, but bioenergy harvest influenced bird distribution (Murray and Best, 2010). Generalist species were nearly equally abundant in harvested and nonharvested fields, whereas grasshopper sparrows (Ammodramus savannarum) were more abundant in the shorter, sparser vegetation of harvested fields than in nonharvested fields. Roth et al. (2005) suggested that partial harvest of switchgrass fields in Wisconsin could enhance grassland bird diversity because different vegetation structure (that is, grass height) attracts different species.
Feedstocks for cellulosic biofuels also include timber residues. Some effects on biodiversity are likely to be associated with removal of forest residues that were previously left in place. For example, removing tree tops, branches, and other woody material that were previously left on site for bioenergy feedstock could result in loss of ground-level habitat for arthropods and amphibians. Those organisms require the dark, moist, and cool habitats underneath woody residues. Moreover, if timber harvesting removes large amounts of canopy coverage, the ground will be exposed to the warm, drying effects of increased sunlight (Janowiak and Webster, 2010). Because arthropod communities can be richly diverse and form a major lower trophic level that feeds higher trophic levels, this habitat loss can have associated negative effects on birds and mammals (Castro and Wise, 2009). Forest harvest operations associated with bioenergy feedstock removal can use the coarse woody debris (CWD) (snags and downed logs) that provides for a variety of organisms during critical stages of their life history (such as breeding, foraging, and basking). Riffel et al. (2010)
reviewed 25 studies involving manipulations of CWD (that is, removed or added downed woody debris and snags) and found that diversity and abundance of cavity-nesting and open-nesting birds and of invertebrates were substantially and consistently lower in treatments with less CWD. However, they also found that biomass harvests on a pilot scale reduce CWD levels to a lesser extent than the experimental studies they analyzed. The effect of CWD removal on biodiversity could be less severe if less CWD is removed.
Although loss in aquatic biodiversity in some coastal waters is a result of years of eutrophication contributed by agriculture and not a specific result of bioenergy feedstock production, bioenergy feedstock production can contribute to worsening or mitigating eutrophication. As discussed earlier (in the section “Water Quality”), increasing corn production is likely to increase sheet erosion of soil and runoff of nitrogen and pesticides (Secchi et al., 2011). Decreasing water quality and increasing areas, severity, and duration of hypoxia in coastal waters lead to loss in aquatic species (Rabalais et al., 2002; Vaquer-Sunyer and Duarte, 2008). In contrast, reducing nutrient outflow to surface water from crops by planting herbaceous perennials can improve water quality (Sahu and Gu, 2009; Ng et al., 2010). A preliminary study by Schweizer et al. (2010) suggested that converting some cropland and pasture in the White River Basin and the Red River Basin watersheds to switchgrass could improve water quality and species richness of fish in those river basins.
In addition to animal biodiversity, growing bioenergy crops can also affect plant biodiversity. If a bioenergy feedstock has invasive potential, it could expand into noncrop areas and drive out native vegetation (NAS-NAE-NRC, 2009). The herbaceous perennials chosen as dedicated bioenergy crops are selected, bred, or genetically modified to be fast-growing, productive on marginal lands, and resilient, which are traits of successful invasive species (Raghu et al., 2006; Barney and DiTomaso, 2008; Fargione et al., 2009). Cultivars improved by either conventional or genetically engineered breeding also have the potential to become invasive within their own native species range. Using a weed risk-assessment protocol, Barney and DiTomaso (2008) estimated the invasive potential of switchgrass, giant reed, and a sterile hybrid of Miscanthus. Their assessment suggested that switchgrass has high invasive potential in California and giant reed has high invasive potential in Florida. Lack of seed production from the Miscanthus sterile hybrid substantially reduces its invasive potential (Lewandowski et al., 2003; Barney and DiTomaso, 2008), but reversion to seed production in hybrids can occur. Careful screening and testing of bioenergy feedstock to demonstrate low invasiveness in target regions of feedstock production could reduce the likelihood of bioenergy feedstock invading nearby ecosystems (Davis et al., 2010; DiTomaso et al., 2010; Quinn et al., 2010; Barney and DiTomaso, 2011).
Next Steps Needed
Bioenergy feedstock production could reduce plant and animal biodiversity or provide opportunities to improve it (Webster et al., 2010). The precise effect of increasing production of bioenergy feedstock requires regional assessment of compatibility of feedstock type, management practices, timing of harvest, and input use with plants and animals in the area of production and its surroundings (Fargione et al., 2009; Landis and Werling, 2010). To reduce the potential of next-generation bioenergy feedstocks becoming invasive species, Barney and DiTomaso (2008) suggested a system of preintroduction screening for each proposed bioenergy feedstock in specific target regions, and an analysis of risk assessment, climate-matching modeling, and cross-hybridization potential. Landis et al. (2010) mentioned the need for research on arthropod dynamics within biofuel crops, their spillover into adjacent habitats, and their implications on the entire landscape. As in the case of GHG emissions,
biodiversity could be affected by land-cover change, associated with bioenergy feedstock production. Monitoring of land-cover change, including identifying land taken out of CRP that was subsequently used for producing bioenergy feedstocks, would help identify and assess any effects of increasing biofuel production on biodiversity. The effect of indirect land-use changes as a result of bioenergy feedstock production, corn grain in particular, has not been extensively studied and needs to be considered. The implications of biofuel production and feedstock choices for biodiversity are complex so that a systematic approach is needed to discern interactive effects of bioenergy crop production and other forces on biodiversity.
Ecosystem services are the beneficial processes that ecosystems provide to humankind (Costanza et al., 1997; Millennium Ecosystem Assessment, 2005). While ecosystem services often are not valued in the marketplace, they provide crucial regulating (for example, flood regulation), supporting (for example, soil formation), provisioning (for example, fish for food), or cultural (for example, recreational) services (Brauman and Daily, 2008). Much of this chapter focuses on environmental impacts of biofuel production related to ecosystem services that are associated with GHG, air quality, and water quality and quantity. As mentioned before, bioenergy feedstock production can both enhance and decrease different ecosystem services depending on the scale of biofuel production, changes in land-use management relative to prior conditions, and land-use practices. Some reports suggested that landscapes for bioenergy feedstock production could be designed to maximize ecosystem benefits (Figure 5-11) (Foley et al., 2005; Johnson et al., 2008; NAS-NAE-NRC, 2009; NRC, 2010b).
Methods to Assess Effects
Valuing ecosystems and their services generally occurs through biophysical or economic valuations (Boyd and Wainger, 2003). For biophysical valuations, there are no standard methods of assessment or agreed-upon indicators that measure ecosystem quality. Often, areas that contain the most native species diversity are considered the most valuable (Boyd and Wainger, 2003).
For economic valuation, ecosystem services are often measured through nonmarket valuation methods, as ecosystem services are often not bought or sold in the marketplace. These methods include the avoided cost method, contingent valuation method, travel cost method, and others. The avoided cost method measures the value of the replacement service, such as insecticide needed to be applied if the natural biocontrol of pests is reduced in an area. Contingent valuation studies reveal the “willingness to pay” of society for an ecosystem service, such as the aesthetic value of a national forest. Similarly, the travel cost method evaluates how far people have travelled and how much money they spend to access or enjoy a resource. While these nonmarket valuation methods have been used for many years, they are at times controversial and are technically challenging to undertake (Boyd and Wainger, 2003).
Empirical Evidence
Though there have been few specific studies on the gain or loss of ecosystem services due to biofuel development, one recent study measured the effects of increased monoculture corn crops and the consequent loss of natural pest control of the soybean aphid.
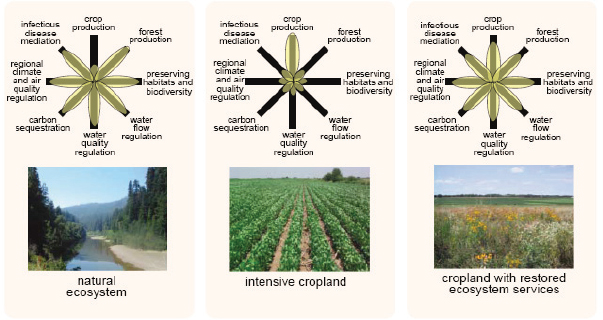
NOTE: “The provisioning of multiple ecosystem services under different land-use regimes can be illustrated with these simple ‘flower’ diagrams, in which the condition of each ecosystem service is indicated along each axis. (In this qualitative illustration, the axes are not labeled or normalized with common units.) For purposes of illustration, we compare three hypothetical landscapes: a natural ecosystem (left), an intensively managed cropland (middle), and a cropland with restored ecosystem services (right). The natural ecosystems are able to support many ecosystem services at high levels, but not food production. The intensively managed cropland, however, is able to produce food in abundance (at least in the short run), at the cost of diminishing other ecosystem services. However, a middle ground—a cropland that is explicitly managed to maintain other ecosystem services—may be able to support a broader portfolio of ecosystem services” (Foley et al., 2005, p. 573).
SOURCE: Foley et al. (2005). Reprinted with permission from the American Association for the Advancement of Science.
Findings included that the natural pest control of the aphid was worth $239 million in four states (Iowa, Michigan, Minnesota, and Wisconsin). Increased monoculture of corn, however, reduced natural pest control services and cost soybean producers in these four states about $58 million per year through reduced yield and increased pesticide use (Landis et al., 2008).
REGIONAL AND LOCAL ENVIRONMENTAL ASSESSMENTS
Earlier sections outlined some of the measured or anticipated environmental effects that could result from increasing biofuel production in the United States. Most studies cited focus on measured or estimated effects from corn-grain ethanol and soybean biodiesel. Because cellulosic biofuels have not been deployed on a commercial scale, environmental effects from producing 16-20 billion gallons of cellulosic biofuels cannot be directly measured and can only be estimated. Another limitation is that environmental effects are specific to location, feedstock, and technology. Therefore, environmental effects can be estimated with greater confidence at a local or regional scale than on a national scale, even though
comprehensive estimates at national and international scales are necessary to inform decision-making. In addition, an individual biorefinery might have localized environmental effects that are not of concern beyond the local scale.
The locations where cellulosic bioenergy feedstock will be grown depend on agronomic and economic conditions. Therefore, the committee used the National Biorefinery Siting Model (NBSM) (Parker et al., 2010) to identify specific biorefinery locations in the United States and associated biomass supplies and counties of origins (see Tables 3-1 and 3-2 in Chapter 3). The locations identified coincide with other model or biorefinery-siting projections of the most likely places for cellulosic and crop residue-based biofuels to be produced in the United States in the future. This section describes the U.S. Department of Energy and other government assessments of some local or regional environmental effects of cellulosic biofuel production in regions of the United States where cellulosic biofuel production is planned or projected to occur. Results of local environmental assessments for some planned or proposed cellulosic biorefineries in these regions are used as illustrations. However, the environmental effects of operating these facilities extend well beyond their immediate footprint. The large-scale effects include life-cycle environmental effects resulting from changes in resource use and land use and from pollutants emitted elsewhere in the supply chain or as a result of market-mediated effects.
Corn Belt Case Study
The Corn Belt has great potential to contribute crop residues for cellulosic ethanol. POET Project Liberty, LLC, proposed to expand an existing corn-grain ethanol facility near Emmetsburg, Iowa, into “a biorefinery that integrates advanced corn dry milling and lignocellulosic conversion technologies to produce ethanol and byproducts” (ENSR AECOM, 2008, p. i). An environmental assessment of a proposed cellulosic ethanol refinery was conducted as required by part of a grant program supporting facility development and consistent with requirements of the National Environmental Quality Act (NEQA) (ENSR AECOM, 2008). The NEQA requires assessment of air, water, soil, endangered wildlife and plant species, traffic, and social consequences of DOE-funded projects. Such assessments provide information about potential effects of new cellulosic production facilities on the towns and landscapes where they are planned be sited. Many existing corn-grain ethanol refineries are located in the Corn Belt (see Figure 2-5 in Chapter 2). Assessment of the local effects of the proposed Emmetsburg facility reflects potential effects in other locations where corn-grain ethanol refineries might expand to include processing of cellulosic feedstocks.
Feedstock
Existing land use is almost entirely devoted to annual crop production, with corn and soybean dominating (ENSR AECOM, 2008). The corn-grain portion of the facility was estimated to require about 55 percent of existing grain production in the immediate area of the biorefinery. The intended cellulosic feedstock is corn cobs, but the facility might use some corn fiber separated from the corn kernel. Removal of cobs was estimated to amount to about 6 percent of the carbon in corn residues on average and a small amount of nutrients per acre. Removal of cobs was determined to have no obvious short-term or long-term effects on the productivity of farmland in the region (ENSR AECOM, 2008).
Direct Facility Effects
DOE judged that impacts from construction and operation of the cellulosic biofuel facility in Emmetsburg, Iowa, would not exceed national or local environmental standards, including those requiring accounting for social effects. There would be positive effects on employment (ENSR AECOM, 2008).
Water Resources
Farming in the region surrounding the Emmetsburg facility is entirely rainfed. Much of the original area was wet prairie, and there are areas of somewhat-poorly drained to poorly drained soils throughout the region. Many fields are tile drained, and these tiles convey water and nutrients to surface water channels, to the West Des Moines River, and then to the Mississippi River. (See earlier section “Water Quality.”) Nutrient loss in the Mississippi River drainage area was not discussed in the environmental assessment because no expansion of the farmed area or significant alternation of local crop rotations or farming practices as a result of the cellulosic biorefinery was anticipated. However, as discussed earlier in this chapter, increased corn-on-corn production would likely contribute to higher nutrient loss. Under this assumption, DOE found that there are no significant environmental effects from the operation of a potential corn grain-cellulosic residue (cobs) biorefinery (ENSR AECOM, 2008).
Wildlife
The U.S. Fish and Wildlife Service identified two federally protected plant species that might be present in Palo Alto County where the facility will be built. However, occurrence of either species was not observed. Therefore, no adverse effects from the cellulosic facility on any endangered or threatened species of plants or wildlife in the surrounding landscape were identified (ENSR AECOM, 2008).
Southern High Plains Region Case Study
The NBSM (Parker et al., 2010) identified Garden City, Kansas; Guymon and Keyes, Oklahoma; and Dumas, Texas, as some of the likely sites for cellulosic biorefineries in the Southern High Plains region (see Table 3-1 in Chapter 3). This cluster of biorefineries represents the agroecological and environmental conditions common in the region. Several grain-based ethanol operations are in the area, including in Liberal and Garden City, Kansas, and in Plainview and Levelland, Texas (RFA, 2011). Cropping systems typical of the area emphasize a combination of dry land and irrigated crops, principally wheat-fallow or wheat-sorghum-fallow in dryland areas, and corn, sorghum, and wheat with smaller amounts of soybeans and wheat where irrigation is possible. In Texas, cotton is produced under dryland and irrigated conditions, so cotton residues would be available in those regions. Although switchgrass was used as the dedicated bioenergy crops in NBSM, other adapted species will likely be included in these regions (DOE-EERE, 2010a; Nelson, 2010).
Abengoa Corporation has proposed locating a new facility near Hugoton, Kansas, to use cellulosic and grain feedstocks. Because Hugoton is somewhat centrally located in the area discussed here and an environmental assessment was published by the Department of Energy (DOE-EERE, 2010a) for this facility, it is used as an illustration in the region. As
with all environmental assessments, there could be unique circumstances including special issues associated with soil erosion, water supplies, or wildlife that vary from one location to another within the region.
Feedstocks
The proposed Abengoa facility would initially use cellulosic biomass consisting primarily of corn and grain-sorghum stover and wheat straw produced principally or primarily on farmland classified as highly productive, with some residues from lower classified soils (DOE-EERE, 2010b). DOE concluded that sufficient crop residues could be derived from the most productive soils without depleting soil organic matter or causing erosion. Up to 50 percent of the available residues from highly productive farmland was estimated to be removable. Total amount of residues, including those from less productive fields, equaled about 33 percent of all crop residues available in the region. Overall, DOE estimated that the region surrounding the Abengoa facility produced five times the residue requirements needed by the proposed facility. At least some corn-residue removal is beneficial for farming practices in some circumstances (Edgerton, 2010).
In addition, some dedicated bioenergy crop harvests from nonirrigated or marginal croplands or from expired CRP land would be used. Abengoa proposed that in time, dedicated bioenergy crops would constitute three-quarters of all cellulosic biomass used by the facility. DOE assumed that crop residues would be more available than dedicated bioenergy crops at the outset, but that increasing production of dedicated bioenergy crops in the future could have largely beneficial effects on the landscape, particularly if highly erodible croplands were converted to perennial grasses.
The Abengoa proposal also includes a grain-based ethanol facility. DOE estimates that the proposed facility would require 2 to 3 percent of the grains produced in the region. Grain sorghum would meet a large proportion of the feedstock need of the facility (DOE-EERE, 2010b). The Renewable Fuels Association identifies two other grain-ethanol refineries operating in the region near Garden City and Liberal, Kansas, that produced nearly 100 million gallons of ethanol per year in 2010, using about 270 million bushels per year of corn-grain equivalent, though some of the grain used is sorghum.
DOE concluded the Abengoa facility could flexibly secure its feedstock supplies because crop residues and grain supplies exceed facility requirements. Because supplies are abundant, there would be little to no pressure on existing land use or need for land alteration or expansion of cultivated area (DOE-EERE, 2010b). Some less productive farmland could be converted to perennial grasses with positive consequences for conservation and perhaps for wildlife. Independent assessments of the region support the notion that harvesting limited amounts of residues and producing perennial bioenergy crops would not increase soil erosion or undermine future productivity of farmland (Nelson et al., 2006; Nelson, 2010).
Water Use
In the region as a whole, precipitation amounts tend to limit crop yields in most years. Water used for irrigation is derived mostly from the Southern High Plains (or Ogallala) Aquifer. The Ogallala Aquifer has been overdrafted in large parts of this region (Lamm et al., 1995), and irrigation is significantly curtailed. However, saturated thickness of the Southern High Plains Aquifer is locally and regionally variable, and some areas are stable or increasing in depth (Figure 5-12). The availability of grains and residues from irrigated
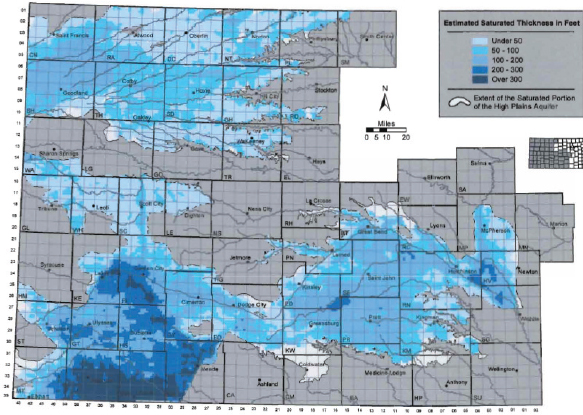
FIGURE 5-12 Average 2004-2006 saturated thickness for the High Plains Aquifer in Kansas.
SOURCE: DOE-EERE (2010b).
agriculture depends on the continued viability of irrigation in some parts of the larger feedstock supply region. All regions of Kansas are governed with a groundwater appropriation and permit system that protects the rights of current users and seeks to sustain water use into the future. The areas first developed for irrigation have been largely overappropriated, while newer areas still have abundant water supplies. The area around the proposed facility has supplies in the aquifer estimated to sustain current irrigation demands for 100 to 200 years (Figure 5-13). However, the saturated thickness of the aquifer will decrease over time if current rates of use are maintained, and the water drawdown will be permanent because the rate of water extraction exceeds the rate of replenishment. Future improvements in water-use efficiency and a shift to dedicated bioenergy crops that require less irrigation will likely reduce further water demands and could extend the lifetime of the aquifer.
Wildlife
The wildlife species of concern are mostly nesting bird species, particularly the lesser prairie chicken, as well as two species of prairie dogs and the black-footed ferret. Migratory waterfowl use wet potholes and permanent wetlands seasonally. No important land-use changes are anticipated because most of the landscape is used for agriculture and grazing; therefore, current wildlife populations are thought to be unaffected by the proposed facility (DOE-EERE, 2010b).
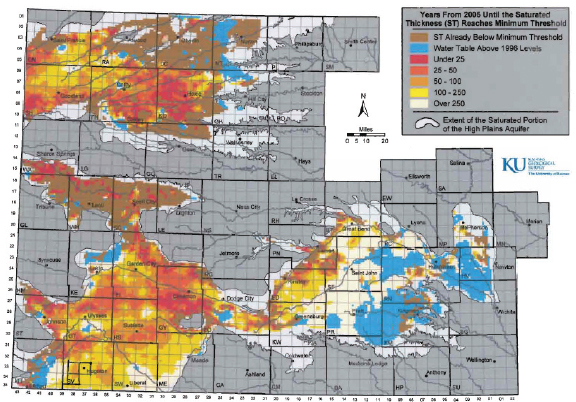
SOURCE: DOE-EERE (2010b).
Direct Facility Impacts
All direct facility impacts, such as water consumption, wastewater and other waste generation, and air emissions, were judged to be potentially within existing national and local standards in the Hugoton region and would not impair the environment around the facility. The planned facility will produce not only ethanol, but also sufficient biopower (electricity) to meet the needs of the facility and some excess electricity for sale to the regional power grid (DOE-EERE, 2010b).
Northern Great Plains Region
NBSM identified several likely cellulosic biorefinery locations in the Northern High Plains (see Table 3-1 in Chapter 3). The sites identified are located in North Dakota, South Dakota, and Nebraska. A combination of crop residues, dedicated bioenergy crops, and coarse grains are the major feedstocks for these biorefineries. A preliminary assessment was carried out by Great River Energy of North Dakota in cooperation with the University of North Dakota’s Energy and Environmental Research Center to assess feedstock supplies in the region of Spiritwood, North Dakota (Broekema, 2009). The analysis focused on feedstock supplies for cofiring with coal in a new power facility but also assessed biomass supplies for a cellulosic facility to be constructed in a second stage. The cellulosic facility would use additional biomass and waste heat from the power plant using a proprietary
conversion process developed by the Inbicon Company of Denmark. An environmental assessment has not been conducted for cellulosic biofuel production.
Feedstock
The study (Broekema, 2009) concluded that there are significant supplies of biomass available in the area around Spiritwood Station. The most important sources of biomass identified were corn cobs and stover, wheat straw, sugar beet foliage, hay crops, and native grass biomass from CRP land.
Broekema (2009) reported that 83 percent of the land in the region analyzed is farmland and pasture. Soybean, wheat, corn, sunflower, and hay were the principal crops. The remainder of the region had remnant native grasses or perennial grasses on CRP land and mixed vegetation along riparian corridors.
Southeast
Many potential bioenergy feedstocks, including native and nonnative species, have been studied for use in the Southeastern United States. Such feedstocks include cellulosic sources such as canola residue (George et al., 2010), wheat straw (Persson et al., 2010), coastal bermudagrass (Cantrell et al., 2009), and sunn hemp (Cantrell et al., 2010). Carbohydrate-based alternatives to corn-grain ethanol have also been explored, such as kudzu (Sage et al., 2009) and sweet sorghum (Wu et al., 2010). Although many feedstock alternatives exist, most studies and pilot projects relating to biofuel feedstocks in the Southeast have focused on woody biomass and switchgrass (Wright and Turhollow, 2010).
A demonstration-scale cellulosic ethanol facility has been constructed in East Tennessee through the state-sponsored University of Tennessee Biofuels Initiative. Owned by Genera Energy LLC and operated by DuPont Danisco Cellulosic Ethanol (DDCE), the Vonore facility has the capacity to produce 250,000 gallons of ethanol per year. The Vonore facility became operational in January 2010. Because the facility is not a DOE-funded project, an environmental assessment of the facility is not publicly available. The facility meets all environmental permitting requirements. Based on operational experience from the project thus far, DDCE is planning to build a commercial-scale facility with a capacity of 25-50 million gallons of ethanol by 2014.
Feedstock
The Vonore facility will soon be ready to make the change from processing corn cobs to processing switchgrass. A total of 5,162 acres of switchgrass are already in production within an hour’s drive of the facility as a result of contracting with 61 farmers in 10 surrounding counties.
Water Resources
Water use is also a significant concern for the environmental sustainability of biomass production in the Southeast (Evans and Cohen, 2009). General circulation models provide contradictory results with respect to future precipitation in the Southeast, but in any case forest biomass and composition changes are projected to differ from forest dynamics expected without climate change (Dale et al., 2010c).
North Central Region
Feedstocks
The Northern Hardwoods Sugar Maple-Beech-Birch community of forests extends from Northern Minnesota through New England and into Maine (Covington, 1980; Drever et al., 2008). These extensive hardwood forests have a lot of potential for woody bioenergy development with extensive existing heat and electricity production using woody biomass already in place (Becker et al., 2009; Jenkins and Sutherland, 2009; Solomon et al., 2009; Volk and Luzadis, 2009). The region has a number of proposed cellulosic ethanol plants of various sizes (Solomon, 2009) and one existing demonstration plant in upstate New York (Checkbiotech.org., 2009). The landscape has historically included high levels of timber harvesting for paper and lumber production. However, timber harvesting has been lower in the past years than before because of the overall decline of these U.S. industries in recent years. Substantial declines in agriculture in the northern reaches of the area, coupled with long-term recovery from widespread clearcutting of earlier eras, create a situation in which forest cover is increasing, particularly in the northernmost areas within the region.
Wildlife and Other Environmental Effects
Increasing woody bioenergy production has the potential to provide new markets for the region’s extensive northern hardwoods (Becker et al., 2009). Janowiak and Webster (2010) and Flaspohler et al. (2009) summarize the state of knowledge of potential impacts on soils, hydrology, and biodiversity. They found that some of the greatest impacts could come from extensive removal of forest residues with associated soil compaction and erosion, as well as soil nutrient losses. Carefully planned forest management could minimize negative biodiversity impacts and, in some cases, improve habitat quality (Janowiak and Webster, 2010). A number of states within the region have recently added voluntary biomass harvesting guidelines to minimize negative impacts on soils, biodiversity, and water resources (BURNUP, 2008).
UNCERTAINTIES ABOUT ENVIRONMENTAL EFFECTS OF BIOFUEL PRODUCTION
The environmental effects of corn production have been studied for years and discussed in earlier sections of this chapter. Therefore, the direct environmental effects of expanding use of corn grain for ethanol have been estimated on the basis of increases in planted acreage, changes in rotation to increase corn production, or the proportion of corn diverted to biofuel. A key issue affecting environmental effects from expanding corn-grain ethanol production in the United States are the per-unit product efficiencies achieved across all aspects of the corn-ethanol system (Burney et al., 2010), and whether or not nutrient losses from annual cropping systems can be reduced at the same time (Kitchen et al., 2005; Lerch et al., 2005; NAS-NAE-NRC, 2009). Increasing yield per acre and resource-use efficiency in corn production has the potential of mitigating some of its environmental effects, but the net effects also depend on total planted acreage and locations of planted acres. Business groups and industry associations of corn-grain ethanol producers tend to assume that existing rates of yield progress will be maintained or exceeded as a result of genetic advances and the use of improved genetic tools in the coming decade (Schill, 2007; Monsanto, 2008). However, unexpected changes in weather as a result of global climate change and any associated shifts in weeds, pests, and diseases dynamics, and the opportunity for unforeseen
technical advances can affect realized yields in specific locations and result in annual and year-to-year variability (Easterling et al., 2007).
GHG emissions as a result of land-use change are the most uncertain environmental effect of corn-grain ethanol production because of the uncertainty associated with correlating corn-grain ethanol production in the United States with market-mediated land-use change. Although close monitoring of global land-use and land-cover changes and market responses over time can reduce some uncertainties, indirect cause and effect can never be attributed with high certainty.
For cellulosic biofuels, DOE has judged that some of the planned individual biorefineries have acceptable environmental effects locally and receive no-effect determinations. They will be permitted based on successful compliance with local and national environmental assessment requirements as shown earlier. Because those assessments were based on relatively short-term local effects, they cannot be extrapolated to infer the overall environmental effects of meeting RFS2 for several reasons. First, those environmental assessments of biorefineries do not consider the environmental effects over the life cycle of fuels, though they could provide some information on feedstock production and conversion for an attributional LCA. Second, a large number of compliant biorefineries can result in aggregated environmental effects beyond the local scale.
The site-specific nature of cellulosic biofuel production makes a nationwide projection of environmental effects challenging. Unless precise details on how the 16 billion gallons of ethanol-equivalent cellulosic biofuel will be produced (including location of feedstock production, the prior condition of the land [for example, vegetation type], feedstock type to be produced in each location, management practices used, conversion technologies used, volumes of different types of biofuels produced, and so on), estimates of environmental effects of meeting RFS2 will be fraught with large uncertainties. At present, the cellulosic biofuel industry is developing via a piecemeal approach so that where and how feedstock will be produced is uncertain. Therefore, the committee cannot make many quantitative statements about the net effects of producing 16 billion gallons of cellulosic biofuel in the United States for most environmental parameters.
In fact, for some environmental parameters such as GHG emissions, the committee cannot ascertain that producing 16 billion gallons of cellulosic biofuel would result in net GHG benefits because of the large uncertainties associated with indirect land-use change. If only crop and forest residues are used to produce cellulosic biofuels, then GHG emissions from indirect land-use change would be minimal. However, those sources of feedstocks alone are inadequate to produce 16 billion gallons of cellulosic biofuel. If dedicated bioenergy crops are produced on croplands, then the uncertainty associated with indirect land-use change increases.
Some authors have suggested a landscape approach to integrating bioenergy feedstocks into agriculture to increase the likelihood that the development of the biofuel industry will result in net environmental benefits (NAS-NAE-NRC, 2009; Dauber et al., 2010; Karlen, 2010; NRC, 2010b). Landscape planning would provide a basis for careful assessment of various environmental effects and the tradeoffs among effects, especially if conducted within a broad LCA framework.
OPPORTUNITIES TO MINIMIZE NEGATIVE ENVIRONMENTAL EFFECTS
As discussed above, production and use of biofuels to meet RFS2 could provide overall environmental benefits compared to petroleum-based fuels or deplete natural resources and incur negative environmental effects if production is not managed properly (Box 5-3).
BOX 5-3
Sustainability Concerns Associated with Using Forest Resources to Meet RFS2
EISA’s definition of renewable biomass from forest resources—that is, forest resources that can be used to produce cellulosic biofuel that can be counted toward RFS2—was selected to reduce the likelihood that “natural” (not planted by humans) forests would be harvested with the primary goal of producing cellulosic bioenergy feedstock. In nonplantation forests, EISA mandates that woody feedstock come from residues (“slash” in the law) or thinnings from state, local, or private forests—explicitly not from federal lands. This definition, in essence, precludes the harvesting for feedstock of nonplantation mature trees, as would be done in a normal timber harvest.
EISA therefore removes about one-third of all U.S. forests from production of woody feedstock that could be used toward RFS2-compliant cellulosic biofuel. In some ways, this could be considered to have minimal effect because timber harvesting on federal lands has already declined drastically over the past couple of decades. Nonindustrial private forest (NIPF) lands have been making up the difference in timber, though U.S. timber harvesting has declined overall in recent years (Adams et al., 2006). Although the mixes of federal, state, county, industrial, and NIPF forestlands vary greatly from state to state (for instance 83 percent of eastern forests are private, whereas only 43 percent of western ones are), these statistics suggest that woody feedstock used to produce cellulosic biofuel into the future will tend to come from NIPFs (USFS, 2001). This raises two primary issues: supply dependability and environmental sustainability.
A major issue with compliance is establishing a process for monitoring “chain of custody” of materials that creates and maintains legally compliant records certifying that feedstock meets these standards. Tracking compliance is possible, though it is arduous and would add to the cost of feedstock procurement. Such a tracking system has been set up to track much of the pulp and lumber in the United States to ensure that it is compliant with the one or more voluntary certification systems to which most major forest and paper companies belong.
The renewable biomass definition raises additional issues with regard to environmental sustainability. Land use is largely regulated at the state and local levels. Likewise, forest management is mostly regulated at the state level and varies widely from state to state (Cubbage et al., 1993). The Southeastern United States is the region with the largest amount of commercial forestry. Most of the western states with significant amounts of valuable timberlands, including Alaska, Idaho, Washington, Oregon, and California, have regulatory forest practice acts governing public and private forest practices that require state permits for most major forest management activities, including timber harvesting. About 50 percent of U.S. forests are in the western states and 57 percent of these are public (USFS, 2001). Much of their forests are federal, and they are subject to a complex set of laws that make them the most restrictively protected in the United States. However, many experts think that environmental protection is not served by restricting all access in fire-threatened forest systems.
The lack of guidelines or standards for sustainable land management practices is a barrier to ensuring a viable biofuel industry that minimizes negative environmental impacts. Although many U.S. forests are subject to voluntary or regulatory guidelines aimed at reducing negative impacts, these guidelines typically focus only on reducing erosion, particularly in the Eastern United States. U.S. forests are generally not subject to mandatory environmental protections that would ensure long-term environmental sustainability of woody biomass feedstock harvesting. Most state and private timber harvesting are required to meet the standards for environmental protection of either the Sustainable Forestry Initiative or Forest Stewardship Council, to which most major paper and forest companies have chosen to belong, or state-specific timber management and timber harvest plans. These standards mostly require companies to adhere to existing laws and guidelines, including voluntary state-level Best Management Practices (BMPs) aimed at reducing nonpoint source pollution caused by erosion from timber management stands and roads (FSCUS, 2010; SFI, 2010). BMPs for harvesting biomass are being developed in many regions of the United States (Ice et al., 2010). All states have recommended BMPs or forest-practice rules as part of silvicultural nonpoint source control programs (Schilling, 2009). Six states have developed specific BMP guidelines directed at biomass harvesting (Maine, Michigan, Minnesota, Missouri, Pennsylvania, and Wisconsin), and others are considering special BMPs (California, Massachusetts, Maryland, Mississippi, and North Carolina) (Evans et al., 2010). Thus, outside of the West, the only form of environmental protection for most state, local, and private forests are voluntary guidelines aimed at reducing nonpoint source pollution with regulatory requirements to avoid only activities that would cause severe negative impacts on wetlands or water quality through erosion.
Determining best management practices for the production of different feedstock types in various regions and developing sustainability standards or certification processes could provide opportunities to enhance environmental benefits and minimize negative environmental effects.
Therefore, the national and international community has been working to select a set of indicators that can be used to measure the environmental effects of increased biofuel production. Indicators are carefully selected categories of measurements that track conditions over time (Cairns et al., 1993), with a purpose of measuring the state of natural resources (including air, water, or land resources), the pressures on them, and the resulting effects on economics and environmental sustainability (Niemi and McDonald, 2004). Indicators need to be repeatable, be statistically valid, measure relevant changes, and be readily monitored (Dale and Beyeler, 2001). A major challenge in selecting and developing a list of indicators for certifying bioenergy sustainability is limitations in data and modeling because the ability to measure and objectively verify critical indicators is limited in many cases (Hecht et al., 2009).
A set of indicators for monitoring environmental effects of biofuels that is complementary and largely based on existing efforts by the Roundtable on Sustainable Biofuels (RSB, 2010), Biomass Research and Development Board (BRDB, 2010), the Global Bioenergy Partnership (GBEP, 2010), the Millennium Ecosystem Assessment (2005), and the National Sustainable Agriculture Information Service (Earles and Williams, 2005) would have to be selected and agreed upon by federal agencies and environmental stakeholder groups. Environmental indicators for biofuels proposed by the groups listed above relate to productivity, GHG emissions, water quality and quantity, air quality, and biodiversity.
Van Dam et al. (2008) reviewed initiatives on biomass sustainability standards and certification and found major differences in the geographic coverage and whether the sustainability standards were voluntary or mandatory. Stakeholder groups that are developing standards and certification systems currently include national and regional governments; companies; nongovernmental organizations; and international organizations and initiatives, such as Biofuels Initiatives and the Roundtable on Sustainable Palm Oil of the United Nations Conference on Trade and Development. The objectives and motivations for certification vary considerably among the stakeholder groups. Van Dam et al. (2008) pointed out that while there is an urgent need for criteria to ensure sustainable production of biomass, some of those criteria can be addressed using existing certification systems, such as forest sustainability certification. The authors suggested that development of certification systems will best be done via an adaptive management process (for example, learning from pilot studies and research) with expansion over time. Furthermore, improved coordination among certification activities is necessary to improve coherence and efficiency in certification of sustainable biomass, to avoid proliferation of redundant or nonaligned standards, and to provide direction in the appropriate approach (van Dam et al., 2008).
To date, the indicators being discussed in these efforts are numerous, and implementing indicators in an assessment process can be costly. Furthermore, there is no agreement among stakeholders as to what indicators should be included in certification systems for bioenergy sustainability (Buchholz et al., 2009). As discussed in another NRC report (2010b, p. 33), “Indicators of sustainability presume the existence of goals and objectives, and yet there is no guarantee that all parties will agree on which sustainability objectives and goals are desirable or most important, particularly if tradeoffs are involved.” Thus, indicators are useful measurements toward progress once the sustainability objectives are clearly identified and prioritized (NRC, 2010b).
The environmental effects of biofuel production in the United States can be discussed in several contexts. For example, one context includes mitigating the net environmental costs; this chapter provides many specific examples of how biofuel production could result in positive, neutral, or negative environmental outcomes depending on the particular environmental effect of concern, the crop used, the land used to cultivate the crop and its prior use, the management practices used, and other factors including environmental effects from market-mediated land-use and land-cover changes. A separate context is the question of whether achieving RFS2 would provide net environmental benefits or harm compared to using petroleum-based fuels. The committee cannot provide any quantitative answers in most cases or even qualitative answers with certainty in some cases for the following reasons:
- The collective effects of achieving RFS2 will, in large part, depend on where and how the biomass feedstock is grown across the country. Although various models (National Biorefinery Siting Model, USDA, EPA, and others) estimated potential locations of feedstock production, whether farmers would grow bioenergy feedstocks in those locations, the management practices that they would use, and the condition of the lands used before and after bioenergy feedstock production are unknown and not predictable.
- An assessment of the environmental outcome of substituting petroleum-based fuels with the RFS2-mandated biofuels would require a comparison of each environmental effect between biofuels and petroleum-based fuels and a projection of collective effects of the fuel substitution.
The committee’s assessment of the environmental effects of achieving RFS2 is summarized below.
GHG Emissions
GHGs are emitted into the atmosphere or stored in soil during different stages of biofuel production. GHG effects of biofuels depend on type of feedstocks grown and the management practices used to grow them, any direct and indirect land-use changes that might be incurred as a result of increasing biofuel production, harvesting and transport of biomass, and the technologies used to convert biomass to fuels. GHG emissions from direct and indirect land-use and land-cover changes are the variables with the highest uncertainty and the greatest effect in many cases throughout the biofuel supply chain. If no direct or indirect land-use or land-cover changes are incurred, biofuels tend to have lower life-cycle GHG emissions than petroleum-based fuels. Feedstocks such as crop and forest residues and municipal solid wastes incur little or no direct and indirect land-use or land-cover changes; therefore, cellulosic biofuels made from those feedstocks are more likely to reduce GHG emissions when care is taken to maintain land productivity and soil carbon storage.
Other cellulosic feedstocks such as herbaceous perennial crops and short-rotation woody crops can contribute to carbon storage in soil particularly if they are planted on land with low carbon content. For example, planting perennial bioenergy crops in place of annual crops could potentially enhance carbon storage in that site. However, planting perennial bioenergy crops on existing cropland can trigger market-mediated land-use changes elsewhere that can result in large GHG emissions. Although RFS2 can levy restrictions to discourage bioenergy feedstock producers from land-clearing or land-cover change in the
United States that would result in net GHG emissions, the policy cannot prevent market-mediated effects on land-use or land-cover changes nor can it control land-use changes outside the United States. Therefore, the extent to which RFS2 contributes to lowering global GHG emissions is uncertain.
Air Quality
The current focus on tailpipe emissions of biofuels compared to petroleum-derived fuels is misguided as it misses the majority of the emissions of air pollutants (other than GHGs) affecting air quality in each of the fuels’ life cycles. Overall production and use of ethanol was projected to result in increases in pollutant concentration for ozone and particulate matter than gasoline on a national average, but the local effects could be variable. Those projected air-quality effects from ethanol fuel would be more damaging to human health than those from gasoline use. This is particularly true for corn-grain ethanol. It also showed that the effects from the different fuel options are highly spatially and temporally dependent, thus necessitating a modeling approach that accounts for this variability.
Water Quality
Along the biofuel supply chain, the effect of feedstock production on water quality is less quantifiable than that of fuel conversion. Feedstock production is a nonpoint source discharge; thus, its effect is less certain. Some feedstock types might provide water quality-benefits while others might result in high discharge of sediment and nutrients. Scenarios in which different bioenergy crops are grown in various areas would have to be developed and applied to watershed models to predict changes in water quality resulting from different ways of implementing the RFS2 schedule. Therefore, detailed information on where the bioenergy feedstocks would be grown and how they would be integrated into the existing landscape is necessary to assess the effects of increasing biofuel production on water quality.
Water Quantity and Consumptive Water Use
Consumptive water use over the life cycle of corn-grain ethanol is higher than petroleum-based fuels even if the biofuels are produced from nonirrigated crops. Estimates of consumptive water use for cellulosic biofuels ranges from 2.9 to 1,300 gallons per gallon of gasoline equivalent. Consumptive water use for biofuel produced from switchgrass was estimated to be comparable to that of petroleum-based fuel if the biomass feedstock is not irrigated and if it is converted to fuel by thermochemical conversion. However, biofuels’ higher consumptive water use does not necessarily imply that they have more of a negative effect on water resources than petroleum-based fuels because water availability has to be considered in a regional context. For example, a petroleum refinery sited in an arid region with water shortage could be more harmful to its local water resources than a biofuel refinery sited near an aquifer that has rising groundwater level. Therefore, a national assessment of total consumptive water use as a result of meeting RFS2 might not be as useful in assessing effects on water quantity as local and regional assessments. In particular, biorefineries are most likely situated close to sources of bioenergy feedstock production; both biorefinery and feedstock production draw upon local water resources. Regional water availability is particularly important as the number of biorefineries increases in a region. An individual refinery might not pose much stress on a water resource, but multiple refineries could alter the hydrology in a region.
Soil Quality
Whether the environmental effects on soil quality are positive or negative depend, in large part, on the feedstock grown, prior condition of the land, and management practices used. Overharvesting of crop or forest residues can certainly have negative effects on soil quality. In contrast, converting abandoned croplands to herbaceous perennial crops is likely to improve soil quality. Therefore, the effects of increasing biofuel production on soil quality cannot be generalized across the country.
Biodiversity
The effects of achieving RFS2 on biodiversity cannot be readily quantified or qualified because the species affected are largely location-specific and the effects depend on management practices and changes in vegetation cover (including vegetation type and height). Local and regional assessments would be needed to evaluate whether bioeneregy feedstock production would benefit or harm biodiversity.
Overall Environmental Outcome
Production and use of biofuels can be beneficial to some environmental qualities and resource base and have negative effects for others. Thus, the environmental effects of biofuels cannot be focused on one or two environmental parameters (for example, GHG emissions). An assessment of overall environmental outcomes requires a systems approach that considers various environmental effects simultaneously using a suite of indicators. Such assessment would have to be conducted across spatial scales because some effects are localized while others are regional or global. A systems assessment of environmental effects would contribute to developing a biofuel industry that balances tradeoffs and minimizes negative outcomes.
Although using biofuels holds promise to provide net environmental benefits compared to using petroleum-based fuels, the environmental outcome of biofuel production cannot be guaranteed without a landscape and life-cycle vision of where and how the bioenergy feedstocks will be grown to meet the RFS2 consumption mandate. Such landscape and life-cycle vision would contribute to minimizing the potential of negative direct and indirect land-use and land-cover changes, encouraging placement of cellulosic feedstock production in areas that can enhance soil quality or help reduce agricultural nutrient runoffs, anticipating and reducing the potential of groundwater overdraft, and enhancing wildlife habitats. A piecemeal effort to expanding the biofuel industry does not necessarily consider how bioenergy feedstocks could be best integrated into an agricultural landscape to optimize environmental benefits. Without a strategic vision of how RFS2 would be achieved, the overall environmental effects of displacing petroleum-based fuels with 35 billion gallons of ethanol-equivalent biofuels and 1 billion gallons of biodiesel can be positive or negative.
Abu-Allaban, M., J. Gillies, A. Gertler, R. Clayton, and D. Proffitt. 2007. Motor vehicle contributions to ambient PM10 and PM2.5 at selected urban areas in the USA. Environmental Monitoring and Assessment 132(1):155-163.
Adams, D.M., R.J. Alig, B.A. McCarl, J.M. Callaway, and S.M. Winnett. 1999. Minimum cost strategies for sequestering carbon in forests. Land Economics 75(3):360-374.
Adams, D.M., R.W. Haynes, and A.J. Daigneault. 2006. Estimated Timber Harvest by U.S. Region and Ownership, 1950-2002. Portland, OR: U.S. Department of Agriculture - Forest Service - Pacific Northwest Research Station.
Adegbidi, H.G., T.A. Volk, E.H. White, L.P. Abrahamson, R.D. Briggs, and D.H. Bickelhaupt. 2001. Biomass and nutrient removal by willow clones in experimental bioenergy plantations in New York State. Biomass and Bioenergy 20(6):399-411.
Aden, A. 2007. Water usage for current and future ethanol production. Southwest Hydrology September/October:22-23.
Adler, P.R., S.J.D. Grosso, and W.J. Parton. 2007. Life-cycle assessment of net greenhouse-gas flux for bioenergy cropping systems. Ecological Applications 17(3):675-691.
Agnetwork. 2010. Grain market outlook: Prospective planting report. Available online at http://www.agnetwork.com/Grain-Market-Outlook--Prospective-Planting-Report/2010-03-29/Article.aspx?oid=1029633&tid=Archive. Accessed September 8, 2010.
Alexander, R.B., R.A. Smith, G.E. Schwarz, E.W. Boyer, J.V. Nolan, and J.W. Brakebill. 2008. Differences in phosphorus and nitrogen delivery to the Gulf of Mexico from the Mississippi River Basin. Environmental Science and Technology 42(3):822-830.
Anderson, L.G. 2009. Ethanol fuel use in Brazil: Air quality impacts. Energy and Environmental Science 2(10):1015-1037.
Anderson-Teixeira, K.J., and E.H. Delucia. 2011. The greenhouse gas value of ecosystems. Global Change Biology 17(1):425-438.
Anderson-Teixeira, K.J., S.C. Davis, M.D. Masters, and E.H. Delucia. 2009. Changes in soil organic carbon under biofuel crops. Global Change Biology Bioenergy 1(1):75-96.
Aneja, V.P., W.H. Schlesinger, and J.W. Erisman. 2009. Effects of agriculture upon the air quality and climate: Research, policy, and regulations. Environmental Science and Technology 43(12):4234-4240.
Anex, R., and R. Lifset. 2009. Post script to the corn ethanol debate. Journal of Industrial Ecology 13(6):996-999.
Anex, R.P., L.R. Lynd, M.S. Laser, A.H. Heggenstaller, and M.M. Liebman. 2007. Potential for enhanced nutrient cycling through coupling of agricultural and bioenergy systems. Crop Science 47:1327-1335.
Applegate, T.J., C. Troche, Z. Jiang, and T. Johnson. 2009. The nutritional value of high-protein corn distillers dried grains for broiler chickens and its effect on nutrient excretion. Poultry Science 88(2):354-359.
Babcock, B.A. 2009. Measuing unmeasurable land-use changes from biofuels. Iowa Ag Review Summer:4-6.
Baker, J.M., T.E. Ochsner, R.T. Venterea, and T.J. Griffis. 2007. Tillage and soil carbon sequestration—What do we really know? Agriculture Ecosystems and Environment 118(1-4):1-5.
Barney, J.N., and J.M. DiTomaso. 2008. Nonnative species and bioenergy: Are we cultivating the next invader? BioScience 58(1):64-70.
Barney, J.N., and J.M. DiTomaso. 2011. Global climate niche estimates for bioenergy crops and invasive species of agronomic origin: Potential problems and opportunities. Plos One 6(3):e17222.
Baskaran, L., H. I. Jager, P. E. Schweizer, and R. Srinivasan. 2009. Progress toward evaluating the sustainability of switchgrass as a bioenergy crop using the SWAT model. Pp. 212-222 in 2009 International SWAT Conference Proceedings. College Station: Texas A&M University System.
Bavin, T.K., T.J. Griffis, J.M. Baker, and R.T. Venterea. 2009. Impact of reduced tillage and cover cropping on the greenhouse gas budget of a maize/soybean rotation ecosystem. Agriculture Ecosystems and Environment 134(3-4):234-242.
Becker, D.R., K. Skog, A. Hellman, K.E. Halvorsen, and T. Mace. 2009. An outlook for sustainable forest bioenergy production in the lake states. Energy Policy 37:5687-5693.
Benke, M.B., X. Hao, P. Caffyn, and T.A. McAllister. 2010. Using manure from cattle fed dried distillers’ grains with solubles (DDGS) as fertilizer: Effects on nutrient accumulation in soil and uptake by barley. Agriculture, Ecosystems and Environment 139(4):720-727.
Berndes, G., P. Borjesson, M. Ostwald, and M. Palm. 2008. Multifunctional biomass production systems—An overview with presentation of specific applications in India and Sweden. Biofuels Bioproducts and Biorefining 2(1):16-25.
Bies, L. 2006. The biofuels explosion: Is green energy good for wildlife? Wildlife Society Bulletin 34(4):1203-1205.
Blanco-Canqui, H. 2010. Energy crops and their implications on soil and environment. Agronomy Journal 102(2):403-419.
Blanco-Canqui, H., and R. Lal. 2008. No-tillage and soil-profile carbon sequestration: An on-farm assessment. Soil Science Society of America Journal 72(3):693-701.
Börjesson, P. 2009. Good or bad bioethanol from a greenhouse gas perspective—What determines this? Applied Energy 86(5):589-594.
Börjesson, P., and L.M. Tufvesson. 2011. Agricultural crop-based biofuels—Resource efficiency and environmental performance including direct land use changes. Journal of Cleaner Production 19(2-3):108-120.
Bouwman, A.F., I. Fung, E. Matthews, and J. John. 1993. Global analysis of the potential for N2O production in natural soils. Global Biogeochemical Cycles 7(3):557-597.
Bouwman, A.F., L.J.M. Boumans, and N.H. Batjes. 2002. Emissions of N2O and NO from fertilized fields: Summary of available measurement data. Global Biogeochemical Cycles 16(4):1058-1061.
Bouwman, A.F., J.J.M. van Grinsven, and B. Eickhout. 2010. Consequences of the cultivation of energy crops for the global nitrogen cycle. Ecological Applications 20(1):101-109.
Bowyer, C. 2010. Anticipated Indirect Land Use Change Associated with Expanded Use of Biofuels and Bioliquids in the EU—An Analysis of the National Renewable Energy Action Plans. London: Institute of European Environmental Policy.
Boyd, J., and L. Wainger. 2003. Measuring Ecosystem Service Benefits: The Use of Landscape Analysis to Evaluate Environmental Trades and Compensation. Washington, DC: Resources for the Future.
Brauman, A., and G.C. Daily. 2008. Ecosystem services. Pp. 1148-1154 in Human Ecology, S.E. Jørgensen and B.D. Fath, eds. Oxford: Elsevier.
BRDB (Biomass Research and Development Board). 2010. BR&D: Biomass Research and Development. Available online at http://www.usbiomassboard.gov/. Accessed November 9, 2010.
Bremer, V.R., A.J. Liska, T.J. Klopfenstein, G.E. Erickson, H.S. Yang, D.T. Walters, and K.G. Cassman. 2010. Emissions savings in the corn-ethanol life cycle from feeding coproducts to livestock. Journal of Environmental Quality 39(2):472-482.
Bricker, S.B., C.G. Clement, D.E. Pirhalla, S.P. Orlando, and D.R.G. Farrow. 1999. National Estuarine Eutrophication Assessment: Effects of Nutrient Enrichment in the Nation’s Estuaries. Silver Spring, MD: National Oceanic and Atmospheric Administration.
Broekema, S. 2009. Feasibility Study of a Biomass Supply for the Spiritwood Industrial Park. Final Report. Maple Grove, MN: Great River Energy.
Brooke, R., G. Fogel, A. Glaser, E. Griffin, and K. Johnson. 2009. Corn Ethanol and Wildlife: How Are Policy and Market Driven Increases in Corn Plantings Affecting Habitat and Wildlife. Washington, DC: National Wildlife Federation.
Buchholz, T., V.A. Luzadis, and T.A. Volk. 2009. Sustainability criteria for bioenergy systems: 848 results from an expert survey. Journal of Cleaner Production 17:S86-S98.
Buddenhagen, C.E., C. Chimera, and P. Clifford. 2009. Assessing biofuel crop invasiveness: A case study. Plos One 4(4).
Burke, I.C., C.M. Yonker, W.J. Parton, C.V. Cole, K. Flach, and D.S. Schimel. 1989. Texture, climate, and cultivation effects on soil organic matter content in U.S. grassland soils. Soil Science Society of America Journal 53:800-805.
Burney, J.A., S.J. Davis, and D.B. Lobell. 2010. Greenhouse gas mitigation by agricultural intensification. Proceedings of the National Academy of Sciences of the United States of America 107(26):12052-12057.
BURNUP (Biomass Utilization and Restoration Network for the Upper Peninsula). 2008. Woody biomass harvesting guidelines. Available online at http://www.upwoodybiomass.org/guidelines_2.asp. Accessed October 30, 2010.
Busse, M.D., P.H. Cochran, W.E. Hopkins, W.H. Johnson, G.M. Riegel, G.O. Fiddler, A.W. Ratcliff, and C.J. Shestak. 2009. Developing resilient ponderosa pine forests with mechanical thinning and prescribed fire in central Oregon’s pumice region. Canadian Journal of Forest Research-Revue Canadienne De Recherche Forestiere 39(6):1171-1185.
Cairns, J., P.V. McCormick, and B.R. Niederlehner. 1993. A proposed framework for developing indicators of ecosystem health. Hydrobiologia 263(1):1-44.
Campbell, C.A., H.H. Janzen, K. Paustian, E.G. Gregorich, L. Sherrod, B.C. Liang, and R.P. Zentner. 2005. Carbon storage in soils of the North American Great Plains: Effect of cropping frequency. Agronomy Journal 97(2):349-363.
Campbell, J.E., and E. Block. 2010. Land-use and alternative bioenergy pathways for waste biomass. Environmental Science and Technology 44(22):8665-8669.
Campbell, J.E., D.B. Lobell, and C.B. Field. 2009. Greater transportation energy and GHG offsets from bioelectricity than ethanol. Science 324(5930):1055-1057.
Cantrell, K.B., K.C. Stone, P.G. Hunt, K.S. Ro, M.B. Vanotti, and J.C. Burns. 2009. Bioenergy from coastal bermudagrass receiving subsurface drip irrigation with advance-treated swine wastewater. Bioresource Technology 100(13):3285-3292.
Cantrell, K.B., P.J. Bauer, and K.S. Ro. 2010. Utilization of summer legumes as bioenergy feedstocks. Biomass and Bioenergy 34(12):1961-1967.
Cassman, K.G., S. Wood, P.S. Choo, H.D. Cooper, C. Devendra, J. Dixon, J. Gaskell, S. Khan, R. Lal, L. Lipper, J. Pretty, J. Primavera, N. Ramankutty, E. Viglizzo, K. Wiebe, S. Kadungure, N. Kanbar, Z. Khan, R. Leakey, S. Porter, K. Sebastian, and R. Tharme. 2005. Cultivated systems. Pp. 745-794 in Ecosystems and Human Well-being: Current State and Trends, R. Hassan, R. Scholes, and N. Ash, eds. Washington, DC: Island Press.
Castro, A., and D.H. Wise. 2009. Influence of fine woody debris on spider diversity and community structure in forest leaf litter. Biodiversity and Conservation 18(14):3705-3731.
CENR (Committee on Environment and Natural Resources). 2000. Integrated Assessment of Hypoxia in the Northern Gulf of Mexico. Washington, DC: National Science and Technology Council.
Checkbiotech.org. 2009. Mascoma cellulosic ethanol plant begins operations in Rome, NY. Available online at http://checkbiotech.org/node/24912. Accessed November 5, 2010.
Cherubini, F., and S. Ulgiati. 2010. Crop residues as raw materials for biorefinery systems—A LCA case study. Applied Energy 87(1):47-57.
Chester, M.V., and A. Horvath. 2009. Environmental assessment of passenger transportation should include infrastructure and supply chains. Environmental Research Letters 4(2).
Chiu, Y.-W., B. Walseth, and S. Suh. 2009. Water embodied in bioethanol in the United States. Environmental Science and Technology 43(8):2688-2692.
Christopher, S.F., R. Lal, and U. Mishra. 2009. Regional study of no-till effects on carbon sequestration in Midwestern United States. Soil Science Society of America Journal 73(1):207-216.
Cook, R., S. Phillips, M. Houyoux, P. Dolwick, R. Mason, C. Yanca, M. Zawacki, K. Davidson, H. Michaels, C. Harvey, J. Somers, and D. Luecken. 2011. Air quality impacts of increased use of ethanol under the United States’ Energy Independence and Security Act. Atmospheric Environment (In press).
Costanza, R., R. d’Arge, R. de Groot, S. Farber, M. Grasso, B. Hannon, K. Limburg, S. Naeem, R.V. O’Neill, J. Paruelo, R.G. Raskin, P. Sutton, and M. van den Belt. 1997. The value of the world’s ecosystem services and natural capital. Nature 387(6630):253-260.
Costello, C., W.M. Griffin, A.E. Landis, and H.S. Matthews. 2009. Impact of biofuel crop production on the formation of hypoxia in the Gulf of Mexico. Environmental Science and Technology 43(20):7985-7991.
Covington, W.W. 1980. Changes in forest floor organic matter and nutrient content following the clear cutting in northern hardwoods. Ecology 62(1):4-48.
Cubbage, F.W., J. O’Laughlin, and C.S. Bullock III. 1993. Forest Resource Policy. New York: John Wiley and Sons.
Dale, V.H., and S.C. Beyeler. 2001. Challenges in the development and use of ecological indicators. Ecological Indicators 1:3-10.
Dale, V.H., K.L. Kline, J. Wiens, and J. Fargione. 2010a. Biofuels: Implications for Land Use and Biodiversity. Washington, DC: Ecological Society of America.
Dale, V.H., C.L. Kling, J.L. Meyer, J. Sanders, H. Stallworth, T. Armitage, D. Wangsness, T. Bianchi, A. Blumberg, W. Boynton, D.J. Conley, W. Crumpton, M.B. Davis, D. Gilbert, R.W. Howarth, R. Lowrance, K. Mankin, J. Opaluch, H. Paerl, K. Reckhow, A.N. Sharpley, T.W. Simpson, C. Snyder, and C. Wright. 2010b. Hypoxia in the Northern Gulf of Mexico; Springer Series on Environmental Management. New York: Springer.
Dale, V.H., M.L. Tharp, K.O. Lannom, and D.G. Hodges. 2010c. Modeling transient response of forests to climate change. Science of the Total Environment 408(8):1888-1901.
Dauber, J., M.B. Jones, and J.C. Stout. 2010. The impact of biomass crop cultivation on temperate biodiversity. Global Change Biology Bioenergy 2(6):289-309.
Daughtry, C.S.T., P.C. Doraiswamy, E.R. Hunt, A.J. Stern, J.E. McMurtrey, and J.H. Prueger. 2006. Remote sensing of crop residue cover and soil tillage intensity. Soil and Tillage Research 91(1-2):101-108.
Davidson, E.A., and I.L. Ackerman. 1993. Changes in soil carbon inventories following cultivation of previously untilled soils. Biogeochemistry 20:161-193.
Davis, A.S., R.D. Cousens, J. Hill, R.N. Mack, D. Simberloff, and S. Raghu. 2010. Screening bioenergy feedstock crops to mitigate invasion risk. Frontiers in Ecology and the Environment 8(10):533-539.
Del Grosso, S.J., A.R. Mosier, W.J. Parton, and D.S. Ojima. 2005. DAYCENT model analysis of past and contemporary soil N2O and net greenhouse gas flux for major crops in the USA. Soil and Tillage Research 83(1):9-24.
Delucchi, M. 2011. A conceptual framework for estimating the climate impacts of land-use change due to energy crop programs. Biomass and Bioenergy 35(6):2337-2360.
DiTomaso, J.M., J.K. Reaser, C.P. Dionigi, O.C. Doering, E. Chilton, J.D. Schardt, and J.N. Barney. 2010. Biofuel vs. bioinvasion: Seeding policy priorities. Environmental Science and Technology 44(18):6906-6910.
DOE (U.S. Department of Energy). 2005. Design and Construction of a Proposed Fuel Ethanol Plant, Jasper County, Indiana. Golden, CO: U.S. Department of Energy.
DOE (U.S. Department of Energy). 2009. Construction and Operation of a Proposed Cellulosic Ethanol Plant, Range Fuels Soperton Plant, LLC (formerly Range Fuels Inc.), Treutlen County, Georgia. Washington, DC: U.S. Department of Energy.
DOE-EERE (U.S. Department of Energy - Energy Efficiency and Renewable Energy). 2010a. Final Environmental Impact Statement for the Proposed Abengoa Biorefinery Project near Hugoton, Stevens County, Kansas. Golden, CO: U.S. Department of Energy.
DOE-EERE (U.S. Department of Energy - Energy Efficiency and Renewable Energy). 2010b. Final Environmental Impact Statement for the Proposed Abengoa Biorefinery Project near Hugoton, Stevens County, Kansas. Golden, CO: U.S. Department of Energy.
DOE-NETL (U.S. Department of Energy - National Energy Technology Laboratory). 2010. Carbon Sequestration Atlas of the United States and Canada. Washington, DC: U.S. Department of Energy.
Dolan, M.S., C.E. Clapp, R.R. Allmaras, J.M. Baker, and J.A.E. Molina. 2006. Soil organic carbon and nitrogen in a Minnesota soil as related to tillage, residue and nitrogen management. Soil and Tillage Research 89(2):221-231.
Dominguez-Faus, R., S.E. Powers, J.G. Burken, and P.J. Alvarez. 2009. The water footprint of biofuels: A drink or drive issue? Environmental Science and Technology 43(9):3005-3010.
Donner, S.D., and C.J. Kucharik. 2003. Evaluating the impacts of land management and climate variability on crop production and nitrate export across the Upper Mississippi Basin. Global Biogeochemical Cycles 17(3):1085.
Donner, S.D., and C.J. Kucharik. 2008. Corn-based ethanol production compromises goal of reducing nitrogen export by the Mississippi River. Proceedings of the National Academy of Sciences of the United States of America 105(11):4513-4518.
Donner, S.D., M.T. Coe, J.D. Lenters, T.E. Twine, and J.A. Foley. 2002. Modeling the impact of hydrological changes on nitrate transport in the Mississippi River Basin from 1955 to 1994. Global Biogeochemical Cycles 16(3):1043.
Drever, C.R., M.C. Drever, C. Messier, Y. Bergeron, and M. Flannigan. 2008. Fire and the relative roles of weather, climate and landscape characteristics in the Great Lakes-St. Lawrence forest of Canada. Journal of Vegetation Science 19:57-66.
Dumortier, J., D.J. Hayes, M. Carriquiry, F. Dong, X. Du, A. Elobeid, J.F. Fabiosa, and S. Tokgoz. 2010. Sensitivity of Carbon Emission Estimates from Indirect Land-Use Change. Ames: Iowa State University.
Durbin, T.D., J.W. Miller, T. Younglove, T. Huai, and K. Cocker. 2007. Effects of fuel ethanol content and volatility on regulated and unregulated exhaust emissions for the latest technology gasoline vehicles. Environmental Science and Technology 41(11):4059-4064.
Earles, R., and P. Williams. 2005. Sustainable agriculture: An introduction. Available online at http://attra.ncat.org/attra-pub/PDF/sustagintro.pdf. Accessed September 16, 2009.
Easterling, W.E., P.K. Aggarwal, P. Batima, K.M. Brander, L. Erda, S.M. Howden, A. Kirilenko, J. Morton, J.-F. Soussana, J. Schmidhuber, and F.N. Tubiello. 2007. Food, fibre and forest products. Pp. 273-313 in Impacts, Adaptation and Vulnerability. Contribution of Working Group II to the Fourth Assessment Report of the Intergovernmental Panel on Climate Change, M.L. Parry, O.F. Canziani, J.P. Palutikof, P.J.v.d. Linden, and C.E. Hanson, eds. Cambridge: Cambridge University Press.
Edgerton, M. 2010. Corn carbon budgets: Use of “discretionary carbon.” Presentation to the Committee on Economic and Environmental Impacts of Increasing Biofuels Production, March 5.
Eisenbies, M.H., E.D. Vance, W.M. Aust, and J.R. Seiler. 2009. Intensive utilization of harvest residues in southern pine plantations: Quantities available and implications for nutrient budgets and sustainable site productivity. BioEnergy Research 2(3):90-98.
Ekvall, T., and A.S.G. Andræ. 2006. Attributional and consequential environmental assessment of the shift to lead-free solders. The International Journal of Life Cycle Assessment 11(5):344-353.
Ekvall, T., and B.P. Weidema. 2004. System boundaries and input data in consequential life cycle inventory analysis. The International Journal of Life Cycle Assessment 9(3):161-171.
Engel, B., I. Chaubey, M. Thomas, D. Saraswat, P. Murphy, and B. Bhaduri. 2010. Biofuels and water quality: Challenges and opportunities for simulation modeling. Biofuels 1(3):463-477.
ENSR AECOM. 2008. Construction and Operation of a Proposed Lignocellulosic Biorefinery, POET Project LIBERTY, LLC, Emmetsburg, Iowa. Washington, DC: U.S. Department of Energy.
EPA (U.S. Environmental Protection Agency). 2010a. EPA Finalizes Regulations for the National Renewable Fuel Standard Program for 2010 and Beyond. Washington, DC: U.S. Environmental Protection Agency.
EPA (U.S. Environmental Protection Agency). 2010b. Fuel-specific lifecycle greenhouse gas emissions results. Available online at http://www.regulations.gov/#!documentDetail;D=EPA-HQ-OAR-2005-0161-3173. Accessed March 3, 2011.
EPA (U.S. Environmental Protection Agency). 2010c. Inventory of U.S. Greenhouse Gas Emissions and Sinks: 1990-2008. Washington, DC: U.S. Environmental Protection Agency.
EPA (U.S. Environmental Protection Agency). 2010d. Renewable Fuel Standard Program (RFS2) Regulatory Impact Analysis. Washington, DC: U.S. Environmental Protection Agency.
Erisman, J., H. van Grinsven, A. Leip, A. Mosier, and A. Bleeker. 2010. Nitrogen and biofuels: An overview of the current state of knowledge. Nutrient Cycling in Agroecosystems 86(2):211-223.
Evans, A.M., R.T. Perschel, and B.A. Kittler. 2010. Revised Assessment of Biomass Harvesting and Retention Guidelines. Santa Fe, NM: Forest Guild.
Evans, J.M., and M.J. Cohen. 2009. Regional water resource implications of bioethanol production in the southeastern United States. Global Change Biology 15(9):2261-2273.
Fargione, J., J. Hill, D. Tilman, S. Polasky, and P. Hawthorne. 2008. Land clearing and the biofuel carbon debt. Science 319(5867):1235-1238.
Fargione, J.E., T.R. Cooper, D.J. Flaspohler, J. Hill, C. Lehman, T. McCoy, S. McLeod, E.J. Nelson, K.S. Oberhauser, and D. Tilman. 2009. Bioenergy and wildlife: Threats and opportunities for grassland conservation. BioScience 59(9):767-777.
Fargione, J.E., R.J. Plevin, and J.D. Hill. 2010. The ecological impacts of biofuels. Annual Review of Ecology and Systematics 41:351-377.
Farrell, A.E., R.J. Plevin, B.T. Turner, A.D. Jones, M. O’Hare, and D.M. Kammen. 2006. Ethanol can contribute to energy and environmental goals. Science 311(5760):506-508.
Fearnside, P.M. 1996. Amazonian deforestation and global warming: Carbon stocks in vegetation replacing Brazil’s Amazon forest. Forest Ecology and Management 80(1-3):21-34.
Feng, H., O.D. Rubin, and B.A. Babcock. 2010. Greenhouse gas impacts of ethanol from Iowa corn: Life cycle assessment versus system wide approach. Biomass and Bioenergy 34(6):912-921.
Fight, R.D., and R.J. Barbour. 2005. Financial Analysis of Fuel Treatments. Portland, OR: U.S. Department of Agriculture - Forest Service - Pacific Northwest Research Station.
Fingerman, K.R., M.S. Torn, M.H. O’Hare, and D.M. Kammen. 2010. Accounting for the water impacts of ethanol production. Environmental Research Letters 5(1).
Finnveden, G., M.Z. Hauschild, T. Ekvall, J. Guinee, R. Heijungs, S. Hellweg, A. Koehler, D. Pennington, and S. Suh. 2009. Recent developments in life cycle assessment. Journal of Environmental Management 91(1):1-21.
Fischer, G., E. Hizsnyik, S. Prieler, M. Shah, and H. van Velthuizen. 2009. Biofuels and Food Security. Vienna: The OPEC Fund for International Development.
Flaspohler, D.J., R.E. Froese, and C.R. Webster. 2009. Bioenergy, biomass and biodiversity. Pp. 133-162 in Renewable Energy from Forest Resources in the United States, B.D. Solomon and V.A. Luzadis, eds. New York: Routledge.
Foley, J.A., R. DeFries, G.P. Asner, C. Barford, G. Bonan, S.R. Carpenter, F.S. Chapin, M.T. Coe, G.C. Daily, H.K. Gibbs, J.H. Helkowski, T. Holloway, E.A. Howard, C.J. Kucharik, C. Monfreda, J.A. Patz, I.C. Prentice, N. Ramankutty, and P.K. Snyder. 2005. Global consequences of land use. Science 309(5734):570-574.
Fornara, D.A., and D. Tilman. 2008. Plant functional composition influences rates of soil carbon and nitrogen accumulation. Journal of Ecology 96(2):314-322.
Fortier, J., D. Gagnon, B. Truax, and F. Lambert. 2010. Biomass and volume yield after 6 years in multiclonal hybrid poplar riparian buffer strips. Biomass and Bioenergy 34(7):1028-1040.
Foust, T., A. Aden, A. Dutta, and S. Phillips. 2009. An economic and environmental comparison of a biochemical and a thermochemical lignocellulosic ethanol conversion processes. Cellulose 16(4):547-565.
Frey, H.C., H. Zhai, and N.M. Rouphail. 2009. Regional on-road vehicle running emissions modeling and evaluation for conventional and alternative vehicle technologies. Environmental Science and Technology 43(21):8449-8455.
FSCUS (Forest Stewardship Council United States). 2010. The Forest Stewardship Council. Available online at http://www.fscus.org/. Accessed November 10, 2010.
Gallagher, M.E., W.C. Hockaday, C.A. Masiello, S. Snapp, C.P. McSwiney, and J.A. Baldock. 2011. Biochemical suitability of crop residues for cellulosic ethanol: Disincentives to nitrogen fertilization in corn agriculture. Environmental Science and Technology 45(5):2013-2020.
GAO (U.S. Government Accountability Office). 2009. Biofuels: Potential Effects and Challenges of Required Increases in Production and Use. Washington, DC: U.S. Government Accountability Office.
Gardiner, M.A., J.K. Tuell, R. Isaacs, J. Gibbs, J.S. Ascher, and D.A. Landis. 2010. Implications of three biofuel crops for beneficial arthropods in agricultural landscapes. BioEnergy Research 3(1):6-19.
Garten, C.T., J.L. Smith, D.D. Tyler, J.E. Amonette, V.L. Bailey, D.J. Brice, H.F. Castro, R.L. Graham, C.A. Gunderson, R.C. Izaurralde, P.M. Jardine, J.D. Jastrow, M.K. Kerley, R. Matamala, M.A. Mayes, F.B. Metting, R.M. Miller, K.K. Moran, W.M. Post, R.D. Sands, C.W. Schadt, J.R. Phillips, A.M. Thomson, T. Vugteveen, T.O. West, and S.D. Wullschleger. 2010. Intra-annual changes in biomass, carbon, and nitrogen dynamics at 4-year old switchgrass field trials in west Tennessee, USA. Agriculture Ecosystems and Environment 136(1-2):177-184.
GBEP (Global Bioenergy Partnership). 2010. Second draft of GBEP sustainability criteria and indicators for bioenergy. Available online at http://www.globalbioenergy.org/fileadmin/user_upload/gbep/docs/partners_only/sust_docs/2nd_DRAFT_of_GBEP_Criteria_Indicators_with_TEMPLATES.doc. Accessed November 15, 2010.
Gebber, R., and V.I. Adamchuk. 2010. Precision agriculture and food security. Science 327(5967):828-831.
Geist, H.J., and E.F. Lambin. 2002. Proximate causes and underlying driving forces of tropical deforestation. BioScience 52(2):143-150.
Gell, K., J.W. van Groenigen, and M.L. Cayuela. 2011. Residues of bioenergy production chains as soil amendments: Immediate and temporal phytotoxicity. Journal of Hazardous Materials 186(2-3):2017-2025.
George, N., Y. Yang, Z. Wang, R. Sharma-Shivappa, and K. Tungate. 2010. Suitability of canola residue for cellulosic ethanol production. Energy and Fuels 24(8):4454-4458.
Georgescu, M., D.B. Lobell, and C.B. Field. 2011. Direct climate effects of perennial bioenergy crops in the United States. Proceedings of the National Academy of Sciences of the United States of America 108(11):4307-4312.
Gibbs, H.K., M. Johnston, J.A. Foley, T. Holloway, C. Monfreda, N. Ramankutty, and D. Zaks. 2008. Carbon payback times for crop-based biofuel expansion in the tropics: The effects of changing yield and technology. Environmental Research Letters 3(3):034001.
Gilliom, R.J., J.E. Barbash, C.G. Crawford, P.A. Hamilton, J.D. Martin, N. Nakagaki, L.H. Nowell, J.C. Scott, P.E. Stackelberg, G.P. Thelin, and D.M. Wolock. 2007. Pesticides in the Nation’s Streams and Ground Water, 1992-2001. Reston, VA: U.S. Geological Survey.
Ginnebaugh, D.L., J.Y. Liang, and M.Z. Jacobson. 2010. Examining the temperature dependence of ethanol (E85) versus gasoline emissions on air pollution with a largely-explicit chemical mechanism. Atmospheric Environment 44(9):1192-1199.
Gollany, H.T., R.W. Rickman, Y. Liang, S.L. Albrecht, S. Machado, and S. Kang. 2011. Predicting agricultural management influence on long-term soil organic carbon dynamics: Implications for biofuel production. Agronomy Journal 103(1):234-246.
Graham, L.A., S.L. Belisle, and C.L. Baas. 2008. Emissions from light duty gasoline vehicles operating on low blend ethanol gasoline and E85. Atmospheric Environment 42(19):4498-4516.
Guo, L.B., and R.M. Gifford. 2002. Soil carbon stocks and land use change: A meta analysis. Global Change Biology 8(4):345-360.
Guzman, J.G., and M. Al-Kaisi. 2010. Landscape position and age of reconstructed prairies effect on soil organic carbon sequestration rate and aggregate associated carbon. Journal of Soil and Water Conservation 65(1):9-21.
Hammerschlag, R. 2006. Ethanol’s energy return on investment: A survey of the literature 1990 - Present. Environmental Science and Technology 40(6):1744-1750.
Harto, C., R. Meyers, and E. Williams. 2010. Life cycle water use of low-carbon transport fuels. Energy Policy 38:4933-4944.
Heaton, E., T. Voigt, and S.P. Long. 2004. A quantitative review comparing the yields of two candidate C4 perennial biomass crops in relation to nitrogen, temperature and water. Biomass and Bioenergy 27(1):21-30.
Hecht, A., D. Shaw, R. Bruins, V. Dale, K. Kline, and A. Chen. 2009. Good policy follows good science: Using criteria and indicators for assessing sustainable biofuel production. Ecotoxicology 18(1):1-4.
Heltman, J., and E. Martinson. 2011. States grapple with new EPA push to adopt strict numeric nutrient limits. Water Policy Report (April 11). Available online at https://environmentalnewsstand.com/Water-Policy-Report/Water-Policy-Report-04/11/2011/menu-id-304.html. Accessed April 18, 2011.
Hertel, T.W., A.A. Golub, A.D. Jones, M. O’Hare, R.J. Plevin, and D.M. Kammen. 2010. Effects of US maize ethanol on global land use and greenhouse gas emissions: Estimating market-mediated responses. BioScience 60(3):223-231.
Hess, P., M. Johnston, B. Brown-Steiner, T. Holloway, J.B. de Andrade, and P. Artaxo. 2009. Air quality issues associated with biofuel production and use. Pp. 169-194 in Biofuels: Environmental Consequences and Interactions with Changing Land Use, R.W. Howarth and S. Bringezu, eds. Ithaca, NY: Cornell University.
Hettinga, W.G., H.M. Junginger, S.C. Dekker, M. Hoogwijk, A.J. McAloon, and K.B. Hicks. 2009. Understanding the reductions in US corn ethanol production costs: An experience curve approach. Energy Policy 37(1):190-203.
Hewitt, C.N., A.R. MacKenzie, P. Di Carlo, C.F. Di Marco, J.R. Dorsey, M. Evans, D. Fowler, M.W. Gallagher, J.R. Hopkins, C.E. Jones, B. Langford, J.D. Lee, A.C. Lewis, S.F. Lim, J. McQuaid, P. Misztal, S.J. Moller, P.S. Monks, E. Nemitz, D.E. Oram, S.M. Owen, G.J. Phillips, T.A.M. Pugh, J.A. Pyle, C.E. Reeves, J. Ryder, J. Siong, U. Skiba, and D.J. Stewart. 2009. Nitrogen management is essential to prevent tropical oil palm plantations from causing ground-level ozone pollution. Proceedings of the National Academy of Sciences of the United States of America 106(44):18447-18451.
Hill, J., E. Nelson, D. Tilman, S. Polasky, and D. Tiffany. 2006. Environmental, economic, and energetic costs and benefits of biodiesel and ethanol biofuels. Proceedings of the National Academy of Sciences of the United States of America 103(30):11206-11210.
Hill, J., S. Polasky, E. Nelson, D. Tilman, H. Huo, L. Ludwig, J. Neumann, H.C. Zheng, and D. Bonta. 2009. Climate change and health costs of air emissions from biofuels and gasoline. Proceedings of the National Academy of Sciences of the United States of America 106(6):2077-2082.
Hochman, G., D. Rajagopal, and D. Zilberman. 2010. The effect of biofuels on crude oil markets. AgBioForum 13(2):112-118.
Hoefnagels, R., E. Smeets, and A. Faaij. 2010. Greenhouse gas footprints of different biofuel production systems. Renewable and Sustainable Energy Reviews 14(7):1661-1694.
Houghton, R.A. 2010. How well do we know the flux of CO2 from land-use change? Tellus B 62(5):337-351.
Hsu, D.D., D. Inman, G.A. Heath, E.J. Wolfrum, M.K. Mann, and A. Aden. 2010. Life cycle environmental impacts of selected U.S. ethanol production and use pathways in 2022. Environmental Science and Technology 44(13):5289-5297.
Huffaker, R. 2010. Protecting water resources in biofuels production. Water Policy 12:129-134.
Huggins, D.R., R.S. Karow, H.P. Collins, and J.K. Ransom. 2011. Introduction: Evaluating long-term impacts of harvesting crop residues on soil quality. Agronomy Journal 103(1):230-233.
Huo, H., M. Wang, C. Bloyd, and V. Putsche. 2009. Life-cycle assessment of energy use and greenhouse gas emissions of soybean-derived biodiesel and renewable fuels. Environmental Science and Technology 43(3):750-756.
Hutchinson, K.J. 2008. Human impacted water environment classes. M.S. thesis, University of Iowa, Iowa City.
Ice, G.G., E.G. Schilling, and J.G. Vowel. 2010. Trends for forestry best management practices implementation. Journal of Forestry 108(6):267-273.
ISO (International Organization for Standardization). 2006. Environmental Management—Life Cycle Assessment—Principles and Framework. Geneva: International Organization for Standardization.
Izaurralde, R.C., J.R. Williams, W.B. McGill, N.J. Rosenberg, and M.C.Q. Jakas. 2006. Simulating soil C dynamics with EPIC: Model description and testing against long-term data. Ecological Modelling 192(3-4):362-384.
Jackson, R.B., E.G. Jobbagy, R. Avissar, S.B. Roy, D.J. Barrett, C.W. Cook, K.A. Farley, D.C. le Maitre, B.A. McCarl, and B.C. Murray. 2005. Trading water for carbon with biological sequestration. Science 310(5756):1944-1947.
Jacobson, M.Z. 2007. Effects of ethanol (E85) versus gasoline vehicles on cancer and mortality in the United States. Environmental Science and Technology 41(11):4150-4157.
Janowiak, M.K., and C.R. Webster. 2010. Promoting ecological sustainability in woody biomass harvesting. Journal of Forestry 108(1):16-23.
Jenkins, T.L., and J.W. Sutherland. 2009. An integrated supply system for forest biomass. Pp. 92-115 in Renewable Energy from Forest Resources in the United States, B.D. Solomon and V.A. Luzadis, eds. New York: Routledge.
Johnson, G., C. Sheaffer, H.J. Jung, U. Tschirmer, S. Banerjee, K. Petersen, and D.L. Wyse. 2008. Landscape and species diversity: Optimizing the use of land and species for biofuel feedstock production systems. Paper read at the Agronomy Society of America, Crop Science Society of America, and Soil Science Society of America Annual Meeting October 5-9, Houston, TX.
Johnson, J.M.F., A.J. Franzluebbers, S.L. Weyers, and D.C. Reicosky. 2007. Agricultural opportunities to mitigate greenhouse gas emissions. Environmental Pollution 150(1):107-124.
Johnson, K., F.N. Scatena, and Y.D. Pan. 2010. Short- and long-term responses of total soil organic carbon to harvesting in a northern hardwood forest. Forest Ecology and Management 259(7):1262-1267.
Jones, D.L. 2010. Potential air emission impacts of cellulosic ethanol production at seven demonstration refineries in the United States. Journal of the Air and Waste Management Association 60(9):1118-1143.
Jordaan, S.M., D.W. Keith, and B. Stelfox. 2009. Quantifying land use of oil sands production: A life cycle perspective. Environmental Research Letters 4(2):024004.
Kalies, E.L., C.L. Chambers, and W.W. Covington. 2010. Wildlife responses to thinning and burning treatments in southwestern conifer forests: A meta-analysis. Forest Ecology and Management 259(3):333-342.
Kaliyan, N., R.V. Morey, and D.G. Tiffany. 2011. Reducing life cycle greenhouse gas emissions of corn ethanol by integrating biomass to produce heat and power at ethanol plants. Biomass and Bioenergy 35(3):1103-1113.
Kalogo, Y., S. Habibi, H.L. MacLean, and S.V. Joshi. 2006. Environmental implications of municipal solid waste-derived ethanol. Environmental Science and Technology 41(1):35-41.
Karlen, D.L. 2010. A landscape vision for integrating industrial crops into biofuel systems. Paper read at the Association for the Advancement of Industrial Crops Conference September 22, Fort Collins, CO.
Karlen, D.L., R. Lal, R.F. Follett, J.M. Kimble, J.L. Hatfield, J.M. Miranowski, C.A. Cambardella, A. Manale, R.P. Anex, and C.W. Rice. 2010. Crop residues: The rest of the story. Environmental Science and Technology 43(21):8011-8015.
Kendall, A., B. Chang, and B. Sharpe. 2009. Accounting for time-dependent effects in biofuel life cycle greenhouse gas emissions calculations. Environmental Science and Technology 43(18):7142-7147.
Khanal, S.K., M. Rasmussen, P. Shrestha, H. Van Leeuwen, C. Visvanathan, and H. Liu. 2008. Bioenergy and biofuel production from wastes/residues of emerging biofuel industries. Water Environment Research 80(10):1625-1647.
Khanna, M., B. Dhungana, and J. Clifton-Brown. 2008. Costs of producing Miscanthus and switchgrass for bioenergy in Illinois. Biomass and Bioenergy 32(6):482-493.
Khanna, M., H. Önal, B. Dhungana, and M. Wander. 2010. Economics of herbaceous bioenergy crops for electricity generation: Implications for greenhouse gas mitigation. Biomass and Bioenergy 35(4):1474-1484.
Kim, S., and B.E. Dale. 2011. Indirect land use change for biofuels: Testing predictions and improving analytical methodologies. Biomass and Bioenergy 35(7):3235-3240.
King, C.W., and M.E. Webber. 2008. Water intensity of transportation. Environmental Science and Technology 42(21):7866-7872.
Kitchen, N.R., K.A. Sudduth, D.B. Myers, R.E. Massey, E.J. Sadler, and R.N. Lerch. 2005. Development of a conservation-oriented precision agriculture system: Crop production assessment and plan of implementation. Journal of Soil and Water Conservation 60:421-430.
Kløverpris, J., H. Wenzel, and P. Nielsen. 2008. Life cycle inventory modelling of land use induced by crop consumption. The International Journal of Life Cycle Assessment 13(1):13-21.
Kravchenko, A.N., and G.P. Robertson. 2011. Whole-profile soil carbon stocks: The danger of assuming too much from analyses of too little. Soil Science Society of America Journal 75(1):235-240.
Kretschmer, B., and S. Peterson. 2010. Integrating bioenergy into computable general equilibrium models—A survey. Energy Economics 32(3):673-686.
Kusiima, J.M., and S.E. Powers. 2010. Monetary value of the environmental and health externalities associated with production of ethanol from biomass feedstocks. Energy Policy 38(6):2785-2796.
Lal, R. 2004. Soil carbon sequestration impacts on global climate change and food security. Science 304:1623-1627.
Lal, R., F. Follett, B.A. Stewart, and J.M. Kimble. 2007. Soil carbon sequestration to mitigate climate change and advance food security. Soil Science Society of America Journal 172:943-956.
Lamb, D.W., P. Frazier, and P. Adams. 2008. Improving pathways to adoption: Putting the right P’s in precision agriculture. Computers and Electronics in Agriculture 61(1):4-9.
Lamm, F.R., H.L. Manges, L.R. Stone, A.H. Khan, and D.H. Rogers. 1995. Water requirement of subsurface drip-irrigated corn in Northwest Kansas. Transactions of the American Society of Agricultural and Biological Engineers 38(2):441-448.
Landis, D.A., and B.P. Werling. 2010. Arthropods and biofuel production systems in North America. Insect Science 17(3):220-236.
Landis, D.A., M.M. Gardiner, W. van der Werf, and S.M. Swinton. 2008. Increasing corn for biofuel production reduces biocontrol services in agricultural landscapes. Proceedings of the National Academy of Sciences of the United States of America 105(51):20552-20557.
Lee, J.W., M. Kidder, B.R. Evans, S. Paik, A.C. Buchanan, C.T. Garten, and R.C. Brown. 2010. Characterization of biochars produced from cornstovers for soil amendment. Environmental Science and Technology 44(20):7970-7974.
Lemoine, D.M., R.J. Plevin, A.S. Cohn, A.D. Jones, A.R. Brandt, S.E. Vergara, and D.M. Kammen. 2010. The climate impacts of bioenergy systems depend on market and regulatory policy contexts. Environmental Science and Technology 44(19):7374-7350.
Lerch, R.N., R.J. Kitchen, W.W. Kremer, E.E. Donald, E.J. Alberts, K.A. Saddler, D.B. Sudduth, D.B. Meyers, and F. Ghidey. 2005. Development of a conservation-oriented precision agriculture system: Water and soil quality. Journal of Soil and Water Conservation 60:411-421.
Levasseur, A., P. Lesage, M. Margni, L. Desche.nes, and R.J. Samson. 2010. Considering time in LCA: Dynamic LCA and its application to global warming impact assessments. Environmental Science and Technology 44(8):3169-3174.
Lewandowski, I., J.M.O. Scurlock, E. Lindvall, and M. Christou. 2003. The development and current status of perennial rhizomatous grasses as energy crops in the US and Europe. Biomass and Bioenergy 25(4):335-361.
Leytem, A.B., P. Kwanyuen, and P. Thacker. 2008. Nutrient excretion, phosphorus characterization, and phosphorus solubility in excreta from broiler chicks fed diets containing graded levels of wheat distillers grains with solubles. Poultry Science 87(12):2505-2511.
Liebig, M.A., M.R. Schmer, K.P. Vogel, and R.B. Mitchell. 2008. Soil carbon storage by switchgrass grown for bioenergy. BioEnergy Research 1(3-4):215-222.
Liska, A.J., and K.G. Cassman. 2009a. Response to Plevin implications for life cycle emissions regulations. Journal of Industrial Ecology 13(4):508-513.
Liska, A.J., and K.G. Cassman. 2009b. Responses to “Comment on ‘Response to Plevin: Implications for life cycle emissions regulations’” and “Assessing corn ethanol: relevance and responsibility.” Journal of Industrial Ecology 13(6):994-995.
Liska, A.J., H.S. Yang, V.R. Bremer, T.J. Klopfenstein, D.T. Walters, G.E. Erickson, and K.G. Cassman. 2009. Improvements in life cycle energy efficiency and greenhouse gas emissions of corn-ethanol. Journal of Industrial Ecology 13(1):58-74.
Liu, Y., M.A. Evans, and D. Scavia. 2010. Gulf of Mexico hypoxia: Exploring increasing sensitivity to nitrogen loads. Environmental Science and Technology 44(15):5836-5841.
Lu, X.L., and Q.L. Zhuang. 2010. Evaluating climate impacts on carbon balance of the terrestrial ecosystems in the Midwest of the United States with a process-based ecosystem model. Mitigation and Adaptation Strategies for Global Change 15(5):467-487.
Luo, Z., E. Wang, and O.J. Sun. 2010. Can no-tillage stimulate carbon sequestration in agricultural soils? A meta-analysis of paired experiments. Agriculture, Ecosystems and Environment 139:224-231.
Machado, S. 2011. Soil organic carbon dynamics in the Pendleton long-term experiments: Implications for biofuel production in Pacific Northwest. Agronomy Journal 103(1):253-260.
Malcolm, S., and M. Aillery. 2009. Growing crops for biofuels has spillover effects. Amber Waves 7(1):10-15.
Marshall, L. 2009. Biofuels and the Time Value of Carbon: Recommendations for GHG Accounting Protocols. Washington, DC: World Resources Institute.
McCormick, R.L. 2007. The impact of biodiesel on pollutant emissions and public health. Inhalation Toxicology 19(12):1033-1039.
McKechnie, J., S. Colombo, J. Chen, W. Mabee, and H.L. MacLean. 2010. Forest bioenergy or forest carbon? Assessing trade-offs in greenhouse gas mitigation with wood-based fuels. Environmental Science and Technology 45(2):789-795.
McKone, T.E., W.W. Nazaroff, P. Berck, M. Auffhammer, T. Lipman, M.S. Torn, E. Masanet, A. Lobscheid, A. Santero, U. Mishra, A. Barrett, M. Bomberg, K. Fingerman, C. Scown, B. Strogen, and A. Horvath. 2011. Grand challenges for life-cycle assessment of biofuels. Environmental Science and Technology 45(5):1751-1756.
McSwiney, C.P., and G.P. Roberstson. 2005. Nonlinear response of N2O flux to incremental fertilizer addition in a continuous maize (Zea mays L.) cropping system. Global Change Biology 11:1712-1719.
Meehan, T.D., A.H. Hurlbert, and C. Gratton. 2010. Bird communities in future bioenergy landscapes of the Upper Midwest. Proceedings of the National Academy of Sciences of the United States of America 107(43):18533-18538.
Mehta, R.N., M. Chakraborty, P. Mahanta, and P.A. Parikh. 2010. Evaluation of fuel properties of butanol-biodiesel-diesel blends and their impact on engine performance and emissions. Industrial and Engineering Chemistry Research 49(16):7660-7665.
Melamu, R., and H. von Blottnitz. 2011. 2nd generation biofuels a sure bet? A life cycle assessment of how things could go wrong. Journal of Cleaner Production 19(2-3):138-144.
Melillo, J.M., J.M. Reilly, D.W. Kicklighter, A.C. Gurgel, T.W. Cronin, S. Paltsev, B.S. Felzer, X.D. Wang, A.P. Sokolov, and C.A. Schlosser. 2009. Indirect emissions from biofuels: How important? Science 326(5958):1397-1399.
Meyfroidt, P., T.K. Kudel, and E.F. Lambin. 2010. Forest transitions, trade, and the global displacement of land use. Proceedings of the National Academy of Sciences of the United States of America 107(49):20917-20922.
Millar, N., G.P. Robertson, P.R. Grace, R.J. Gehl, and J.P. Hoben. 2010. Nitrogen fertilizer management for nitrous oxide (N2O) mitigation in intensive corn (Maize) production: An emissions reduction protocol for US Midwest agriculture. Mitigation and Adaptation Strategies for Global Change 15(2):185-204.
Millennium Ecosystem Assessment. 2005. Ecosystems and Human Well Being: Synthesis. Washington, DC: World Resources Institute.
Miller, S.A. 2010. Minimizing land use and nitrogen intensity of bioenergy. Environmental Science and Technology 44(10):3932-3939.
Monsanto. 2008. Monsanto will undertake three-point commitment to double yield in three major crops, make more efficient use of natural resources and improve farmer lives. Available online at http://monsanto.mediaroom.com/index.php?s=43&item=607. Accessed April 13, 2011.
Morais, S., A.A. Martins, and T.M. Mata. 2010. Comparison of allocation approaches in soybean biodiesel life cycle assessment. Journal of the Energy Institute 83:48-55.
Morgan, J.A., R.F. Follett, L.H. Allen, S. del Grosso, J.D. Derner, F. Dijkstra, A. Franzluebbers, R. Fry, K. Paustian, and M.M. Schoeneberger. 2010. Carbon sequestration in agricultural lands of the United States. Journal of Soil and Water Conservation 65(2):6A-13A.
Mubako, S., and C. Lant. 2008. Water resource requirements of corn-based ethanol. Water Resources Research 44(7):W00A02.
Mueller, S. 2010. Detailed Report: 2008 National Dry Mill Corn Ethanol Survey. Chicago: University of Illinois.
Mullins, K.A., W.M. Griffin, and H.S. Matthews. 2010. Policy implications of uncertainty in modeled life-cycle greenhouse gas emissions of biofuels. Environmental Science and Technology 45(1):132-138.
Murray, B.C., B.L. Sohngen, A.J. Sommer, B.M. Depro, K.M. Jones, B.A. McCarl, D. Gillig, B. DeAngelo, and K. Andrasko. 2005. Greenhouse Gas Mitigation Potential in U.S. Forestry and Agriculture. Washington, DC: U.S. Environmental Protection Agency.
Murray, B.C., B. Sohngen, and M.T. Ross. 2007. Economic consequences of consideration of permanence, leakage and additionality for soil carbon sequestration projects. Climatic Change 80(1-2):127-143.
Murray, L., and L. Best. 2010. Bird use of switchgrass fields harvested for bioenergy in the Midwestern U.S. Paper read at the Reshaping Landscapes: Bioenergy and Biodiversity, April 8, Athens, GA.
NAS-NAE-NRC (National Academy of Sciences, National Academy of Engineering, National Research Council). 2009. Liquid Transportation Fuels from Coal and Biomass: Technological Status, Costs, and Environmental Impacts. Washington, DC: National Academies Press.
NCGA (National Corn Growers Association). 2010. Corn production trends. Available online at http://www.ncga.com/corn-production-trends. Accessed September 10, 2010.
Nebraska Corn Board. 2011. Advantage: Nebraska. Available online at http://www.nebraskacorn.org/main-navigation/grain-traders/advantage-nebraska/. Accessed February 11, 2011.
Nelson, N.O., S.C. Agudelo, W.Q. Yuan, and J. Gan. 2011. Nitrogen and phosphorus availability in biochar-amended soils. Soil Science 176(5):218-226.
Nelson, R., M. Langemeier, J. Williams, C. Rice, S. Staggenborg, P. Pfomm, D. Rodgers, D. Wang, and J. Nippert. 2010. Kansas Biomass Resource Assessment: Assessment and Supply of Select Biomass-based Resources. Manhattan: Kansas State University.
Nelson, R.G., J.C. Ascough II, and M.R. Langemeier. 2006. Environmental and economic analysis of switchgrass production for water quality improvement in northeast Kansas. Journal of Environmental Management 79(4):336-347.
Newman, J.K., A.L. Kaleita, and J.M. Laflen. 2010. Soil erosion hazard maps for corn stover management using national resources inventory data and the water erosion prediction project. Journal of Soil and Water Conservation 65(4):211-222.
Ng, T.L., J.W. Eheart, X.M. Cai, and F. Miguez. 2010. Modeling Miscanthus in the Soil and Water Assessment Tool (SWAT) to simulate its water quality effects as a bioenergy crop. Environmental Science and Technology 44(18):7138-7144.
Niemi, G.J., and M.E. McDonald. 2004. Application of ecological indicators. Annual Review of Ecology Evolution and Systematics 35:89-111.
Nolan, B.T., K.J. Hitt, and B.C. Ruddy. 2002. Probability of nitrate contamination of recently recharged groundwaters in the conterminous United States. Environmental Science and Technology 36(10):2138-2145.
NRC (National Research Council). 1999. Ozone-Forming Potential of Reformulated Gasoline. Washington, DC: National Academy Press.
NRC (National Research Council). 2003. Cumulative Environmental Effects of Oil and Gas Activities on Alaska’s North Slope. Washington, DC: National Academies Press.
NRC (National Research Council). 2008. Water Implications of Biofuels Production in the United States; Committee on Water Implications of Biofuels Production in the United States, National Research Council. Washington, DC: National Academies Press.
NRC (National Research Council). 2010a. Hidden Costs of Energy: Unpriced Consequences of Energy Production and Use. Washington, DC: National Academies Press.
NRC (National Research Council). 2010b. Toward Sustainable Agricultural Systems in the 21st Century. Washington, DC: National Academies Press.
NRC (National Research Council). 2010c. Verifying Greenhouse Gas Emissions: Methods to Support International Climate Agreements. Washington, DC: National Academies Press.
O’Hare, M., R.J. Plevin, J.I. Martin, A.D. Jones, A. Kendall, and E. Hopson. 2009. Proper accounting for time increases crop-based biofuels’ greenhouse gas deficit versus petroleum. Environmental Research Letters 4(2009):024001.
O’Hare, M., M. Delucchi, R. Edwards, U. Fritsche, H. Gibbs, T. Hertel, J. Hill, D. Kammen, L. Marelli, D. Mulligan, R. Plevin, and W. Tyner. 2011. Comment on “Indirect land use change for biofuels: Testing predictions and improving analytical methodologies” by Kim and Dale: Statistical reliability and the definition of the indirect land use change (iLUC) issue. Biomass and Bioenergy 35(10):4485-4487.
Odum, E.P. 1969. The strategy of ecosystem development. Science 164(3877):262-270.
Ogle, S.M., F.J. Breidt, M. Easter, S. Williams, and K. Paustian. 2007. An empirically based approach for estimating uncertainty associated with modelling carbon sequestration in soils. Ecological Modelling 205(3-4):453-463.
Ohlrogge, J., D. Allen, B. Berguson, D. DellaPenna, Y. Shachar-Hill, and S. Stymne. 2009. Driving on biomass. Science 324(5930):1019-1020.
Omonode, R.A., D.R. Smith, A. Gál, and T.J. Vyn. 2011. Soil nitrous oxide emissions in corn following three decades of tillage and rotation treatments. Soil Science Society of America Journal 75(1):152-163.
Osterman, L.E., R.Z. Poore, P.W. Swarzenski, and R.E. Turner. 2005. Reconstructing a 180 yr record of natural and anthropogenic induced hypoxia from the sediments of the Louisiana continental shelf. Geology 33(4):329-332.
Overmars, K.P., E. Stehfest, J.P.M. Ros, and A.G. Prins. 2011. Indirect land use change emissions related to EU biofuel consumption: An analysis based on historical data. Environmental Science and Policy 14(3):248-257.
Pang, S.-H., H.C. Frey, and W.J. Rasdorf. 2009. Life cycle inventory energy consumption and emissions for biodiesel versus petroleum diesel fueled construction vehicles. Environmental Science and Technology 43(16):6398-6405.
Parker, N., Q. Hart, P. Tittman, M. Murphy, R. Nelson, K. Skog, E. Gray, A. Schmidt, and B. Jenkins. 2010. National Biorefinery Siting Model: Spatial Analysis and Supply Curve Development. Washington, DC: Western Governors Association.
Parkin, G., P. Weyer, and C. Just. 2007. Riding the bioeconomy wave: Smooth sailing or rough water for the environment and public health. Paper read at the Iowa Water Conference - Water and Bioenergy, March 6, Ames, IA.
Parrish, D.J., and J.H. Fike. 2005. The biology and agronomy of switchgrass for biofuels. Critical Reviews in Plant Sciences 24:423-459.
Pate, R., M. Hightower, C. Cameron, and W. Einfeld. 2007. Overview of Energy-Water Interdependencies and the Emerging Energy Demands on Water Resources. Los Alamos, NM: Sandia National Laboratories.
Paustian, K., E.T. Elliott, and K. Killian. 1997. Modeling soil carbon in relation to management and climate change in some agroecosystems in central North America. Pp. 459-471 in Soil Processes and the Carbon Cycle, R. Lal, J.M. Kimble, R.F. Follett, and B.A. Stewart, eds. Boca Raton, FL: CRC Press.
Perlack, R.D., L.L. Wright, A.F. Turhollow, R.L. Graham, B.J. Stokes, and D.C. Erbach. 2005. Biomass as Feedstock for a Bioenergy and Bioproducts Industry: The Technical Feasibility of a Billion-Ton Annual Supply. Oak Ridge, TN: U.S. Department of Energy, U.S. Department of Agriculture.
Persson, T., A.G.Y. Garcia, J.O. Paz, C.W. Fraisse, and G. Hoogenboom. 2010. Reduction in greenhouse gas emissions due to the use of bio-ethanol from wheat grain and straw produced in the south-eastern USA. The Journal of Agricultural Science 148(05):511-527.
Phillips, S., A. Aden, J. Jechura, D. Dayton, and T. Eggeman. 2007. Thermochemical Ethanol via Indirect Gasification and Mixed Alcohol Synthesis of Lignocellulosic Biomass. Golden, CO: National Renewable Energy Laboratory.
Plevin, R. 2009a. Comment on “Response to Plevin: Implications for life cycle emissions regulations.” Journal of Industrial Ecology 13(6):992-993.
Plevin, R.J. 2009b. Modeling corn ethanol and climate. Journal of Industrial Ecology 13(4):495-507.
Plevin, R.J., M. O’Hare, A.D. Jones, M.S. Torn, and H.K. Gibbs. 2010. Greenhouse gas emissions from biofuels’ indirect land use change are uncertain but may be much greater than previously estimated. Environmental Science and Technology 44(21):8015-8021.
Powers, S.E., R. Dominguez-Faus, and P.J.J. Alvarez. 2010. The water footprint of biofuel production in the USA. Biofuels 1(2):255-260.
Pradhan, A., D.S. Shrestha, J. Van Gerpen, and J. Duffield. 2008. The energy balance of soybean oil biodiesel production: A review of past studies. Transactions of the American Society of Agricultural and Biological Engineers 51(1):185-194.
Quinn, L.D., D.J. Allen, and J.R. Stewart. 2010. Invasiveness potential of Miscanthus sinensis: Implications for bioenergy production in the United States. Global Change Biology Bioenergy 2(6):310-320.
Rabalais, N.N., and R.E. Turner. 2001. Coastal hypoxia: Consequences for living resources and ecosystems. Pp. 1-36 in Coastal and Estuarine Studies, N.N. Rabalais and R.E. Turner, eds. Washington, DC: American Geophysical Union.
Rabalais, N.N., R.E. Turner, and W.J. Wiseman. 2002. Gulf of Mexico hypoxia, aka “The dead zone.” Annual Review of Ecology and Systematics 33:235-263.
Rabotyagov, S., T. Campbell, M. Jha, P.W. Gassman, J. Arnold, L. Kurkalova, S. Secchi, H.L. Feng, and C.L. Kling. 2010. Least-cost control of agricultural nutrient contributions to the Gulf of Mexico hypoxic zone. Ecological Applications 20(6):1542-1555.
Raghu, S., R.C. Anderson, C.C. Daehler, A.S. Davis, R.N. Wiedenmann, D. Simberloff, and R.N. Mack. 2006. Adding biofuels to the invasive species fire? Science 313(5794):1742.
Randall, J.M., L.E. Morse, N. Benton, R. Hiebert, S. Lu, and T. Killeffer. 2008. The invasive species assessment protocol: A tool for creating regional and national lists of invasive nonnative plants that negatively impact biodiversity. Invasive Plant Science and Management 1(1):36-49.
Rausch, K.D., and R.L. Belyea. 2006. The future of coproducts from corn processing. Applied Biochemistry and Biotechnology 128(1):47-86.
Ravindranath, N.H., R. Mauvie, J. Fargione, J.G. Canadell, G. Berndes, J. Woods, H. Watson, and J. Sathaye. 2009. Greenhouse gas implications of land use change and land conversion to biofuel crops. Pp. 111-125 in Biofuels: Environmental Consequences and Interactions with Changing Land Use, R.W. Howarth and S. Bringezu, eds. Ithaca, NY: Cornell University.
Reitz, S.R., G.S. Kund, W.G. Carson, P.A. Phillips, and J.T. Trumble. 1999. Economics of reducing insecticide use on celery through low-input pest management strategies. Agriculture Ecosystems and Environment 73(3):185-197.
RFA (Renewable Fuels Association). 2011. Biorefinery locations. Available online at http://www.ethanolrfa.org/bio-refinery-locations/. Accessed January 26, 2011.
Riffell, S., J. Verschuyl, D. Miller, and T.B. Wigley. 2010. Reshaping landscapes: Bioenergy and biodiversity. Paper read at Reshaping Landscapes: Bioenergy and Biodiversity, April 8, Athens, GA.
Robert, P.C. 2002. Precision agriculture: A challenge for crop nutrition management. Plant and Soil 247(1):143-149.
Roberts, K.G., B.A. Gloy, S. Joseph, N.R. Scott, and J. Lehmann. 2010. Life cycle assessment of biochar systems: Estimating the energetic, economic, and climate change potential. Environmental Science and Technology 44(2):827-833.
Robertson, B.A., P.J. Doran, L.R. Loomis, J.R. Robertson, and D.W. Schemske. 2011a. Perennial biomass feedstocks enhance avian diversity. GCB Bioenergy 3(3):235-246.
Robertson, G.P., V.H. Dale, O.C. Doering, S.P. Hamburg, J.M. Melillo, M.M. Wander, W.J. Parton, P.R. Adler, J.N. Barney, R.M. Cruse, C.S. Duke, P.M. Fearnside, R.F. Follett, H.K. Gibbs, J. Goldemberg, D.J. Mladenoff, D. Ojima, M.W. Palmer, A. Sharpley, L. Wallace, K.C. Weathers, J.A. Wiens, and W.W. Wilhelm. 2008. Sustainable biofuels redux. Science 322(5898):49-50.
Robertson, G.P., S.K. Hamilton, W.J. Parton, and S.J.D. Grosso. 2011b. The biogeochemistry of bioenergy landscapes: Carbon, nitrogen, and water considerations. Ecological Applications 21(4):1055-1067.
Robins, J.G. 2010. Cool-season grasses produce more total biomass across the growing season than do warm-season grasses when managed with an applied irrigation gradient. Biomass and Bioenergy 34(4):500-505.
Roth, A.M., D.W. Sample, C.A. Ribic, L. Paine, D.J. Undersander, and G.A. Bartelt. 2005. Grassland bird response to harvesting switchgrass as a biomass energy crop. Biomass & Bioenergy 28(5):490-498.
RSB (Roundtable on Sustainable Biofuels). 2010. Principles and Criteria. Available online at http://rsb.epfl.ch/page-24929.html. Accessed November 15, 2010.
Sage, R.F., H.A. Coiner, D.A. Way, G. Brett Runion, S.A. Prior, H. Allen Torbert, R. Sicher, and L. Ziska. 2009. Kudzu [Pueraria montana (Lour.) Merr. Variety lobata]: A new source of carbohydrate for bioethanol production. Biomass and Bioenergy 33(1):57-61.
Sahu, M., and R.R. Gu. 2009. Modeling the effects of riparian buffer zone and contour strips on stream water quality. Ecological Engineering 35(8):1167-1177.
Scavia, D., and Y. Liu. 2009. Gulf of Mexico hypoxia forecast and measurement. Available online at http://www.snre.umich.edu/scavia/wp-content/uploads/2009/11/2009_gulf_of_mexico_hypoxic_forecast_and_observation.pdf. Accessed August 17, 2010.
Scavia, D., N.N. Rabalais, R.E. Turner, D. Justic, and W.J. Wiseman, Jr. 2003. Predicting the response of Gulf of Mexico hypoxia to variations in the Mississippi River nitrogen load. Limnology and Oceanography 48:951-956.
Schill, S.R. 2007. 300-bushel corn is coming. Available online at http://www.ethanolproducer.com/articles/3330/300-bushel-corn-is-coming/. Accessed April 13, 2011.
Schilling, E. 2009. Compendium of Forestry Best Management Practices for Controlling Nonpoint Source Pollution in North America. Research Triangle Park, NC: National Council for Air and Stream Improvement.
Schilling, K.E., and J. Spooner. 2006. Effects of watershed-scale land use change on stream nitrate concentrations. Journal of Environmental Quality 35(6):2132-2145.
Schilling, K.E., and C.F. Wolter. 2008. Water Quality Improvement Plan for Raccoon River, Iowa: Total Maximum Daily Load for Nitrate and Escherichia coli. Iowa City: Iowa Department of Natural Resources - Geological Survey.
Schmit, T.M., R.N. Boisvert, D. Enahoro, and L.E. Chase. 2009. Optimal dairy farm adjustments to increased utilization of corn distillers dried grains with solubles. Journal of Dairy Science 92(12):6105-6115.
Schnepf, R. 2004. Energy Use in Agriculture: Background and Issues. Washington, DC: Congressional Research Service.
Schweizer, P., H. Jager, and L. Baskaran. 2010. Forecasting changes in water quality and aquatic biodiversity in response to future bioenergy landscapes in the Arkansas-White-Red River basin. Paper read at Reshaping Landscapes: Bioenergy and Biodiversity, April 8, Athens, GA.
Searchinger, T., R. Heimlich, R.A. Houghton, F. Dong, A. Elobeid, J. Fabiosa, S. Tokgoz, D. Hayes, and T.-H. Yu. 2008. Use of U.S. croplands for biofuels increases greenhouse gases through emissions from land-use change. Science 319(5867):1238-1240.
Searchinger, T.D. 2010. Biofuels and the need for additional carbon. Environmental Research Letters 5(2).
Secchi, S., P. Gassman, M. Jha, L. Kurkalova, and C. Kling. 2011. Potential water quality changes due to corn expansion in the Upper Mississippi River Basin. Ecological Applications 21:1068-1084.
SFI (Sustainable Forestry Initiative). 2010. Emerging themes: Bioenergy and carbon. Available online at http://www.sfiprogram.org/forest-conservation/bioenergy-carbon.php. Accessed November 18, 2010.
Shi, A.Z., L.P. Koh, and H.T.W. Tan. 2009. The biofuel potential of municipal solid waste. GCB Bioenergy 1(5):317-320.
Siemens, M.C., and D.E. Wilkins. 2006. Effect of residue management methods on no-till drill performance. Applied Engineering in Agriculture 22(1):51-60.
Simpson, T.W., A.N. Sharpley, R.W. Howarth, H.W. Paerl, and K.R. Mankin. 2008. The new gold rush: Fueling ethanol production while protecting water quality. Journal of Environmental Quality 37(2):318-324.
Singh, A., D. Pant, N.E. Korres, A.-S. Nizami, S. Prasad, and J.D. Murphy. 2010. Key issues in life cycle assessment of ethanol production from lignocellulosic biomass: Challenges and perspectives. Bioresource Technology 101(13):5003-5012.
Snyder, C.S., T.W. Bruulsema, T.L. Jensen, and P.E. Fixen. 2009. Review of greenhouse gas emissions from crop production systems and fertilizer management effects. Agriculture Ecosystems and Environment 133(3-4):247-266.
Sohngen, B., and S. Brown. 2004. Measuring leakage from carbon projects in open economies: a stop timber harvesting project in Bolivia as a case study. Canadian Journal of Forest Research-Revue Canadienne De Recherche Forestiere 34(4):829-839.
Sohngen, B., and R. Sedjo. 2000. Potential carbon flux from timber harvests and management in the context of a global timber market. Climatic Change 44(1-2):151-172.
Solomon, B.D. 2009. Regional economic impacts of cellulosic ethanol development in the North Central states. Pp. 281-298 in Renewable Energy from Forest Resources in the United States, B.D. Solomon and V.A. Luzadis, eds. New York: Routledge.
Solomon, B.D., J.R. Barnes, and K.E. Halvorsen. 2009. From grain to cellulosic ethanol: History, economics and policy. Pp. 49-66 in Renewable Energy from Forest Resources in the United States, B.D. Solomon and V.A. Luzadis, eds. New York: Routledge.
Spatari, S., and H.L. MacLean. 2010. Characterizing model uncertainties in the life cycle of lignocellulose-based ethanol fuels. Environmental Science and Technology 44(22):8773-8780.
Spatari, S., D.M. Bagley, and H.L. MacLean. 2010. Life cycle evaluation of emerging lignocellulosic ethanol conversion technologies. Bioresource Technology 101(2):654-667.
Sprague, L.A., R.M. Hirsch, and B.T. Aulenbach. 2011. Nitrate in the Mississippi River and its tributaries, 1980 to 2008: Are we making progress? Environmental Science and Technology. Available online at http://pubs.acs.org/doi/abs/10.1021/es201221s. Accessed August 31, 2011.
Stavins, R.N., and A.B. Jaffe. 1990. Unintended impacts of public-investments on private decisions—The depletion of forested wetlands. American Economic Review 80(3):337-352.
Stone, K.C., P.G. Hunt, K.B. Cantrell, and K.S. Ro. 2010. The potential impacts of biomass feedstock production on water resource availability. Bioresource Technology 101(6):2014-2025.
Tilman, D., J. Hill, and C. Lehman. 2006. Carbon-negative biofuels from low-input high-diversity grassland biomass. Science 314(5805):1598-1600.
Tolbert, V. 1998. Special issue - Environmental effects of biomass crop production. What do we know? What do we need to know? Guest editorial. Biomass and Bioenergy 14(4):301-306.
Tolbert, V.R., and L.L. Wright. 1998. Environmental enhancement of US biomass crop technologies: Research results to date. Biomass and Bioenergy 15(1):93-100.
Traviss, N., B.A. Thelen, J.K. Ingalls, and M.D. Treadwell. 2010. Biodiesel versus diesel: A pilot study comparing exhaust exposures for employees at a rural municipal facility. Journal of the Air and Waste Management Association 60(9):1026-1033.
Trumble, J.T., W.G. Carson, and G.S. Kund. 1997. Economics and environmental impact of a sustainable integrated pest management program in celery. Journal of Economic Entomology 90(1):139-146.
Turner, B.L., E.F. Lambin, and A. Reenberg. 2007. The emergence of land change science for global environmental change and sustainability. Proceedings of the National Academy of Sciences of the United States of America 104(52):20666-20671.
Turner, R.E., N.N. Rabalais, and D. Justic. 2006. Predicting summer hypoxia in the northern Gulf of Mexico: Riverine N, P, and Si loading. Marine Pollution Bulletin 52(2):139-148.
Tyner, W.E., F. Taheripour, Q. Zhuang, D. Birur, and U. Baldos. 2010. Land Use Changes and Consequent CO2 Emissions due to US Corn Ethanol Production: A Comprehensive Analysis. West Lafayette, IN: Purdue University.
Uherek, E., T. Halenka, J. Borken-Kleefeld, Y. Balkanski, T. Berntsen, C. Borrego, M. Gauss, P. Hoor, K. Juda-Rezler, J. Lelieveld, D. Melas, K. Rypdal, and S. Schmid. 2010. Transport impacts on atmosphere and climate: Land transport. Atmospheric Environment 44(37):4772-4816.
UNL (University of Nebraska, Lincoln). 2007. Nebraska water map/poster. Available online at http://water.unl.edu/watermap/watermap. Accessed June 11, 2010.
UNL (University of Nebraska, Lincoln). 2009. Groundwater-level changes in Nebraska. Available online at http://snr.unl.edu/data/water/groundwatermaps.asp. Accessed February 10, 2011.
U.S. Congress Office of Technology Assessment. 1987. Technologies to Maintain Biological Diversity. Washington, DC: U.S. Government Printing Office.
USDA-ERS (U.S. Department of Agriculture - Economic Research Service). 2004. Irrigation and Water Use. Available online at http://www.ers.usda.gov/Briefing/WaterUse/. Accessed September 20, 2010.
USDA-ERS (U.S. Department of Agriculture - Economic Research Service). 2010a. Feed grains database: Custom queries. Available online at http://www.ers.usda.gov/Data/FeedGrains/CustomQuery/. Accessed June 24, 2010.
USDA-ERS (U.S. Department of Agriculture - Economic Research Service). 2010b. Feed grains database: Yearbook tables. Available online at http://www.ers.usda.gov/data/FeedGrains/FeedYearbook.aspx. Accessed September 9, 2010.
USDA-ERS (U.S. Department of Agriculture - Economic Research Service). 2010c. Fertilizer use and price. Available online at http://www.ers.usda.gov/Data/FertilizerUse/. Accessed October 26, 2010.
USDA-NASS (U.S. Department of Agriculture - National Agricultural Statistics Service). 2010. Data and statistics: Quick stats. Available online at http://www.nass.usda.gov/Data_and_Statistics/Quick_Stats/index.asp. Accessed June 24, 2010.
USDA-NASS (U.S. Department of Agriculture - National Agricultural Statistics Service). 2009. Irrigated corn for grain, harvested acres: 2007. Available online at http://www.agcensus.usda.gov/Publications/2007/Online_Highlights/Ag_Atlas_Maps/Crops_and_Plants/index.asp. Accessed on June 24, 2010.
USDA-NASS (U.S. Department of Agriculture - National Agricultural Statistics Service). 2011. Prospective Plantings. Washington, DC: U.S. Department of Agriculture.
USDA-NIFA (U.S. Department of Agriculture - National Institute of Food and Agriculture). 2009. Precision, geospatial and sensor technologies: Adoption of precision agriculture. Available online at http://www.csrees.usda.gov/nea/ag_systems/in_focus/precision_if_adoption.html. Accessed November 19, 2010.
USDA-NRCS (U.S. Department of Agriculture - Natural Resources Conservation Service). 2009. Planting and Managing Switchgrass as a Biomass Energy Crop. Washington, DC: U.S. Department of Agriculture.
USFS (U.S. Department of Agriculture - Forest Service). 2001. U.S. Forest Facts and Historical Trends. Washington, DC: U.S. Department of Agriculture.
USGS (U.S. Geological Survey). 2011. WaterWatch. Available online at http://waterwatch.usgs.gov/new/. Accessed February 10, 2011.
van Dam, J., M. Junginger, A. Faaij, I. Jürgens, G. Best, and U. Fritsche. 2008. Overview of recent developments in sustainable biomass certification. Biomass and Bioenergy 32(8):749-780.
van der Voet, E., R.J. Lifset, and L. Luo. 2010. Life-cycle assessment of biofuels, convergence and divergence. Biofuels 1(3):435-449.
Van Groenigen, J.W., G.L. Velthof, O. Oenema, K.J. Van Groenigen, and C. Van Kessel. 2010. Towards an agronomic assessment of N(2)O emissions: A case study for arable crops. European Journal of Soil Science 61(6):903-913.
VanLoocke, A., C.J. Bernache, and T.E. Twine. 2010. The impacts of Miscanthus × giganteus production on the Midwest US hydrologic cycle. GCB Bioenergy 2:180-191.
Vaquer-Sunyer, R., and C.M. Duarte. 2008. Thresholds of hypoxia for marine biodiversity. Proceedings of the National Academy of Sciences of the United States of America 105(40):15452-15457.
Volk, T.A., and V.A. Luzadis. 2009. Willow biomass production for bioenergy, biofuels and bioproducts in New York. Pp. 238-260 in Renewable Energy from Forest Resources in the United States, B.D. Solomon and V.A. Luzadis, eds. New York: Routledge.
Wang, M.Q., J. Han, Z. Haq, W.E. Tyner, M. Wu, and A. Elgowainy. 2011a. Energy and greenhouse gas emission effects of corn and cellulosic ethanol with technology improvements and land use changes. Biomass and Bioenergy 35(5):1885-1896.
Wang, M., H. Huo, and S. Arora. 2011b. Methods of dealing with co-products of biofuels in life-cycle analysis and consequent results within the U.S. context. Energy Policy 39(10):5726-5736.
Wang, M., M. Wu, and H. Huo. 2007. Life-cycle energy and greenhouse gas emission impacts of different corn ethanol plant types. Environmental Research Letters 2(2):024001.
Wear, D.N., and B.C. Murray. 2004. Federal timber restrictions, interregional spillovers, and the impact on US softwood markets. Journal of Environmental Economics and Management 47(2):307-330.
Webster, C.R., D.J. Flaspohler, R.D. Jackson, T.D. Meehan, and C. Gratton. 2010. Diversity, productivity and landscape-level effects in North American grasslands managed for biomass production. Biofuels 1(3):451-461.
Weidema, B. 2003. Market information in life cycle assessment. Copenhagen: Danish Environmental Protection Agency.
West, T.O., C.C. Brandt, L.M. Baskaran, C.M. Hellwinckel, R. Mueller, C.J. Bernacchi, V. Bandaru, B. Yang, B.S. Wilson, G. Marland, R.G. Nelson, D.G.D. Ugarte, and W.M. Post. 2010. Cropland carbon fluxes in the United States: Increasing geospatial resolution of inventory-based carbon accounting. Ecological Applications 20(4):1074-1086.
Wiegmann, K., K.R. Hennenberg, and U.R. Fritsche. 2008. Degraded Land and Sustainable Bioenergy Feedstock Production. Darmstadt, Germany: Öko-Institut.
Wilhelm, W.W., J.M.E. Johnson, D.L. Karlen, and D.T. Lightle. 2007. Corn stover to sustain soil organic carbon further constrains biomass supply. Agronomy Journal 99(6):1665-1667.
Wilkie, A.C., K.J. Riedesel, and J.M. Owens. 2000. Stillage characterization and anaerobic treatment of ethanol stillage from conventional and cellulosic feedstocks. Biomass and Bioenergy 19(2):63-102.
Williams, P.R.D., D. Inman, A. Aden, and G.A. Heath. 2009. Environmental and sustainability factors associated with next-generation biofuels in the U.S.: What do we really know? Environmental Science and Technology 43(13):4763-4775.
Wise, M., K. Calvin, A. Thomson, L. Clarke, B. Bond-Lamberty, R. Sands, S.J. Smith, A. Janetos, and J. Edmonds. 2009. Implications of limiting CO2 concentrations for land use and energy. Science 324(5931):1183-1186.
Woodbury, P.B., L.S. Heath, and J.E. Smith. 2006. Land use change effects on forest carbon cycling throughout the southern United States. Journal of Environmental Quality 35(4):1348-1363.
Wright, L., and A. Turhollow. 2010. Switchgrass selection as a “model” bioenergy crop: A history of the process. Biomass and Bioenergy 34(6):851-868.
Wu, J.J. 2000. Slippage effects of the conservation reserve program. American Journal of Agricultural Economics 82(4):979-992.
Wu, M., M. Mintz, M. Wang, and S. Arora. 2009a. Consumptive Water Use in the Production of Ethanol and Petroleum Gasoline. Argonne, IL: Argonne National Laboratory.
Wu, M., M. Mintz, M. Wang, and S. Arora. 2009b. Water consumption in the production of ethanol and petroleum gasoline. Environmental Management 44(5):981-997.
Wu, M., Y. Wu, and M. Wang. 2006. Energy and emission benefits of alternative transportation liquid fuels derived from switchgrass: A fuel life cycle assessment. Biotechnology Progress 22(4):1012-1024.
Wu, X., S. Staggenborg, J.L. Propheter, W.L. Rooney, J. Yu, and D. Wang. 2010. Features of sweet sorghum juice and their performance in ethanol fermentation. Industrial Crops and Products 31(1):164-170.
Wu-Haan, W., W. Powers, R. Angel, and T.J. Applegate. 2010. The use of distillers dried grains plus solubles as a feed ingredient on air emissions and performance from laying hens. Poultry Science 89(7):1355-1359.
Yanowitz, J., and R.L. McCormick. 2009. Effect of E85 on tailpipe emissions from light-duty vehicles. Journal of the Air and Waste Management Association 59(2):172-182.
Yeh, S., S.M. Jordaan, A.R. Brandt, M.R. Turetsky, S. Spatari, and D.W. Keith. 2010. Land use greenhouse gas emissions from conventional oil production and oil sands. Environmental Science and Technology 44(22):8766-8772.
Zhang, X., R.C. Izaurralde, D. Manowitz, T.O. West, W.M. Post, A.M. Thomson, V.P. Bandaruw, J. Nichols, and J.R. Williams. 2010. An integrative modeling framework to evaluate the productivity and sustainability of biofuel crop production systems. Global Change Biology Bioenergy 2(5):258-277.
Zilberman, D., G. Hochman, and D. Rajagopal. 2010. On the inclusion of direct land use in biofuel regulations. University of Illinois Law Review 2011:413-434.
Zimmerman, A.R., B. Gao, and M.Y. Ahn. 2011. Positive and negative carbon mineralization priming effects among a variety of biochar-amended soils. Soil Biology and Biochemistry 43(6):1169-1179.


