
The biofuel supply chain involves producing biomass feedstock; harvesting, collecting, storing, and transporting the feedstock to the biorefinery; converting the biomass to fuel at the biorefinery; distributing biofuels to end users; and, finally, using the fuel. Biomass is procured from diverse environments, each associated with different economic costs for production and collection. These differing conditions contribute to a range of economic costs for feedstocks and environmental effects. Each subsequent stage of biofuel production and use could incur positive or negative effects on the economics of producing biofuels, the economic effects on other sectors, and the environment. This chapter examines the supply chains of food-based biofuels that are produced and nonfood-based biofuels that are likely to be produced in the United States within the 2022 timeline as established by the Renewable Fuel Standard amended by the Energy Independence and Security Act of 2007 (RFS2). Other feedstocks and conversion technologies that are not likely to be deployed by 2022 also are discussed.
Corn-Grain Biofuels
Feedstock
As of 2010, the primary feedstock for biofuel produced and consumed in the United States was corn grain. The majority of corn acreage is found in the Midwest (Figure 2-1). Corn yield in the United States has been increasing over recent decades (Cassman and Liska, 2007). The national average reached 165 bushels per acre in 2009 and was 156 bushels per acre in 2010. An advantage of grains as biofuel feedstock is that they are relatively dense and efficient to store and transport; have well-established production, harvest, storage, and transport supply chains or systems; and are commodity crops with well-established grades and standards that facilitate marketing and trading.
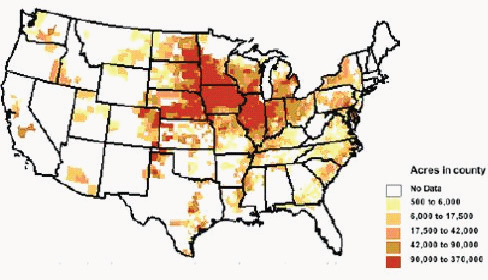
FIGURE 2-1 Distribution of planted corn acres in the United States in 2008.
SOURCE: USDA-ERS (2010).
Conversion
Starch from grains can be converted to ethanol by biochemical pathways. Most corn is dry milled—that is, the grain is ground to a meal, and then the starch from the grain is hydrolyzed by enzymes to glucose. The 6-carbon sugars are then fermented to ethanol by natural yeast and bacteria. The fermented mash is separated into ethanol and residue by distillation (Figure 2-2). The residue can be marketed wet as a dairy or cattle feedstuff or as dried distillers grain with solubles (DDGS) as a dairy, cattle, swine, and poultry feedstuff (Schwietzke et al., 2008). The theoretical yield of converting corn starch to ethanol is 112 gallons per dry ton (Patzek, 2006). A survey of U.S. ethanol plants conducted in 2008 reported average ethanol yield of 100 gallons per dry ton (Mueller, 2010).
Products and Coproducts
DDGS is a coproduct of grain ethanol production. Starch from grains is fermented to ethanol and the remaining protein, oil, yeast, minerals, and fiber form the coproduct DDGS, which is mostly used as an animal feedstuff (Nichols et al., 2006). For every bushel of corn grain used for ethanol production, about one-third comes out as DDGS, one-third as ethanol, and one-third as carbon dioxide (CO2). The wet-mill process also produces corn oil and high-fructose corn syrup as coproducts.
Distribution and Use
Many biofuels, including ethanol, are more soluble in water than petroleum-based fuels, requiring biofuels to be stored and handled more carefully to avoid water contamination. If
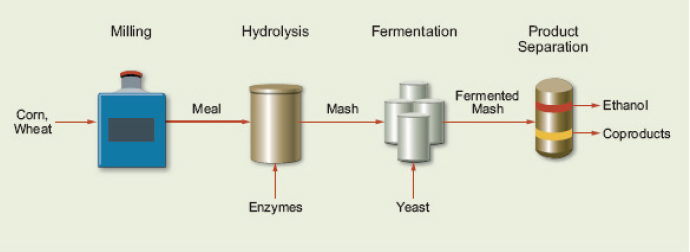
FIGURE 2-2 Processing steps for converting corn grain to ethanol.
SOURCE: Schwietzke et al. (2008). Reprinted with permission from IEA Bioenergy.
ethanol picks up water, it might not meet the fuel-ethanol specifications because the fraction of water exceeds the allowable amount. For that reason and because it is highly corrosive, ethanol cannot be transported in existing pipelines used for petroleum and is distributed by rail cars, barges, and trucks in the United States (USDA-AMS, 2007).
Ethanol has been used as a gasoline blending component or substitute for many years (see Chapter 1). It is almost exclusively produced outside a normal petroleum refinery and shipped to the refiner or distributor for blending into finished gasoline. The industry has developed stringent specifications for ethanol quality, such as ASTM D4806, so that all batches of ethanol can be treated equally and the final user is assured of getting a product that is fit for its desired purpose. All ethanol that meets this specification can be assumed to have the same performance as a fuel, regardless of its source. The refiner or blender does not have to be concerned about the source of the ethanol or how it was transported to the facility as long as it meets the specifications when it arrives.
Ethanol has a high octane value,1 a beneficial characteristic, but it requires petroleum-refinery operational adjustments that reduce the value of the additional octane. It also has a high blending Reid vapor pressure (RVP)2; RVP is about 20 pounds per square inch (psi; or 136,895 Pascal) at 10-percent ethanol and even higher at lower concentrations. This high RVP can cause drivability problems for the fuel, namely vapor locking,3 even if all other specifications are met. Therefore, the petroleum refiner has to reduce the amount of light hydrocarbons, such as butanes and hexanes, blended into gasoline.
If ethanol is used as a gasoline substitute, there will be a reduction in the amount of hydrogen produced by the naphtha reformer in a standard petroleum refinery. Hydrogen is a valuable coproduct of petroleum refining because it is used in upgrading hydrocarbons to more valuable products. This loss in hydrogen production would have to be compensated with either an increase in hydrogen production from within the refinery or an increase in purchased hydrogen produced via steam-methane reforming. Refiners that have access to a hydrogen pipeline system will usually just increase hydrogen purchases. Those facilities without access to merchant hydrogen would have
______________
1 Octane value is a measure of the maximum compression ratio at which a particular fuel can be used in an engine without some fuel and air mixture self-igniting or so-called “engine knocking.”
2 Reid vapor pressure is a measure of volatility.
3 Vapor locking is the interruption of flow of fuel in an internal-combustion engine caused by vapor.
to modify their operations to maintain or increase hydrogen availability. This modification can sometimes be achieved by increasing reformer severity, but as petroleum-based gasoline demand declines and diesel demand increases, the refinery ultimately would need to build a hydrogen plant. Hydrogen production from methane releases CO2 as a byproduct. This additional CO2 production offsets some of the CO2 reduction from using the biofuels.4
Status as of 2010
The amount of corn used for corn-grain ethanol has been increasing since 2000, and the percentage of U.S. corn production used for fuel ethanol increased dramatically from 2005 to 2009 (Figure 2-3). In 2010, about 40 percent of corn yield was used to produce 13.2 billion gallons of ethanol (USDA-NASS, 2010; RFA, 2011b). Given that RFS2 consumption mandate for conventional ethanol is 15 billion gallons per year from 2015 to 2022, the mandate can be achieved with a small increase in corn grain for ethanol.
The number of corn-grain ethanol biorefineries in the United States and the total capacity to produce ethanol has been increasing rapidly since 2002 (Figure 2-4). The average capacity build rate of ethanol biorefineries from 2001 to 2009 was about 25 percent with a substantial expansion in 2006 and 2007 (RFA, 2002, 2003, 2004, 2005, 2006, 2007, 2008, 2009, 2010). In January 2011, there were about 200 biorefineries (Figure 2-5) that converted corn starch into ethanol and had a combined installed (also known as nameplate) capacity5 of 14.1 billion gallons of ethanol per year (RFA, 2011a). A list of food-based ethanol refineries is available in Appendix H.
Motor gasoline consumption in the United States was about 9 million barrels per day (or 138 billion gallons per year) in the same period (EIA, 2010). As of 2010, gasoline for light-duty vehicles in the United States was sold mostly as 90-percent gasoline blended with 10-percent ethanol by volume (E10). In October 2010, the U.S. Environmental Protection Agency (EPA) approved a waiver that allows the use of E15 in model year 2007 or newer light-duty vehicles. In January 2011, EPA extended the waiver to model year 2001 to 2006 light-duty vehicles (EPA, 2011). Despite the regulatory change, E15 had not been implemented at the time this report was written because gasoline retailers would have to install new tanks and pumps to accommodate the blend and no reliable system had been developed to prevent misfueling of older vehicles. Some ethanol is sold as E85 blend for use in flex-fuel vehicles. As of 2010, there were about 2,000 E85 stations in the United States.
Corn starch also can be converted to biobutanol via the acetone-butanol-ethanol (ABE) fermentation pathway (Ezeji et al., 2007). Coproducts include alcohols with lower molecular weight than butanol and acetone. However, only a small number of companies have pursued biobutanol from corn starch, and the development of that technology remains in the precommercial stage. Challenges to producing biobutanol include its toxicity to the microorganisms that ferment sugar for its production and reducing the yield of coproducts to maximize butanol yield. If corn grain is the source of the sugars for fermentation, a residue similar to DDG will also be produced. However, the DDG from conversion of corn grain to biobutanol might require additional processing to remove any toxic biobutanol and acetone residue before it could be used as an animal feedstuff. Biobutanol is significantly less soluble in water than ethanol. It could be a drop-in
______________
4 At constant diesel production, every gallon of ethanol increases diesel CO2 emissions by about 1.4 lbs. This offsets the reduction in the CO2 attributable to ethanol use by about 10 percent.
5 The full-load continuous rating of the process plant as designed.
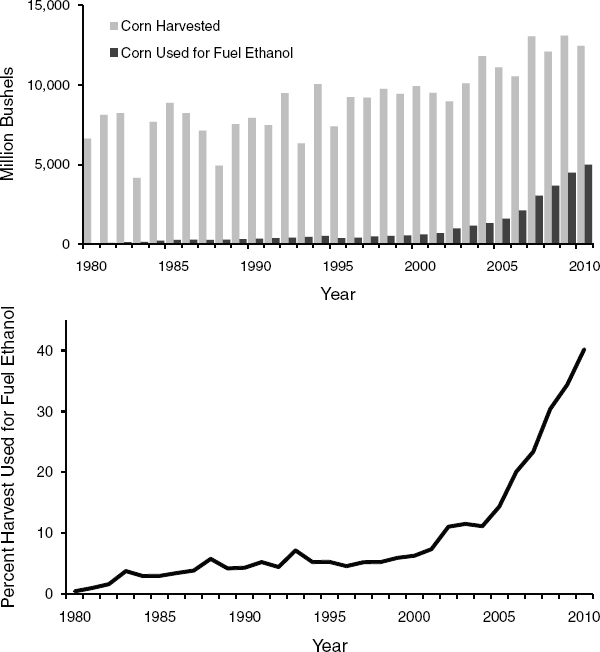
FIGURE 2-3 U.S. corn production and use as fuel ethanol from 1980 to 2009.
DATA SOURCES: USDA-ERS (2010), USDA-NASS (2010).
fuel: that is, a nonpetroleum fuel that is compatible with existing pipelines and delivery mechanisms for petroleum-based fuels. However, extensive testing would be required to confirm its compatibility with existing infrastructure. Its blending RVP is much lower than that of ethanol, and its octane is similar to regular-grade gasoline. As of 2010, there were no industry standard fuel-grade specifications and no accepted limits on the amount of biobutanol that can be safely blended into gasoline without damaging engine components. Because biobutanol properties are similar to regular gasoline, its major impact on the operation of the other refinery units would be a displacement of conventional petroleum-based, gasoline-blending components.
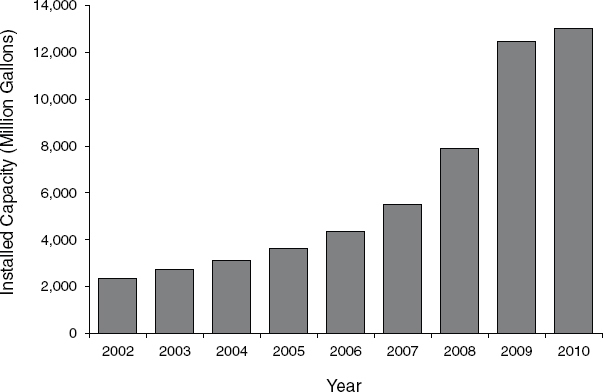
DATA SOURCES: RFA (2002, 2003, 2004, 2005, 2006, 2007, 2008, 2009, 2010).
Biofuels from Vegetable Oils and Animal Fats
Feedstock
Several countries, mostly in Europe, produce biodiesel from a variety of feedstocks, including rapeseed oil, palm oil, and soybean oil (Reijnders, 2009; de Vries et al., 2010). In the United States, biodiesel is produced mostly from soybean oil. Other vegetable oils and animal fats constitute a small fraction of biodiesel feedstock. As in the case of corn, soybean is mostly grown in the Midwest (Figure 2-6) and has established markets and infrastructure for storage and delivery.
Conversion
The most widely available commercial chemical conversion technology is transesterification of triglycerides to produce biodiesel (Knothe, 2001). Soybean is the typical feedstock in the United States even though corn, canola, oil palm, camelina, jatropha, used yellow grease, and animal fats can also be used to produce biodiesel through this process. A typical biodiesel refinery will extract the oil from the feedstock and use acid or base catalysts in excess alcohol (methanol) to convert the triglycerides into fatty acid methyl esters (FAMEs) or biodiesel. The process flow of biodiesel production is shown in Figure 2-7.
Thermochemical processes use a combination of heat and chemical catalysis to alter the biomass and convert it into a hydrocarbon closer in composition to diesel and gasoline than
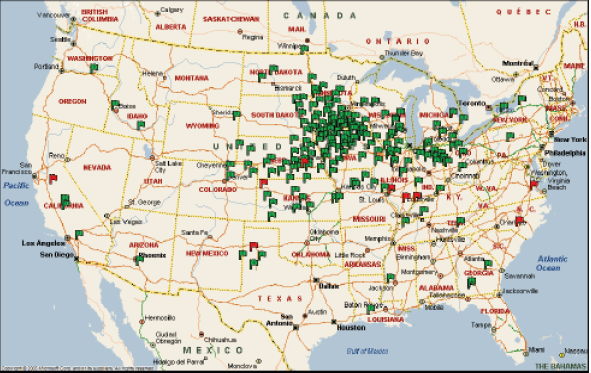
FIGURE 2-5 Location of ethanol biorefineries in the United States as of September 2010.
NOTE: Green flags indicate locations of operating biorefineries and red flags indicate locations of biorefineries under construction.
SOURCE: Urbanchuk (2010).
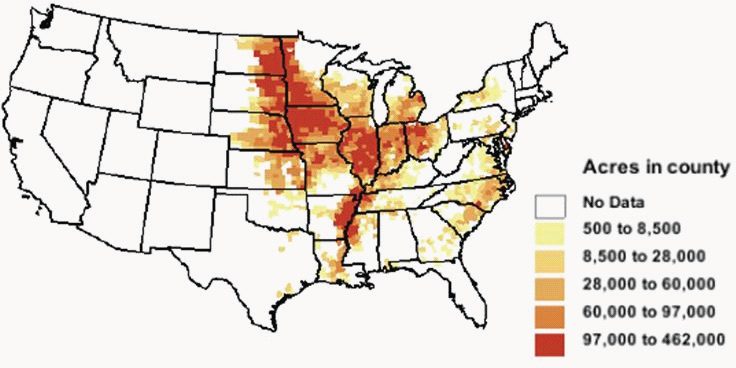
FIGURE 2-6 Distribution of planted soybean acres in the United States in 2008.
SOURCE: USDA-ERS (2010).
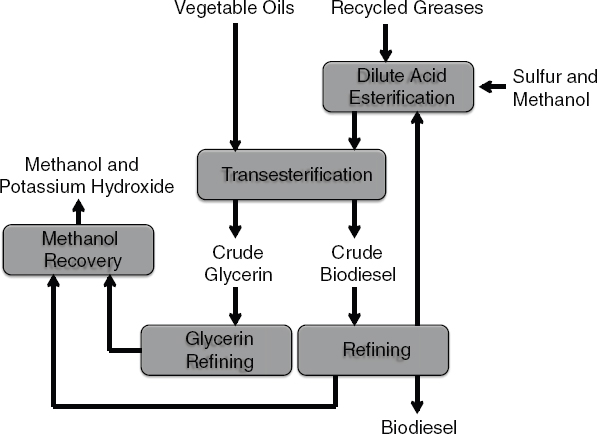
FIGURE 2-7 Process flow of biodiesel production.
SOURCE: Bain (2007).
conventional FAMEs. Neste Oil’s NExBTL process (Neste Oil, 2011a), CANMET’s “SuperCetaneTM” (CETC, 2008), and “green diesel,” developed and marketed by UOP, use large volumes of hydrogen and a catalyst to hydrogenate triglycerides recovered from animals or crop oils into a high-cetane diesel fuel (Kalnes et al., 2009). The severe hydrotreatment removes all of the oxygen from the triglyceride and saturates all of the olefinic bonds in the fatty acids. The primary products from this hydrogenation are water, CO2, propane, and a mixture of normal paraffins. The normal paraffin mixture is called green diesel. This renewable diesel is fully compatible with petroleum-based diesel. It can even be produced by coprocessing triglycerides along with other petroleum streams in conventional refinery diesel hydrotreaters. In late 2010, Neste Oil announced the start-up of a dedicated 265 million gallons per year biodiesel NexBTL unit in Singapore using palm oil, waste fats, and greases as feedstock. At the time this report was written, a similar sized unit was scheduled to start up in Rotterdam in the first half of 2011 (Neste Oil, 2011a). As of early 2011, Neste Oil was operating two smaller units in Finland with a combined capacity of 125 million gallons of biodiesel per year (Neste Oil, 2011b).
Most large refining companies and technology vendors have performed laboratory studies and commercial trials that have demonstrated the feasibility of coprocessing triglycerides with existing diesel hydrodesulfurization (HDS) units (Renewable Diesel Subcommittee of the WSDA Technical Work Group, 2007; Melis, 2008). The amount of triglyceride that can be coprocessed is a function of the current limitations of the hydrotreater and the properties of the triglyceride. Conoco-Phillips and Tyson formed a joint venture to
coprocess animal fats in Conoco-Phillips existing diesel hydrotreaters to produce 175 million gallons of renewable diesel each year. This coprocessing was discontinued when the U.S. Internal Revenue Service ruled that the tax credit for biodiesel did not apply to material coprocessed with petroleum.
Products and Coproducts
A typical transesterification plant can produce biodiesel from virgin oil and requires methanol, potassium hydroxide, and heat and electricity. The process results in the generation of glycerol and other impurities. Glycerol can be sold commercially for pharmaceutical formulation, soap production, and other uses before the market saturates. It also can be used as a feedstock to produce hydrogen, but technical improvements are needed to prove this pathway scalable and economically viable. Soybean seeds yield about 18-percent oil and the remaining meal, the primary product of soybean production, is sold as a highly nutritious animal feedstuff. Because of the high yield of the meal, this coproduct provides better monetary returns per ton of seed than the oil used in biofuel production.
Green diesel or renewable diesel generally has poor cold-flow properties (many products are solid at room temperature). Aside from the poor cold-flow properties, it is fully compatible with petroleum diesel and can use the existing distribution infrastructure. Production of green diesel does not result in any coproducts of significant volume. The coproducts from the production of green diesel are primarily water, CO2, and propane.
Distribution and Use
Because of the flexibility in feedstocks that can be used to produce biodiesel, biodiesel refineries are more widely distributed geographically than refineries that produce corn-grain ethanol and include many that are processing waste oil as a feedstock rather than agricultural products (Figure 2-8). It is currently the largest volume class of biofuels after ethanol. FAME biodiesel is also mostly distributed by truck, barge, or rail. Although pipeline distribution would be the most economical option, it requires further experimentation. FAME has poor cold-flow properties, which could pose problems for delivery in colder climates. The fuel needs to be stored in special heated tanks to keep it fluid if it is to be used in northern tier states. The current specifications for FAMEs do not set limits on cold-flow properties, which are required to be reported to the customer only. The lack of limits makes refinery planning and operation more difficult. For many conventional petroleum crude oils, cold-flow properties limit the amount of diesel that can be produced. Operating a refinery capable of accepting FAMEs with different cold-flow properties would be difficult and costly. The base petroleum streams would have to be produced for the “worst case scenario” of poor cold-flow properties. Cold-flow properties do not always blend predictably, so the refineries have to produce conservative blends. It is costly for a refinery to reblend or reprocess product that is off specification for cold-flow properties.
Commercially relevant quantities of FAME have been blended into diesel fuel for several years. Quality control and economic and feedstock availability issues, however, have limited its growth as a petroleum-diesel replacement. FAME is more chemically active than petroleum-based diesel, and it degrades and forms corrosive acids during storage. Exposure to air and water accelerates this degradation. In addition, FAME can undergo biological degradation in contact with water. This process forms a “scum” at the oil-water interface that will plug downstream filters, including those owned by the final user, such as vehicle fuel filters or home heating system filters. Although ASTM specifications exist
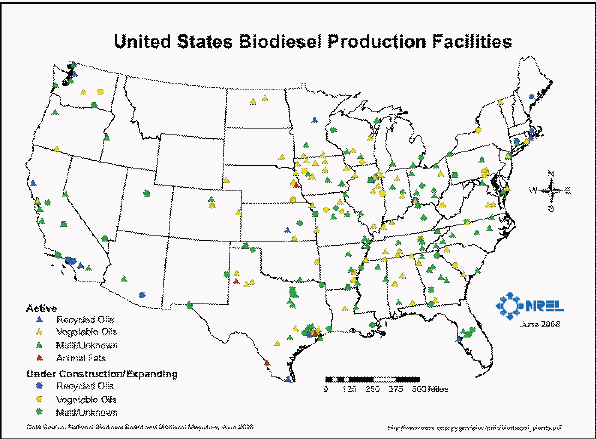
FIGURE 2-8 Biodiesel refineries in the United States (2008).
SOURCE: NREL (2008).
for FAME, they are frequently updated as new contaminants or problems are identified. FAME is produced via several processes from different feedstocks that lead to significant quality variations. It has good lubricity properties and can reduce the amount of lubricity additive required for ultra-low-sulfur diesel.
FAME can be blended with petroleum-based diesel at any percentage, and those blends are compatible with petroleum-diesel engines (DOE-EERE, 2010). The most popular biodiesel blend in the United States is B20—that is 80-percent petroleum-based diesel and 20-percent biodiesel (NREL, 2005). As of 2010, there were about 650 B20 stations in the United States.
Although a few dedicated green diesel hydrotreater projects are in various stages of development, most large refining companies and technology vendors have performed laboratory studies and commercial trials that have demonstrated the feasibility of coprocessing triglycerides on existing diesel HDS units. The amount of triglycerides that can be coprocessed is a function of the current limitations of the hydrotreater and the properties of the triglyceride.
Triglycerides consume roughly five times more hydrogen per barrel of feedstocks than typical diesel HDS feedstocks. The heat of reaction is also roughly five times higher than typical HDS feedstocks. These two factors usually limit the amount of triglyceride that can be coprocessed to about 10 percent of the HDS feedstocks. Unit modification to increase hydrogen make-up capacity and to handle the additional heat of reaction would be required to coprocess significantly higher amounts of triglycerides.
Most HDS units can handle the incremental amount of water and propane that are produced from limited coprocessing, but again these facilities would have to be upgraded to process additional volumes. The oxygen removed via triglyceride hydrogenation produces some CO2 in addition to water. Up to half of the total oxygen can be released in the form of CO2. Most HDS units are not designed to handle CO2 as a reaction product. If the HDS unit has a recycle-gas, amine-based hydrogen sulfide (H2S) scrubber, then the CO2 will be recovered together with the H2S. This will minimize the effect of CO2 on the HDS operation but will increase the load on the amine system and the sulfur plant, reducing the refinery’s ability to process high-sulfur crudes.
Without a recycle-gas scrubber, CO2 can build up in the recycle gas. This buildup has negative effects on unit operation. Processing triglycerides can also affect the HDS preheat system. All biobased triglycerides contain olefinic bonds as well as some free fatty acids. The olefinic bonds can interact and form gums either in storage or in the preheat train. These gums deposit in the preheat exchangers, the furnace, and the catalyst bed and degrade unit performance. The free fatty acids can also cause additional corrosion in the preheat exchangers. HDS preheat train metallurgy would most likely have to be upgraded to process significant volumes of triglycerides.
Because most refineries control diesel cold-flow properties by adjusting the back-end distillation cut point of the diesel components, including green diesel in the diesel pool requires an end-point reduction in the other blend components. Reducing the diesel end point decreases the amount of diesel that can be produced from a barrel of crude oil. This heavy stream that can no longer be included in diesel would have to be processed by fluidized catalytic cracking (FCC), the vacuum gas oil hydrocracker, or blended into heavy fuel oil. All of these alternate options are usually less profitable than including it in diesel fuel.
Status as of 2010
In 2008, an estimated 16 percent of soybean production in the United States was used to produce biodiesel (USDA-NASS, 2010). Biodiesel production increased from 9 million gallons per year in 2001 to 532 million gallons per year in 2009 (EIA, 2010), but members of the National Biodiesel Board reported a total production capacity of 2.7 billion gallons per year (NBB, 2010). A list of biodiesel refineries is provided in Appendix I. Nonfood oils produced from algae or dedicated bioenergy crops, such as camelina, are expected to be used as biomass feedstock in the future.
Cellulosic Feedstock
Cellulose,6 hemicellulose,7 and lignin8 provide the structural components of plant cells. Those plant materials can be used to produce biofuels, commonly referred to as cellulosic biofuels. Potential feedstocks for cellulosic biofuels include agricultural residues, dedicated energy crops, forest resources, and municipal solid waste.
______________
6 A complex carbohydrate, (C6H10O5)n, that forms cell walls of most plants.
7 A matrix of polysaccharides present in almost all plant cell walls with cellulose.
8 A complex polymer that occurs in certain plant cell walls. Lignin binds to cellulose fibers and hardens and strengthens the cell walls of plants.
Agricultural Residues
Crop residues include leaves, stalks, cobs (corn), and roots. Those being considered for cellulosic biofuel production include corn stover, corn cobs, sorghum stalks, wheat straw, cotton residue, and alfalfa stems. Crop residues are sometimes called crop wastes, but this is a misnomer as they help maintain soil quality (including fertility, structure, and other physical, chemical, and biochemical qualities) and reduce or mitigate soil erosion (Blanco-Canqui and Lal, 2009b). The amount of residues to be left to achieve those functions depends on soil conditions, crop yield, crop management practices (for example, tillage and crop rotation), prevailing climate conditions, and topography of the land.
Corn stover can be recovered from the millions of acres that annually produce corn grain in United States, primarily in the Midwest (Figure 2-1). Brechbill and Tyner (2008) summarized a range of estimates for corn stover yield as a proportion of grain yield. The range is usually around a 1:1 ratio between grain and stover measured in dry weight (Johnson et al., 2006). The amount of stover available for biofuel production is typically much less than the amount produced, however, in part because it is not mechanically possible or environmentally desirable to collect all corn stover (Petrolia, 2006; Graham et al., 2007; Wilhelm et al., 2007). Recovery of 30 to 50 percent of stover has been reported as achievable, with the lower amount considered an average for sustainable removal rates from many studies (Beach and McCarl, 2010; Miranowski and Rosburg, 2010; Schnepf, 2010). The amounts estimated as recoverable depend on the harvest techniques used (Brechbill and Tyner, 2008), seasonal factors associated with the weather, and the costs of harvest, which encapsulate other factors such as the price of oil and tax and other policies that affect a farmer’s bottom line.
The amount of stover removed from the field affects erosion and maintenance of soil resources. The amount of stover retained on the field to minimize erosion and maintain soil resources varies with biophysical conditions and crop management practices. Some fields, or locations within fields, will not support crop residue removal without excess soil erosion or loss of soil organic matter, while other sites might benefit from partial residue removal (Blanco-Canqui and Lal, 2009a,b; NAS-NAE-NRC, 2009). Blanco-Canqui and Lal (2009a,b) suggested that the amounts of residue needed to maintain soil organic matter (SOM) levels are larger than those needed to prevent soil erosion. Clay et al. (2010) pointed out the importance of estimating below-ground or root residue carbon in estimating SOM maintenance levels. Although some long-term residue removal studies exist (Karlen et al., 1994), they are inadequate to serve the diversity of landscapes, residue types, and farming practices from which residues might be removed. Therefore, some authors suggested long-term research to create site-specific guidelines for residue harvest (Karlen et al., 1994; Andrews, 2006; Clay et al., 2010).
In addition to concerns about the environmental effects of crop residue use, there are other unresolved problems associated with the timing of residue harvest, transportation of residues to biorefineries, and deterioration during storage (Brechbill and Tyner, 2008; Schnepf, 2010). (See also the later section in this chapter, “Storage and Delivery of Cellulosic Feedstocks.”) These same issues affect energy crops in general and, to a lesser degree, some forest residues.
The national average yield for corn in the years 2006-2010 was 155 bushels per acre (USDA-NASS, 2010). Assuming a 1:1 ratio of dried stover to grain by weight, and taking into account corn grain has 16-percent moisture, 3.7 dry tons of stover were available per acre. Most corn is produced in the Midwest,9 where the average production in 2006-2010
______________
9 Illinois, Indiana, Iowa, Kansas, Kentucky, Michigan, Minnesota, Missouri, Nebraska, Ohio, South Dakota, and Wisconsin accounted for over 80 percent of the corn acres planted in 2006-2010.
was 162 bushels per acre or 3.8 dry tons of available stover per acre. Because of the environmental considerations cited above, the actual amount of stover removed would be much less. Harvestable corn stover has been estimated to be 0.7-3.8 dry tons per acre.10
The U.S. Department of Agriculture (USDA) projected that corn acreage will hover at 88-92 million acres through 2021 (USDA, 2011). However, it forecasted that corn yield per acre will increase from 154 bushels per acre in 2008-2009 to 180 bushels per acre in 2020-2021 (USDA, 2010, 2011). Others projected greater increases; for example, the National Corn Growers Association estimated yields will reach 205 bushels per acre by 2020 (NCGA, 2010), while Monsanto predicted yields closer to 225 bushels per acre in that timeframe (Fraley, 2010). EPA estimated that 22 percent, or 82 million dry tons, of corn stover in the Midwest could be harvested in 2022; however, EPA’s estimate assumed that the density of corn plants would increase substantially by that time (EPA, 2010b).
Dedicated Bioenergy Crops
Dedicated bioenergy crops refer to nonfood perennial crops that are grown primarily for use as bioenergy feedstocks. Examples of dedicated bioenergy crops include switchgrass, Miscanthus, mixtures of native grasses, and short-rotation woody crops such as hybrid poplar and willow. The following section describes species characteristics and summarizes yield data from published literature. The research in these species is still in its infancy; therefore, many of the yield results are from trial plots and do not account for site quality or growing conditions, which heavily influence crop yields from production agriculture (Johnston et al., 2009; Lobell et al., 2009). Other studies examined the crops under systems designed for forage rather than bioenergy feedstock production.
Switchgrass
Switchgrass (Panicum virgatum L.) is native to the United States. It is a deep-rooted, warm-season perennial prairie grass and has traditionally been used for soil erosion control, forage, wildlife habitat, and landscaping. Switchgrass can tolerate a wide range of soil conditions, including soil too poor to support row-crop production (Bransby et al., 2010). It is a highly productive and nutrient-efficient plant that can grow on acidic or infertile soils with few inputs (Jung et al., 1988). It is endemic to the prairie and oak savanna ecosystems of the United States. Though most of its original habitat has been disrupted to accommodate farming, it can grow from Texas to the Dakotas and east to the Atlantic Coast.
Of the perennial native grasses under consideration as potential bioenergy crops, switchgrass has been the most extensively studied, particularly following its selection as the herbaceous model species for the U.S. Department of Energy’s (DOE’s) Feedstock Research Program (Wright and Turhollow, 2010). Propagated from seeds, the stems can grow up to 8 feet tall (El Bassam, 2010). Switchgrass is typically harvested in late October or early November in the United States, after its top growth has died back (Rinehart, 2006). Its low mineral content at harvest time lends itself to efficient combustion and low-exhaust gas emissions (El Bassam, 2010). Stands of switchgrass can be productive 10 or more years.
Potential switchgrass yields range between 0.89 and 17.8 dry tons per acre.11 In a review of studies on switchgrass yields, Schnepf (2010) found that yield averages were be-
______________
10 A compilation of estimates for harvestable corn stover from the literature is used in the economic analyses in Chapter 4 and presented in an associated appendix.
11 A compilation of switchgrass yields from the literature is used in the economic analyses in Chapter 4 and presented in an associated appendix.
tween 3 and 6 dry tons per acre. Yields vary by agronomic conditions; factors that affect productivity include the amount of precipitation and its timing, growing degree days, and temperature (Wullschleger et al., 2010). In the prairie regions west of the 100th meridian, lower precipitation and lower temperatures constrain biomass yields (Nelson et al., 2010).
Yields also vary because of nitrogen availability. At one extreme, researchers found no response of switchgrass yield to nitrogen fertilization in southern England (Christian et al., 2002). At the other extreme, researchers suggested 200 tons per acre of nitrogen as an optimal rate of nitrogen fertilization for Alamo switchgrass at a site in Texas (Muir et al., 2001). Optimal rates of nitrogen fertilization depend on the use for switchgrass,12 number of harvests per year,13 nitrogen mineralization in soil organic matter, and potential symbiotic relationship with mycorrhizae and other microorganisms. Because of its adaptation to a large geographic area, soil type and acidity do not appear to affect switchgrass productivity (Parrish and Fike, 2005). Wullschleger et al. (2010) concluded from their review of field trials that it is likely that switchgrass productivity benefits from moderate fertilizer application but that the response rates are uncertain. They found that biomass yield is not related to plot size or row spacing. However, the relative success of stand establishment and crop management practices, such as irrigation and the number of harvests per season, will likely influence overall yield.
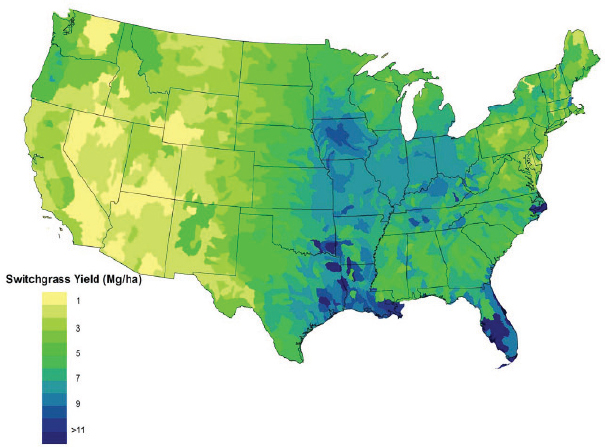
Though switchgrass can be grown in most of the eastern United States, empirical studies and model estimates show that it is likely to be most productive across the middle of the eastern United States from eastern Kansas through Virginia (Jager et al., 2010; Wullschleger et al., 2010) and in the lower Mississippi Valley (Thomson et al., 2009). Thomson et al. (2009) adapted the Environmental Policy Integrated Climate (EPIC) model to simulate switchgrass yield. This model simulates agroecosystem processes and has been widely used to simulate crop yields under different agronomic conditions. They predicted that yields will be highest in the lower Mississippi Valley regions and parts of the Southeastern United States, especially Florida. Other regions with potentially high yields are the central Corn Belt, parts of the Ohio River Valley, and parts of Tennessee (Figure 2-9). The authors noted that the model predicted that the regions with the highest potential productivities for switchgrass are also the highest-producing agricultural lands in the country. Jager et al. (2010) used multiple regression analyses to derive a model for predicting lowland and upland switchgrass yields across the United States on the basis of variables associated with climate, soils, and management (for example, precipitation, temperature, nitrogen fertilization, stand age, and locations). Jager et al. (2010) predicted somewhat different locations for the highest switchgrass yields, particularly areas in Virginia, North Carolina, and Tennessee, and higher average yields (Figure 2-10).
Miscanthus
Miscanthus is a genus of perennial, warm-season grasses native to eastern Asia, northern India, and sub-Saharan Africa. Under favorable conditions, it is highly productive in terms of biomass compared to other grasses and agricultural crops (Beale and Long, 1995; Bransby et al., 2010). Miscanthus has been used in China and Japan for grazing, paper-making, and building materials and has been naturalized around the world as an ornamental plant in landscaping (Stewart et al., 2009). Research into its use as a bioenergy crop has been under way since the 1980s (Heaton et al., 2010). Most research in the United States has been conducted on Giant Miscanthus (Miscanthus × giganteus), a sterile, hybrid
______________
12 High nitrogen content is desirable in switchgrass for forage, but not in switchgrass for bioenergy.
13 Switchgrass managed for forage is harvested more frequently than switchgrass managed for bioenergy.
SOURCE: Thomson et al. (2009).
variety propagated by rhizome division. Stands in Illinois can grow to more than 12 feet tall. The stems are usually one-half to three-quarters of an inch in diameter. Harvest takes place between early December and early March (Pyter et al., 2009), though harvesting is usually avoided the first year to allow time for the stand to establish itself and survive the first winter. Stands of Miscanthus can grow productively for more than 15 years.
Yield estimates from U.S. studies range from 6.3 to 17 dry tons per acre.14 It is possible to harvest even higher yields from Miscanthus if it is harvested in the summer. However, even though there is a 30-50 percent loss of biomass, most harvesting is done during the winter when plant moisture and nutrient content is low and biomass is therefore more amenable to processing.
Miscanthus could be an efficient use of land in terms of producing biomass. However, there are still many unanswered questions about Miscanthus production at a large scale in the United States. First, optimum nitrogen application is uncertain. For example, yields on high-quality cropland in Illinois in one study of M. × giganteus averaged 13.5 dry tons per acre without irrigation and with 22.5 pounds per acre of applied nitrogen fertilizer (Heaton et al., 2008). However, Heaton et al. (2009) found that over the course of 3 years
______________
14 A compilation of Miscanthus yields from the literature is used in the economic analyses in Chapter 4 and presented in an associated appendix. Through 2010, more research on Miscanthus had taken place in Europe than in the United States, and many of these European studies are included to increase the robustness of the dataset.
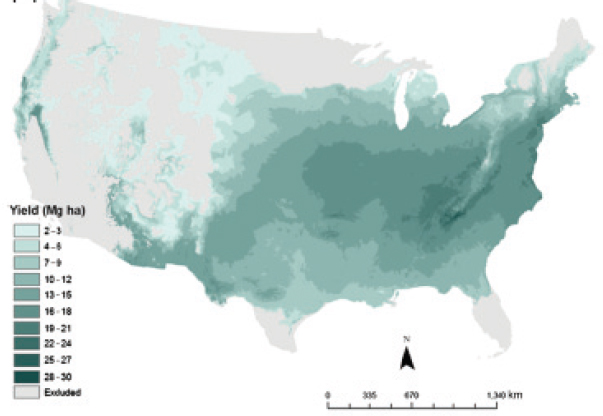
SOURCE: Jager et al. (2010). Reprinted with permission from Wiley Blackwell.
M. × giganteus removed 12 times more nitrogen from the soil than was added. It has been proposed that Miscanthus may have nitrogen-fixing properties (Davis et al., 2010); this needs to be determined to ensure that Miscanthus planted on a large scale does not deplete the soil of nutrients. Second, M. × giganteus uses water more efficiently and produces more biomass per unit water than corn (Heaton et al., 2010). However, M. × giganteus produces so much more biomass than corn that the total quantity of water consumed in a given plot could be higher if M. × giganteus is planted instead of corn. McIsaac et al. (2010) found that total evapotranspiration is greater in M. × giganteus than in switchgrass or corn under comparable conditions and therefore could reduce surface water flows and groundwater recharge if planted widely in place of corn. Finally, questions about the tolerance of M. × giganteus to temperature extremes, the conditions necessary for it to overwinter the first year, and its susceptibility to pest pressures have yet to be resolved (Heaton et al., 2010).
Cultivation of M. × giganteus may be limited in some locations because of the expense of asexual propagation and establishment. Sterility would limit inadvertent spread of a highly productive nonnative species. Research is under way to develop a seeded variety of Miscanthus, but its potential to become an invasive species would have to be evaluated before it is planted widely (Heaton et al., 2010).
In addition to the mechanics of its biology and its productivity on a large scale, more research is needed to determine the suitability of Miscanthus to different locations in the United States. While it has been demonstrated to yield well on marginal land in Ireland that tends to waterlog in the winter and dry out in the summer (Clifton-Brown et al., 2007),
additional research needs to be conducted to determine its productivity on a wider range of land productivity classes and climate zones in the United States, especially those with moisture limitations or flooding. Miscanthus could compete for land currently used for corn production if prices were competitive because Miscanthus has been shown to yield well under conditions similar to corn production (Heaton et al., 2008). Furthermore, Miguez et al. (2008, 2009) developed a model predicting where and how well Miscanthus would yield. Somerville et al. (2010) applied the model to predict Miscanthus yield in the United States in the third year of planting assuming no competition from other crops or vegetation (Figure 2-11). The model projects that there is substantial overlap between acres currently used for corn and acres on which Miscanthus would be highly productive (Figure 2-1). High levels of productivity were predicted in some areas of the southern and eastern United States that are less suitable for corn.
Native Grasses
Native grasses are ecologically adapted for the environment that they occupy naturally; thus, the implicit assumption is that cultivation costs for native grass feedstock will be minimal, particularly if the agronomic practices emulate the species’ environmental conditions. Experiments are being conducted on the suitability of native prairie grasses other
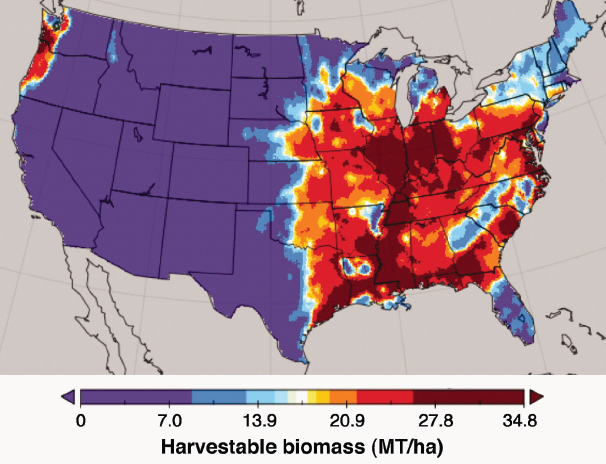
SOURCE: Somerville et al. (2010). Reprinted with permission from G. Bollero, University of Illinois.
than switchgrass to serve as biofuel feedstocks in addition to or planted with switchgrass (Tilman et al., 2006; ANL, 2010). Warm-season candidates include big bluestem (Andropogon gerardii Vitman), a perennial, rhizomatous grass that grows up to 8 feet tall (Owsley, 2002); little bluestem (Schizachyrium scoparium Michx. Nash), a widely distributed native that tolerates a broad variety of soil conditions (USDA-NRCS, 2002); Indiangrass (Sorghastrum nutans L. Nash), which grows 3-7 feet tall under a variety of soil types; and eastern gamagrass (Tripsacum dactyloides L.), a long-lived, perennial relative of corn that is typically 2-3 feet tall but can reach 10 feet in height (Lady Bird Johnson Wildflower Center, 2011). Research has also been conducted on prairie cordgrass (Spartina pectinata) (Energy Biosciences Institute, 2011) and coastal panicgrass (Panicum amarum Ell. var. amarulum [A.S. Hitchc. & Chase] P.G. Palmer) (Henson and Fenchel, 2007; Mayton et al., 2011).
The warm-season grasses big bluestem, little bluestem, prairie cordgrass, and Indiangrass are native to most of the United States, while eastern gamagrass is native to the Great Plains and eastward. Weimer and Springer (2007) found that the yields from 3 years of harvests of three varieties of big bluestem planted in five different states averaged 2.04, 1.96, and 1.76 dry tons per acre. Owsley (2002) found that “Kaw” cultivar of big bluestem yielded 1.8 to over 3.5 dry tons per acre per year, depending on location and fertilizer inputs. Big bluestem can tolerate drought, and it has the genetic capacity to grow in a wide range of growing seasons, though breeding research has yet to exploit this capability. However, it is more difficult to establish than switchgrass (Anderson et al., 2008).
Eastern gamagrass is also difficult to establish. It requires more water and nitrogen and is less tolerant of poor soils than big bluestem, but it can yield 2.7-7.2 dry tons per acre per year (Anderson et al., 2008). However, big bluestem had better fermenting properties, making it more suitable for bioenergy processing than eastern gamagrass (Weimer and Springer, 2007). Prairie cordgrass occurs in most prairie grasslands and is tolerant to salinity and wet soils; therefore, it is likely to be productive on low, wet areas that are not conducive to switchgrass or big bluestem production (Gonzalez-Hernandez et al., 2009). Indiangrass yields vary with precipitation, with the better yields reportedly reaching 3.5 dry tons per acre per year (Tober et al., 2009).
For cooler and possibly less humid environments, DOE has started to investigate the cool-season perennial reed canarygrass (Phalaris arundinacea L.), a grass used for forage and hay, as a viable bioenergy feedstock. Reed canarygrass is native to all regions of the United States, with the exceptions of Alaska, Hawaii, and the South. It can grow over 8 feet tall and is tolerant of poorly drained soils (El Bassam, 2010). Though it is difficult to establish and does not yield well until the second or third year, once established it is long-lived and high-yielding (Anderson et al., 2008). In Europe, yields of about 1.5-8.6 dry tons per acre per year with liquid manure fertilizer have been demonstrated. In New York, Salon et al. (2010) reported an average yield of 4 dry tons per acre per year. More broadly, yields in the United States have typically ranged from 4.5 to 6.75 dry tons per acre (Anderson et al., 2008). However, the location of reed canarygrass is important because it is an invasive species in wetland areas.
Other cool-season possibilities include Canadian wildrye (Elymus Canadensis L.) (Lady Bird Johnson Wildflower Center, 2011), smooth bromegrass (Bromus inermis Leyss.), wildryes (for example, Elymus glaucus, Elymus cinereus, and Leymus triticoides), Sandberg bluegrass (Poa secunda), mountain brome (Bromus marginatus), and wheatgrasses (Elymus lanceolatus and Elymus trachycaulus) (El-Nashaar et al., 2009). Wildryes, Leymus spp., are found throughout the United States, while wheatgrasses (Elymus spp.) are more common west of the Great Plains, though they can be found in the Northeast as well. Many wildryes are well adapted to low precipitation and can tolerate high altitudes and salinity (Anderson et al.,
2008). Wildryes may be suited to the Mountain West because they require little additional precipitation or nutrient input. Anderson et al. (2008) reviewed studies that found yields of 1.35-9 dry tons per acre in that region. Tall wheatgrass yields are reported to be around 5 dry tons per acre per year (Salon et al., 2010).
Some authors have suggested that native stands of grasses, combined with other herbaceous species, can be sustainably harvested at low ecological cost and could have large enough yields to permit economic use (Tilman et al., 2006; Fargione et al., 2009). Native prairies are associated with many environmental services, especially those associated with wildlife and soil and nutrient conservation (Jarchow and Liebman, 2011). Combining these landscapes with economic production of biomass feedstocks is an appealing concept (Tilman et al., 2006; Jordan et al., 2007). Others have suggested that complex mixtures of plant species are at best similar to or lower yielding than simpler ones or monocultures under most economic production conditions (Sanderson et al., 2004; Adler et al., 2009; De Haan et al., 2010). However, native grass mixtures might sustain economic harvests of biomass without loss of environmental benefits in particular locations (Sanderson et al., 2004; De Haan et al., 2010).
Little research has been conducted into the suitability of native grasses (with the exception of switchgrass) as biomass in monoculture or mixed culture. Though some studies have looked at the possible yields of other native grasses, few have been conducted under conditions suited for bioenergy production, as opposed to forage, and there has been no control for site quality across studies that examine native grass yields. Furthermore, almost no research has been done to improve their germplasm for biomass production. Research and development could result in substantial increases in yield.
Short-Rotation Woody Crops
Short-rotation woody crops are intensively managed, fast-growing trees or woody shrubs. Several species have been evaluated for their biofuel utility and suitability for use in different agroecological regions in the United States. Trees and shrubs provide an advantage over residues or grasses because they can be stored while still growing until market demand warrants harvest. Because they are denser than herbaceous cellulosic feedstocks, they offer easier storage and transport logistics after harvest compared to agricultural residues or perennial grasses (Hinchee et al., 2009). Biomass from woody crops can also be mixed with other woody feedstock, such as forest-industry residues, forest-product residues, or urban wood residues (Johnson et al., 2007).
Species native to the United States that hold promise as bioenergy feedstocks include hybrid poplars (Populus spp.), willow (Salix spp.), black locust (Robinia pseudoacadia L.), sycamore (Platanus spp.), sweetgum (Liquidambar styraciflua L.), and loblolly pine (Pinus taeda L.) (Johnson et al., 2007; Hinchee et al., 2009; Kline and Coleman, 2010). Eucalyptus (Eucalyptus spp.), native to Australia, is also a potential feedstock in southern, frost-free locations (Hinchee et al., 2009; Kline and Coleman, 2010). Rotation lengths for these short-rotation tree crops can vary from 1 year to over 15 years, depending on the tree or shrub species, the productivity of the site, and the management of the plantation.
Most woody crops for bioenergy will likely be produced east of the Mississippi because rainfall levels are higher. Poplar and willow have great potential to provide woody biomass for bioenergy because they are highly productive and stand to benefit from extensive genetic research or harvesting improvements. Under the right conditions, Populus spp. plantings can be harvested 3-4 years after cutback and more than eight harvests are possible during the life of the plantation (El Bassam, 2010). Eastern cottonwood (Populus deltoides M.) can produce 5 dry tons per acre per year when managed intensively (Mercker, 2007). A
survey of forest management practitioners conducted by Kline and Coleman (2010) in the Southeast reported that hybrid poplars achieved yields of 2.25 dry tons per acre per year on plantations, but 6.75 dry tons per acre per year on trial plots. Riemenschneider et al. (2001) found yields of 7 dry tons per acre per year on highly productive sites and sustained yields of 5 dry tons per acre per year in the North Central United States. The productivity of poplars has been improved through selection, clonal propagation, and hybridization (Heilman and Stettler, 1985), and advances in the future should be able to take advantage of the recent mapping of the poplar genome (Tuskan et al., 2006). Though hybrid poplars can grow in most of the eastern United States and in the Pacific Northwest, their productivity, range, and therefore usefulness as woody biomass feedstock is currently limited by their high demand for nutrients and water (Johnson et al., 2007; Hinchee et al., 2009; Kline and Coleman, 2010).
Willow (Salix spp.) is highly productive and can be harvested after 3 years (Walsh et al., 2003; El Bassam, 2010). It performs well under coppice management, in which new growth sprouts directly from cut stumps. At least eight harvests can be obtained from a plantation over 25 years (Volk et al., 2004; Johnson et al., 2007; El Bassam, 2010). It is a highly water-dependent crop and prefers moist soil in cold, temperate climates. Relative to its productivity, it is a nutrient-efficient plant when cultivated at the plantation scale (El Bassam, 1996). Insect susceptibility is not an extensive problem for willow, and the diversity of willow species offers rich potential for breeding disease resistance (El Bassam, 2010). Most willow trials have been conducted in the Northeast and Midwest (Ruark et al., 2006); willow grows in the Southeast, but extensive study has not yet been conducted (Kline and Coleman, 2010). Volk et al. (2006) found that fertilized and irrigated willow grown in 3-year rotations has yielded more than 10.8 dry tons per acre per year. Though irrigation may not be economically viable for willow plantations, the results demonstrate the tree’s yield potential. Trials with irrigation in New York have produced yields of 3.4-4.6 dry tons per acre per year in the first rotation, and the best-producing trees produced 18-62 percent more in the second rotation (Ruark et al., 2006). Relatively little work has been done with willow in terms of breeding improvements (Ruark et al., 2006), but specialized planting and harvesting equipment has already been developed (Walsh et al., 2003). Research and development could improve biomass yields from willow.
Black locust (Robinia pseudoacadia L.), sycamore (Platanus spp.), sweetgum (Liquidambar styraciflua L.), loblolly pine (Pinus taeda L.), and eucalyptus (Eucalyptus spp.) are other potential woody biomass crops. Black locust is native to the Southeastern United States and has many characteristics amenable to feedstock production. It has rapid initial growth and responds favorably to coppice management. It also is leguminous, so it can fix nitrogen from the atmosphere, even if the soil is of poor quality. Because of its drought tolerance, black locust is often used to prevent erosion or remediate soils (El Bassam, 2010). One study in Kansas found yields averaged 4.2 dry tons per acre per year over an 8-year cycle (King et al., 1998), while the yields in another Kansas study averaged over 3.15 dry tons per acre per year over a 6-year cycle (Geyer, 2006). Bongarten et al. (1992) found black locust yield to average 1.4-3.6 dry tons per acre per year over 3 years of growth in upland Georgia Piedmont. Yield growth from genetic improvement of black locust could be possible, but research in this area has not been a high priority (King et al., 1998), perhaps in part because the tree is susceptible to a borer insect, its growth does not compete with poplar over time, and it presently lacks a market (Kline and Coleman, 2010).
American sycamore (Platanus occidentalis L.) is native to the eastern half of the United States, though its habitat does not extend north into northern Wisconsin and Maine or south into Florida and southern Texas. A study in South Carolina found yields for American
sycamore to be 2.3 dry tons per acre per year (Davis and Trettin, 2006), and Kline and Coleman’s survey of forest practitioners (2010) reported 4.1 dry tons per acre per year. Steinbeck (1999) found that sycamore produced 5.6 dry tons per acre per year of woody biomass when managed intensively. However, though the rapid early growth of sycamore is an advantage for establishment, it is susceptible to disease and pests (Mercker, 2007; Kline and Coleman, 2010). It is tolerant of wet soil but cannot withstand drought conditions (Kline and Coleman, 2010). Therefore, though there is potential, more breeding advances are needed before sycamore can contribute substantially to woody biomass production.
Over the course of 7 years, yields of sweetgum (Liquidambar styraciflua L.) were similar to sycamore, though sweetgum has slower initial growth (Davis and Trettin, 2006). It grows in the warm, temperate climate of the Southeast under a variety of soil conditions and is tolerant of nutrient and water shortages. Kline and Coleman (2010) found yields averaged 2.7 dry tons per acre per year, though yields reached 4.1 dry tons per acre in trials. Davis and Trettin (2006) found average productivity ranged from 1.8 to 2.7 dry tons per acre per year; however, they postulated that yields would be closer to those found for poplar when yields beyond the seventh year were calculated. Respondents to Kline and Coleman’s survey (2010) suggested that sweetgum could be a promising candidate for biomass production because of its overall productivity and its tolerance of less than ideal growing conditions, even though it is hampered by its slow initial growth rate.
Though it is not a hardwood, some consider loblolly pine a candidate for bioenergy production (Kline and Coleman, 2010). Loblolly pine is fast growing and can tolerate a wide range of soils, though it prefers moderately acidic soil. Annual growth is substantially affected by the availability of water. A tree native to the Southeast, it is valued for its lumber and as a source of wood pulp and is already grown on more than 32 million acres of plantations. As reported by Kline and Coleman (2010), respondents suggested that loblolly pine could be a bioenergy crop because of its prevalence in the Southeast and the extensive research and management experience associated with it. They reported yields averaging 4.1 dry tons per acre per year. Other studies have found that commercial plantations yielded 0.45-2.25 dry tons per acre per year, but under intensive management, yields could be as high as 2.25-5.4 dry tons per acre per year (Jokela et al., 2004; Coyle et al., 2008). However, loblolly pine rotations are longer compared to hardwoods, and it is more likely to be a feedstock for thermochemical conversion than biochemical because chemicals in the pinewood impede biochemical conversion (Kline and Coleman, 2010).
Eucalyptus is not a native species to the United States, but its rapid growth makes it a strong contender for bioenergy cropping. With intensive management, Prine et al. (2000) found that Eucalyptus amplifolia has the potential to yield up to 11.2 dry tons per acre per year under ideal conditions in northeastern and perhaps northwestern Florida, while Eucalyptus grandis could yield as much as 16 dry tons per acre per year in central and southern Florida. E. grandis prefers sandy or organic soils (Stricker et al., 2000) and is productive on land previously mined for phosphate. It could be harvested after 3 years, with an additional five harvests every 3 years (Prine et al., 2000). Eucalyptus thrives under coppice management, and plantations may be productive from 10 to 25 years (Stricker et al., 2000). However, eucalyptus is not tolerant of frost, and therefore can only be grown in Florida and along the Gulf Coast (Kline and Coleman, 2010). A freeze-tolerant variety, which could expand the number of acres suitable for eucalyptus, has been developed through genetic engineering, but it has not been approved by USDA’s regulatory process (Hinchee et al., 2009).
Table 2-1 lists the advantages and limitations of woody crops for biomass production. The table is restricted to species in the Southeastern United States to allow easy comparison
| Species | Preferable Range | Advantages | Limitations |
| Sweetgum | Uplands throughout the Southeast | Native species Most adaptable hardwood across region Fairly well known/studied Improvement likely in medium term |
Moderate productivity Limited commercial experience |
| Eucalyptus | Florida and South Coastal Plain (hardiness zone 8b or higher to reduce freeze damage) | Highest growth rates Adaptable to marginal sites Multiple products/markets Improvement likely in near term | Exotic species Frost vulnerable Water requirements |
| Cottonwood and Poplar Hybrids | Alluvial bottomlands and low river terraces | Potential for high growth rates under right conditions Extensive genetic research Existing commercial stands Improvements likely in medium term |
Narrow site requirement Variable productivity Requires intensive management and inputs Not drought tolerant |
| Sycamore | Well drained bottomlands | Fast growing first 2 to 3 years (but not a recommended species with current cultivars) | Narrow site requirement Chronic disease problems Not drought tolerant |
| Loblolly Pine | Established pine plantations and native pine areas throughout region | Well developed operations (50+ years of intense research and development) with 13 × 106 hectares in the Southeastern United States Better productivity than most hardwoods on same sites Broad genetic potential Improvements ongoing |
Undesired traits for biochemical conversion to ethanol |
SOURCE: Kline and Coleman (2010). Reprinted with permission from Elsevier.
because the Southeast is a favorable location for the majority of candidate species. However, the use of woody crops is not necessarily limited to this region. Woody bioenergy crop development is likely to use different species in different regions, favoring the ones that grow the quickest with few inputs within a particular region. There is potential to obtain woody biomass from many kinds of tree and shrub species, but some technological challenges have to be resolved. Otherwise, conversion of woody biomass is costly and limited to a few species.
Forest Resources
Forests with the highest productivity in the United States are concentrated in the Pacific Northwest (Figure 2-12). However, many of the productive forests in the Pacific Northwest are federally owned, and the definitions of renewable biomass in the Energy Independence and Security Act (EISA) of 2007 exclude biomass harvested from federal lands (Chapter 1). Figure 2-13 shows forestland under private ownership. Because the Southeast has high productivity, mostly private ownership, and a large number of existing tree plantations, this region is expected to supply much of the woody biomass feedstock for biofuel production. Other regions could also contribute, but given lower growth or public ownership, they are likely to supply modest quantities.
EISA also limits which forest products can be used for cellulosic biofuel that qualify under the mandate. (See Chapter 1 for EISA’s definition of renewable biomass.) EISA limits
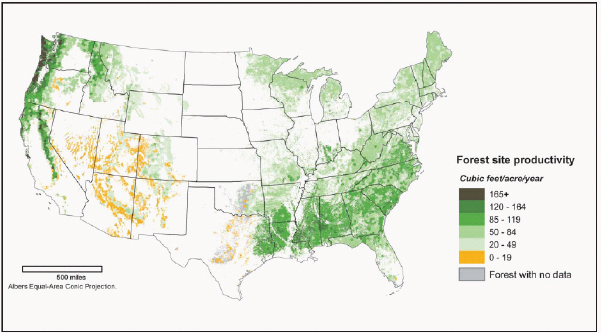
FIGURE 2-12 Net primary forest productivity in the conterminous United States.
SOURCE: Perry et al. (2007).
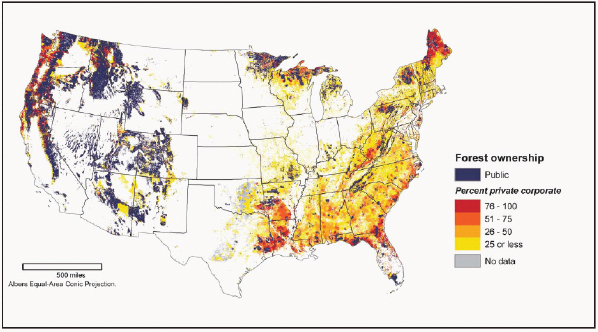
FIGURE 2-13 Forestland in the conterminous United States by ownership category.
SOURCE: Perry et al. (2007).
use from tree plantations to those established on or before December 19, 2007. According to Smith et al. (2009), there were approximately 50 million acres of planted timberland in the United States in 2007. About 80 percent of this planted land, however, is located in the southern United States. The definition of “planting” is restricted to include only activities where humans have physically planted a large proportion of the trees. One exception is made for coppice practices, whereby trees are regenerated from the sprouts of the previous generation of tree trunks. Use of natural regeneration techniques, such as the use of seed trees (as is the standard with hardwood forest management) or stand establishment with advanced regeneration in the understory, does not fit the EISA definition of “planting.” The definition discourages the establishment of new plantations for biofuel purposes.
Although the law might have intended to limit the clearing of native forests for plantations to support biofuel production, it could increase competition for wood products because existing plantations are typically already dedicated for other wood products such as saw wood or pulp. This increase in competition for wood products would increase timber prices and spur new investments in plantations. These new softwood plantations in the Southeast, in turn, would displace natural hardwood stands (Sohngen and Brown, 2006). Thus, despite the intent of the law, there could be some negative consequences associated with increased biofuel production from wood.
Tree residues from logging operations on plantations fitting the definition are included in the definition of renewable biofuels. Also included, however, are residues from subsequent milling operations, as long as these residues are not mixed with other chemicals or materials during manufacturing. Slash from other logging operations and precommercial thinning can be used for biofuel production for meeting RFS2 as long as the material is obtained from nonfederal forestlands and as long as the material is not from old-growth forests. This definition effectively allows material from nonplanted forests that are harvested for traditional forestry purposes, including final harvests and thinning operations. Supply of residues might not be consistent throughout the year; for example, snowy regions often have “spring breakup” times when logging trucks cannot operate on many roads to prevent spring thaw-related damage.
Municipal Solid Waste
Municipal solid wastes (MSWs) contain paper, paperboard, textiles, wood, yard trimmings, and food scraps, which are biological material that could be used to generate bioenergy. In 2009, the United States generated 243 million tons of MSW, 165 million tons of which were the aforementioned biological material (EPA, 2010a). At the time this report was written, most municipalities paid for the collection and disposal of MSW. Many locations have recycling programs where most of the higher value portions of the waste stream, such as metals, paper, and plastic, are separated from the bulk trash and recycled. In 2009, the proportion of recovered biological materials were 62-percent paper and paperboard, 15-percent textiles, 14-percent wood, 2.5-percent food, and 60-percent yard trimmings (EPA, 2010a). The remainder of the waste stream is either landfilled or incinerated. Increasing recovery of biological waste stream can provide opportunities for using MSW as biofuel feedstocks (Milbrandt, 2005; Perlack et al., 2005; NAS-NAE-NRC, 2009). If MSW were to be used as biofuel feedstock, the quantity supplied would likely be highest close to urban centers with large populations.
There are two major barriers to the conversion of MSW to liquid transportation fuels. First, many large cities that have large volumes of MSW (to achieve economy of size) installed trash incinerators over the last 25 years to recover the energy in the MSW and to
reduce the economic and environmental impact of their MSW. Any new biofuel facility for MSW would compete economically with the existing incineration facilities. Second, MSW is a mixed stream that is highly heterogeneous. Not all metals and plastics can be economically removed from the waste stream. There will always be some nonbiogenic material in MSW. It will also contain food wastes that have microorganisms that could contaminate a biochemical conversion plant. MSW would probably have to be sterilized before being used in a biochemical conversion process. It will also contain some level of toxic substances, such as mercury in batteries, pesticide residues, and paints.
MSW might be better suited for a thermochemical conversion process; however, this technology is still in development. Because of the potential contamination issues, thermochemical conversion technologies will most likely be developed using “cleaner,” more uniform feedstocks such as wood or switchgrass. Once the technology is mature, MSW would become an attractive feedstock.
Storage and Delivery of Cellulosic Feedstocks
Most agricultural biomass production (with the exception of forest products) is seasonal and results in a large volume of feedstock material being generated, transported, and stored at the refining facility in a short timeframe. Yet, the refinery facility needs to produce biofuels throughout the year to maximize productivity and prevent degradation of its biofuel product. Corn stover, switchgrass, and other similar materials are harvested during a short period in the fall and would have to be stored for year-round supply to a biorefinery. They are usually baled when collected for transport and can be stored near the field or biorefinery. Based on the feedstock type and storage location, infrastructure or action might be needed to control moisture of any biomass feedstocks and ensure adequate long-term storage. Loss of dry matter is a primary concern of storing biomass feedstocks. It could vary from 1-percent loss each year in cool regions with low humidity and rainfall to 25-percent loss each year in warm regions with high humidity and rainfall (Hess et al., 2007). Moisture control in storage facilities has to be adjusted to accommodate varying volumes of feedstock. Research also suggested that dry-matter loss depends on how biomass is stored. For example, switchgrass stored as round bales was reported to have lower dry-matter loss than switchgrass stored as rectangular bales in the Southeast (Larson et al., 2010).
Transporting cellulosic feedstock over long distances to biorefineries might not be economically feasible because biomass is bulky and has about one-third of the energy density of crude oil. To avoid transporting bulky biomass, some researchers have suggested setting up regional preprocessing infrastructure to clean, sort, chop or grind, control moisture, densify, and package the feedstocks before transporting them to biorefineries. Pretreatment could be carried out at the preprocessing centers if biomass is to be converted to fuels via biochemical pathways (Carolan et al., 2007). Torrefaction and liquefaction using pyrolysis or other thermochemical techniques also have been proposed to reduce moisture and break down some of the biomass ultrastructure (Sadaka and Negi, 2009; Yan et al., 2009). In the case of torrefaction, a dense “bale” of solid biomass can be produced on-site. Torrefaction and pyrolysis are only suitable for feedstocks for thermochemical conversion to fuel. This biomass “bale” could enable more energy-dense materials to be transported, increasing the efficiency of the delivery system, while reducing the water content of the material—a key issue with conversion and processing costs. Liquefaction, on the other hand, involves producing pyrolytic or other thermochemically derived liquid from biomass in the field and transporting this intermediate material to the refinery either by tanker truck, rail, barge, or pipeline (Pootakham and Kumar, 2010). Only small trials of these technologies have been
conducted. Large-scale, in-the-field processing has yet to be fully realized, and there could be significant energy, infrastructure, and economic barriers to deployment.
In contrast, MSW is available year-round and forest resources can be harvested year-round so that long-term storage might not be necessary. In addition, reducing woody biomass to wood chips on-site for volume reduction is necessary prior to transport to another location and is also a well-established technology.
Conversion Technologies
Two types of technology are likely to be used to convert cellulosic biomass to fuels to meet the Renewable Fuel Standard: biochemical and thermochemical conversion (NAS-NAE-NRC, 2009).
Biochemical Conversion
Biochemical pathways for converting cellulosic biomass into fuels follow the generalized process of pretreatment to release carbohydrates from the lignin shield, breaking down cellulose and hemicellulose to release sugars, fermentation of sugar to ethanol, distillation to separate the ethanol from the dilute aqueous solution, and conversion of the residue to electricity (Figure 2-14). The release of sugars from cellulose and hemicellulose is often incomplete because physical and chemical associations between the major components in biomass hinder the hydrolysis of cellulose into fermentable sugars (Alvira et al., 2010). To
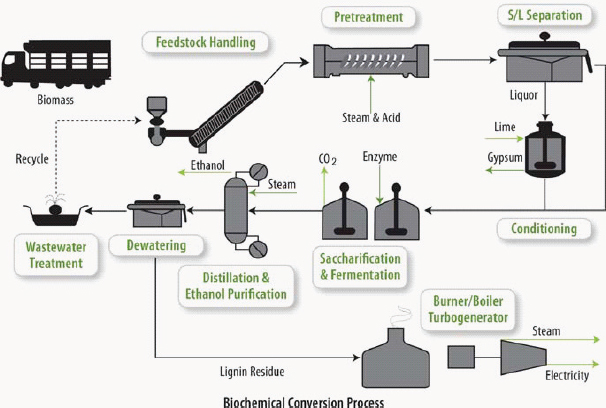
FIGURE 2-14 Model of a lignocellulosic-based ethanol biochemical refinery.
SOURCE: Foust et al. (2009). Reprinted with permission from Springer-Verlag.
address this issue, several pretreatment pathways have been investigated (Eggeman and Elander, 2005; Mosier et al., 2005; Yang and Wyman, 2007; Sendich et al., 2008). Given the variability in composition of different feedstocks, not all pretreatment pathways yield the desired results. For instance, alkaline-based pretreatment for the removal of lignin was shown effective in agricultural residues, such as stover, but not a good choice for softwood species (Chandra et al., 2007). Acid pretreatment has resulted in improvements in hydrolysis of nearly all biomass feedstocks into sugars, but the toxicity of the compounds derived from these reactions affects the fermentation steps (Oliva et al., 2003), increases the cost of processing, and increases the environmental impact by requiring neutralization and disposal of byproducts. Because of the severity of the pretreatment steps, the resulting sugar streams are not homogeneous, can undergo degradation, and result in enzyme and fermentation compatibility issues with the fermenting organisms (Alvira et al., 2010).
After pretreatment, cellulolytic enzymes are used to hydrolyze the cellulose polymers to 5-carbon and 6-carbon sugars (xylose and glucose). Unlike glucose, xylose is not readily fermented to ethanol. Yeasts or bacteria have been genetically modified or metabolically engineered to ferment both glucose and xylose to enhance yield of ethanol from cellulose (Aristidou and Penttila, 2000; Sonderegger et al., 2004; Nevoigt, 2008). The challenge is to develop glucose- and xylose-fermenting microorganisms that can withstand antimicrobial agents released during the pretreatment and hydrolysis steps and that are not inhibited by high alcohol concentrations.
Distillation in cellulosic ethanol production is the same as that in corn-grain ethanol production. Solids from different portions of the conversion process can be concentrated by centrifugation and burned in a boiler to generate steam and electricity for the biorefinery, particularly if the feedstock is rich in lignin.
Thermochemical Conversion
The mechanisms of thermochemical conversion include high temperature, pressure, chemicals, and catalysts to transform lignocellulosic biomass into many different products, including ethanol, butanol, green diesel, super diesel, Fischer-Tropsch (F-T) liquids, pyrolysis oils, and green gasoline (see Figure 2-15 for an example). The most advanced technologies include gasification to produce syngas followed by F-T synthesis or methanol synthesis, and pyrolysis or liquefaction to bio-oil followed by catalytic upgrading. Thermochemical conversion processes are not as feedstock-specific as biochemical conversion, allowing for a wide range of biomass feedstock to be used in its processing; this provides opportunities for refineries to be built in any location where adequate biomass can be produced to maintain their operations.
Gasification
Gasification is a process in which biomass (or other carbon-containing feedstock) reacts with limited oxygen (or air) and steam at high temperatures to produce syngas (Huber et al., 2006). The syngas is then conditioned to remove impurities and shifted to desired ratio of hydrogen to carbon monoxide (CO). The clean synthesis gas can be used to produce ethanol (Figure 2-16), whereby the anaerobic bacterium Clostridium ljungdahlii ferments syngas into ethanol (Huber et al., 2006). Alternatively, the synthesis gas can be used in F-T reactors to produce liquid hydrocarbon fuels using cobalt, iron, or ruthenium catalysts. The F-T technology has been used commercially for over 50 years and produces fuels that are compatible with conventional petroleum products. The gasification of biomass, however,
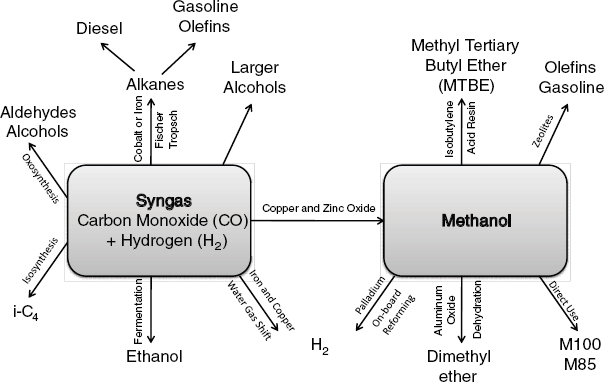
FIGURE 2-15 Thermochemical conversion pathways and products.
SOURCE: Adapted from Spath and Dayton (2003).
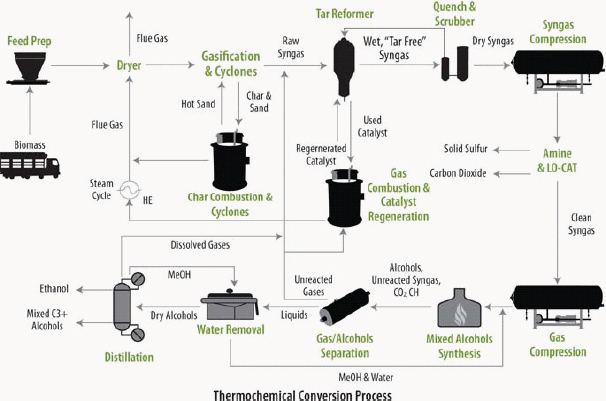
FIGURE 2-16 Schematic diagram of a thermochemical conversion refinery to produce ethanol.
SOURCE: Foust et al. (2009). Reprinted with permission from Springer-Verlag.
has proven to be more difficult than coal or natural gas gasification (Huber et al., 2006; NAS-NAE-NRC, 2009).
Gasification and upgrading of syngas into liquid “drop-in” fuels has been done successfully at the pilot scale using various feedstocks. Various manufacturers in Europe and North America have recently entered the market as equipment suppliers, including over 50 companies offering various gasification configuration options (Balat et al., 2009). Catalysts for F-T synthesis are well developed for coal gasification systems but have not demonstrated long-term performance when applied to biomass. Small quantities of contaminants in the syngas stream can render catalyst beds inactive, and scrubbing and cleaning gas processes are costly and yet to be fully deployed.
Fast Pyrolysis and Liquefaction
Pyrolysis, a process that uses high temperature under anaerobic conditions, breaks down biomass into a volatile mixture of hydrocarbons. This mixture of hot gases is condensed into a bio-oil. Several commercial-scale pyrolysis facilities are currently in operation; however, these are lower severity processes designed to produce specialty chemicals, not fuels. A number of public and privately funded organizations are actively developing fast pyrolysis technologies for fuel production. In fast pyrolysis, small biomass particles are mixed with hot solids to rapidly heat the biomass and thermally decompose its components. The solid can either be inert or have catalytic properties. The hot vapors are separated from the solids and cooled to condense a liquid phase (bio-oil), and the noncondensable gases along with the solid char are burned to supply heat for the process. The raw bio-oil is an emulsion, rendering it incompatible with conventional petroleum oils and requiring additional upgrading. The most frequently proposed upgrading technology is hydrotreating. Although hydrotreating is a well-established petroleum refining technology, little commercial experience exists for upgrading pyrolysis oils.
Liquefaction of biomass also produces bio-oil, but through controlled reaction rates and reaction mechanisms using pressure, gases, and catalysts. Catalysts used for upgrading liquefaction products include alkali, metals, and nickel and ruthenium heterogeneous catalysts. Opportunities in nascent technologies exist in the form of liquefaction of biomass for production of bio-oil, including the use of hydrothermal technologies. Hydrothermal liquefaction uses subcritical or supercritical water to liquefy biomass into a bio-oil. Elevated temperatures (200-600°C) are used in a pressurized vessel containing biomass (5-40 MegaPascals), de-polymerizing and converting cellulose, lignin, and hemicellulose into a soluble mixture that can be upgraded and processed in similar fashion as pyrolytic based bio-oil (Elliott et al., 1991; Demirbas, 2009). Liquefaction with other supercritical fluids has been shown to overcome successfully many of the pyrolytic bio-oil processing shortcomings for stover and wood. Methanol reaches supercritical conditions at milder temperatures (238°C) and pressures (8 MegaPascals) than water. Liquefaction with methanol is almost half as energy intensive as pyrolysis (500°C), resulting in conversion of solid biomass into a bio-oil in excess of 90 percent on a weight-by-weight basis (Demirbas, 2000; Balat, 2008; Soria et al., 2008). The use of a single step system is favored in the long run as it will require less operational and infrastructure complexity. The primary advantage of these liquefaction systems is that they do not require pretreatment and can work with high-moisture biomass feedstocks and MSW streams. Current technical barriers include residence times for high liquefaction to occur on certain feedstocks and batch or semi-batch processing, resulting in limited throughput and scalability issues.
Bio-oil has poor volatility, high viscosity, coking, corrosiveness, and poor cold-flow properties (Huber et al., 2006) and would have to be upgraded if it were to be used as
transportation fuel. It can be upgraded to fuels in the gasoline and diesel range by hydrodeoxgenation or zeolite upgrading—processes similar to the ones used by current petroleum refining (Huber et al., 2006; Roberts et al., 2010). Catalytic upgrading reduces the oxygen level of the bio-oil and increases the hydrogen proportion, leading to the production of saturated C-C bonds that are fully compatible with petroleum infrastructure and use. Catalyst effectiveness and stability are areas of intense research and development; many companies are experimenting with proprietary technology that could prove to be commercially feasible and meet environmental standards. Catalysts can be easily rendered inactive by deposition of coke and tars, and represent an operational cost and environmental problem, as regeneration of catalysts might involve a combination of high temperature and use of organic solvents and produce a waste stream and evaporative emissions. Alternatively, the bio-oils can be used to produce syngas via steam reforming. The syngas can then be used to produce transportation fuels using F-T synthesis as discussed earlier (Huber et al., 2006).
Products and Coproducts
Because of the large scale of biofuel production, sizeable quantities of coproducts will be produced. Therefore, the market for coproducts would have to complement the quantities produced for the coproducts to maintain value. Coproducts of ethanol production from lignocellulosic feedstock through biochemical conversion are rich in lignin and not suitable as animal feedstuffs. Many proposed lignocellulosic ethanol plants include a boiler and turbogenerator system to convert residue to electricity. Other potential coproducts in early stages of development are bioplastic (Snell and Peoples, 2009) and a performance enhancer in asphalt binder (McCready and Williams, 2008).
As discussed above, the products and coproducts of thermochemical conversion of lignocellulosic feedstock depend on the processes used. F-T liquids include paraffinic diesel that can be refined to high-quality diesel or jet fuel and naphtha that requires substantial refining to produce high-octane gasoline. Coproducts of F-T liquids include ash from the gasifier, CO2, and some light hydrocarbon gases. Some pyrolysis processes a coproduct that is a solid (biochar) that has been proposed as a potential carbon sequestration mechanism and soil amendment (Roberts et al., 2010).
Distribution and Use
Ethanol
Delivery and use of cellulosic ethanol is the same as corn-grain ethanol (discussed earlier). Although all ethanol is the same regardless of source, EISA puts an additional accounting burden on the final blenders of ethanol-containing gasoline. There are separate requirements for “advanced renewable fuels” that can be met by the use of cellulosic ethanol. Therefore, these new ethanol sources require separate accounting from the existing ethanol sources. The additional accounting might not require new physical equipment, but it will definitely require additional labor and accounting software.
F-T Liquids
F-T diesel and gasoline are compatible with existing fuel infrastructure, and they could be used in combustion engines in conventional vehicles. Introduction of biomass-sourced F-T product would have little impact on refinery operations. The relative amounts of
naphtha, jet fuel, diesel, and heavier material in the stream would affect crude-unit yields and downstream unit rate. The F-T material itself, however, is high quality with essentially no heteroatoms. The naphtha is paraffinic and does not reform well but can be included as a component of reformer feedstock or sold as a petrochemical feedstock. With the exception of fluidity properties, distillate range F-T products are excellent jet fuel and diesel components. The heavy F-T product readily cracks in either an FCC unit or a hydrocracker.
F-T products have already been approved as a jet fuel component at levels up to 50 percent of the fuel. Therefore, coprocessing F-T products with conventional crude oil would not disqualify jet fuel produced from the blend. The poor cold-flow properties of both jet fuel and diesel fuel will reduce the maximum end point of both products and reduce the amounts that can be recovered from the conventional crude oil. Processing the F-T product in a separate crude unit would give the refinery additional operating and blending flexibility.
Pyrolysis Oil
Typical raw, biobased pyrolysis oils are a wide boiling-range mixture of hydrocarbons that contain a significant amount of heteroatoms such as oxygen and nitrogen. Most refineries could process a small amount of this material as an alternate crude source; however, processing significant quantities would require major refinery modifications. Including even small amounts of pyrolysis oils in a refinery crude mix could cause operational problems. These oils are unstable and easily form gums even without being exposed to air. These gums can cause fouling in the crude-unit preheat train and in downstream units. They also contain some acidic components that can increase equipment corrosion rates.
The yields of the various pyrolysis components depend strongly on the type of biomass fed to the unit as well as pyrolysis conditions. The refiner that receives these oils has to treat them as an alternate crude source. That is, the refiner has to know what yields to expect and the qualities of the various cuts that will exit the crude unit. The pyrolysis oils will increase the hydrogen consumption on the naphtha pretreater and the distillate hydrotreater and require an increase in severity to remove the additional heteroatoms. Thermally derived oils generally make poor FCC feedstocks, so the FCC yields from the heavy portion of the pyrolysis oil could be low.
Biobased pyrolysis oils are not yet approved for use as a constituent of jet fuel. Tests are currently in progress for several different oils, but until pyrolysis oils are approved, inclusion of these oils in the crude-unit feedstock or the feedstock to any other unit that produces jet fuel will disqualify all potential jet fuel from that unit. The refiner might install a separate small distillation unit to segregate the biobased oils from the rest of the refinery products to keep them out of jet fuel. The separate crude unit would also allow the refiner to use upgraded metallurgy to minimize corrosion issues. Preheat train fouling would also be limited to this smaller unit and would not impact overall refinery operation. Desalting of the pyrolysis oil could increase the load on the wastewater treatment facility.
The miscibility of pyrolysis oils is a function of the pyrolysis severity. Severities that give high yields of pyrolysis oils produce materials that are immiscible with conventional petroleum streams. They cannot be blended with any refiner stream, either finished products or intermediate streams. Therefore, their upgrading for blending with gasoline or diesel fuel would require a new dedicated upgrading unit either at the pyrolysis unit or in the refinery.
Status as of 2010
As of 2010, small quantities of cellulosic biofuels were marketed commercially in the United States. Several companies are operating demonstration facilities or constructing commercial demonstration plants to convert cellulosic biomass to ethanol via biochemical conversion (Biofuels Digest, 2010a).
In Canada, Iogen has been operating its cellulosic ethanol demonstration plant in Ottawa (Tolan, 2004). It has been using wheat straw to produce ethanol since 2004 and had not reached full capacity as of 2010 (Table 2-2). The facility has an annual capacity of 482,000-584,000 gallons and can receive up to 30 dry tons of feedstock per day (Iogen, 2010b). Iogen is developing a commercial-scale plant in Saskatchewan, Canada. As a comparison, most corn-grain ethanol biorefineries operating in 2010 have nameplate capacity of over 40 million gallons per year (RFA, 2010).
Several companies are investigating pilot-scale plants in the United States and hope to scale them up to commercial-size plants by 2011-2012, as shown in Table 2-3. Among those companies listed, about half of them plan to produce ethanol via biochemical conversion (Figure 2-17). Thirty-eight percent of the companies plan to produce drop-in fuels using algae or cellulosic biomass as feedstocks (Figure 2-18). Operating experience from demonstration plants will help to confidently design a commercial-scale facility. DOE provided $564 million from the American Recovery and Reinvestment Act (111 P.L. 5) to 19 selected advanced biofuel projects to support the construction and operation of pilot, demonstration, and commercial-scale facilities (Table 2-4).
For cellulosic biofuels to become cost-competitive with petroleum products, significant improvements in the associated technologies will have to be achieved. These technologies include improved ways to produce biomass and much more cost-effective conversion technologies. Conversion technologies include both thermochemical and biochemical approaches. Strong incentives such as RFS2 have led to significant investments in research, development, and deployment by both public and private sponsors in the United States and overseas. These investments are expected to bear fruit in the 5- to 10-year framework, but it is doubtful that they could make biofuels cost-competitive without subsidies, unless the price of oil rises substantially or a disruptive innovation15 for biofuel production is developed.
Growing biomass and converting the feedstock is subject to well-understood, inherent physicochemical constraints. Technology advances can get closer to the theoretical limits but cannot change the limits imposed by physics and chemistry. For example, successful
TABLE 2-2 Ethanol Production from the Iogen Demonstration Facility in Ottawa, Canada, 2005-2010
| Year | Ethanol (gallons) | ||
| 2005 | 34,223 | ||
| 2006 | 4,441 | ||
| 2007 | 686 | ||
| 2008 | 54,558 | ||
| 2009 | 153,495 | ||
| 2010 | 134,406 | ||
DATA SOURCE: Iogen (2010a).
______________
15 A term used in business and technology that refers to innovation that improves the product (typically by lowering the price of product substantially) that the market does not expect.
TABLE 2-3 Companies That Have Secured Funding for Demonstration of Nonfood-Based Biofuels
| Estimated Production (million gal/yr) | ||||||||||
| Company | Location | Feedstock | Conversion Technology | Product | 2010 | 2011 | 2012 | 2013 | 2014 | 2015 |
| Abengoa | Hugoton, KS | Corn stover, sorghum stubble, switchgrass | Cellulosic feedstock Biochemical | Ethanol | 0 | 0 | 0 | 15 | 15 | 15 |
| ADM | Decatur, IL | Corn stover | Cellulosic feedstock Biochemical | Ethanol | 0 | 0 | 1 | 1 | 1 | 1 |
| AE Biofuels | Butte, MT | Switchgrass, straw, corn stover, bagasse | Cellulosic feedstock Biochemical | Ethanol | 0.02 | 0.05 | 10.04 | 10.5 | 10.5 | 10.5 |
| AltAir | Anacortes, WA | Camelina | Thermochemical | Drop-in fuel | 0 | 0 | 100 | 100 | 100 | 100 |
| American Process | Alpena, MI | Woody biomass | Cellulosic feedstock Biochemical | Ethanol | 0 | 0.89 | 0.89 | 0.89 | 0.89 | 0.89 |
| Amyris | Emeryville, CA | Sweet sorghum | Cellulosic feedstock Biochemical | Drop-in fuel | 0.01 | 0.02 | 1.02 | 27.02 | 27.02 | 27.02 |
| Aquatic Energy | Not specified, LA | Algae | Oil extraction | Oil feedstock | 0 | 0.03 | 0.03 | 0.03 | 0.03 | 0.03 |
| Aurora Algae | Vero Beach, FL | Algae | FAME | Drop-in fuel | 0.01 | 0.01 | 0.5 | 0.5 | 0.5 | 0.5 |
| BioProcess Algae | Shenandoah, IA | Algae | FAME | Drop-in fuel | 0 | 0.01 | 0.01 | 0.01 | 0.01 | 0.01 |
| BlueFire Renewables | Lancaster, CA | Woody biomass | Cellulosic feedstock Biochemical | Ethanol | 0.01 | 3.91 | 3.91 | 22.91 | 22.91 | 22.91 |
| BP Biofuels | Jennings, LA | Wheat, switchgrass |
Cellulosic feedstock Biochemical | Ethanol | 1.4 | 1.4 | 37.4 | 37.4 | 37.4 | 37.4 |
| Buckeye Technologies/UF |
Perry, FL | Woody biomass, sugarcane |
Cellulosic feedstock Biochemical | Ethanol | 0 | 0.01 | 0.01 | 0.01 | 0.01 | 0.01 |
| Clearfuels | Not specified, HI | Bagasse, woody biomass | Thermochemical, Fischer-Tropsch |
Drop-in fuel | 0 | 0 | 0 | 0 | 0 | 18 |
| Estimated Production (million gal/yr) | ||||||||||
| Company | Location | Feedstock | Conversion Technology | Product | 2010 | 2011 | 2012 | 2013 | 2014 | 2015 |
| Clearfuels | Commerce City, CO | Woody biomass, corn stover, bagasse | Thermochemical, Fischer-Tropsch |
Drop-in fuel | 0 | 0.07 | 0.07 | 0.07 | 0.07 | 0.07 |
| Clearfuels | Collinswood, TN | Woody biomass | Thermochemical, Fischer-Tropsch |
Drop-in fuel | 0 | 0 | 0 | 0 | 20 | 20 |
| Cobalt | Sausalito, CA | Woody biomass | Cellulosic feedstock Biochemical | Drop-in fuel Biobutanol | 0.01 | 2.01 | 102 | 102 | 102 | 102 |
| Coskata | Green County, AL | Woody biomass | Cellulosic feedstock Biochemical | Ethanol | 0.05 | 0.05 | 55.05 | 55.05 | 55.05 | 55.05 |
| DDCE | Vonore, TN | Corn stover, switchgrass | Cellulosic feedstock Biochemical | Ethanol | 0.25 | 0.25 | 0.25 | 0.25 | 0.25 | 0.25 |
| Dynamic Fuels | Geismar, LA | Animal fats, tallow, and vegetable oils | Thermochemical | Drop-in fuel | 75 | 75 | 75 | 75 | 75 | 75 |
| Fiberight | Blairstown, IA | Organic-based MSW |
Cellulosic feedstock Biochemical | Ethanol | 0.01 | 6 | 6 | 6 | 6 | 6 |
| Fulcrum | Reno, NV | Organic MSW | Thermochemical, gasification |
Ethanol | 0.01 | 0.01 | 10.51 | 10.51 | 10.51 | 10.51 |
| Gevo | St Joseph, MO | Corn, sugar cane, sugar beets | Cellulosic feedstock Biochemical | Drop-in fuel Biobutanol | 1 | 1 | 16 | 300 | 300 | 300 |
| Green Star Products | To be determined, UT | Algae | FAME | Drop-in fuel | 0 | 0 | 2 | 2 | 2 | 2 |
| Haldor Topsoe | Des Plains, IL | Woody biomass | Cellulosic feedstock Thermochemical | Drop-in fuel | 0 | 0 | 0.8 | 0.8 | 0.8 | 0.8 |
| HCL Clean Tech | Durham, NC | Woody biomass | Cellulosic feedstock Biochemical | Ethanol | 0 | 0.01 | 0.01 | 0.01 | 0.01 | 0.01 |
| Estimated Production (million gal/yr) | ||||||||||
| Company | Location | Feedstock | Conversion Technology | Product | 2010 | 2011 | 2012 | 2013 | 2014 | 2015 |
| IneosBIO | Vero Beach, FL | Organic-based MSW |
Gasification- Fermentation |
Ethanol | 0 | 8 | 8 | 8 | 8 | 8 |
| Joule | Leander, TX | Algae | FAME | Drop-in fuel | 0.01 | 0.01 | 0.01 | 0.01 | 0.01 | 0.01 |
| Kent BioEnergy | Mecca, CA | Algae | Oil extraction | Oil feedstock | 0.01 | 0.01 | 0.01 | 0.01 | 0.01 | 0.01 |
| KiOR | Columbus, MS | Woody biomass | Thermochemical, pyrolysis |
Drop-in fuel | 0.23 | 0.23 | 0.23 | 80 | 80 | 120 |
| KL Energy | Upton, WY | Sugarcane, bagasse, woody biomass | Cellulosic feedstock Biochemical | Ethanol | 0 | 1.3 | 1.3 | 1.3 | 1.3 | 1.3 |
| LiveFuels | To be determined | Algae | FAME | Drop-in fuel | 0.01 | 0.01 | 0.01 | 0.01 | 0.01 | 0.01 |
| Logos Technologies | Visalia, CA | Switchgrass, corn stover, woody biomass | Cellulosic feedstock Biochemical | Ethanol | 0 | 0 | 0.8 | 0.8 | 0.8 | 0.8 |
| LS9 | Okeechobee, FL | Sugar cane | Cellulosic feedstock Biochemical | Drop-in fuel | 0.1 | 10.1 | 10.1 | 10.1 | 10.1 | 10.1 |
| Mascoma | Rome, NY | Switchgrass, woody biomass, ag waste | Cellulosic feedstock Biochemical | Ethanol | 0.2 | 0.2 | 0.2 | 20.2 | 20.2 | 20.2 |
| Murphy Oil | Hereford, TX | Organic-based MSW |
Cellulosic feedstock Biochemical | Ethanol | 0 | 0 | 115 | 115 | 115 | 115 |
| PetroAlgae | Fellsmere, FL | Algae | Biochemical and thermochemical | Drop-in fuel | 0.12 | 0.12 | 70.12 | 140.12 | 210.12 | 210.12 |
| Phycal | Central Oahu, HI | Algae | Oil extraction | Oil feedstock | 0 | 0.01 | 0.01 | 0.01 | 0.01 | 0.01 |
| POET | Emmetsburg, IA | Corn stover | Cellulosic feedstock Biochemical | Ethanol | 0.02 | 0.02 | 25.02 | 25.02 | 25.02 | 25.02 |
| Estimated Production (million gal/yr) | ||||||||||
| Company | Location | Feedstock | Conversion Technology | Product | 2010 | 2011 | 2012 | 2013 | 2014 | 2015 |
| Powers Energy | Lake County, IN | Organic-based MSW |
Gasification- Fermentation |
Ethanol | 0 | 0 | 0 | 160 | 160 | 160 |
| Range Fuels | Soperton, GA | Woody biomass | Thermochemical, gasification |
Methanol and ethanol | 4 | 4 | 4 | 20 | 20 | 20 |
| REII | Toledo, OH | Woody biomass, rice hulls, corn stover, straw, switchgrass | Thermochemical, Fischer-Tropsch |
Drop-in fuel | 0.02 | 0.02 | 0.35 | 0.35 | 0.35 | 0.35 |
| Rentech | Rialto, CA | Woody biomass, corn stover, straw, bagasse, organic MSW | Thermochemical, Fischer-Tropsch |
Drop-in fuel | 0.15 | 0.15 | 0.15 | 8.15 | 259 | 259 |
| Sapphire Energy | Columbus, NM | Algae | Thermochemical | Drop-in fuel | 0.02 | 0.02 | 0.02 | 0.02 | 0.02 | 0.02 |
| Solazyme | South San Francisco, CA | Algae | Thermochemical | Drop-in fuel | 0.1 | 0.15 | 100.1 | 100.1 | 100.1 | 100.1 |
| Solix | Durango, CO | Algae | FAME | Drop-in fuel | 0.01 | 0.01 | 0.01 | 0.01 | 0.01 | 0.01 |
| Terrabon | Bryan, TX | Woody biomass, sweet sorghum |
Cellulosic feedstock Biochemical | Drop-in fuel | 0.1 | 0.1 | 1.25 | 5 | 25 | 25 |
| ThermoChem Recovery (TRI) | Durham, NC | Woody biomass | Thermochemical, Fischer-Tropsch |
Drop-in fuel | 0.01 | 0.01 | 0.01 | 0.01 | 0.01 | 0.01 |
| Trenton Fuel Works | Trenton, NJ | Organic-based MSW |
Cellulosic feedstock Biochemical | Ethanol | 0 | 0 | 0 | 0 | 3.87 | 3.87 |
| UOP-Aquaflow Bionomic | Hopewell, VA | Algae | Thermochemical | Drop-in fuel | 0 | 0.01 | 0.01 | 0.01 | 0.01 | 0.01 |
| Estimated Production (million gal/yr) | ||||||||||
| Company | Location | Feedstock | Conversion Technology | Product | 2010 | 2011 | 2012 | 2013 | 2014 | 2015 |
| Virent | Madison, WI | Sugar beets, corn stover, sugarcane, woody biomass, switchgrass |
Thermochemical | Drop-in fuel | 0.01 | 0.01 | 0.01 | 0.01 | 0.01 | 0.01 |
| ZeaChem | Boardman, OR | Woody biomass | Gasification- Fermentation |
Ethanol | 0.25 | 0.25 | 0.25 | 0.25 | 0.25 | 0.25 |
DATA SOURCE: Individual companies and Biofuel Digest (2010b).
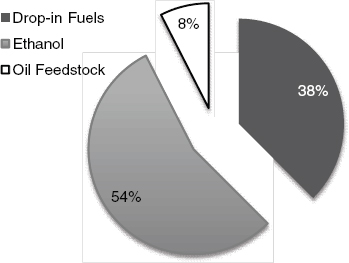
DATA SOURCE: Biofuels Digest (2010a).
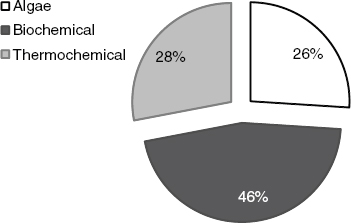
DATA SOURCE: Biofuels Digest (2010a).
application of fertilizers and pesticides has improved agricultural yields, but those improvements still operate within the same set of physicochemical constraints. Driven by high-technology tools from the physical sciences, including high-performance computing, genomics is producing a steady stream of results that have a huge potential to revolutionize many scientific fields, including those involved in the production of biofuels. Disruptive technologies work on processes subject to different constraints: that is, they operate under wider physicochemical boundaries, which may not turn out to be an advantage. Such a disruptive technology could happen in biotechnology because of the significant paradigm shift that biotechnology has undergone with the advances in genomics.
| Grantee | Location | DOE Grant Amount | Nonfederal Amount |
Feedstock Source | Description |
| Algenol Biofuels Inc. | Fort Myers, FL | $25,000,000 | $33,915,478 | Industrial CO2 | This project will make ethanol directly from carbon dioxide (CO2) and seawater using algae. The facility will have the capacity to produce 100,000 gallons of fuel-grade ethanol per year. |
| American Process Inc. | Alpena, MI | $17,944,902 | $10,148,508 | On-site mill-wood waste | This project will produce fuel and potassium acetate, a compound with many industrial applications, using processed wood generated by Decorative Panels International, an existing hardboard manufacturing facility in Alpena, MI. The pilot plant will have the capacity to produce up to 890,000 gallons of ethanol and 690,000 gallons of potassium acetate per year starting in 2011. |
| Amyris Biotechnologies, Inc. |
Emerville, CA | $25,000,000 | $10,489,763 | Ceres engineered crops | This project will produce a diesel substitute through the fermentation of sweet sorghum. The pilot plant will also have the capacity to coproduce lubricants, polymers, and other petrochemical substitutes. |
| Archer Daniels Midland | Decatur, IL | $24,834,592 | $10,946,609 | Corn stover within a 50-mile radius of refinery | This project will use acid to break down biomass which can be converted to liquid fuels or energy. The facility will produce ethanol and ethyl acrylate, a compound used to make a variety of materials, and will also recover minerals and salts from the biomass that can then be returned to the soil. |
| Clearfuels Technology Inc. | Commerce City, CO | $23,000,000 | $13,433,926 | Unknown | This project will produce renewable diesel and jet fuel from woody biomass by integrating ClearFuels’ and Rentech’s conversion technologies. The facility will also evaluate the conversion of bagasse and biomass mixtures to fuels. |
| Elevance Renewable Sciences |
Bolington, IL | $2,500,000 | $625,000 | Unknown | This project was selected to complete preliminary engineering design for a future facility producing jet fuel, renewable diesel substitutes, and high-value chemicals from plant oils and poultry fat. |
| Grantee | Location | DOE Grant Amount | Nonfederal Amount |
Feedstock Source | Description |
| Gas Technology Institute | Des Plains, IL | $2,500,000 | $625,000 | Algae from PetroSun and Blue Marble; 1 T wood from Johnson Timber; and corn stover from Cargill | This project was selected to complete preliminary engineering design for a novel process to produce green gasoline and diesel from woody biomass, agricultural residues, and algae. |
| Haldor Topsoe, Inc. | Des Plains, IL, | $25,000,000 | $9,701,468 | Wood from UPM, MN | This project will convert wood to green gasoline by fully integrating and optimizing a multistep gasification process. The pilot plant will have the capacity to process 23 dry tons of feedstock per day. |
| ICM, Inc. | St. Joseph, MO | $25,000,000 | $6,268,136 | Corn stover from Lifeline Foods; other feedstocks from unknown sources | This project will modify an existing corn-ethanol facility to produce cellulosic ethanol from switchgrass and energy sorghum using biochemical conversion processes. |
| Logos Technologies | Visalia, CA | $20,445,849 | $5,113,962 | Corn stover from Next Step Biofuels Inc.; switchgrass from Ceres; wood from central California facilities | This project will convert switchgrass and woody biomass into ethanol using a biochemical conversion processes. |
| Renewable Energy Institute International | Toledo, OH | $19,980,930 | $5,116,072 | Unknown | This project will produce high-quality green diesel from agriculture and forest residues using advanced pyrolysis and steam reforming. The pilot plant will have the capacity to process 25 dry tons of feedstock per day. |
| Solazyme, Inc. | Riverside, PA | $21,765,738 | $3,857,111 | Sucrose, MSW organics, or switchgrass from unknown sources | This project will validate the projected economics of a commercial scale biorefinery producing multiple advanced biofuels. This project will produce algal oil that can be converted to oil-based fuels. |
| UOP LLC | Kapolei, HI | $25,000,000 | $6,685,340 | Unknown | This project will integrate existing technology from Ensyn and UOP to produce green gasoline, diesel, and jet fuel from agricultural residue, woody biomass, dedicated energy crops, and algae. |
| Grantee | Location | DOE Grant Amount | Nonfederal Amount |
Feedstock Source | Description |
| ZeaChem Inc. | Boardman, OR |
$25,000,000 | $48,400,000 | Wood from Greenwood Resources | This project will use purpose-grown hybrid poplar trees to produce fuel-grade ethanol using hybrid technology. Additional feedstocks such as agricultural residues and energy crops will also be evaluated in the pilot plant. |
| Demonstration-Scale Projects (in alphabetical order) | |||||
| BioEnergy International, LLC | Clearfield County, PA | $50,000,000 | $89,589,188 | Corn from Lansing Trade Group, LLC | This project will biologically produce succinic acid from sorghum. The process being developed displaces petroleum-based feedstocks and uses less energy per ton of succinic acid produced than its petroleum counterpart. |
| Enerkem Corporation |
Pontoc, MS | $50,000,000 | $90,470,217 | Plant located in landfill site | This project will construct a facility that produces ethanol fuel from woody biomass, mill residue, and sorted municipal solid waste. The facility will have the capacity to produce 19 million gallons of ethanol per year. |
| INEOS New Planet BioEnergy, LLC | Vero Beach, FL | $50,000,000 | $50,000,000 | Locally sourced organic MSW | This project will produce ethanol and electricity from wood and vegetative residues and construction and demolition materials. The facility will combine biomass gasification and fermentation and will have the capacity to produce 8 million gallons of ethanol and 2 megawatts of electricity per year by the end of 2011. |
| Sapphire Energy, Inc. | Columbus, NM |
$50,000,000 | $85,064,206 | Onsite algae production | This project will cultivate algae in ponds that will ultimately be converted into green fuels, such as jet fuel and diesel, using the Dynamic Fuels refining process. |
| Increased Funding to Existing Biorefinery Projects | |||||
| Bluefire LLC | Fulton, MS | $81,134,686 | $223,227,314 | Unmerchantable timber and logging wastes from sites 75 to 100 mile radius from plant | This project will construct a facility that produces ethanol fuel from woody biomass, mill residue, and sorted municipal solid waste. The facility will have the capacity to produce 19 million gallons of ethanol per year. |
One potential feedstock source for biofuels that continues to be pursued is algae. The concept of converting algae to fuels has been investigated for over 30 years. For example, DOE operated the Aquatic Species Program (ASP) that was terminated in 1995 because its product was shown to be uncompetitive with petroleum. However, 1995 was also the year when the first genome of a free-living organism was sequenced, that of Haemophilus influenzae Rd (Fleischmann et al., 1995), a date considered a milestone in the advancement of genomics. Application of genomics or synthetic biology to algal biofuel production could lead to a technology that will be able to produce large quantities of biofuels at competitive costs.
The past 15 years have seen a significant amount of research in genomics that has created a foundation on which a whole new set of technologies have been based. This foundation has led to another foray into algal biofuel research and development. Significant public and private investments have been committed, such as $600 million from ExxonMobil.
OTHER FEEDSTOCKS AND PROCESSING TECHNOLOGIES IN DEVELOPMENT
The technologies for producing biofuels from algae and cyanobacteria and hydrocarbon fuels16 from biomass are discussed in the report Liquid Transportation Fuels from Coal and Biomass: Technological Status, Costs, and Environmental Impacts (NAS-NAE-NRC, 2009). Technologies for those biofuels are further from commercial deployment than cellulosic biofuels. Some examples of those biofuel refineries are included in Table 2-3.
Algal biofuels are attractive for many reasons. Algae and cyanobacteria can be cultivated in mass quantities in open ponds or in photoreactors. They would not necessarily compete with food for agricultural land or fresh water, and they would use CO2 as a feedstock. Several types of fuel potentially can be produced from algae and cyanobacteria, including biodiesel, ethanol, and hydrocarbons from various conversion pathways. The spectrum of research and development into algal biofuels is broad and covers both the use of naturally occurring and genetically modified (including entirely synthetic) organisms as well as engineering systems that involve open ponds, closed bioreactors, and combinations of both. Companies are building or operating pilot- and demonstration-scale facilities17 for cultivating algae and cyanobacteria and for converting them to biofuels (EMO, 2009). Algal and cyanobacterial biofuels have the potential to contribute to biofuels consumed in the United States in 2022, but the quantity and cost of production are highly uncertain and depend largely on the development of those industries in the next 5-10 years. The environmental effects of algal biofuel production are discussed in another NRC study on Sustainable Development of Algal Biofuels to be completed in 2012.
Production of hydrocarbon fuels directly from biomass is mostly in the research and development phase (Huber et al., 2005; Roman-Leshkov et al., 2007; Kunkes et al., 2008; Gürbüz et al., 2010). Some technological innovations might never reach the demonstration phase. Pilot and demonstration facilities need to be coupled with research and development programs to resolve issues identified during demonstration and to reduce costs (NAS-NAE-NRC, 2009). Commercial demonstrations are critical to proving and improving technologies, improving proficiency in technology operation, and quantifying the economics
______________
16 Fuels that are organic compounds that contains only carbon and hydrogen. Hydrocarbon fuels include petroleum and alkanes.
17 A pilot facility is a small processing facility that is operated to gather information. The National Renewable Energy Laboratory defines a pilot biofuel facility as one that processes 1-10 dry tons of feedstock per day.
at large commercial scales (Sagar and van der Zwaan, 2006; Katzer, 2010). Demonstration, scaling up, and learning-by-doing takes time and, therefore, technologies for converting biomass to fuels that are not in pilot demonstration as of 2010 would need “fast-track” development to make any significant contribution to meeting RFS2.
The U.S. Congress has mandated that 36 billion gallons per year of biofuels in four categories—renewable fuels, advanced biofuels, cellulosic biofuels, and biomass-based diesel18—be consumed by U.S. transportation by 2022. The capacity of existing corn-grain ethanol facilities was estimated to be 14.1 billion gallons per year as of January 2011 and predicted to reach almost 15 billion gallons per year by 2012, essentially ensuring that production capacity is available to meet the legislated mandate for conventional biofuel. Similarly, existing biodiesel facilities are expected to meet that target for biomass-based diesel in the next several years. In contrast, whether and how the mandates for advanced biofuels and cellulosic biofuels will be met is uncertain.
At the time this report was written, the technologies for producing advanced and cellulosic biofuels were being developed and demonstrated at pilot scale. Many potential feedstocks, including crop residues, dedicated bioenergy crops, forest residues, and MSW, have been proposed. In the near term, crop and forest residues might be the most likely feedstocks because those resources are available and only investments in harvesting, storage, and transport are needed for delivery to biorefineries. Although MSW is available in large quantities, recovery rate of biological fraction is low. Many species of herbaceous perennial grasses and short-rotation woody crops have been suggested as potential dedicated bioenergy crops, and appropriate species would have to be selected on the basis of agronomic conditions to minimize the need for inputs (for example, irrigation and fertilizers) and maximize yield.
At the time this report was written, no proven commercial-scale technologies were available for converting lignocellulosic biomass to fuels. Another report estimated that the 16 billion gallons of ethanol-equivalent cellulosic biofuels could be produced by 2022 under an aggressive deployment scenario in which the capacity build rate doubles the historic capacity build rate of corn-grain ethanol (NAS-NAE-NRC, 2009). That scenario assumes that biorefineries with a collective capacity of 1 billion gallons per year will be available by 2015. The industry will expand at an average build rate of 50 percent per year over 6 years. At the maximum build rate, 2-4 billion gallons of cellulosic biofuels will be added each year to achieve 16 billion gallons of ethanol-equivalent cellulosic biofuels by 2022. Successful commercial-scale demonstration in the next few years and aggressive deployment thereafter will be key determinants of whether RFS2 could be met. The success of demonstration and the rate of deployment depend on many other factors, including research and development to improve the economics of biomass and biofuel production and to resolve issues that arise during demonstration, economic conditions, and investors’ confidence.
______________
18 See section on “Renewable Fuel Standard” in Chapter 1 for definition of each category.
Adler, P.R., M.A. Sanderson, P.J. Weimer, and K.P. Vogel. 2009. Plant species composition and biofuel yields of conservation grasslands. Ecological Applications 19(8):2202-2209.
Alvira, P., E. Tomas-Pejo, M. Ballesteros, and M.J. Negro. 2010. Pretreatment technologies for an efficient bioethanol production process based on enzymatic hydrolysis: A review. Bioresource Technology 101(13):4851-4861.
Anderson, W., M. Casler, and B. Baldwin. 2008. Improvement of perennial forage species as feedstock for bioenergy. Pp. 309-345 in Genetic Improvement of Bioenergy Crops, W. Vermerris, ed. New York: Springer.
Andrews, S. 2006. Crop Residue Removal for Biomass Energy Production: Effects on Soils and Recommendations. Washington, DC: U.S. Department of Agriculture - Natural Resources Conservation Service.
ANL (Argonne National Laboratory). 2010. Sustainable Bioenergy Crop Production Research Facility. Available online at http://www.bio.anl.gov/environmental_biology/terrestrial_ecology/bioenergy.html. Accessed February 7, 2011.
Aristidou, A., and M. Penttila. 2000. Metabolic engineering applications to renewable resource utilization. Current Opinion in Biotechnology 11(2):187-198.
Bain, R.L. 2007. World Biofuels Assessment. Worldwide Biomass Potential: Technology Characterizations. Golden, CO: National Renewable Energy Laboratory.
Balat, M. 2008. Mechanisms of thermochemical biomass conversion processes. Part 3: Reactions of liquefaction. Energy Sources Part A–Recovery Utilization and Environmental Effects 30(7):649-659.
Balat, M., M. Balat, E. Kirtay, and H. Balat. 2009. Main routes for the thermo-conversion of biomass into fuels and chemicals. Part 2: Gasification systems. Energy Conversion and Management 50(12):3158-3168.
Beach, R.H., and B.A. McCarl. 2010. U.S. Agricultural and Forestry Impacts of the Energy Independence and Security Act: FASOM Results and Model Description. Final Report. Research Triangle Park, NC: RTI International.
Beale, C.V., and S.P. Long. 1995. Can perennial C4 grasses attain high efficiencies of radiant energy-conversion in cool climates. Plant, Cell & Environment 18:641-650.
Biofuels Digest. 2010a. Advanced biofuels tracking database release 1.3. Available online at http://www.ascension-publishing.com/BIZ/ABTD13.xls. Accessed August 3, 2010.
Biofuels Digest. 2010b. Industry Data. Available online at http://biofuelsdigest.com/bdigest/free-industry-data/. Accessed November 12, 2010.
Blanco-Canqui, H., and R. Lal. 2009a. Corn stover removal for expanded uses reduced soil fertility and structural stability. Soil Science Society of America Journal 73:418-426.
Blanco-Canqui, H., and R. Lal. 2009b. Crop residue removal impacts on soil productivity and environmental quality. Critical Review in Plant Sciences 28:139-163.
Bongarten, B.C., D.A. Huber, and D.K. Apsley. 1992. Environmental and genetic influences on short-rotation biomass production of black locust (Robinia pseudoacacia L.) in the Georgia Piedmont. Forest Ecology and Management 55(1-4):315-331.
Bransby, D.I., D.J. Allen, N. Gutterson, G. Ikonen, E. Richard, W. Rooney, and E. van Santen. 2010. Engineering advantages, challenges and status of grass energy crops. Biotechnology in Agriculture and Forestry 66(2):125-154.
Brechbill, S.C., and W.E. Tyner. 2008. The Economics of Biomass Collection, Transportation, and Supply to Indiana Cellulosic and Electrical Utility Facilities. West Lafayette, IN: Purdue University.
Carolan, J.E., S.V. Joshi, and B.E. Dale. 2007. Technical and financial feasibility analysis of distributed bioprocessing using regional biomass pre-processing centers. Journal of Agricultural & Food Industrial Organization 5:Article 10.
Cassman, K.G., and A.J. Liska. 2007. Food and fuel for all: Realistic or foolish? Biofuels Bioproducts and Biorefining 1(1):18-23.
CETC (Canmet Energy Technology Centre). 2008. SUPERCETANETM Technology at CanmetENERGY. Ottawa: Natural Resources Canada - Canmet Energy Technology Centre.
Chandra, R.P., R. Bura, W.E. Mabee, A. Berlin, X. Pan, and J.N. Saddler. 2007. Substrate pretreatment: The key to effective enzymatic hydrolysis of lignocellulosics? Advances in Biochemical Engineering/Biotechnology 108:67-93.
Christian, D.G., A.B. Riche, and N.E. Yates. 2002. The yield and composition of switchgrass and coastal panic grass grown as a biofuel in southern England. Bioresource Technology 83(2):115-124.
Clay, D., G. Carlson, T. Schumacher, V. Owens, and F. Mamani-Pati. 2010. Biomass estimation approach impacts on calculated soil organic carbon maintenance requirements and associated mineralization rate constants. Journal of Environmental Quality 39(3):784-790.
Clifton-Brown, J.C., J. Breuer, and M.B. Jones. 2007. Carbon mitigation by the energy crop, Miscanthus. Global Change Biology 13(11):2296-2307.
Coyle, D.R., M.D. Coleman, and D.P. Aubrey. 2008. Above- and below-ground biomass accumulation, production, and distribution of sweetgum and loblolly pine grown with irrigation and fertilization. Canadian Journal of Forest Research-Revue Canadienne De Recherche Forestiere 38(6):1335-1348.
Davis, A.A., and C.C. Trettin. 2006. Sycamore and sweetgum plantation productivity on former agricultural land in South Carolina. Biomass & Bioenergy 30(8-9):769-777.
Davis, S.C., W.J. Parton, F.G. Dohleman, C.M. Smith, S. Del Grosso, A.D. Kent, and E.H. DeLucia. 2010. Comparative biogeochemical cycles of bioenergy crops reveal nitrogen-fixation and low greenhouse gas emissions in a Miscanthus x giganteus agro-ecosystem. Ecosystems 13(1):144-156.
De Haan, L.R., S. Weisberg, D. Tilman, and D. Fornara. 2010. Agricultural and biofuel implications of a species diversity experiment with native perennial grassland plants. Agriculture, Ecosystems & Environment 1-2(137):33-38.
de Vries, S.C., G.W.J. van de Ven, M.K. van Ittersum, and K.E. Giller. 2010. Resource use efficiency and environmental performance of nine major biofuel crops, processed by first-generation conversion techniques. Biomass & Bioenergy 34(5):588-601.
Demirbas, A. 2000. Mechanisms of liquefaction and pyrolysis reactions of biomass. Energy Conversion and Management 41(6):633-646.
Demirbas, A. 2009. Pyrolysis mechanisms of biomass materials. Energy Sources Part A-Recovery Utilization and Environmental Effects 31(13):1186-1193.
DOE-EERE (U.S. Department of Energy - Energy Efficiency and Renewable Energy). 2010. Alternative and advanced fuels: Biodiesel. Available online at http://www.afdc.energy.gov/afdc/fuels/biodiesel.html. Accessed August 5, 2010.
Eggeman, T., and R.T. Elander. 2005. Process and economic analysis of pretreatment technologies. Bioresource Technology 96(18):2019-2025.
EIA (Energy Information Administration). 2010. Annual Energy Review 2009. Washington, DC: U.S. Department of Energy.
El-Nashaar, H.M., S.M. Griffith, J.J. Steiner, and G.M. Banowetz. 2009. Mineral concentration in selected native temperate grasses with potential use as biofuel feedstock. Bioresource Technology 100(14):3526-3531.
El Bassam, N. 1996. Renewable Energy: Potential Energy Crops for Europe and the Mediterranean Region. Rome: Food and Agricultural Organization.
El Bassam, N. 2010. Handbook of Bioenergy Crops: A Complete Reference to Species, Development and Applications. London: Earthscan.
Elliott, D.C., D. Beckman, A.V. Bridgwater, J.P. Diebold, S.B. Gevert, and Y. Solantausta. 1991. Developments in direct thermochemical liquefaction of biomass: 1983-1990. Energy & Fuels 5(3):399-410.
EMO (Emerging Markets Online). 2009. Algae 2020: Biofuels Markets and Commercialization Outlook. Houston, TX: Emerging Markets Online.
Energy Biosciences Institute. 2011. Developing prairie cordgrass as a cellulosic bioenergy crop. Available online at http://www.energybiosciencesinstitute.org/index.php?option=com_content&task=view&id=312. Accessed February 7, 2011.
EPA (U.S. Environmental Protection Agency). 2010a. Municipal Solid Wastes in the United States. 2009 Facts and Figures. Washington, DC: U.S. Environmental Protection Agency.
EPA (U.S. Environmental Protection Agency). 2010b. Renewable Fuel Standard Program (RFS2) Regulatory Impact Analysis. Washington, DC: U.S. Environmental Protection Agency.
EPA (U.S. Environmental Protection Agency). 2011. EPA grants E15 fuel waiver for model years 2001-2006 cars and light trucks/Agency continues review of public comments for an E15 pump label to help ensure consumers use the correct fuel. Available online at http://yosemite.epa.gov/opa/admpress.nsf/0/8206AB91F87CEC088525781F0059E65C. Accessed February 9, 2011.
Ezeji, T.C., N. Qureshi, and H.P. Blaschek. 2007. Bioproduction of butanol from biomass: From genes to bioreactors. Current Opinion in Biotechnology 18(3):220-227.
Fargione, J.E., T.R. Cooper, D.J. Flaspohler, J. Hill, C. Lehman, T. McCoy, S. McLeod, E.J. Nelson, K.S. Oberhauser, and D. Tilman. 2009. Bioenergy and wildlife: Threats and opportunities for grassland conservation. BioScience 59(9):767-777.
Fleischmann, R.D., M.D. Adams, O. White, R.A. Clayton, E.F. Kirkness, A.R. Kerlavage, C.J. Bult, J.F. Tomb, B.A. Dougherty, J.M. Merrick, K. McKenney, G. Sutton, W. Fitzhugh, C. Fields, J.D. Gocayne, J. Scott, R. Shirley, L.I. Liu, A. Glodek, J.M. Kelley, J.F. Weidman, C.A. Phillips, T. Spriggs, E. Hedblom, M.D. Cotton, T.R. Utterback, M.C. Hanna, D.T. Nguyen, D.M. Saudek, R.C. Brandon, L.D. Fine, J.L. Fritchman, J.L. Fuhrmann, N.S.M. Geoghagen, C.L. Gnehm, L.A. McDonald, K.V. Small, C.M. Fraser, H.O. Smith, and J.C. Venter. 1995. Whole-genome random sequencing and assembly of Haemophilus influenzae Rd. Science 269(5223):496-512.
Foust, T., A. Aden, A. Dutta, and S. Phillips. 2009. An economic and environmental comparison of a biochemical and a thermochemical lignocellulosic ethanol conversion processes. Cellulose 16(4):547-565.
Fraley, R. 2010. Crop yield gains: Understanding the past, envisioning the future. Presentation to the Committee on Economic and Environmental Impacts of Increasing Biofuels Production, July 14.
Geyer, W.A. 2006. Biomass production in the Central Great Plains USA under various coppice regimes. Biomass & Bioenergy 30(8-9):778-783.
Gonzalez-Hernandez, J.L., G. Sarath, J.M. Stein, V. Owens, K. Gedye, and A. Boe. 2009. A multiple species approach to biomass production from native herbaceous perennial feedstocks. In Vitro Cellular & Developmental Biology-Plant 45(3):267-281.
Graham, R.L., R. Nelson, J. Sheehan, R.D. Perlack, and L.L. Wright. 2007. Current and potential US corn stover supplies. Agronomy Journal 99(1):1-11.
Gürbüz, E.I., E.L. Kunkes, and J.A. Dumesic. 2010. Dual-bed catalyst system for C-C coupling of biomass-derived oxygenated hydrocarbons to fuel-grade compounds. Green Chemistry 12(2):223-227.
Heaton, E.A., F.G. Dohleman, and S.P. Long. 2008. Meeting US biofuel goals with less land: The potential of Miscanthus. Global Change Biology 14(9):2000-2014.
Heaton, E.A., F.G. Dohleman, and S.P. Long. 2009. Seasonal nitrogen dynamics of Miscanthus x giganteus and Panicum virgatum. Global Change Biology Bioenergy 1(4):297-307.
Heaton, E.A., F.G. Dohleman, and A.F. Miguez. 2010. Miscanthus. A promising biomass crop. Advances in Botanical Research 56:75-137.
Heilman, P.E., and R.F. Stettler. 1985. Genetic variation and productivity of Populus trichocarpa and its hybrids. II. Biomass production in a 4-year plantation. Canadian Journal of Forest Research 15(2):384-388.
Henson, J.F., and G.A. Fenchel. 2007. Plant Guide: Eastern Gamagrass. Baton Rouge, LA: U.S. Department of Agriculture - Natural Resources Conservation Service - National Plant Materials Center.
Hess, J.R., C.T. Wright, and K.L. Kenney. 2007. Cellulosic biomass feedstocks and logistics for ethanol production. Biofuels Bioproducts & Biorefining 1(3):181-190.
Hinchee, M., W. Rottmann, L. Mullinax, C.S. Zhang, S.J. Chang, M. Cunningham, L. Pearson, and N. Nehra. 2009. Short-rotation woody crops for bioenergy and biofuels applications. In Vitro Cellular & Developmental Biology-Plant 45(6):619-629.
Huber, G.W., J.N. Chheda, C.J. Barrett, and J.A. Dumesic. 2005. Production of liquid alkanes by aqueous-phase processing of biomass-derived carbohydrates. Science 308(5727):1446-1450.
Huber, G.W., S. Iborra, and A. Corma. 2006. Synthesis of transportation fuels from biomass: Chemistry, catalysts, and engineering. Chemical Reviews 106(9):4044-4098.
Iogen. 2010a. Demo plant fuel production. Available online at http://www.iogen.ca/. Accessed February 16, 2011.
Iogen. 2010b. Iogen’s cellulosic ethanol demonstration plant. Available online at http://www.iogen.ca/company/demo_plant/index.html. Accessed October 19, 2010.
Jager, H., L.M. Baskaran, C.C. Brandt, E.B. Davis, C.A. Gunderson, and S.D. Wullschleger. 2010. Empirical geographic modeling of switchgrass yields in the United States. Global Change Biology Bioenergy 2(5):248-257.
Jarchow, M.E. and M. Liebman. 2011. Incorporating Prairies into Multifunctional Landscapes Establishing and Managing Prairies for Enhanced Environmental Quality, Livestock Grazing and Hay Production, Bioenergy Production, and Carbon Sequestration. Ames: Iowa State University.
Johnson, J.M.-F., M.D. Coleman, R. Gesch, A. Jaradat, R. Mitchell, D. Reicosky, and W.W. Wilhelm. 2007. Biomass-bioenergy crops in the United States: A changing paradigm. The American Journal of Plant Science and Biotechnology 1(1):1-28.
Johnson, J.M.F., R.R. Allmaras, and D.C. Reicosky. 2006. Estimating source carbon from crop residues, roots and rhizodeposits using the national grain-yield database. Agronomy Journal 98(3):622-636.
Johnston, M., J.A. Foley, T. Holloway, C. Kucharik, and C. Monfreda. 2009. Resetting global expectations from agricultural biofuels. Environmental Research Letters 4(1) doi:10.1088/1748-9326/4/1/014004.
Jokela, E.J., P.M. Dougherty, and T.A. Martin. 2004. Production dynamics of intensively managed loblolly pine stands in the southern United States: A synthesis of seven long-term experiments. Forest Ecology and Management 192(1):117-130.
Jordan, N., G. Boody, W. Broussard, J.D. Glover, D. Keeney, B.H. McCown, G. McIsaac, M. Muller, H. Murray, J. Neal, C. Pansing, R.E. Turner, K. Warner, and D. Wyse. 2007. Environment—Sustainable development of the agricultural bio-economy. Science 316(5831):1570-1571.
Jung, G.A., J.A. Shaffer, and W.L. Stout. 1988. Switchgrass and big bluestem responses to amendments on strongly acid soil. Agronomy Journal 80(4):669-676.
Kalnes, T.N., K.P. Koers, T. Marker, and D.R. Shonnard. 2009. A technoeconomic and environmental life cycle comparison of green diesel to biodiesel and syndiesel. Environmental Progress & Sustainable Energy 28(1):111-120.
Karlen, D.L., N.C. Wollenhaupt, D.C. Erbach, E.C. Berry, J.B. Swan, N.S. Eash, and J.L. Jordahl. 1994. Crop residue effects on soil quality following 10-years of no-till corn. Soil & Tillage Research 31(2-3):149-167.
Katzer, J.R. 2010. Sustainable research, development, and demonstration (RD&D). Industrial & Engineering Chemistry Research 49(21):10154-10158.
King, J.E., J.M. Hannifan, and R. Nelson. 1998. An Assessment of the Feasibility of Electric Power Derived from Biomass and Waste Feedstocks. Topeka: Kansas Corporation Commission.
Kline, K.L., and M.D. Coleman. 2010. Woody energy crops in the southeastern United States: Two centuries of practitioner experience. Biomass & Bioenergy 34(12):1655-1666.
Knothe, G. 2001. Historical perspectives on vegetable oil-based diesel fuels. Inform 12(November):1103-1107.
Kunkes, E.L., D.A. Simonetti, R.M. West, J.C. Serrano-Ruiz, C.A. Gartner, and J.A. Dumesic. 2008. Catalytic conversion of biomass to monofunctional hydrocarbons and targeted liquid-fuel classes. Science 322(5900):417-421.
Lady Bird Johnson Wildflower Center. 2011. Native plant database. Available online at http://www.wildflower.org/plants/. Accessed February 7, 2011.
Larson, J.A., D.F. Mooney, B.C. English, and D.D. Tyler. 2010. Cost analysis of alternative harvest and storage methods for switchgrass in the southeastern U.S. Paper read at the 2010 Annual Meeting of Southern Agricultural Economics Association, February 6-9, Orlando, FL.
Lobell, D.B., K.G. Cassman, and C.B. Field. 2009. Crop yield gaps: Their importance, magnitudes, and causes. Annual Review of Environment and Resources 34:179-204.
Mayton, H., J. Hansen, J. Neally, and D. Viands. 2011. Accelerated evaluation of perennial grass and legume feedstocks for biofuel production in New York state. Available online at http://nesungrant.cornell.edu/cals/sungrant/difference/upload/Cornell-Biofuels-Crop-Development.pdf. Accessed February 7, 2011.
McCready, N.S., and R.C. Williams. 2008. Utilization of biofuel coproducts as performance enhancers in asphalt binder. Transportation Research Record (2051):8-14.
McIsaac, G.F., M.B. David, and C.A. Mitchell. 2010. Miscanthus and switchgrass production in Central Illinois: Impacts on hydrology and inorganic nitrogen leaching. Journal of Environmental Quality 39(5):1790-1799.
Melis, S. 2008. Albemarle catalytic solutions for the co-processing of vegetable oil in conventional hydrotreaters. Catalysts Courrier 73:6-9.
Mercker, D. 2007. Short rotation woody crops for biofuels. Knoxville: University of Tennessee Agricultural Experiment Station.
Miguez, F.E., M.B. Villamil, S.P. Long, and G.A. Bollero. 2008. Meta-analysis of the effects of management factors on Miscanthus x giganteus growth and biomass production. Agricultural and Forest Meteorology 148(8-9):1280-1292.
Miguez, F.E., X.G. Zhu, S. Humphries, G.A. Bollero, and S.P. Long. 2009. A semimechanistic model predicting the growth and production of the bioenergy crop Miscanthus × giganteus: Description, parameterization and validation. Global Change Biology Bioenergy 1(4):282-296.
Milbrandt, A. 2005. A Geographic Perspective on the Current Biomass Resource Availability in the United States. Golden, CO: National Renewable Energy Laboratory.
Miranowski, J., and A. Rosburg. 2010. An Economic Breakeven Model of Cellulosic Feedstock Production and Ethanol Conversion with Implied Carbon Pricing. Ames: Iowa State University.
Mosier, N., C. Wyman, B. Dale, R. Elander, Y.Y. Lee, M. Holtzapple, and M. Ladisch. 2005. Features of promising technologies for pretreatment of lignocellulosic biomass. Bioresource Technology 96(6):673-686.
Mueller, S. 2010. 2008 National dry mill corn ethanol survey. Biotechnology Letters 32(9):1261-1264.
Muir, J.P., M.A. Sanderson, W.R. Ocumpaugh, R.M. Jones, and R.L. Reed. 2001. Biomass production of “Alamo” switchgrass in response to nitrogen, phosphorus, and row spacing. Agronomy Journal 93(4):896-901.
NAS-NAE-NRC (National Academy of Sciences, National Academy of Engineering, National Research Council). 2009. Liquid Transportation Fuels from Coal and Biomass: Technological Status, Costs, and Environmental Impacts. Washington, DC: National Academies Press.
NBB (National Biodiesel Board). 2010. NBB member plant locations. Available online at http://www.biodiesel.org/buyingbiodiesel/plants/default.aspx?AspxAutoDetectCookieSupport=1. Accessed November 9, 2011.
NCGA (National Corn Growers Association). 2010. National Corn Growers Association: Strategic Plan. Chesterfield, MO: National Corn Growers Association.
Nelson, R., M. Langemeier, J. Williams, C. Rice, S. Staggenborg, P. Pfomm, D. Rodgers, D. Wang, and J. Nippert. 2010. Kansas Biomass Resource Assessment: Assessment and Supply of Select Biomass-based Resources. Manhattan: Kansas State University.
Neste Oil. 2011a. Neste Oil starts up its new renewable diesel plant in Singapore. Available online at http://nesteoil.com/default.asp?path=1;41;540;1259;1261;13291;16384. Accessed January 10, 2011.
Neste Oil. 2011b. NExBTL diesel. Available online at http://www.nesteoil.com/default.asp?path=1,41,535,547,3716,3884. Accessed January 10, 2011.
Nevoigt, E. 2008. Progress in metabolic engineering of Saccharomyces cerevisiae. Microbiology and Molecular Biology Reviews 72(3):379-412.
Nichols, N.N., B.S. Dien, R.J. Bothast, and M.A. Cotta. 2006. The corn ethanol industry. Pp. 59-77 in Alcholic Fuels, S. Minteer, ed. Boca Raton, FL: CRC Press.
NREL (National Renewable Energy Laboratory). 2005. Biodiesel Blends. Golden, CO: National Renewable Energy Laboratory.
NREL (National Renewable Energy Laboratory). 2008. United States Biodiesel Production Facilities. Map Illustration. Golden, CO: National Renewable Energy Laboratory.
Oliva, J.M., F. Saez, I. Ballesteros, A. Gonzalez, M.J. Negro, P. Manzanares, and M. Ballesteros. 2003. Effect of lignocellulosic degradation compounds from steam explosion pretreatment on ethanol fermentation by thermotolerant yeast Kluyveromyces marxianus. Applied Biochemistry and Biotechnology 105:141-153.
Owsley, C.M. 2002. Review of Big Bluestem. Washington, DC: U.S. Department of Agriculture - Natural Resources Conservation Service.
Parrish, D.J., and J.H. Fike. 2005. The biology and agronomy of switchgrass for biofuels. Critical Reviews in Plant Sciences 24(5-6):423-459.
Patzek, T.W. 2006. A statistical analysis of the theoretical yield of ethanol from corn starch. Natural Resources Research 15(3):205-212.
Perlack, R.D., L.L. Wright, A.F. Turhollow, R.L. Graham, B.J. Stokes, and D.C. Erbach. 2005. Biomass as Feedstock for a Bioenergy and Bioproducts Industry: The Technical Feasibility of a Billion-Ton Annual Supply. Oak Ridge, TN: U.S. Department of Energy, U.S. Department of Agriculture.
Perry, C.H., M.D. Nelson, J.C. Toney, T.S. Frescino, and M.L. Hoppus. 2007. Mapping forest resources of the United States. In Forest Resources of the United States, 2007, W.B. Smith, P.D. Miles, C.H. Perry, and S.A. Pugh, eds. Washington, DC: U.S. Department of Agriculture - Forest Service.
Petrolia, D.R. 2006. The Economics of Harvesting and Transporting Corn Stover for Conversion to Fuel Ethanol: A Case Study for Minnesota. St. Paul: University of Minnesota.
Pootakham, T., and A. Kumar. 2010. A comparison of pipeline versus truck transport of bio-oil. Bioresource Technology 101(1):414-421.
Prine, G.M., D.L. Rockwood, and J.A. Stricker. 2000. Many short rotation trees and herbaceous plants available as energy crops in humid lower south. Proceedings of the Bioenergy 2000, Northeast Regional Bioenergy Program.
Pyter, R., E. Heaton, F. Dohleman, T. Voigt, and S. Long. 2009. Agronomic Experiences with Miscanthus x giganteus in Illinois, USA. Biofuels: Methods and Protocols:41-52.
Reijnders, L. 2009. Microalgal and terrestrial transport biofuels to displace fossil fuels. Energies 2(1):48-56.
Renewable Diesel Subcommittee of the WSDA Technical Work Group. 2007. Renewable Diesel Technology. Olympia: Washington State Department of Agriculture.
RFA (Renewable Fuels Association). 2002. Growing Homeland Energy Security. 2002 Ethanol Industry Outlook. Washington, DC: Renewable Fuels Association.
RFA (Renewable Fuels Association). 2003. Building a Secure Energy Future. 2003 Ethanol Industry Outlook. Washington, DC: Renewable Fuels Association.
RFA (Renewable Fuels Association). 2004. Synergy in Energy. 2004 Ethanol Industry Outlook. Washington, DC: Renewable Fuels Association.
RFA (Renewable Fuels Association). 2005. Home Grown for the Homeland. 2005 Ethanol Industry Outlook. Washington, DC: Renewable Fuels Association.
RFA (Renewable Fuels Association). 2006. From Niche to Nation. 2006 Ethanol Industry Outlook. Washington, DC: Renewable Fuels Association.
RFA (Renewable Fuels Association). 2007. Building New Horizons. 2007 Ethanol Industry Outlook. Washington, DC: Renewable Fuels Association.
RFA (Renewable Fuels Association). 2008. Changing the Climate. 2008 Ethanol Industry Outlook. Washington, DC: Renewable Fuels Association.
RFA (Renewable Fuels Association). 2009. Growing Innovation. America’s Energy Future Starts at Home. 2009 Ethanol Industry Outlook. Washington, DC: Renewable Fuels Association.
RFA (Renewable Fuels Association). 2010. Climate of Opportunity. 2010 Ethanol Industry Outlook. Washington, DC: Renewable Fuels Association.
RFA (Renewable Fuels Association). 2011a. Building Bridges to a More Sustainable Future. 2011 Ethanol Industry Outlook. Washington, DC: Renewable Fuels Association.
RFA (Renewable Fuels Association). 2011b. Statistics. Available online at http://www.ethanolrfa.org/pages/statistics. Accessed April 27, 2011.
Riemenschneider, D.E., W.E. Berguson, D.I. Dickmann, R.B. Hall, J.G. Isebrands, C.A. Mohn, G.R. Stanosz, and G.A. Tuskan. 2001. Poplar breeding and testing strategies in the north-central U.S.: Demonstration of potential yield and consideration of future research needs. The Forestry Chronicle 77(2):245-253.
Rinehart, L. 2006. Switchgrass as a Bioenergy Crop. Butte, MT: National Center for Appropriate Technology.
Roberts, K.G., B.A. Gloy, S. Joseph, N.R. Scott, and J. Lehmann. 2010. Life cycle assessment of biochar systems: Estimating the energetic, economic, and climate change potential. Environmental Science & Technology 44(2):827-833.
Roman-Leshkov, Y., C.J. Barrett, Z.Y. Liu, and J.A. Dumesic. 2007. Production of dimethylfuran for liquid fuels from biomass-derived carbohydrates. Nature 447(7147):982-985.
Ruark, G., S. Josiah, D. Riemenschneider, and T. Volk. 2006. Perennial crops for bio-fuels and conservation. Paper read at the USDA Agricultural Outlook Forum—Prospering in Rural America, February 1-17, Arlington, VA.
Sadaka, S., and S. Negi. 2009. Improvements of biomass physical and thermochemical characteristics via torrefaction process. Environmental Progress & Sustainable Energy 28(3):427-434.
Sagar, A.D., and B. van der Zwaan. 2006. Technological innovation in the energy sector: R&D, deployment, and learning-by-doing. Energy Policy 34(17):2601-2608.
Salon, P.R., T. Horvath, M. van der Grinten, and H. Mayton. 2010. Yield and time of harvest of tall wheatgrass for biomass energy in New York. Paper read at the 2009 American Society of Agronomy/Crop Science Society of America/Soil Science Society of America Annual Meetings, November 1-5, Pittsburgh, PA.
Sanderson, M.A., R.H. Skinner, D.J. Barker, G.R. Edwards, B.F. Tracy, and D.A. Wedin. 2004. Plant species diversity and management of temperate forage and grazing land ecosystems. Crop Science 44(4):1132-1144.
Schnepf, R. 2010. Cellulosic Ethanol: Feedstocks, Conversion Technologies, Economics, and Policy Options. Washington, DC: Congressional Research Service.
Schwietzke, S., M. Ladisch, L. Russo, K. Kwant, T. Mäkinen, B. Kavalov, K. Maniatis, R. Zwart, G. Shahanan, K. Sipila, P. Grabowski, B. Telenius, M. White, and A. Brown. 2008. Gaps in the research of 2nd generation transportation biofuels. IEA Bioenergy T41(2):2008:01.
Sendich, E., M. Laser, S. Kim, H. Alizadeh, L. Laureano-Perez, B. Dale, and L. Lynd. 2008. Recent process improvements for the ammonia fiber expansion (AFEX) process and resulting reductions in minimum ethanol selling price. Bioresource Technology 99(17):8429-8435.
Smith, W.B., P.D. Miles, C.H. Perry, and S.A. Pugh. 2009. Forest Resources of the United States, 2007. Washington, DC: U.S. Department of Agriculture - Forest Service.
Snell, K.D., and O.P. Peoples. 2009. PHA bioplastic: A value-added coproduct for biomass biorefineries. Biofuels Bioproducts and Biorefining 3(4):456-467.
Sohngen, B., and S. Brown. 2006. The influence of conversion of forest types on carbon sequestration and other ecosystem services in the South Central United States. Ecological Economics 57(4):698-708.
Somerville, C., H. Youngs, C. Taylor, S.C. Davis, and S.P. Long. 2010. Feedstocks for lignocellulosic biofuels. Science 329(5993):790-792.
Sonderegger, M., M. Jeppsson, C. Larsson, M.F. Gorwa-Grauslund, E. Boles, L. Olsson, I. Spencer-Martins, B. Hahn-Hagerdal, and U. Sauer. 2004. Fermentation performance of engineered and evolved xylose-fermenting Saccharomyces cerevisiae strains. Biotechnology and Bioengineering 87(1):90-98.
Soria, A.J., A.G. McDonald, and B.B. He. 2008. Wood solubilization and depolymerization by supercritical methanol. Part 2: Analysis of methanol soluble compounds. Holzforschung 62(4):409-416.
Spath, P.L., and D.C. Dayton. 2003. Preliminary Screening—Technical and Economic Assessment of Synthesis Gas to Fuels and Chemicals with Emphasis on the Potential for Biomass-Derived Syngas. Golden, CO: National Renewable Energy Laboratory.
Steinbeck, K. 1999. Thirty years of short-rotation hardwoods research. Pp. 63-65 in Proceedings of the Tenth Biennial Southern Silvicultural Research Conference, J.D. Haywood, ed. Asheville, NC.
Stewart, J.R., Y. Toma, F.G. Fernandez, A. Nishiwaki, T. Yamada, and G. Bollero. 2009. The ecology and agronomy of Miscanthus sinensis, a species important to bioenergy crop development, in its native range in Japan: A review. Global Change Biology Bioenergy 1(2):126-153.
Stricker, J.A., D.L. Rockwood, S.A. Segrest, G.R. Alker, G.M. Prine, and D.R. Carter. 2000. Short Rotation Woody Crops for Florida. Available online at http://www.treepower.org/papers/strickerny.doc. Accessed February 8, 2011.
Thomson, A.M., R.C. Izarrualde, T.O. West, D.J. Parrish, D.D. Tyler, and J.R. Williams. 2009. Simulating Potential Switchgrass Production in the United States. Richland, WA: Pacific Northwest National Laboratory.
Tilman, D., J. Hill, and C. Lehman. 2006. Carbon-negative biofuels from low-input high-diversity grassland biomass. Science 314(5805):1598-1600.
Tober, D., W. Duckwitz, and M. Knudson. 2009. Indiangrass (Sorghastrum nutans) Biomass Trials. North Dakota, South Dakota, and Minnesota. Bismarck, ND: U.S. Department of Agriculture - Natural Resources Conservation Service.
Tolan, J.S. 2004. Iogen’s demonstration process for producing ethanol from cellulosic biomass. Pp. 193-208 in Biorefineries—Industrial Processes and Products, B. Kamm, P.R. Gruber and M. Kamm, eds. Weinheim, Germany: Wiley-VCH.
Tuskan, G.A., S. DiFazio, S. Jansson, J. Bohlmann, I. Grigoriev, U. Hellsten, N. Putnam, S. Ralph, S. Rombauts, A. Salamov, J. Schein, L. Sterck, A. Aerts, R.R. Bhalerao, R.P. Bhalerao, D. Blaudez, W. Boerjan, A. Brun, A. Brunner, V. Busov, M. Campbell, J. Carlson, M. Chalot, J. Chapman, G.L. Chen, D. Cooper, P.M. Coutinho, J. Couturier, S. Covert, Q. Cronk, R. Cunningham, J. Davis, S. Degroeve, A. Dejardin, C. Depamphilis, J. Detter, B. Dirks, I. Dubchak, S. Duplessis, J. Ehlting, B. Ellis, K. Gendler, D. Goodstein, M. Gribskov, J. Grimwood, A. Groover, L. Gunter, B. Hamberger, B. Heinze, Y. Helariutta, B. Henrissat, D. Holligan, R. Holt, W. Huang, N. Islam-Faridi, S. Jones, M. Jones-Rhoades, R. Jorgensen, C. Joshi, J. Kangasjarvi, J. Karlsson, C. Kelleher, R. Kirkpatrick, M. Kirst, A. Kohler, U. Kalluri, F. Larimer, J. Leebens-Mack, J.C. Leple, P. Locascio, Y. Lou, S. Lucas, F. Martin, B. Montanini, C. Napoli, D.R. Nelson, C. Nelson, K. Nieminen, O. Nilsson, V. Pereda, G. Peter, R. Philippe, G. Pilate, A. Poliakov, J. Razumovskaya, P. Richardson, C. Rinaldi, K. Ritland, P. Rouze, D. Ryaboy, J. Schmutz, J. Schrader, B. Segerman, H. Shin, A. Siddiqui, F. Sterky, A. Terry, C.J. Tsai, E. Uberbacher, P. Unneberg, J. Vahala, K. Wall, S. Wessler, G. Yang, T. Yin, C. Douglas, M. Marra, G. Sandberg, Y. Van de Peer, and D. Rokhsar. 2006. The genome of black cottonwood, Populus trichocarpa (Torr. & Gray). Science 313(5793):1596-1604.
Urbanchuk, J. 2010. Current State of the U.S. Ethanol Industry. Washington, DC: U.S. Department of Energy.
USDA (U.S. Department of Agriculture). 2010. USDA Agricultural Projections to 2019. Washington, DC: U.S. Department of Agriculture.
USDA (U.S. Department of Agriculture). 2011. USDA Agricultural Projections to 2020. Washington, DC: U.S. Department of Agriculture.
USDA-AMS (U.S. Department of Agriculture - Agricultural Marketing Service). 2007. Ethanol Transportation Backgrounder: Expansion of U.S. Corn-Based Ethanol from the Agricultural Transportation Perspective. Washington, DC: U.S. Department of Agriculture.
USDA-ERS (U.S. Department of Agriculture - Economic Research Service). 2010. Farm program acres. Available online at http://maps.ers.usda.gov/BaseAcres/index.aspx. Accessed October 15, 2010.
USDA-NASS (U.S. Department of Agriculture - National Agricultural Statistics Service). 2010. Data and statistics: Quick stats. Available online at http://www.nass.usda.gov/Data_and_Statistics/Quick_Stats/index.asp. Accessed June 24, 2011.
USDA-NRCS (U.S. Department of Agriculture - Natural Resources Conservation Service). 2002. Plant Factsheet: Little Bluestem. Beltsville, MD: U.S. Department of Agriculture - Natural Resources Conservation Service - National Plant Materials Center.
Volk, T.A., T. Verwijst, P.J. Tharakan, L.P. Abrahamson, and E.H. White. 2004. Growing fuel: A sustainability assessment of willow biomass crops. Frontiers in Ecology and the Environment 2(8):411-418.
Volk, T.A., L.P. Abrahamson, C.A. Nowak, L.B. Smart, P.J. Tharakan, and E.H. White. 2006. The development of short-rotation willow in the northeastern United States for bioenergy and bioproducts, agroforestry and phytoremediation. Biomass & Bioenergy 30(8-9):715-727.
Walsh, M., D.G. De La Torre Uguarte, H. Shapouri, and S.P. Slinsky. 2003. Bioenergy crop production in the United States. Environmental and Resource Economics 24(3):313-333.
Weimer, P.J., and T.L. Springer. 2007. Fermentability of eastern gamagrass, big bluestem and sand bluestem grown across a wide variety of environments. Bioresource Technology 98(8):1615-1621.
Wilhelm, W.W., J.M.E. Johnson, D.L. Karlen, and D.T. Lightle. 2007. Corn stover to sustain soil organic carbon further constrains biomass supply. Agronomy Journal 99(6):1665-1667.
Wright, L., and A. Turhollow. 2010. Switchgrass selection as a “model” bioenergy crop: A history of the process. Biomass & Bioenergy 34(6):851-868.
Wullschleger, S.D., E.B. Davis, M.E. Borsuk, C.A. Gunderson, and L.R. Lynd. 2010. Biomass production in switchgrass across the United States: Database description and determinants of yield. Agronomy Journal 102(4):1158-1168.
Yan, W., T.C. Acharjee, C.J. Coronella, and V.R. Vasquez. 2009. Thermal pretreatment of lignocellulosic biomass. Environmental Progress & Sustainable Energy 28(3):435-440.
Yang, B., and C. Wyman. 2007. Pretreatment: The key to unlocking low-cost cellulosic ethanol. Biofuels Bioproducts & Biorefining 2:26-40.


